Sample Category Title
EUR/USD Starts Recovery, USD/CHF Dips Below Support
EUR/USD started a recovery wave above the 1.0830 resistance. USD/CHF is showing bearish signs below the 0.8830 resistance zone.
Important Takeaways for EUR/USD and USD/CHF Analysis Today
- The Euro gained pace after it broke the 1.0830 resistance against the US Dollar.
- There was a break above a key bearish trend line with resistance near 1.0800 on the hourly chart of EUR/USD at FXOpen.
- USD/CHF is consolidating losses below the 0.8810 resistance.
- There was a break below a contracting triangle with support near 0.8830 on the hourly chart at FXOpen.
EUR/USD Technical Analysis
On the hourly chart of EUR/USD at FXOpen, the pair started a recovery wave from the 1.0770 level. The Euro even cleared the 1.0800 barrier to move into a bullish zone against the US Dollar.
Besides, there was a break above a key bearish trend line with resistance near 1.0800. It opened the doors for a move above the 50-hour simple moving average and 1.0830. Finally, the pair tested the 1.0880 resistance.
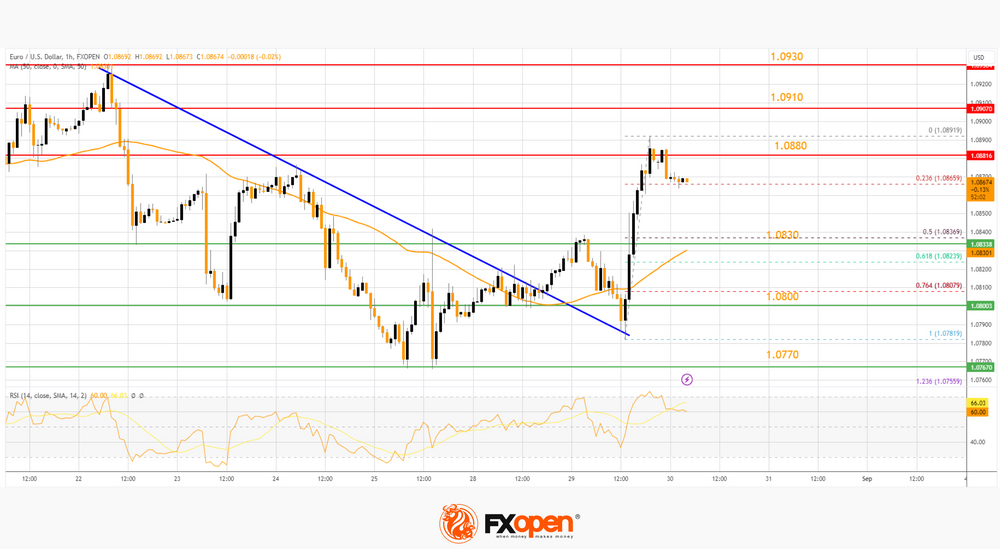
It is now consolidating gains near the 23.6% Fib retracement level of the upward wave from the 1.0781 swing low to the 1.0891 high.
Immediate support on the downside is near the 50% Fib retracement level of the upward wave from the 1.0781 swing low to the 1.0891 high at 1.0830 and the 50-hour simple moving average. The next major support is near 1.0800.
A downside break below the 1.0800 support could send the pair toward the 1.0770 level. Immediate resistance on the EUR/USD chart is near the 1.0880 zone. The first major resistance is near the 1.0910 level.
An upside break above the 1.0910 level might send the pair toward the 1.0950 resistance. The next major resistance is near the 1.1000 level. Any more gains might open the doors for a move toward the 1.1050 level.
USD/CHF Technical Analysis
On the hourly chart of USD/CHF at FXOpen, the pair started a fresh decline from the 0.8870 zone. The US Dollar gained bearish momentum from the 0.8858 level against the Swiss Franc.
During the decline, there was a break below a contracting triangle with support near 0.8830. The pair even declined below the 50-hour simple moving average and 0.8795. A low is formed near 0.8774 and the pair is now consolidating losses.
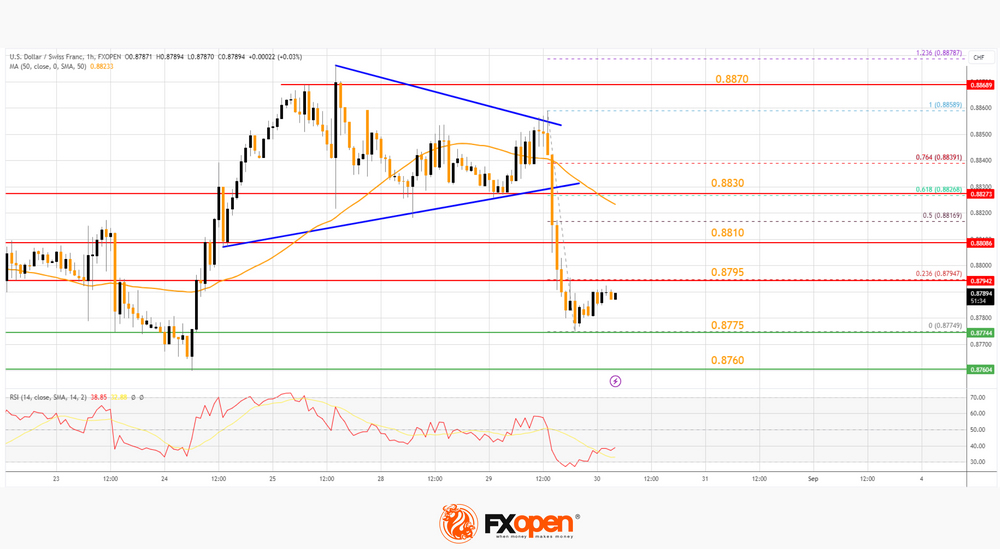
On the upside, the pair is now facing resistance near the 23.6% Fib retracement level of the downward move from the 0.8858 swing high to the 0.8774 low at 0.8795.
The next major resistance is near the 0.8810 level. The main resistance is forming near the 50-hour simple moving average and the 61.8% Fib retracement level of the downward move from the 0.8858 swing high to the 0.8774 low at 0.8830.
If there is a clear break above the 0.8830 resistance zone, the pair could start another increase. In the stated case, it could even surpass 0.8870.
On the downside, immediate support on the USD/CHF chart is near 0.8775. The first major support is near the 0.8760 level. The next major support is near the 0.8720 level. Any more losses may possibly open the doors for a move toward the 0.8650 level in the coming days.
This article represents the opinion of the Companies operating under the FXOpen brand only. It is not to be construed as an offer, solicitation, or recommendation with respect to products and services provided by the Companies operating under the FXOpen brand, nor is it to be considered financial advice.
WTI Oil: Rising Demand and Concerns About Supply Continue to Boost the Price
WTI oil price rose further and hit the highest in two weeks on Wednesday, as larger than expected draw in US crude inventories (API report) point to increased demand, while a hurricane in the Gulf of Mexico raises concerns about supply.
The oil prices were additionally supported by signals that Saudi Arabia is likely to extend its voluntary production cut, to keep oil supply tight.
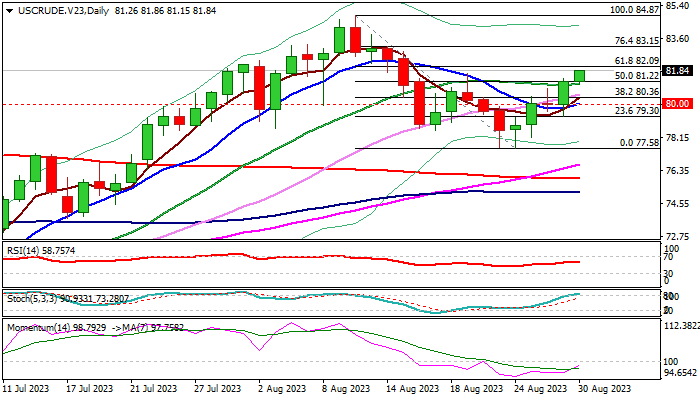
Recovery from $77.58 (Aug 24 low) has so far retraced between 50% and 61.8% of $84.87/$77.58 bear-leg, confirming a higher low at $77.58 (Aug 23/24 lows), as well as a bear-trap under $78.05 Fibo support, on daily chart.
Daily structure is improving, although 14-d momentum is still in negative territory and stochastic entered overbought zone, which may cause headwinds.
Fresh bullish signal to be expected on firm break of $82.09 (Fibo 61.8% of $84.87/$77.58) which would spark acceleration towards $83.15 (Fibo 76.4%).
Dips should hold above $81.00 zone to keep fresh bulls intact and guard lower pivots at $80.00 (psychological support) and $79.67 (weekly cloud base).
Res: 82.09; 82.89; 83.15; 83.80.
Sup: 81.13; 80.66; 80.00; 79.35.
XAU/USD: Recovery May Extend Further on Fading US Rate Hike Prospects
Gold price is holding within a narrow consolidation on Wednesday, following 0.9% acceleration on Tuesday.
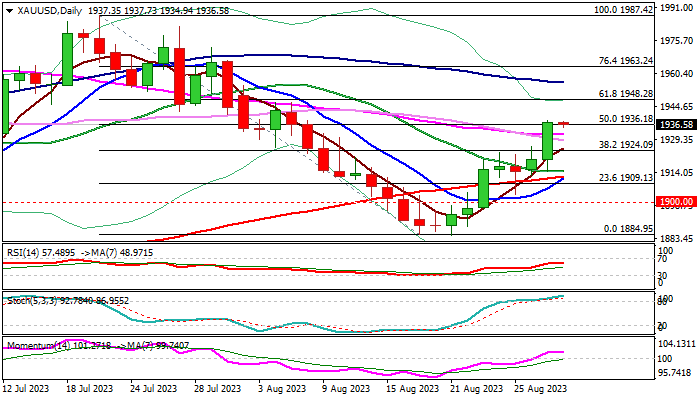
Fresh bulls extended recovery from $1884 (Aug 17/21 double-bottom) to the highest in three months, cracking important Fibo barrier at $1936 (50% retracement of $1987/$1884 bear-leg).
The recent rally was mainly driven by soft economic data which hurt bets for further US interest rate hikes, though markets await more signals from data due this week.
The yellow metal may rise further on weaker than expected labor and consumer spending data, which will signal increased negative impact from high borrowing cost to the economic growth and make the dollar less attractive to investors.
Significantly improved technical picture on daily chart (strong positive momentum / MA’s turned to bullish setup) adds to near-term bullish bias, with tomorrow’s twist of daily cloud ($1953), also attracting bulls.
Close above cracked 50% retracement level ($1936) would add to positive signals and open way for extension towards $1948/53 (Fibo 61.8% / daily cloud top).
Broken daily Kijun-sen ($1933) should ideally contain, with extended dips to find firm ground at $1924 zone (broken Fibo 38.2% / former tops) to keep fresh bulls in play.
Res: 1938; 1948; 1953; 1963.
Sup: 1933; 1924; 1912; 1909.
EUR/USD Eyes German, Eurozone CPI Reports
- Germany to release CPI on Wednesday, Eurozone on Thursday
- US consumer confidence and jobs data disappoint
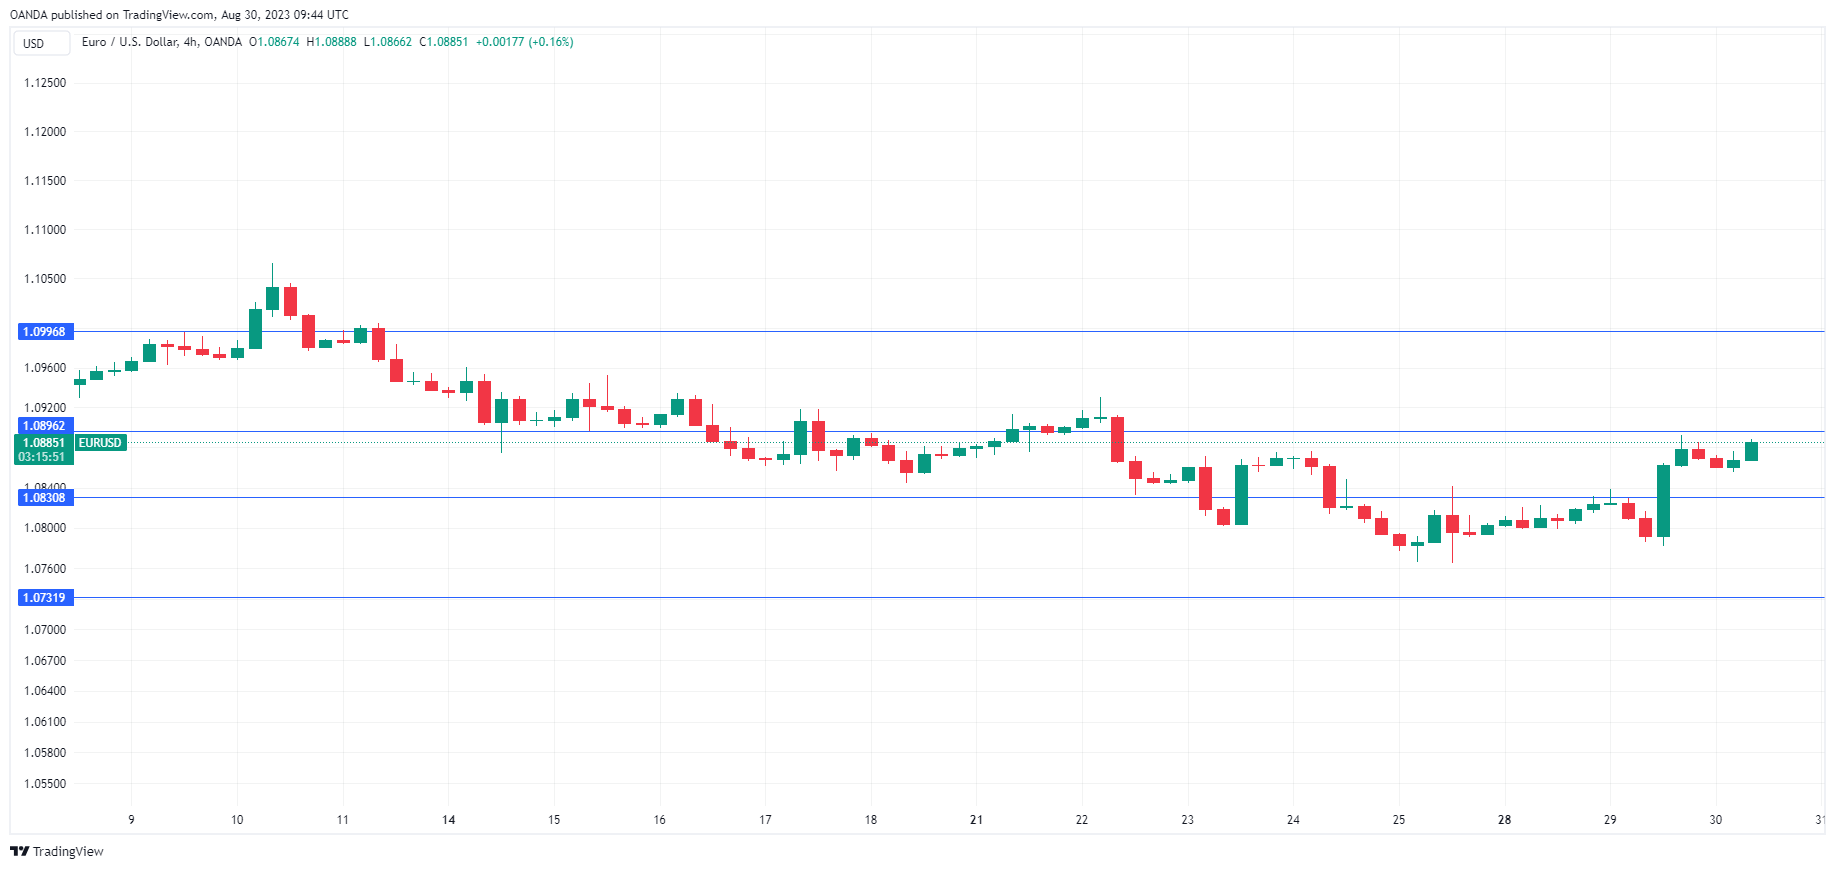
The euro’s mini-rally has run out of steam. EUR/USD climbed 0.80% over the past two days but is trading in negative territory on Wednesday. In the European session, the euro is trading at 1.0867, down 0.11%.
The markets will be keeping a close eye on European inflation releases today and Thursday. Germany releases the July CPI report later today, with a consensus estimate of 6.0%, compared to 6.2% in July. The once-formidable German juggernaut is in trouble and inflation remains high. The eurozone releases July CPI on Thursday, which is expected to drop from 5.3% to 5.1%.
The ECB meets next on September 14th and ECB President Lagarde may have signalled that another rate hike is coming. Lagarde attended the Jackson Hole summit last week and said that interest rates would remain high “as long as necessary” in order to bring inflation back to the ECB’s 2% target. Lagarde’s hawkish remarks were more hawkish than her comments at the July meeting, where she said that ECB policy makers had an “open mind” about the September decision.
There’s no arguing that eurozone inflation remains too high, but the argument against raising rates even higher is that the eurozone economy is not in great shape, and nine straight rate hikes from the ECB have cooled economic growth. Further hikes could tip the economy into a recession, which means that the ECB has its work cut out in deciding whether to raise rates again or take a pause in September.
The Federal Reserve is widely expected to hold rates at next week’s meeting, and disappointing data on Tuesday may have cemented a pause. The Conference Board Consumer Confidence Index fell sharply to 106.1 in July, compared to 116.0 in August, marking a two-year low. As well, JOLTS Jobs Openings slowed to 8.82 million in July, down from 9.16 million in June and well off the estimate of 9.46 million. This was the sixth decline in the past seven months, a sign that the resilient US labour market is showing cracks.
EUR/USD Technical
- EUR/USD is putting strong pressure on resistance at 1.0896. The next resistance line is 1.0996
- 1.0831 and 1.0731 are providing support
Bitcoin: The Battle for the Long-Term Trend Has Begun
Market picture
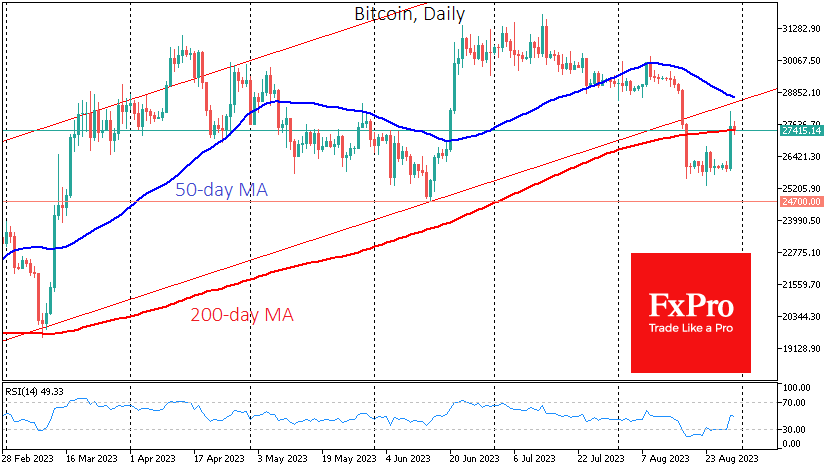
As expected, the constricted crypto market is a compressed spring, which means more volatility ahead, not a lack of interest. On Tuesday, Bitcoin jumped above $28.3K, adding over 2K in less than a couple of hours, on news that a US court had granted Grayscale Investments’ motion in its case against the SEC.
In June, Grayscale, an investment management company, sued the regulator for refusing to convert its flagship GBTC trust into a bitcoin ETF. An appeals court ordered the SEC to reconsider its decision.
On Wednesday morning, Bitcoin pulled back to $27.4K, close to the 200-day and 200-week moving averages. The real battle for the long-term trend has just begun, and the next few days could provide a crucial signal for weeks and months ahead.
News background
According to CoinShares, investments in crypto funds fell by $168 million last week, the largest since March. Outflows have been recorded in five of the previous six weeks.
According to CryptoQuant, Bitcoin trading volume in August was the lowest in almost five years as retail investors retreated during the bear market. In addition, this dynamic was influenced by US regulatory action on cryptocurrencies, combined with the end of the banking crisis in May.
The SEC classified NFTs as investment contracts for the first time. The SEC accused Impact Theory of making unregistered securities offerings by selling non-fungible tokens.
The Fed has been accused of creating obstacles to advancing a bill to regulate stablecoins in Congress. According to a group of congressmen, the Fed’s recent moves to increase oversight of banks’ ties to cryptocurrencies are getting in the way.
Eurozone economic sentiment deteriorates across the board
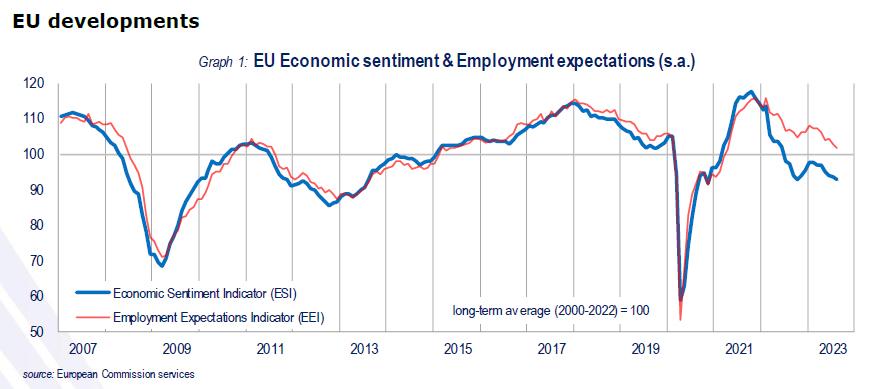
Eurozone Economic Sentiment Indicator (ESI) witnessed a drop from 194.5 to 93.3 in August, casting a dark shadow over the economic outlook of the bloc. Nearly all sectoral confidence indicators fell, with industry confidence sliding from -9.3 to -10.3, services from 5.4 to 3.9, retail trade from -4.5 to -5.0, and construction from -3.6 to -5.2. Employment Expectations Indicator (EEI) also showed a decline from 103.4 to 102.1, while the Economic Uncertainty Indicator (EUI) dipped from 21.3 to 20.0.
Similarly, EU-wide ESI fell modestly from 93.5 to 92.9, and its EEI from 102.7 to 101.7. EUI also registered a decline from 20.7 to 19.7. Breaking down the ESI numbers by individual countries, sentiment deteriorated in France -by 2.5 points, in Germany by -2.4 points, and in Italy by -1.1 points. Conversely, sentiment improved in Spain by 1.5 points and in Poland by 1.2 points, while the sentiment in the Netherlands remained almost unchanged, up by just 0.2 points.
EUR/USD Accelerates Gains from 2.5-month Low
This was facilitated by disappointing data on the US labor market. According to the Bureau of Labor Statistics, the number of new vacancies has fallen sharply: actual — 8.8 million, forecast — 9.4 million new vacancies. The last time the value of the indicator fell below 9 million was in the spring of 2021.
The news came as a big surprise, which sent the dollar index down sharply. Accordingly, USD-denominated shares and gold rose, as well as exchange rates traded against the dollar.
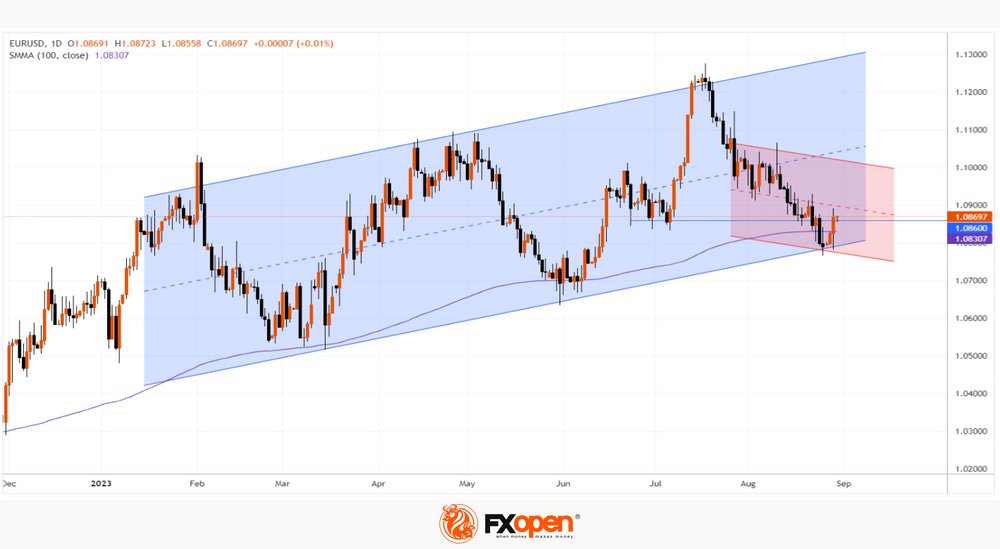
The EUR/USD chart shows that:
→ the price accelerated yesterday's rise from the 2.5-month low set on August 25;
→ the price continues to be supported by the lower line of the rising channel;
→ the price continues to be supported by SMA (100);
→ the presence of bears may appear near the lines of the descending channel (shown in red).
The bulls will consolidate their success if they manage to keep the price of EUR/USD above the level of 1.086, from which resistance can be expected. Decrease in the number of vacancies is a leading indicator of the state of the economy. If market participants receive more signals about the slowdown in the US economy, this could lower the USD against other currencies even more.
This article represents the opinion of the Companies operating under the FXOpen brand only. It is not to be construed as an offer, solicitation, or recommendation with respect to products and services provided by the Companies operating under the FXOpen brand, nor is it to be considered financial advice.
AUD/USD: Violation of Current Range Boundaries to Generate Fresh Direction Signal
AUDUSD edged lower in early European trading on Wednesday, reversing some gains made in Asian session, in reaction to weaker-than-expected US labor data released late Tuesday.
JOLTS report showed drop in job opening to the lowest in over two years, adding to signals of gradual slowdown in the US labor market, which deflated US dollar.
Australia’s inflation report, released overnight, showed unexpectedly low monthly inflation in July (4.9% vs 5.4% in June and 5.2% f/c), which reduces risk of another rate hike and add pressure on Aussie dollar.
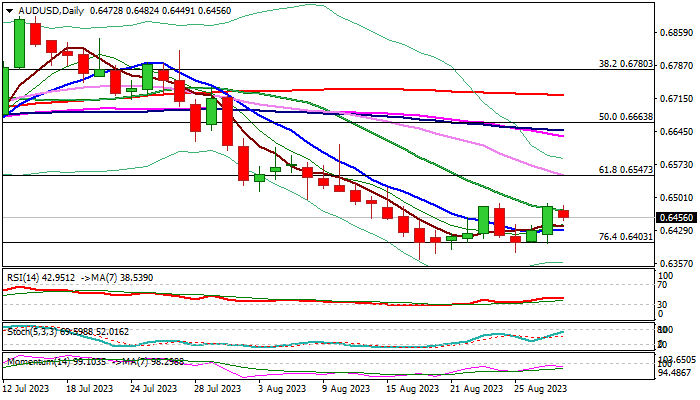
Technical picture on daily chart remains bearishly aligned (14-d momentum stays in the negative territory, most of MA are in bearish setup), with fresh weakness generating initial signal of repeated recovery rejection just under initial Fibo resistance at 0.6489 (23.6% of 0.6894/0.6364 bear-leg).
However, signals require confirmation, as near-term price action is in range, after a multiple failures to register close below 0.6403 (Fibo 76.4% of 0.6170/0.7157) and repeated stall of subsequent bounces.
Expect fresh direction signals on breach of either range boundary, with sustained break of 0.6472/89 (20DMA / Fibo 23.6%) upper triggers to open way for further recovery and unmask targets at 0.6547/67.
Conversely, dip below 10DMA (0.6431) would weaken near-term structure and risk renewed probe through 0.6400 zone, break of which will be bearish.
We also look for a number of important US economic releases these days (ADP, Core PCE, personal spending and NFP) which are expected to provide more details about the situation in the US economy, particularly in inflation and labor sector and influence Fed’s monetary policy decisions in the near future.
Res: 0.6472; 0.6489; 0.6547; 0.6567.
Sup: 0.6431; 0.6403; 0.6364; 0.6272.
EUR/AUD Daily Outlook
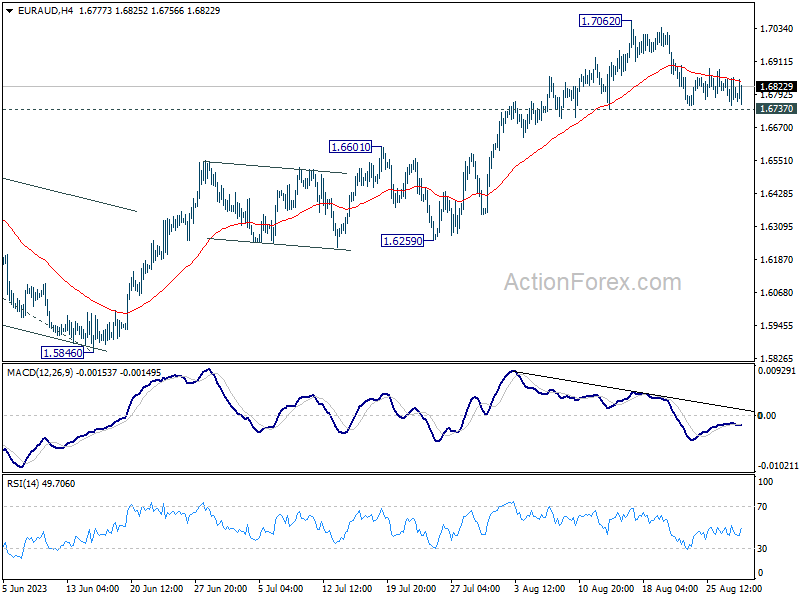
Daily Pivots: (S1) 1.6743; (P) 1.6799; (R1) 1.6845; More...
Range trading continues in EUR/AUD and intraday bias stays neutral. Further rise is mildly in favor as long as 1.6737 support holds. On the upside, break of 1.7062 resistance will resume larger up trend to 1.7377 projection level next. However, firm break of 1.6737 will bring deeper pull back to 1.6601 resistance turned support instead.
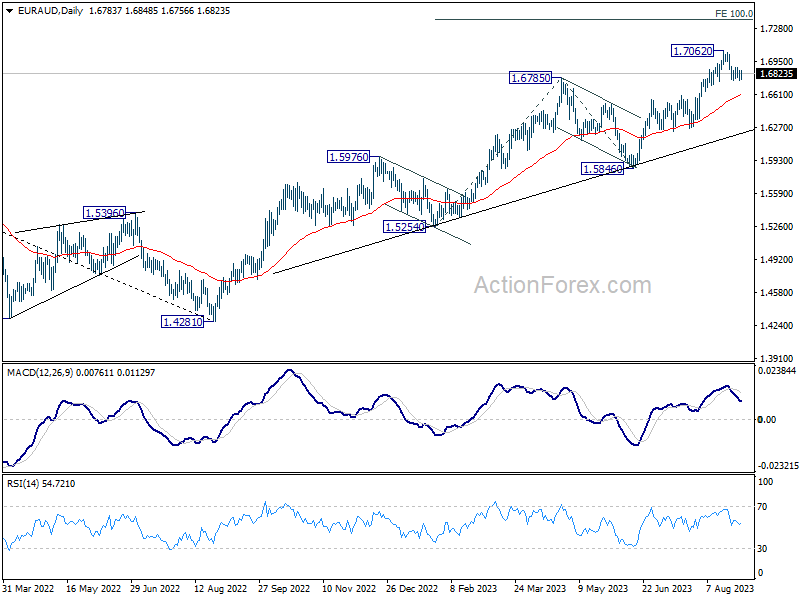
In the bigger picture, the rise from 1.4281 (2022 low) is in progress. Next target is 100% projection of 1.5254 to 1.6785 from 1.5846 at 1.7377. For now, outlook will stay bullish as long as 1.5846 support holds, even in case of another pull back.
EUR/GBP Daily Outlook
Daily Pivots: (S1) 0.8576; (P) 0.8593; (R1) 0.8621; More...
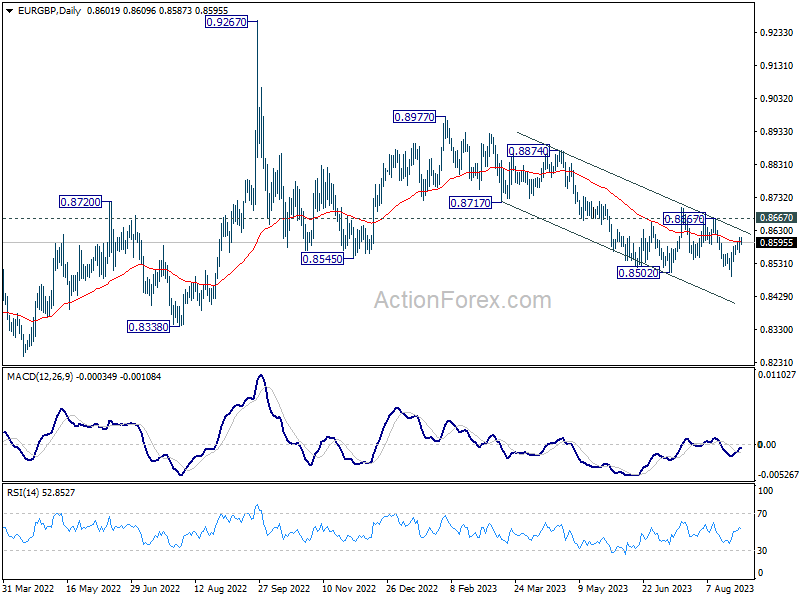
Intraday bias in EUR/GBP is back on the upside as rebound from 0.8491 resumed. While further rally could be seen, near term outlook will stay bearish with 0.8667 resistance intact. On the downside, below 0.8559 minors support will turn bias to the downside for retesting 0.8491 low first. Firm break there will resume larger down trend.
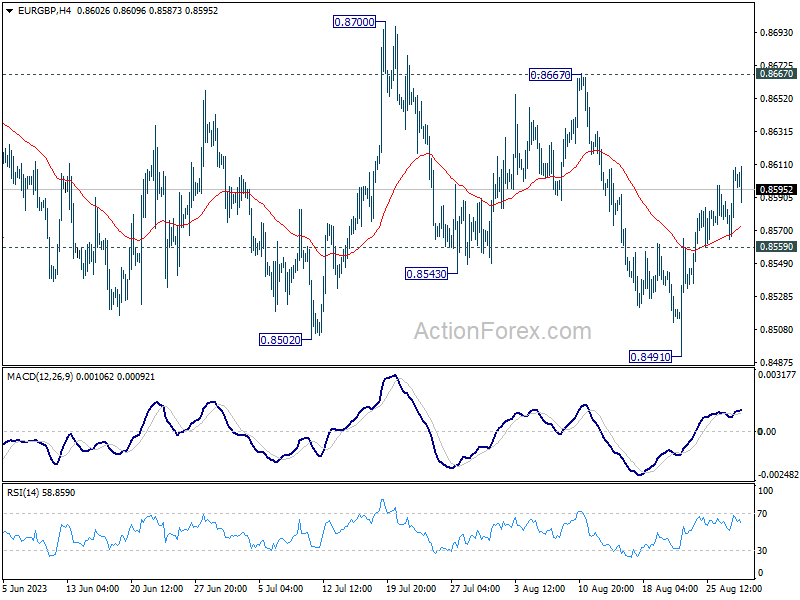
In the bigger picture, the down trend from 0.9267 (2022 high) is seen as part of the long term range pattern from 0.9499 (2020 high). Further decline is in favor as long as 0.8667 resistance holds. Break of 0.8502 will resume the fall towards 0.8201 (2022 low).