Sample Category Title
USD/JPY Daily Outlook
Daily Pivots: (S1) 139.29; (P) 139.90; (R1) 140.67; More...
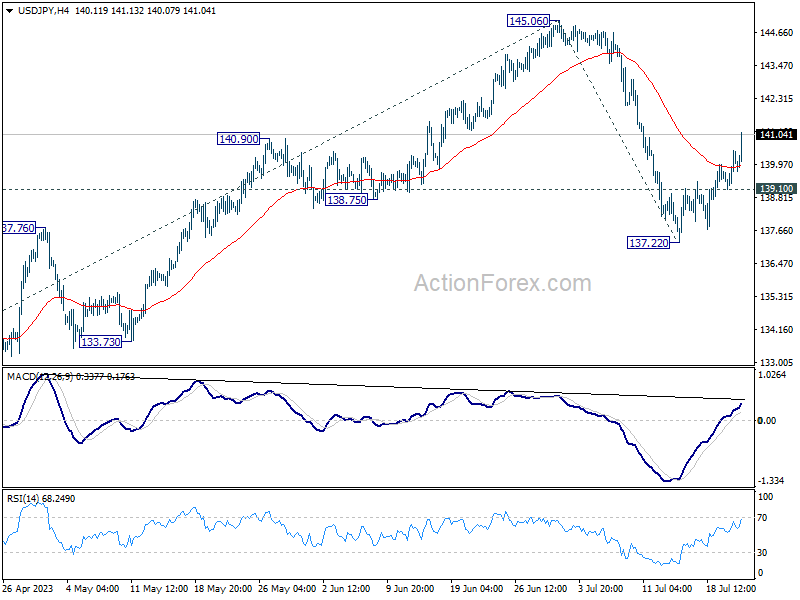
USD/JPY's rise from 137.22 accelerates higher today, and the development suggests that pull back from 145.06 has completed at 137.22 already. Intraday bias is now on the upside for retesting 145.06 first. Firm break there will resume larger rise from 127.20 to 61.8% projection of 129.62 to 127.22 from 145.06 at 146.76 next. On the downside, below 139.10 minor support will bring retest of 137.22 instead.
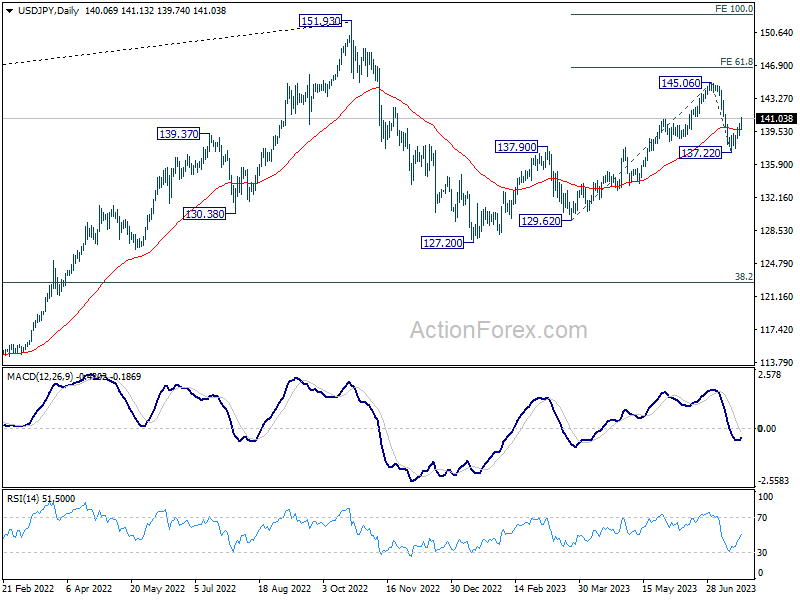
In the bigger picture, overall price actions from 151.93 (2022 high) are views as a corrective pattern. Current development suggests that the second leg (the rise from 127.20) might not be over yet. But even in case of extended rise, strong resistance should be seen from 151.93 to limit upside. Meanwhile, break of 137.22 support should confirm the start of the third leg to 127.20 (2023 low) and below.
AUD/USD Daily Report
Daily Pivots: (S1) 0.6746; (P) 0.6797; (R1) 0.6829; More...
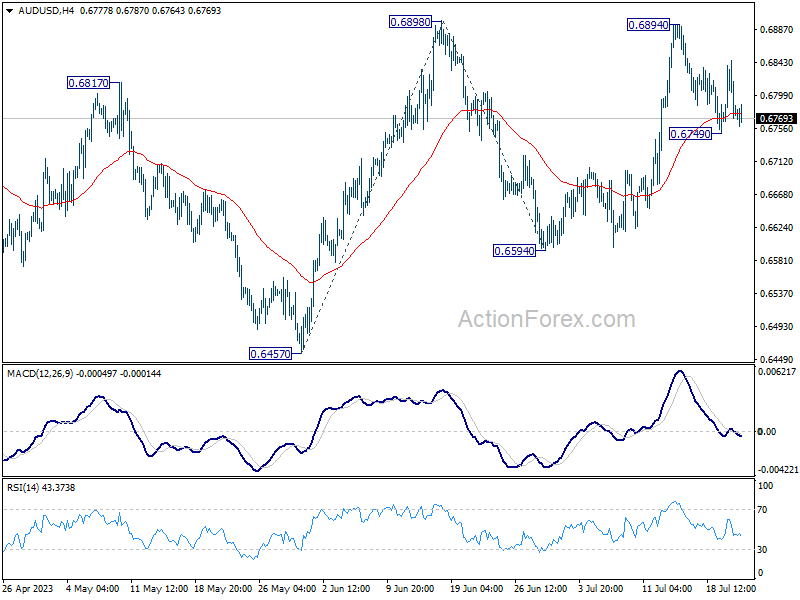
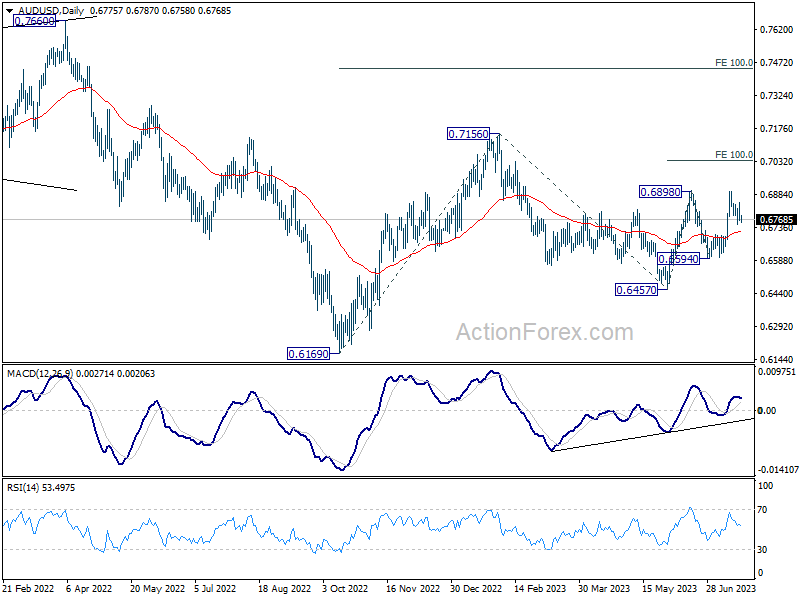
Intraday bias in AUD/USD stays neutral at this point. On the upside, decisive break of 0.6898 resistance will firstly confirm resumption of rise from 0.6457. Secondly, that should also confirm completion of the fall from 0.7156 at 0.6457. Next target will be 100% projection of 0.6457 to 0.6898 from 0.6594 at 0.7035, and then 0.7156 resistance.
In the bigger picture, price actions from 0.7156 are seen as a correction to the rebound from 0.6169 (2022 low). Break of 0.6898 resistance will argue that rise from 0.6169 is ready to resume through 0.7156. Next target will be 100% projection of 0.6169 to 0.7156 from 0.6457 at 0.7444. For now, this will be the favored case as long as 55 D EMA (now at 0.6703) holds.
USD/CAD Daily Outlook
Daily Pivots: (S1) 1.3130; (P) 1.3162; (R1) 1.3206; More....
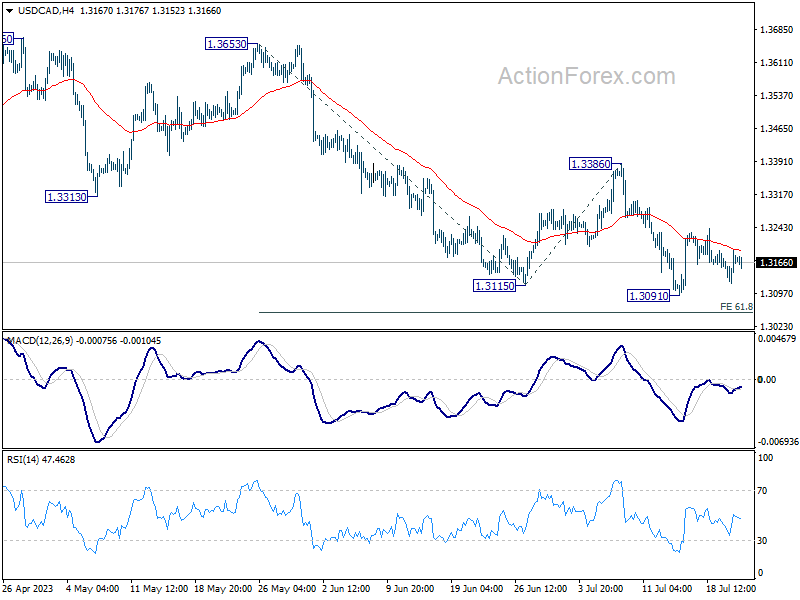
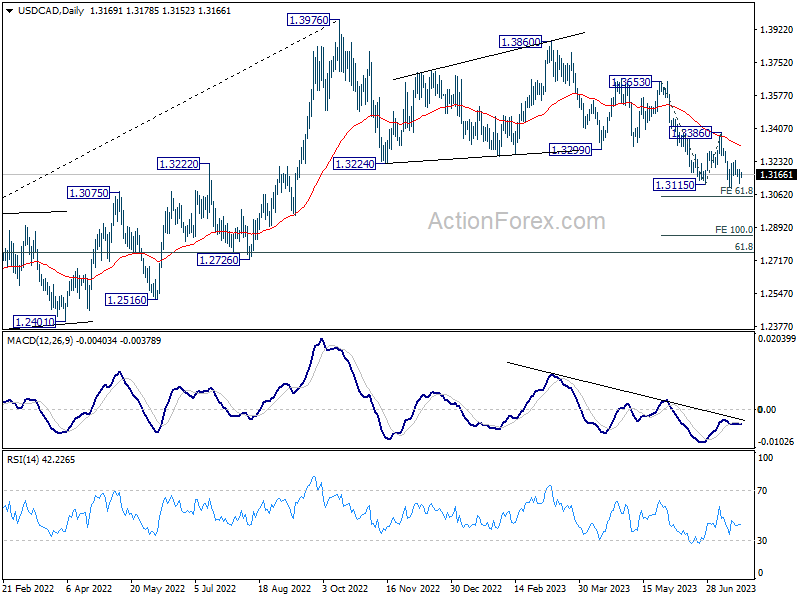
Intraday bias in USD/CAD remains neutral, and outlook stays bearish with 1.3386 resistance intact. On the downside, break of 1.3091 will larger decline to 61.8% projection of 1.3653 to 1.3115 from 1.3386 at 1.3054. However, firm break of 1.3386 will indicate near term reversal and turn outlook bullish.
In the bigger picture, price actions from 1.3976 are viewed as a correction to up trend from 1.2005 (2021 low) only. But even so, deeper decline is expected as long as 1.3386 resistance holds. Further fall could be seen to 61.8% retracement of 1.2005 to 1.3976 at 1.2758. Meanwhile, break of 1.3386 will be a sign that the correction has completed and bring stronger rally back to retest 1.3976.
EUR/CHF Daily Outlook
Daily Pivots: (S1) 0.9613; (P) 0.9636; (R1) 0.9669; More...
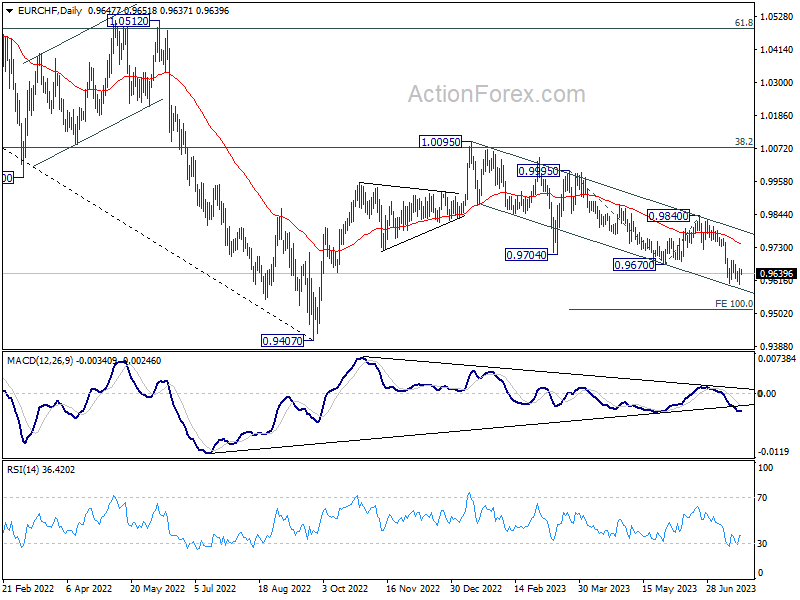
Intraday bias in EUR/CHF is turned neutral with current recovery, but outlook stays bearish as long as 0.9684 resistance holds. On the downside, break of 0.9601 will resume the whole decline from 1.0095 to 100% projection of 0.9995 to 0.9670 from 0.9840 at 0.9515. On the upside, however, break of 0.9684 will indicate short term bottoming, and bring stronger rebound.
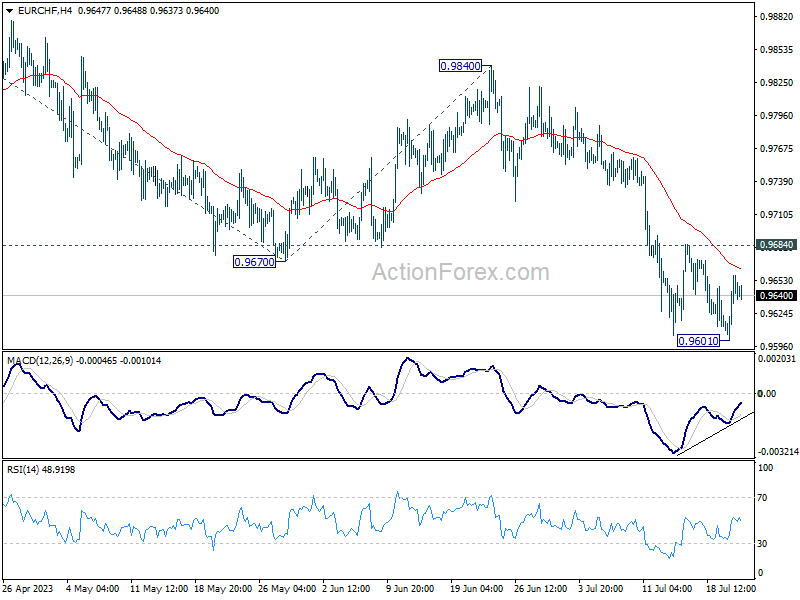
In the bigger picture, medium term outlook is staying bearish as the pair is capped below falling 55 W EMA (now at 0.9913). Down trend form 1.2004 (2018 high) is in favor to extend through 0.9407 at a later stage. Nevertheless, decisive break of 38.2% retracement of 1.1149 to 0.9407 will raise the chance of bullish trend reversal.
GBP/JPY Daily Outlook
Daily Pivots: (S1) 179.74; (P) 180.23; (R1) 180.71; More...
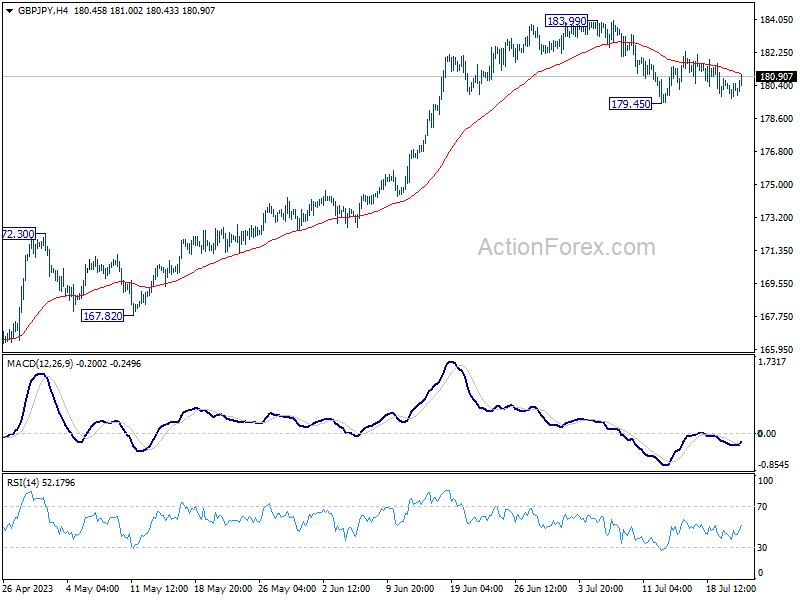
Range trading continues in GBP/JPY above 179.45 and intraday bias remains neutral first. On the downside, break of 179.45 will resume the correction from 183.90 to 55 D EMA (now at 177.39). On the upside, firm break of 183.99 high will resume larger up trend to 187.36 projection level.
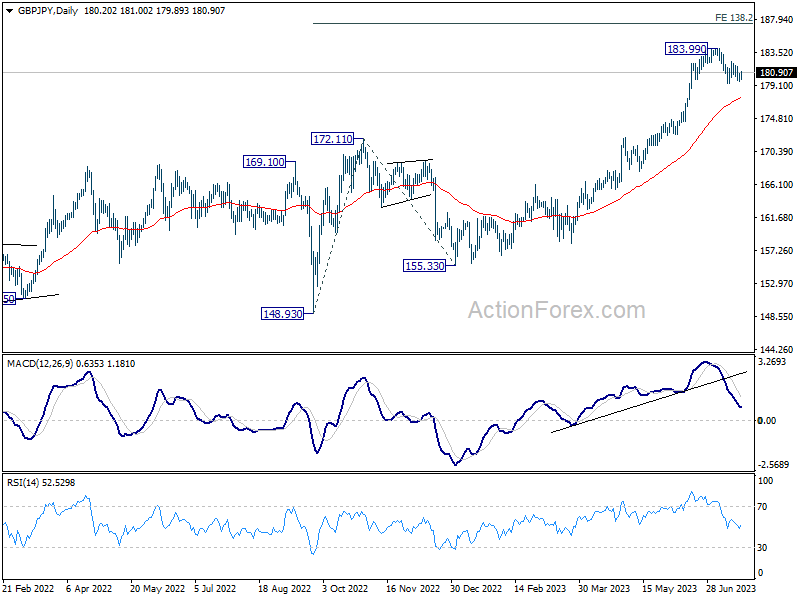
In the bigger picture, as long as 172.11 resistance turned support holds, up trend from 123.94 (2020 low) is expected to continue. On resumption, next target is 138.2% projection of 148.93 to 172.11 from 155.33 at 187.36, and then 195.86 (2015 high). Nevertheless, firm break of 172.11 will argue that larger correction is already underway.
EUR/JPY Daily Outlook
Daily Pivots: (S1) 155.64; (P) 156.13; (R1) 156.39; More....
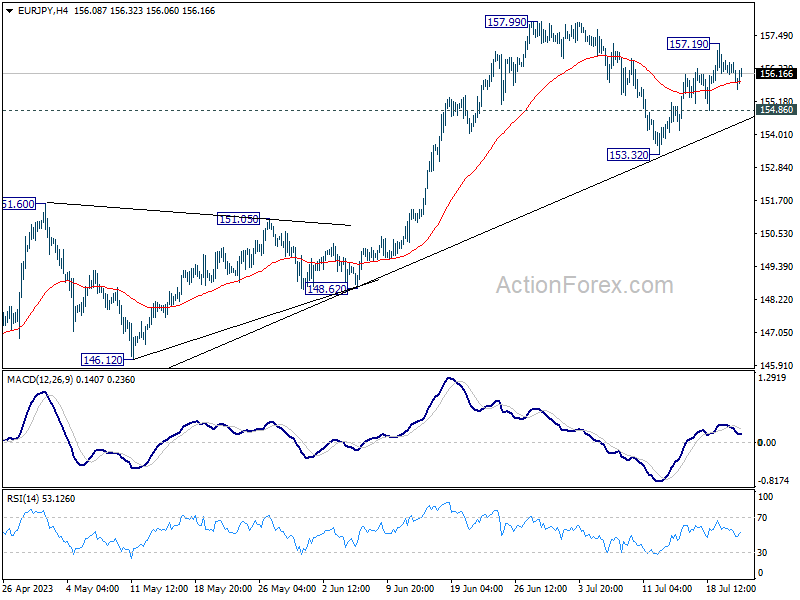
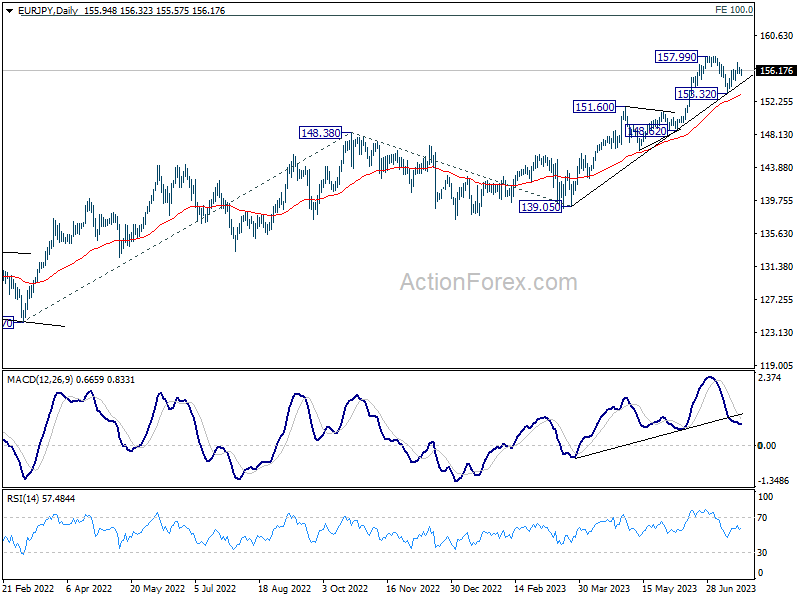
Intraday bias in EUR/JPY is turned neutral with current retreat. On the upside, above 157.19 temporary top will resume the rebound from 153.32 to retest 157.99 high. Firm break there will resume larger up trend. On the downside, below 154.86 minor support should resume the corrective fall from 157.99 through 153.32 support, to 55 D EMA (now at 153.10) and below.
In the bigger picture, as long as 151.60 resistance turned support holds, rise from 114.42 (2020 low) is in progress. On resumption, next target is 100% projection of 124.37 to 148.38 from 138.81 at 162.82. Nevertheless, sustained break of 151.60 will argue that larger correction is already underway.
EUR/AUD Daily Outlook
Daily Pivots: (S1) 1.6347; (P) 1.6452; (R1) 1.6522; More...
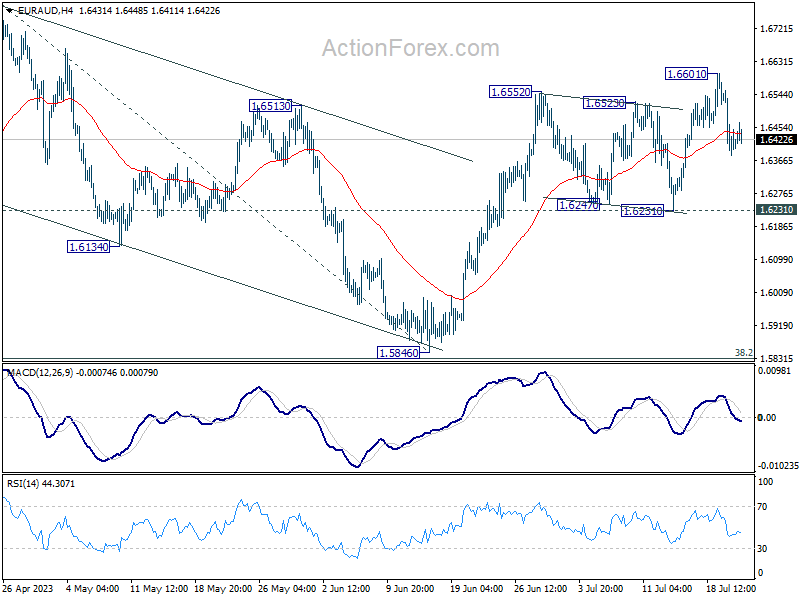
Intraday bias in EUR/AUD remains neutral but further rally is in favor with 1.6231 support intact. As noted before, correction from 1.6785 should have completed with three waves down to 1.5846. Above 1.6601 will resume the rise from 1.5864 to retest 1.6785 high next.
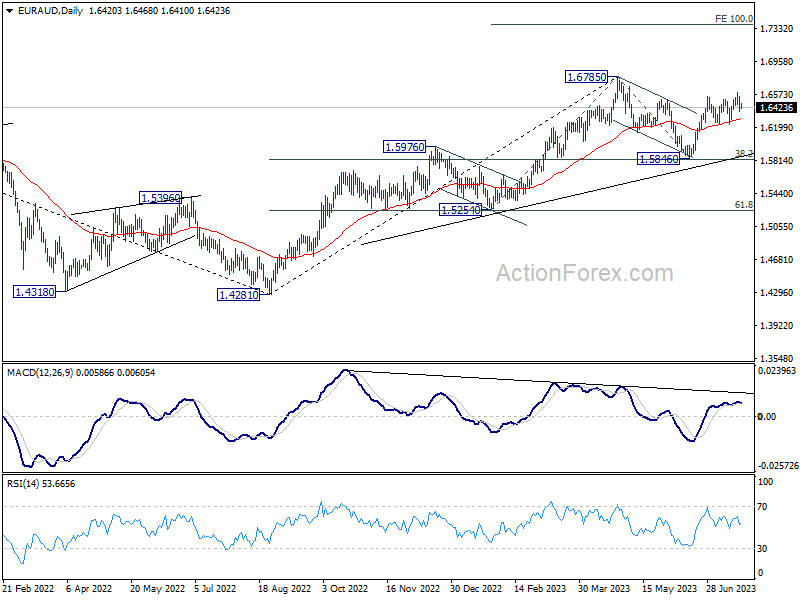
In the bigger picture, with 38.2% retracement of 1.4281 to 1.6785 at 1.5828 intact, rally from 1.4281 is still in progress. Firm break of 1.6785 will confirm rise resumption. Next target is 100% projection of 1.5254 to 1.6785 from 1.5846 at 1.7377. On the other hand, rejection by 1.6785 will extend the corrective pattern with another fall leg. But outlook will stay bullish as long as 1.5828 holds.
USDCAD Downward Trend Continues; A New 2023 Low On the Cards
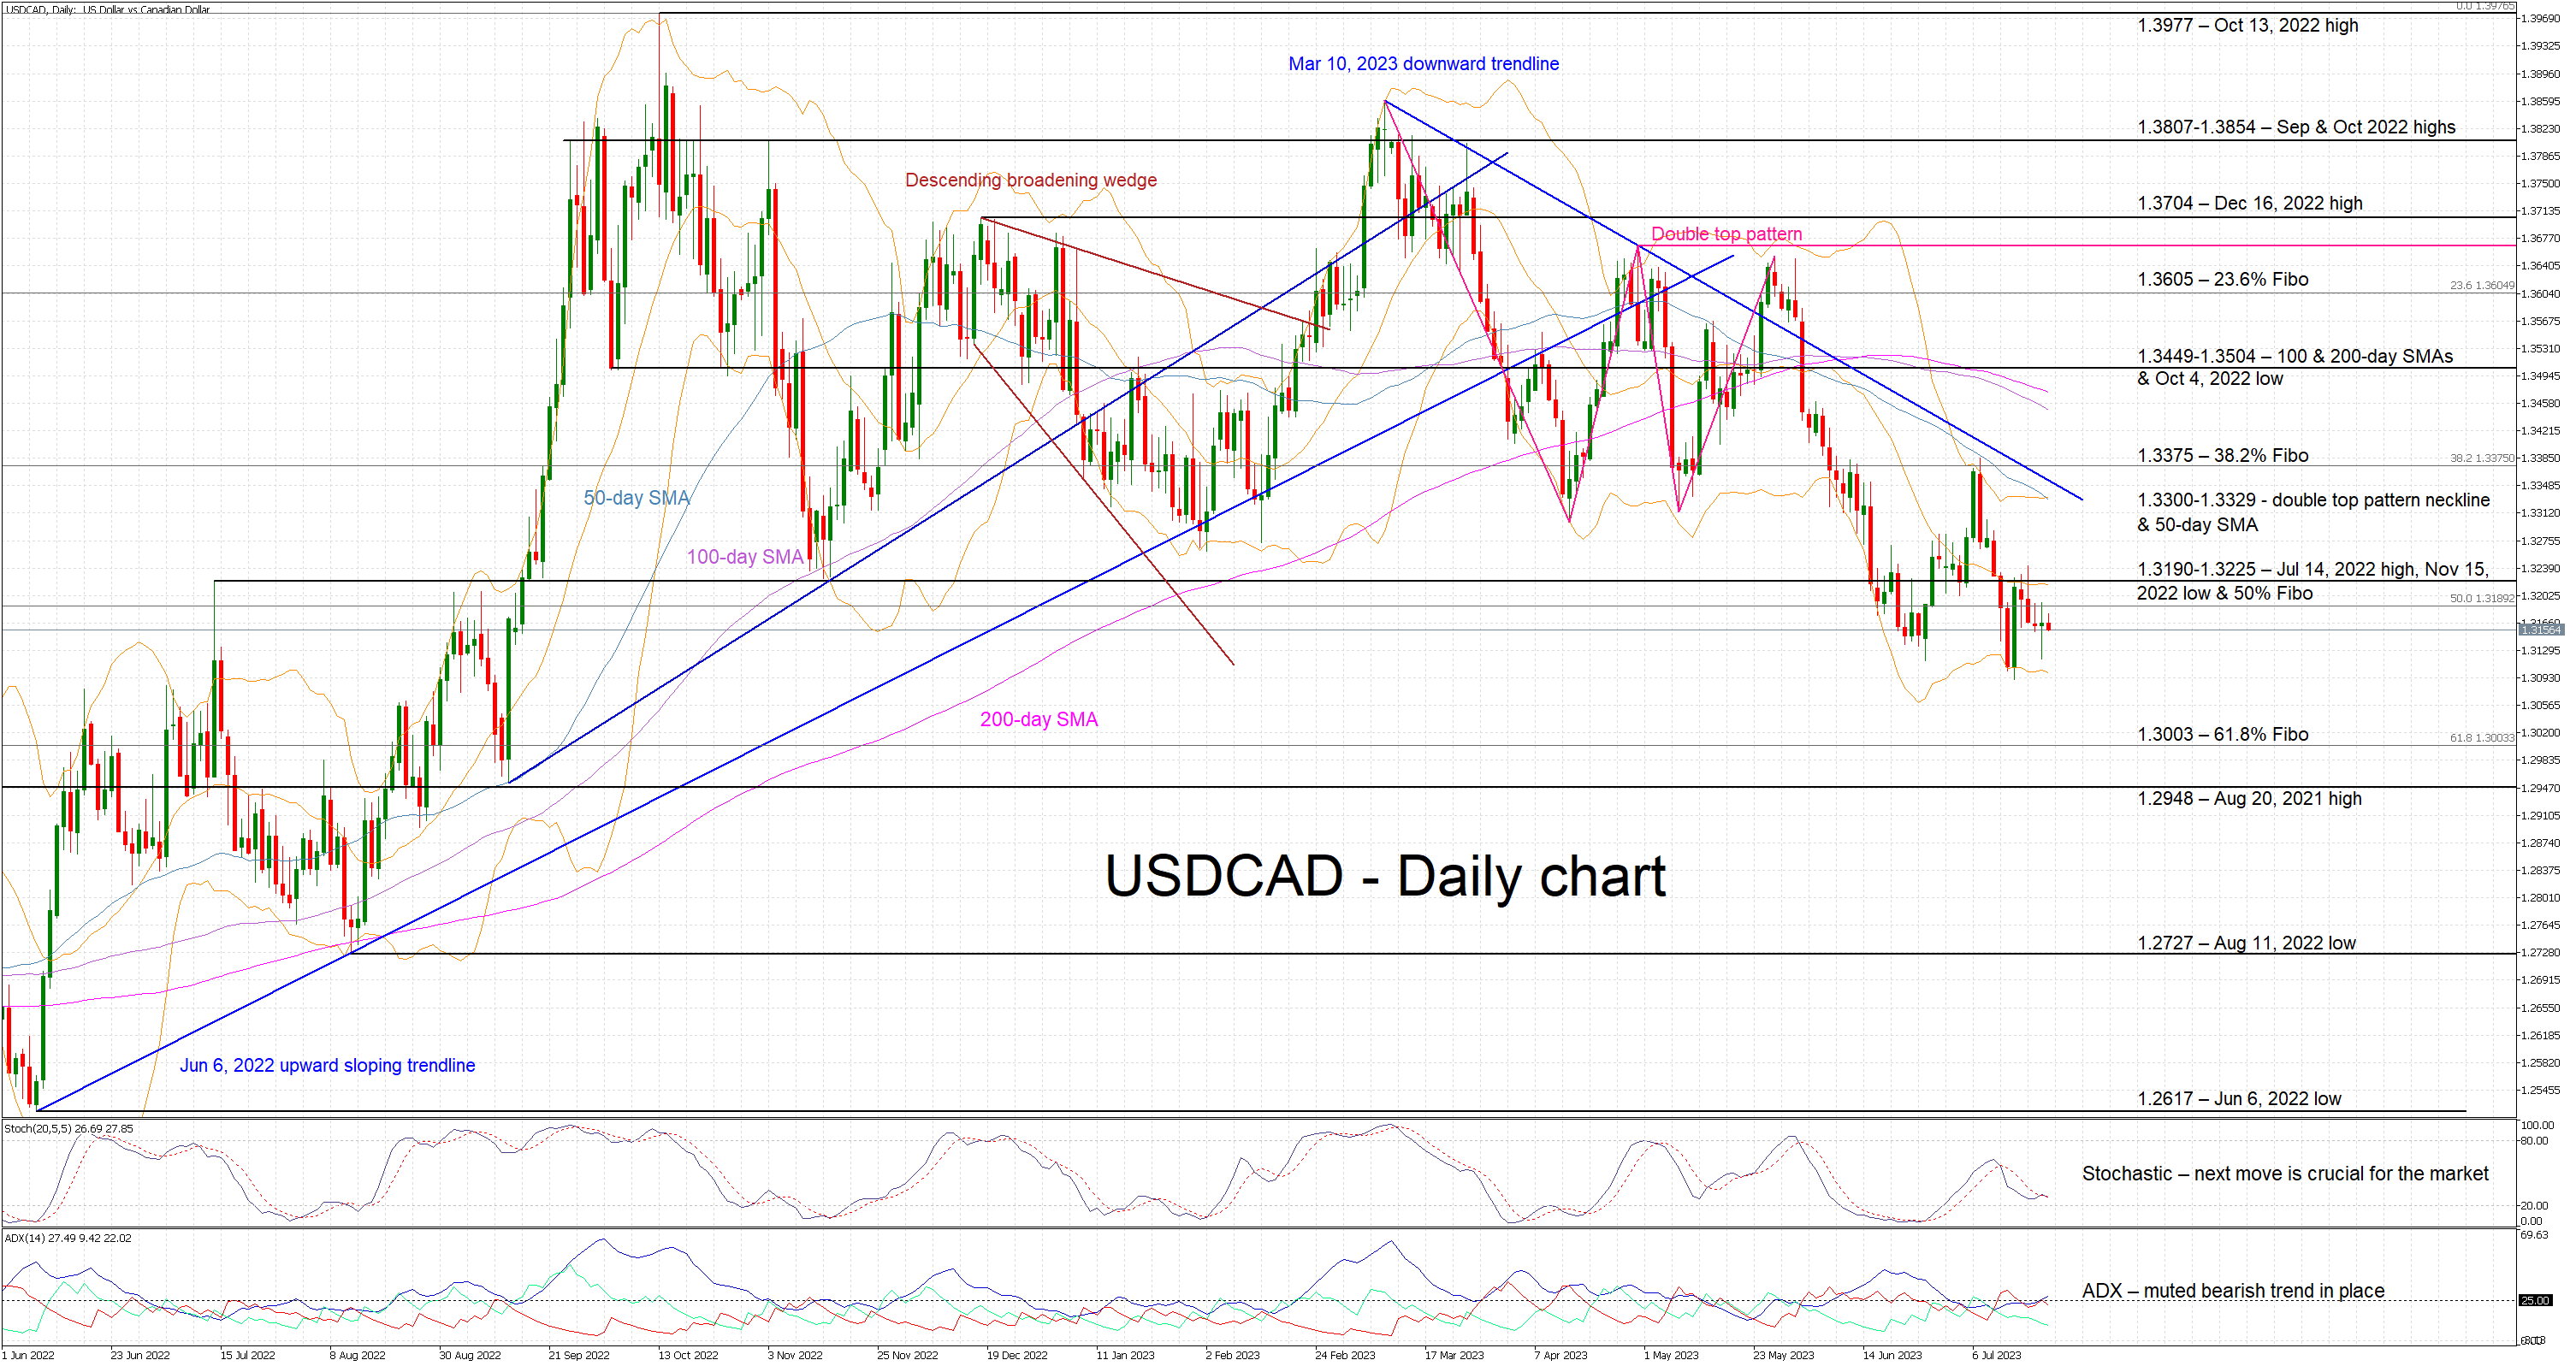
USDCAD is moving sideways today, trading a tad above the 2023 low. The bearish trend that commenced since the March 10, 2023 peak remains dominant in this currency pair. In addition, a series of lower lows and lower highs is currently in place with the bears aiming for the next trough to take place below the June 27, 2023 low of 1.3116.
With the Average Directional Movement Index (ADX) confirming the presence of a muted bearish trend in the market, the focus is on the stochastic oscillator. It is edging lower, battling with its moving average (MA). A successful move above the MA would unsettle the bears’ plan, while a drop lower would clearly be seen as a bearish signal.
Should the bears feel inspired by the overall technical picture, they would try to record a new 2023 low and then target the 61.8% Fibonacci retracement of the April 5, 2022 – October 13, 2022 uptrend at 1.3003. If successful, they could then have a go at the August 20, 2021 high at 1.2948 and possibly be given the chance to record the lowest print since August 2022.
On the other hand, the bulls are anxiously trying to push USDCAD above the busy 1.3190-1.3225 range populated by the July 14, 2022 high, the November 15, 2022 low and the 50% Fibonacci retracement respectively. They could then have the chance of testing the resistance set by both the March 10, 2023 downward sloping trendline and key 1.3300-1.3329 range.
To sum up, USDCAD bears feel in control of the market and ready to record a new 2023 low if the stochastic oscillator provides the appropriate signal.
Gold (XAUUSD) in Correction Within Bullish Trend
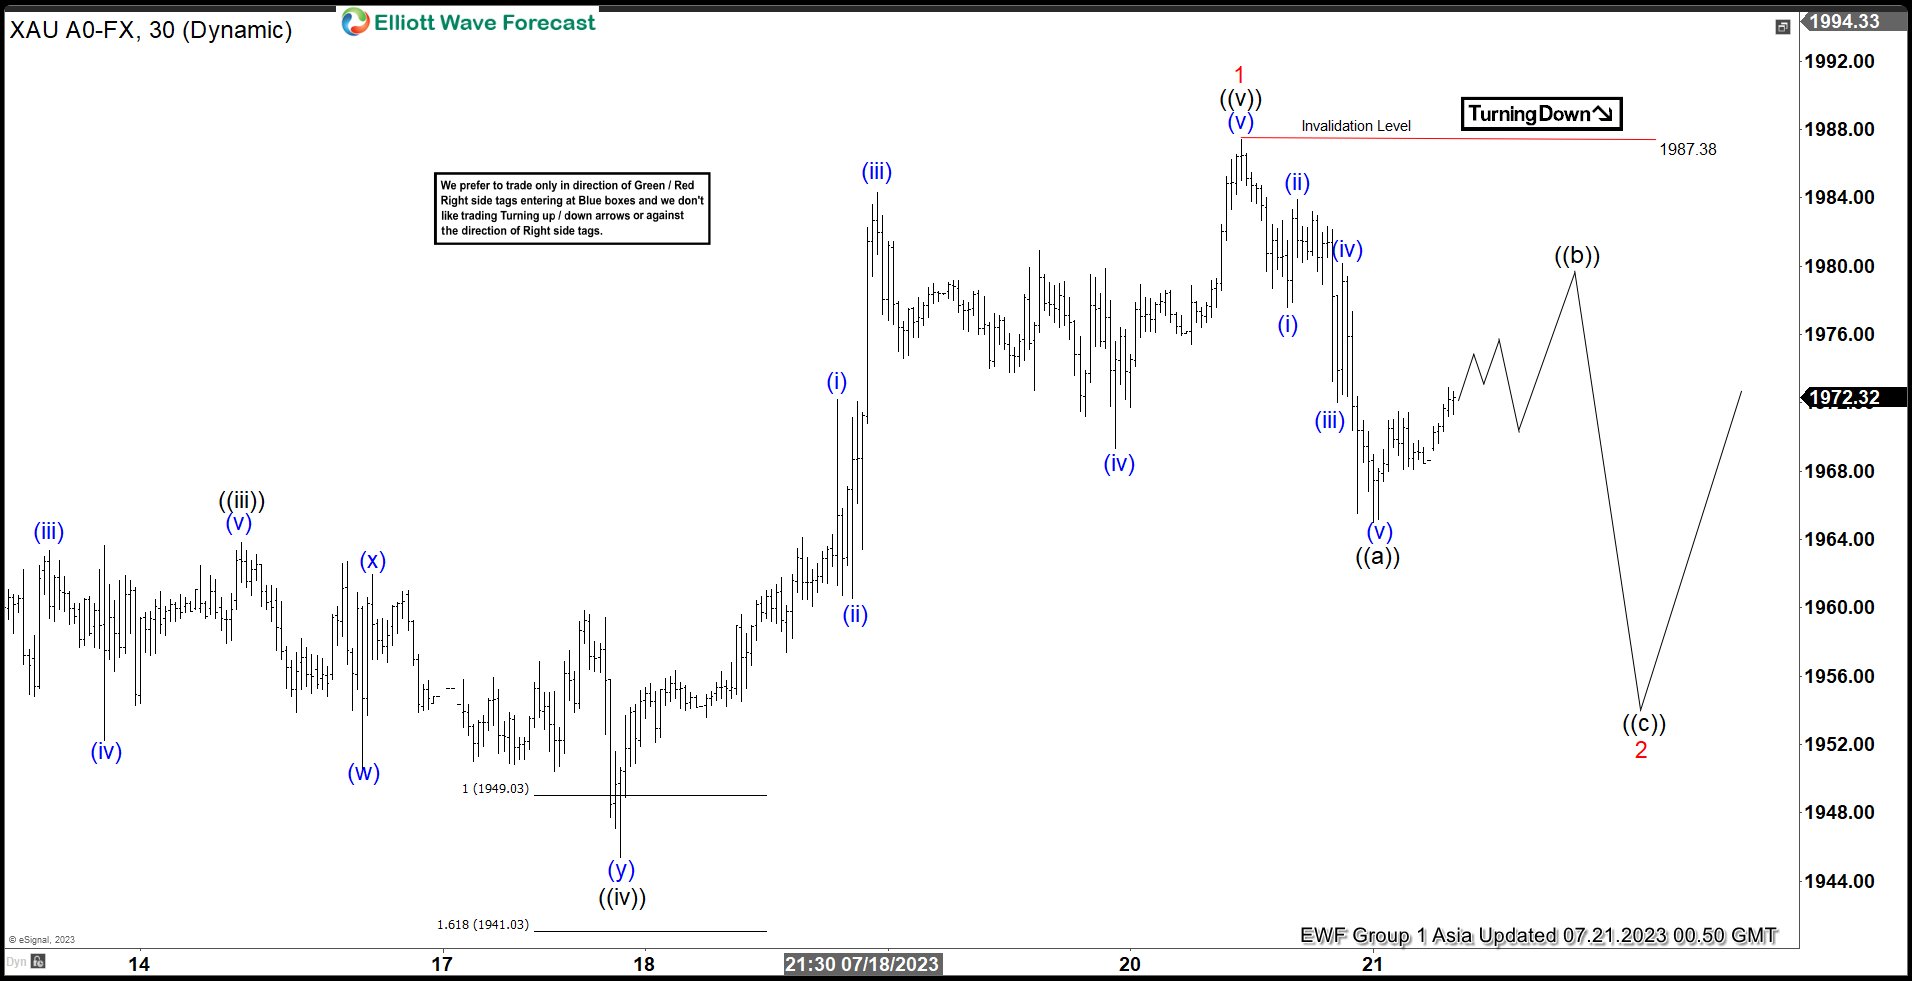
Short Term Elliott Wave View in Gold (XAUUSD) suggests the cycle from 6.29.2023 low ended at 1987.38 as wave 1. Internal subdivision of wave 1 rally unfolded as a 5 waves impulse Elliott Wave structure. Up from 6.28.2023 low, wave ((i)) ended at 1934.97 and pullback in wave ((ii)) ended at 1902.20. The metal rallies higher again in wave ((iii)) towards 1963.81 and pullback in wave ((iv)) ended at 1945.40.
Up from wave ((iv)), wave (i) ended at 1972.17 and pullback in wave (ii) ended at 1960.58. The metal extends higher in wave (iii) towards 1984.32 and pullback in wave (iv) ended at 1969.30. The final leg higher wave (v) ended at 1987.38 which completed wave ((v)) of 1 in larger degree. Wave 2 pullback is currently in progress as a zigzag Elliott Wave structure. Down from wave 1, wave ((a)) ended at 1965. Expect wave ((b)) rally to fail for further downside in wave ((c)) to complete wave 2 before the metal resumes higher. Near term, as far as pivot at 1987.38 high stays intact, expect the rally to fail in 3, 7, or 11 swing for further downside.
Gold (XAUUSD) 30 Minutes Elliott Wave Chart
XAUUSD Elliott Wave Video
https://www.youtube.com/watch?v=kYdKTW0SuWY
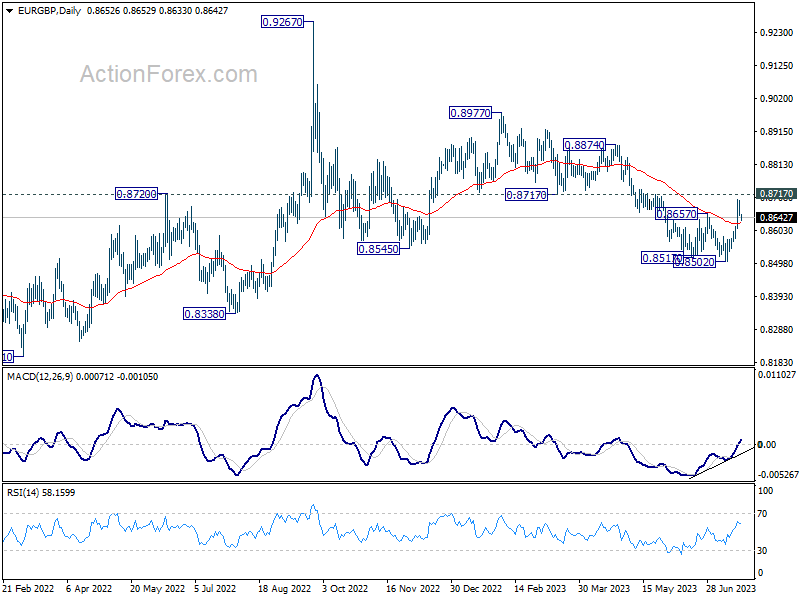
EUR/GBP Daily Outlook
Daily Pivots: (S1) 0.8633; (P) 0.8666; (R1) 0.8682; More...
Intraday bias in EUR/GBP is turned neutral with current retreat. Outlook is unchanged that fall from 0.8977 might have completed its five-wave sequence. Firm break of 0.8717 support resistance will solidify this bullish case and target 0.8977 resistance next. On the downside, though, below 0.8619 minor support will mix up the outlook and turn bias back to the downside for retesting 0.8502 low.
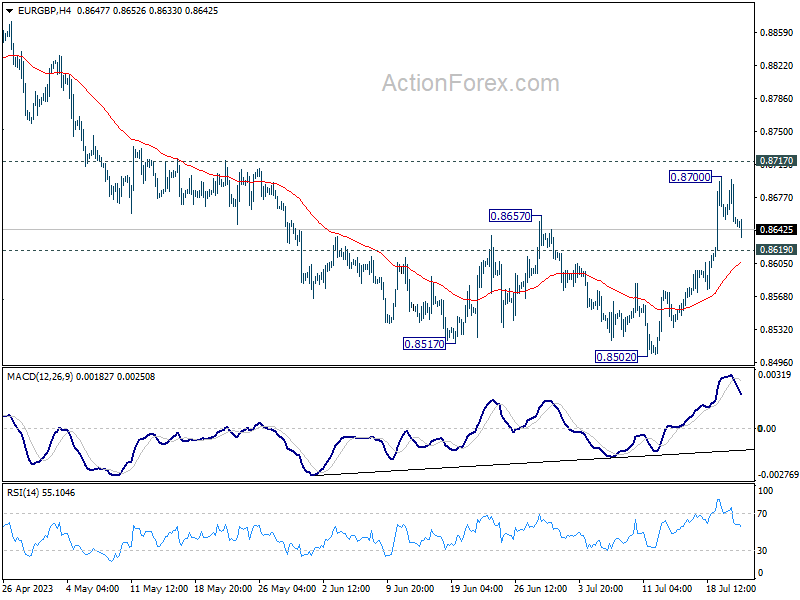
In the bigger picture, the down trend from 0.9267 (2022 high) is seen as part of the long term range pattern from 0.9499 (2020 high). Firm break of 0.8717 support turned resistance will argue that it has completed with three waves down to 0.8502. Further break of 0.8977 will bring retest o f0.9267 high. Nevertheless, break of 0.8502 will resume the decline towards 0.8201 (2022 low).