Sample Category Title
Canada: Auto Sales Drive Retail Sales Growth in May, But Momentum is Fading
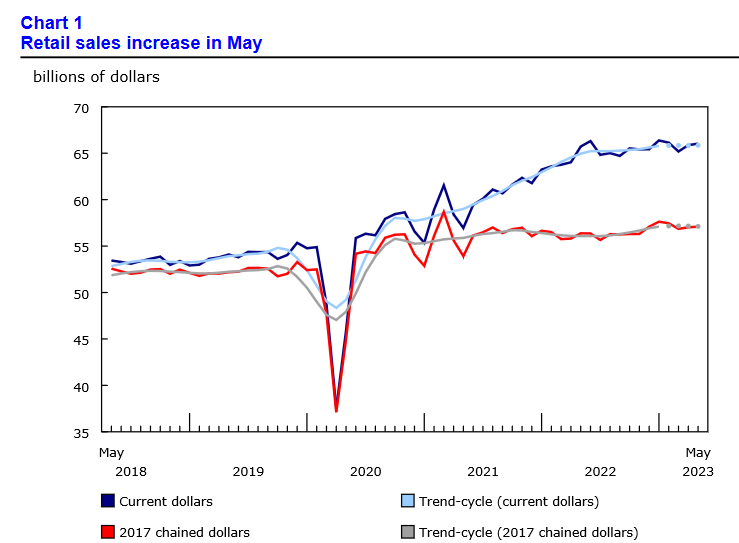
Retail sales rose 0.2% month-on-month (m/m) in May, weaker than the Statistics Canada's advanced estimate of 0.5%. April's print was revised down slightly to 1.0% m/m from 1.1% reported originally.
Adjusting for the inflation, the volume of retail sales was 0.1% higher on the month.
As expected, sales at motor vehicle and parts dealers were strong, gaining 0.8% m/m and accounting for all of today's headline growth.
Receipts at gasoline stations and fuel vendors were flat on the month thanks to lower prices at the pump. Meanwhile, April's reading was revised down to -0.4% m/m from +0.3% m/m reported earlier.
Excluding these volatile categories, core retail sales were flat in May, below the consensus estimates of a 0.2% m/m increase.
Gains at electronics and appliance stores (+2.3% m/m), food and beverage (+1.0% m/m), and miscellaneous store retailers (+1.3%m/m) were offset by declines at furniture and home furnishings (-1.6% m/m), building materials and garden equipment dealers (-1.5% m/m), clothing and clothing accessories (-0.8% m/m) general merchandise retailers (-0.7% m/m).
E-commerce sales, which are not included in the headline tally, grew 2.1% m/m after a sizeable decline in April.
Statistics Canada's advanced estimate points to another flat reading in June.
Key Implications
May brought a sizeable deceleration in retail spending growth. The only sector that points to a decisive gain is auto sales, where both nominal and unit sales were up. The rest of the categories are a mixed bag that points to consumers prioritizing spending on groceries at an expense of discretionary purchases. In real terms, second quarter real consumer spending is now tracking just slightly below 1.0% quarter-on-quarter (annualized).
The "greater persistence of excess demand" remains a challenge for the Bank of Canada. The Bank expects that household consumption will slow over the course of next year as additional hikes work its way through the economy. With today's reading, there is evidence that this slowdown is materializing. Still, consumers have financial resources in the form of excess savings, so the path to moderation may not be a smooth one. For now, we expect that monetary policy will remain restrictive until after the first quarter of 2024.
EUR/USD Mid-Day Outlook
Daily Pivots: (S1) 1.1089; (P) 1.1159; (R1) 1.1200; More...
Intraday bias in EUR/USD remains on the downside at this points. Correction from 1.1274 short term top could extend towards 1.1011 resistance turned support. For now, risk is mildly on the downside as long as 1.1274 resistance holds, in case of recovery.
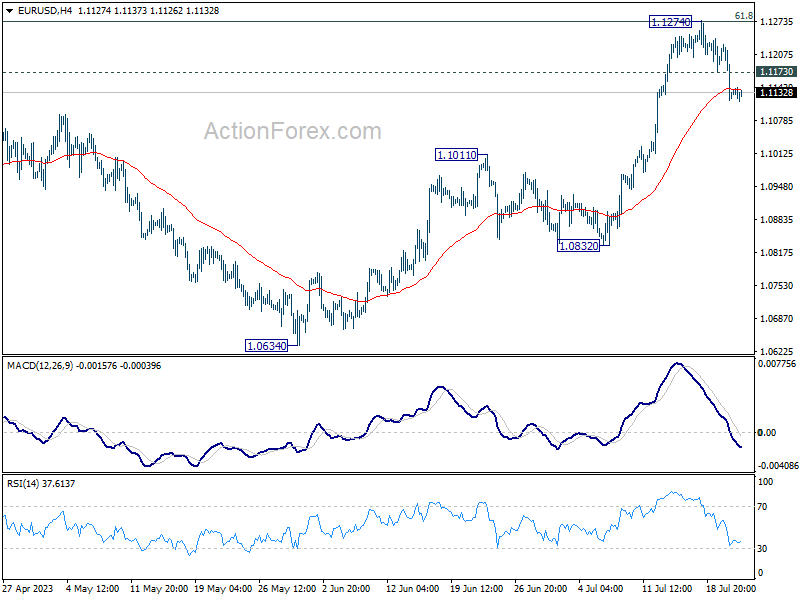
In the bigger picture, as rise from 0.9534 extends, focus is now on 61.8% retracement of 1.2348 (2021 high) to 0.9534 at 1.1273. Sustained break there will solidify the case of bullish trend reversal and target 1.2348 resistance next. Meanwhile, outlook will continue to stay bullish as long as 1.0832 support holds, even in case of deep pull back.
GBP/USD Mid-Day Outlook
Daily Pivots: (S1) 1.2816; (P) 1.2891; (R1) 1.2941; More...
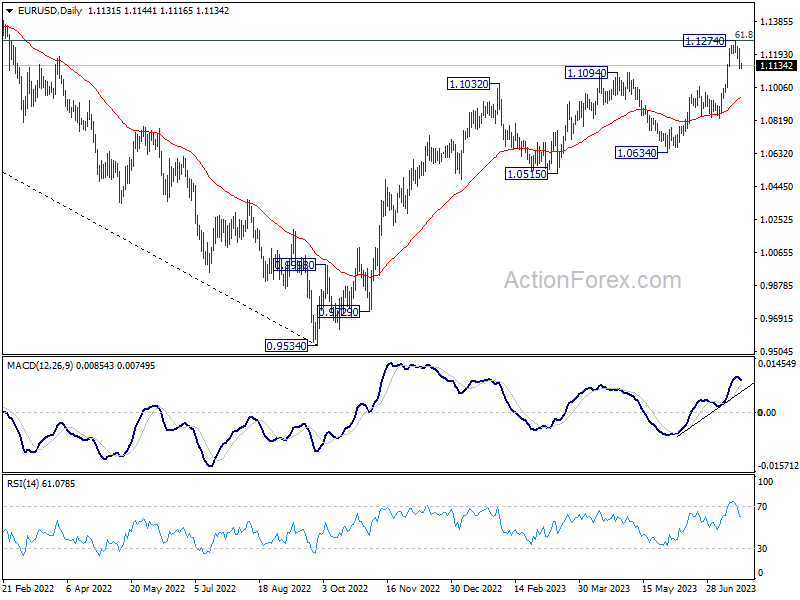
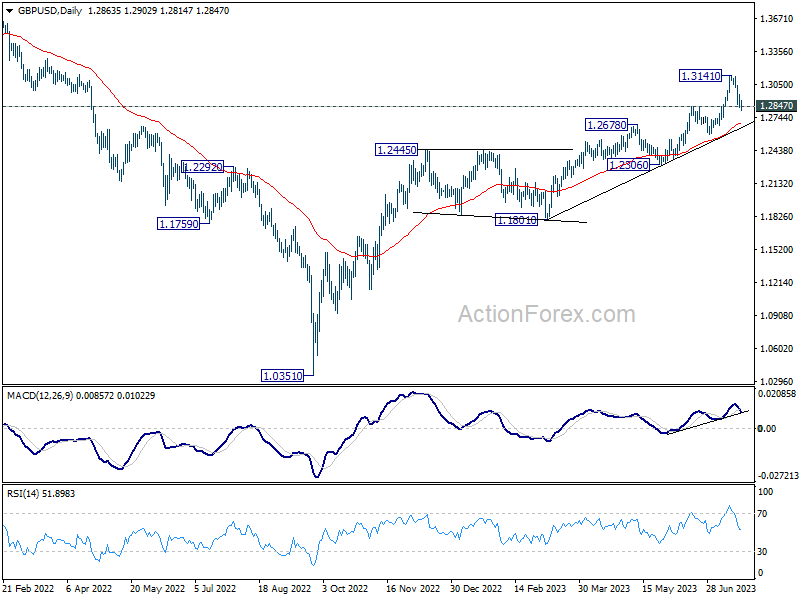
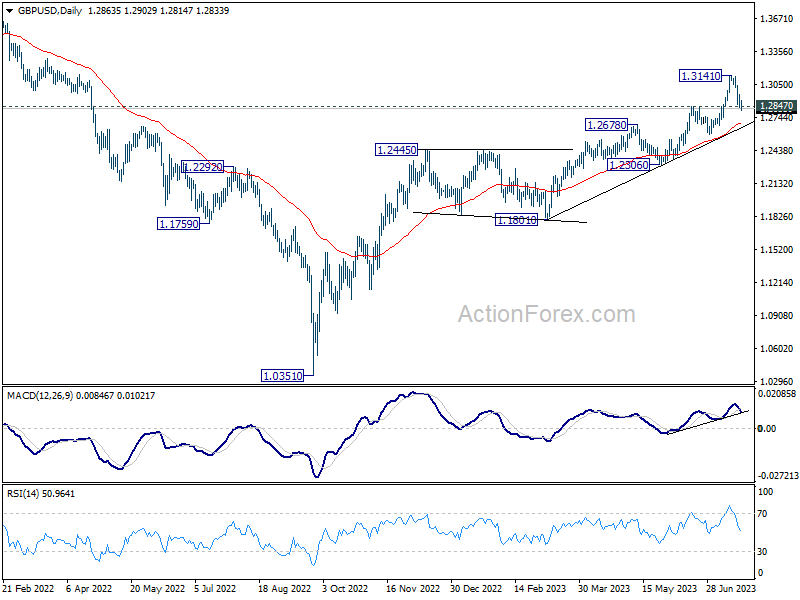
Intraday bias in GBP/USD is now on the downside. Sustained trading below 1.2847 resistance turned support will indicate that larger correction is underway. Deeper fall would be seen to 55 D EMA (now at 1.2692). On the upside, break of 1.2963 minor resistance will turn bias back to the upside retest 1.3141 high instead.
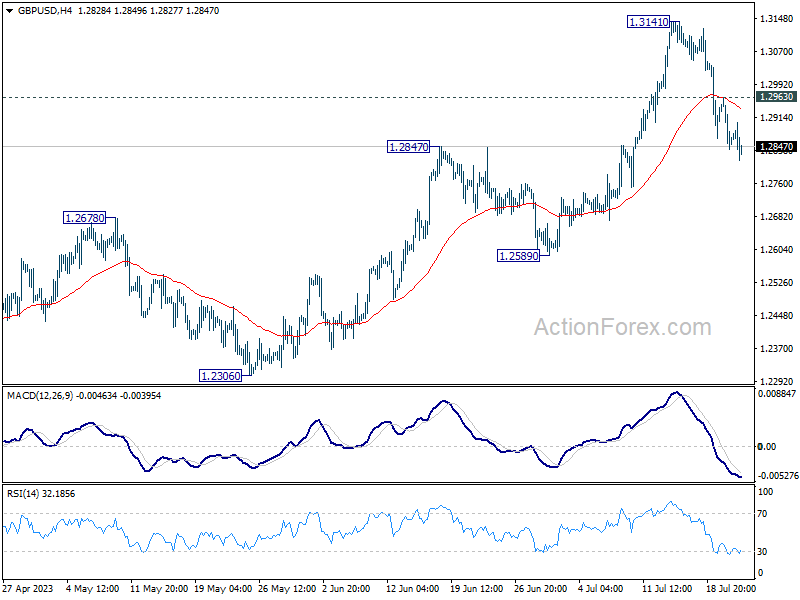
In the bigger picture, rise from 1.0351 medium term bottom (2022 low) is in progress. Next target is 100% projection of 1.0351 to 1.2445 from 1.1801 at 1.3895. Break there will target 1.4248 key long term resistance (2021 high) next. This will now remain the favored case as long as 1.2678 resistance turned support holds.
USD/CHF Mid-Day Outlook
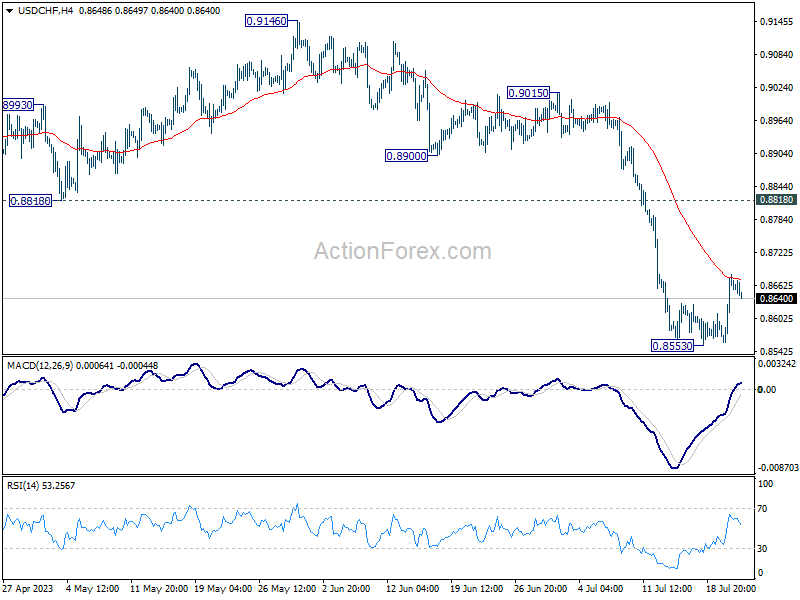
Daily Pivots: (S1) 0.8591; (P) 0.8637; (R1) 0.8714; More...
Intraday bias in USD/CHF stays mildly on the upside at this point. Rebound from 0.8553 short term bottom would extend towards 0.8818 support turned resistance. For now, risk will stay mildly on the upside as long as 0.8553 holds, in case of retreat.
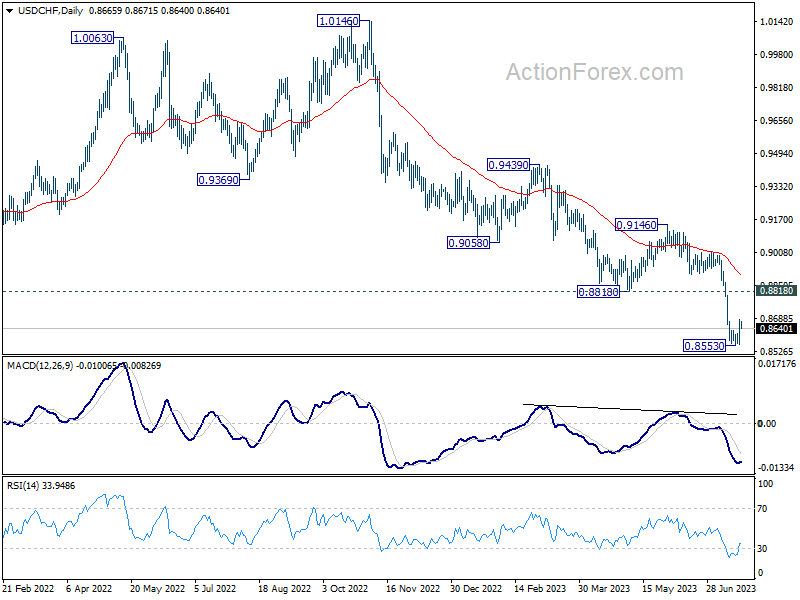
In the bigger picture, the break of 0.8756 (2021 low) indicates break out from the long term range pattern. For now, medium term outlook will stay bearish as long as 0.9146 resistance holds. Further fall would be seen to 61.8% retracement of 0.7065 (2011 low) to 1.0342 (2016 high) at 0.8317 next.
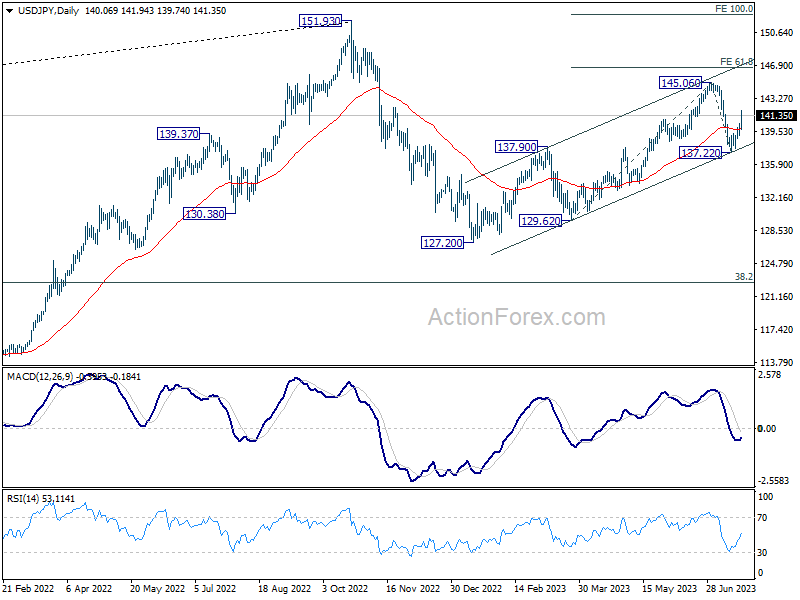
USD/JPY Mid-Day Outlook
Daily Pivots: (S1) 139.29; (P) 139.90; (R1) 140.67; More...
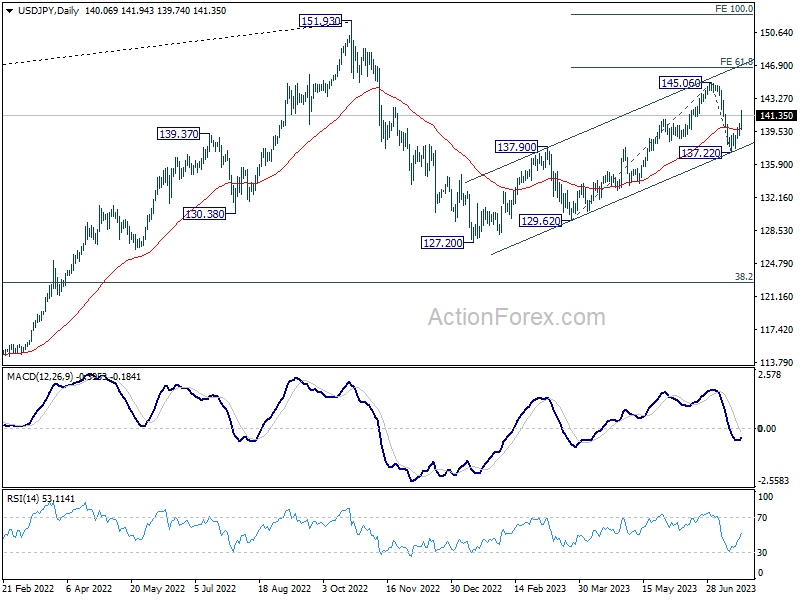
Intraday bias in USD/JPY stays on the upside at this point. Rise from 137.22 should extend to retest 145.05 high first. Firm break there will resume larger rise from 127.20 to 61.8% projection of 129.62 to 127.22 from 145.06 at 146.76 next. On the downside, below 139.74 minor support will bring retest of 137.22 instead.
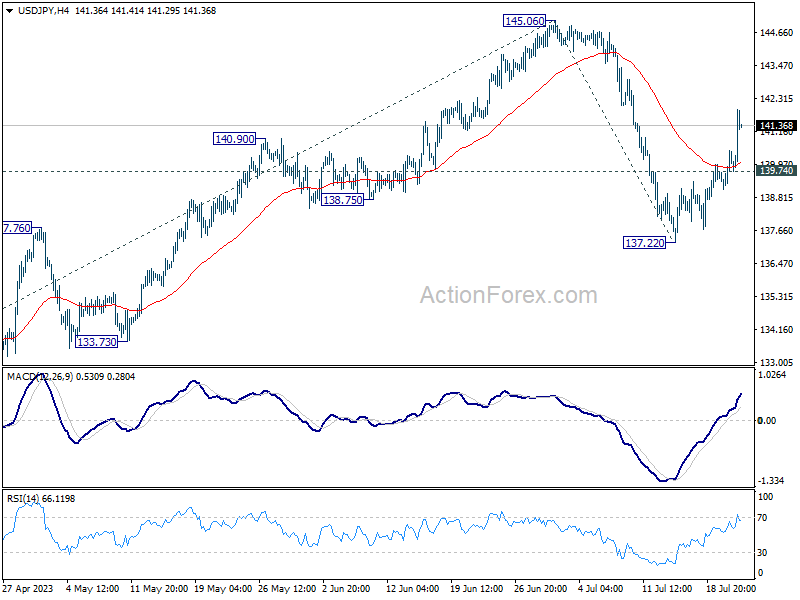
In the bigger picture, overall price actions from 151.93 (2022 high) are views as a corrective pattern. Current development suggests that the second leg (the rise from 127.20) might not be over yet. But even in case of extended rise, strong resistance should be seen from 151.93 to limit upside. Meanwhile, break of 137.22 support should confirm the start of the third leg to 127.20 (2023 low) and below.
Yen Plunges Amidst BoJ’s Speculations; Fresh Selling Seen in Sterling
Japanese Yen experienced a sharp fall today after reports emerged suggesting that BoJ is "leaning towards" maintaining its current yield curve control policy unchanged in the upcoming meeting next week. The development has come in the wake of Japanese inflation data for June, which showed a relatively unchanged yet high level. Notably, 10-year JGB yield is presently trading comfortably below 0.5%, eliminating any necessity even to adjust the yield cap. This has intensified the pressure on Yen, leading to a significant downward shift.
Meanwhile, Canadian Dollar lost ground after release of weaker-than-expected retail sales data. Sterling, which exhibited relative stability earlier today, faced fresh selling pressure in early US session. Despite these developments, Australian Dollar and New Zealand Dollar are currently underperforming even more, edging out only the beleaguered Yen. On the other end of the spectrum, Swiss Franc currently occupies the strongest position for the day, followed by Dollar and the Euro.
Technically, GBP/USD's break of 1.2847 support argues that it's already in correction to rise from 1.2306 at least. Deeper fall would be seen to 55 D EMA (now at 1.2692), or even below. Downside momentum in GBP/USD would be affected by whether EUR/GBP could power through 0.8717 support turned resistance to confirm bullish trend reversal.
In Europe, at the time of writing, FTSE is up 0.29%. DAX is down -0.33%. CAC is up 0.41%. Germany 10-year yield is down -0.0266 at 2.461. Earlier in Asia, Nikkei dropped -0.57%. Hong Kong HSI rose 0.78%. China Shanghai SSE dropped -0.06%. Singapore Strait Times rose 0.12%. Japan 10-year JGB yield rose 0.0063 to 0.466.
Canada retail sales rose 0.2% mom in May, missed expectations
Canada retail sales rose 0.2% mom to CAD 66.0B in May, below expectation of 0.5% mom. Sales increased in five of nine subsectors and were led by increases at motor vehicle and parts dealers (+0.8%) and food and beverage retailers (+1.0%).
Core retail sales—which exclude gasoline stations and fuel vendors and motor vehicle and parts dealers—were unchanged in May.
In volume terms, retail sales increased 0.1%.
UK retail sales volume rose 0.7% mom in Jun, sales value up 0.7% mom
UK retail sales volume rose 0.7% mom in June, well above expectation of 0.2% mom. Retail sales value also rose 0.7% mom. During the month, sales volumes increased across all the main sectors (food, non-food and non-store retailing) except automotive fuel.
Quarterly comparing with the three months to March, sales volume rose 0.4 in the three months to June. Sales value rose 1.7
Comparing with the same month a year ago, sales volume dropped -1.0% yoy. Sales value rose 4.3% yoy.
Japan CPI core ticked up to 3.3% yoy, CPI core-core edged down to 4.2% yoy
Japan's Core CPI, which excludes food, matched expectations, ticked up from 3.2% yoy to 3.3% yoy in June. This marks the 15th month that the inflation reading has remained above BoJ's 2% target.
Meanwhile, CPI core-core, which excludes both food and energy, dropped marginally from 4.3% yoy to 4.2% yoy, aligning with expectations. This slight decrease represents the index's first slowdown since January 2022. Headline CPI edged higher from 3.2% yoy to 3.3% yoy, surpassing 3.2% yoy expectation.
Looking at some details, service prices slightly decelerated from 1.7% yoy to 1.6% yoy. Nevertheless, food prices remained robust, rising by 9.2% yoy. A significant increase was also observed in durable household goods, which rose by 6.7% yoy. Conversely, energy prices fell by -6.6% yoy.
These figures raises the probability of BoJ making an upward revision to its inflation outlook for the current fiscal year, with its two-day policy-setting meeting slated for next week. However, BOJ might still perceive the economy as being far from a virtuous cycle of higher wages, robust consumption, and further price hikes. As Governor Kazuo Ueda indicated earlier this week, if this assumption holds true, "our overall narrative on monetary policy remains unchanged."
USD/JPY Mid-Day Outlook
Daily Pivots: (S1) 139.29; (P) 139.90; (R1) 140.67; More...
Intraday bias in USD/JPY stays on the upside at this point. Rise from 137.22 should extend to retest 145.05 high first. Firm break there will resume larger rise from 127.20 to 61.8% projection of 129.62 to 127.22 from 145.06 at 146.76 next. On the downside, below 139.74 minor support will bring retest of 137.22 instead.
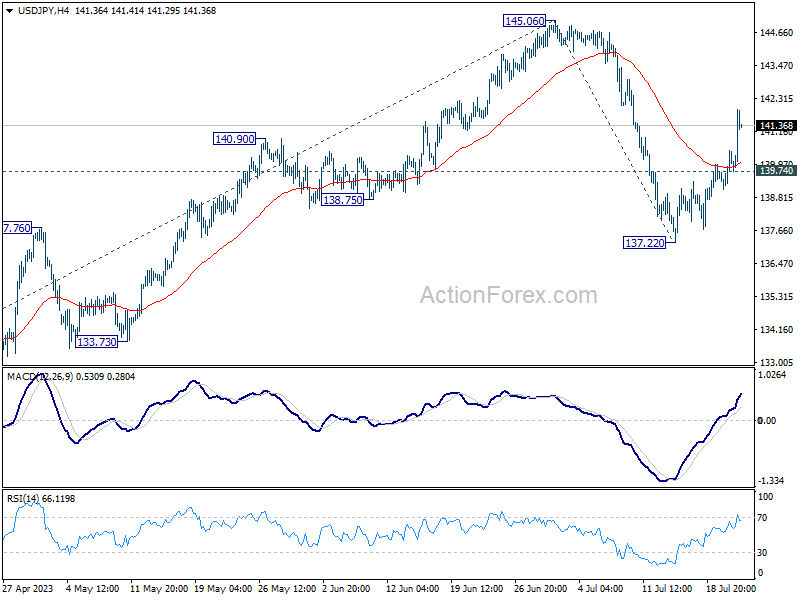
In the bigger picture, overall price actions from 151.93 (2022 high) are views as a corrective pattern. Current development suggests that the second leg (the rise from 127.20) might not be over yet. But even in case of extended rise, strong resistance should be seen from 151.93 to limit upside. Meanwhile, break of 137.22 support should confirm the start of the third leg to 127.20 (2023 low) and below.
Economic Indicators Update
| GMT | Ccy | Events | Actual | Forecast | Previous | Revised |
|---|---|---|---|---|---|---|
| 23:01 | GBP | GfK Consumer Confidence Jul | -30 | -26 | -24 | |
| 23:30 | JPY | National CPI Y/Y Jun | 3.30% | 3.20% | 3.20% | |
| 23:30 | JPY | National CPI Core Y/Y Jun | 3.30% | 3.30% | 3.20% | |
| 23:30 | JPY | National CPI Core-Core Y/Y Jun | 4.20% | 4.20% | 4.30% | |
| 06:00 | GBP | Retail Sales M/M Jun | 0.70% | 0.20% | 0.30% | 0.10% |
| 06:00 | GBP | Public Sector Net Borrowing (GBP) Jun | 17.7B | 20.7B | 19.2B | 15.8B |
| 12:30 | CAD | Retail Sales M/M May | 0.20% | 0.50% | 1.10% | 1.00% |
| 12:30 | CAD | Retail Sales ex Autos M/M May | 0.00% | 0.20% | 1.30% | 1.20% |
| 12:30 | CAD | New Housing Price Index M/M Jun | 0.10% | 0.00% | 0.10% |
Canada retail sales rose 0.2% mom in May, missed expectations
Canada retail sales rose 0.2% mom to CAD 66.0B in May, below expectation of 0.5% mom. Sales increased in five of nine subsectors and were led by increases at motor vehicle and parts dealers (+0.8%) and food and beverage retailers (+1.0%).
Core retail sales—which exclude gasoline stations and fuel vendors and motor vehicle and parts dealers—were unchanged in May.
In volume terms, retail sales increased 0.1%.
EUR/USD Price Analysis: Update on the Market Situation
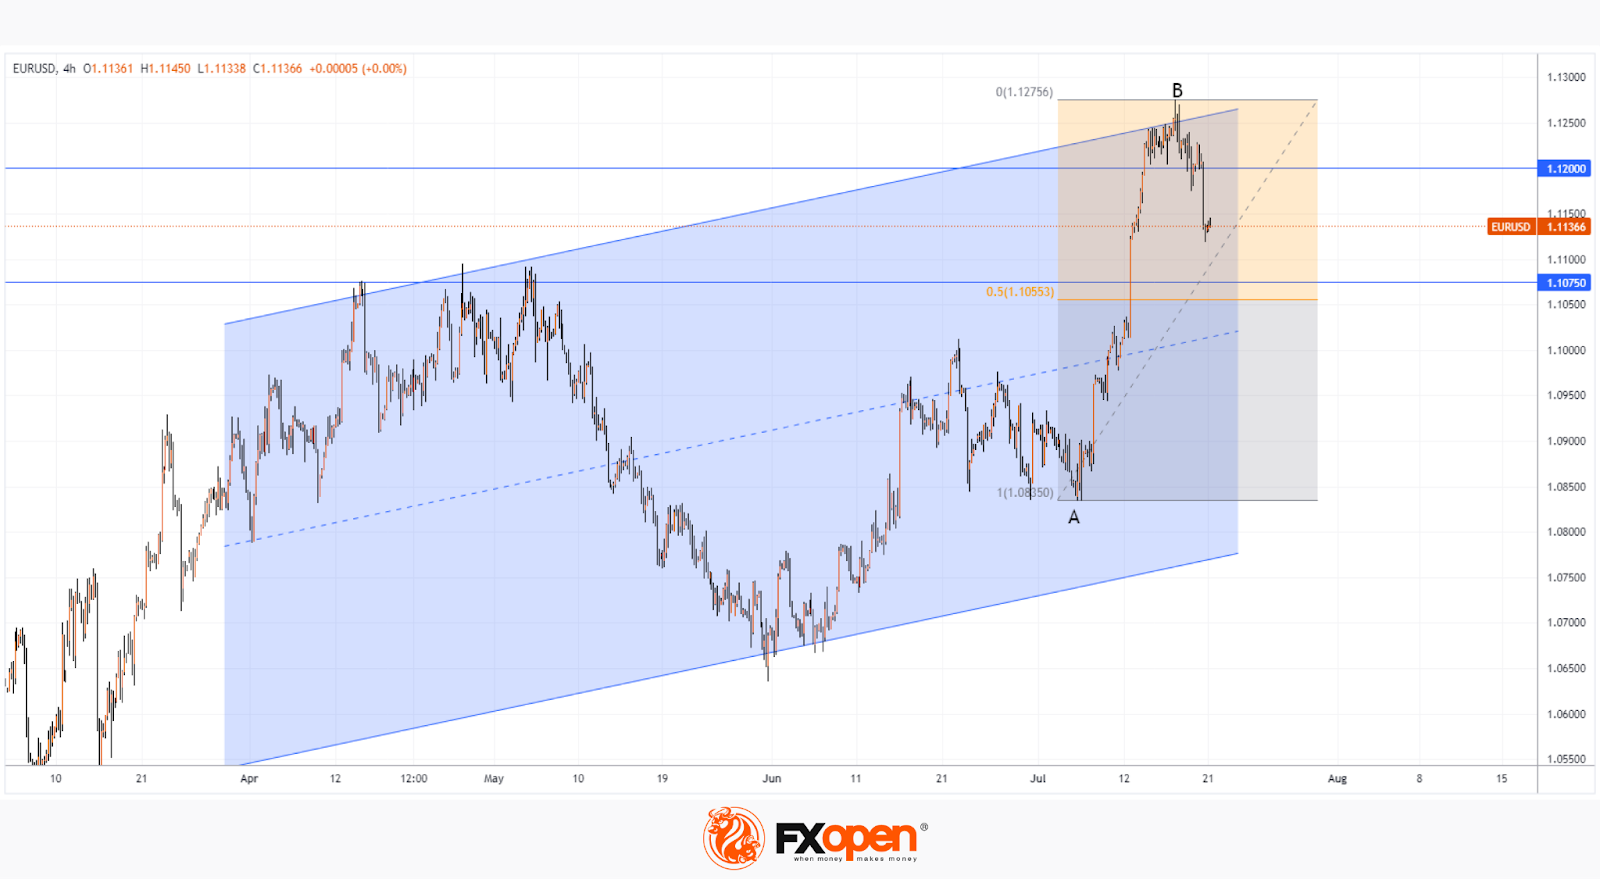
On July 18, we wrote about the vulnerability of the market to a rollback from the block of resistance, which is formed by the level of 1.12 euros per US dollar and the upper line of the rising channel. Since then, the EUR/USD price has fallen by more than 1%.
The most noticeable was yesterday's decline in the price of EUR/USD, which was due, among other things, to the rise in price of the dollar due to a strong report on the US labor market. Weekly data showed that jobless claims fell to a nearly 2-month low.
How deep can the EUR/USD price pull back from the resistance block?
If the decline continues, then, from the point of view of technical analysis, the horizontal level 1.075 can be considered the level at which the bulls can try to change the situation:
- in April-May this level worked as resistance;
- approximately, here passes the Fibonacci line 50% of the growth A→B.
The decision of the ECB to raise interest rates by 25 basis points could lead to bullish momentum in the EUR/USD price. The decision will be announced on July 27.
Crypto Dragged Back to the Support Line on Risk-Off
Market picture
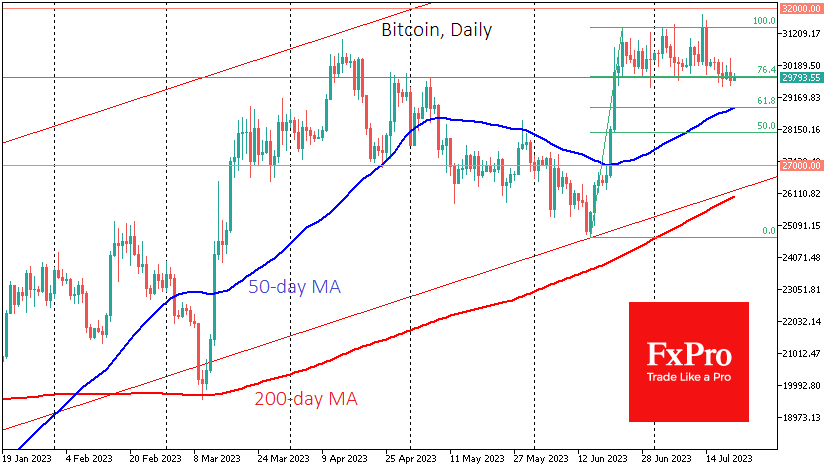
The cryptocurrency market fell 0.3% over the past 24 hours to $1.2 trillion. Bitcoin lost 0.7%, Ethereum lost 0.97%, and top altcoins ranged from -3.4% (Solana) to +4.8% (Polkadot).
Bitcoin failed to develop any local upward momentum and continues to test the lower boundary of its last trading range. Following the sell-off in risk assets and the rise in the dollar, the first cryptocurrency has returned to below $30,000. A failure below opens the door to a deeper correction to $28.9K, where the 61.8% Fibonacci retracement and 50-day MA are concentrated.
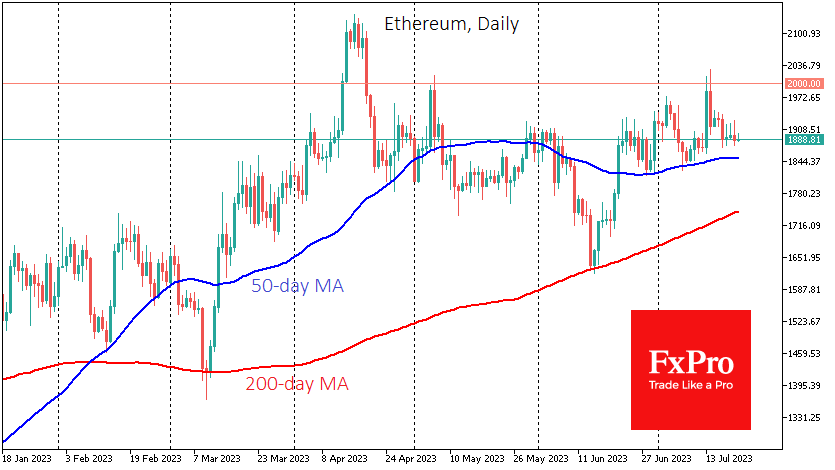
Ethereum has retreated to $1890, the centre of gravity for the past four months. Short-term traders should pay close attention to the momentum near the 50-day average (currently at $1850), as a break below this level could quickly take another $100 off the price.
News background
Spot bitcoin ETFs could increase demand for BTC by as much as $30 billion, NYDIG believes. To achieve this, investments in bitcoin funds should reach the level of gold ETFs, taking volatility into account.
The US Federal Reserve has launched its payment system, FedNow Service, for instant money transfers to bank customers. Earlier, the regulator stressed that FedNow is not linked to the central bank’s digital currency and has yet to decide on the CBDC’s fate.
Kuwait has banned cryptocurrency transactions, including investment and mining. Cryptocurrencies “have no legal status, are not issued or backed by any government, and the prices of these assets are always driven by speculation,” the country’s regulator said in a document.
The UK government has rejected the idea of regulating cryptocurrencies as gambling instruments. The country’s Treasury made a similar proposal in May, arguing that retail trading in digital assets is more akin to betting on sports than investing.
Cable Can See More Weakness After a Rally
Cable has turned lower this week, with a very sharp and impulsive price action on intraday chart, which occurred after the inflation data in the UK; where data is finally coming down. We can see a very strong drop, clearly in five waves from an Elliott wave perspective which is important indication for a change in trend, even if just temporary. As such, I think more weakness will come after the rally in three waves which can even be interesting for potential shorts on bounce.
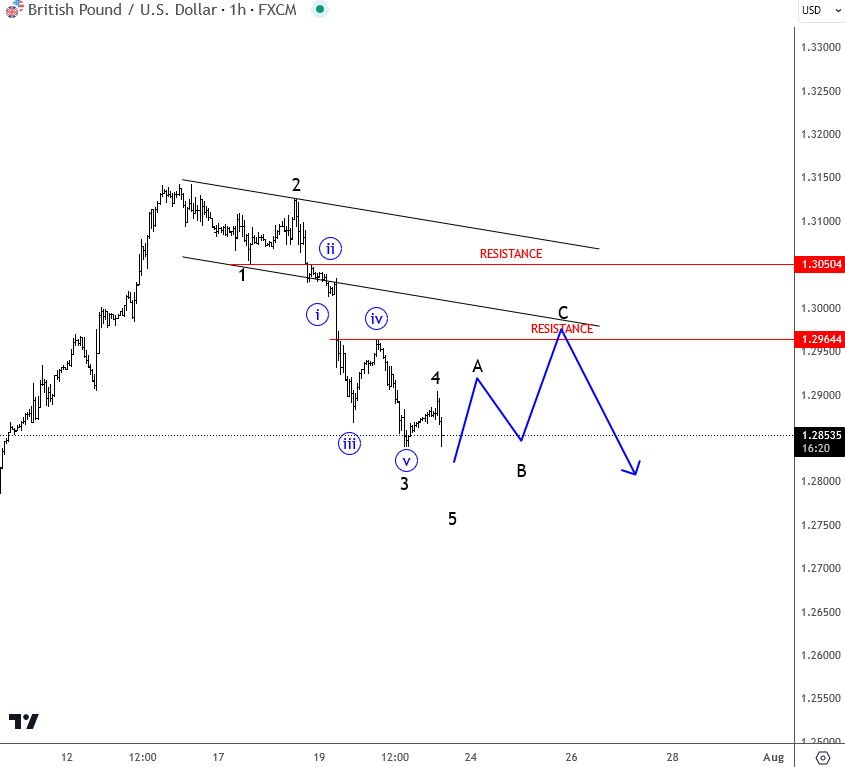
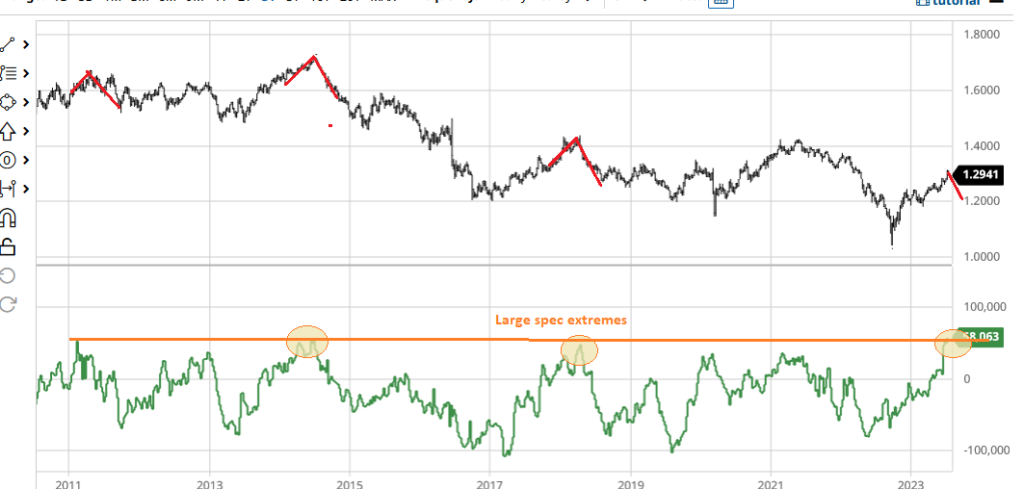
Also, lets not forget on COT data where we can see extremes in positioning of a large speculators, so there can be a new turn in cycle soon, if we respect what happened with the pound when previous reading was that high.