Sample Category Title
Sterling Recovers after Strong Retail Sales; Dollar Slips after Yesterday’s Rebound
British Pound is making broad recoveries following stronger than anticipated retail sales, although signs of a durable rebound remain elusive. Concurrently, Japanese Yen displayed general weakness. Despite solid inflation data from Japan, the figures were not robust enough to force a policy shift from BoJ. Australian and New Zealand Dollars trailed as the next weakest, while Dollar pared some of its gains following yesterday's rally. Canadian Dollar remained mixed, as investors anticipate retail sales data from Canada.
Looking at the week as a whole, Sterling remained one of the worst performers as traders scaled back their bets on aggressive rate hike from BoE following the latest CPI data. New Zealand Dollar fared slightly worse, with Yen and Aussie not far behind. Contrarily, Canadian Dollar emerged as the strongest performer, followed by Dollar, and then Swiss Franc.
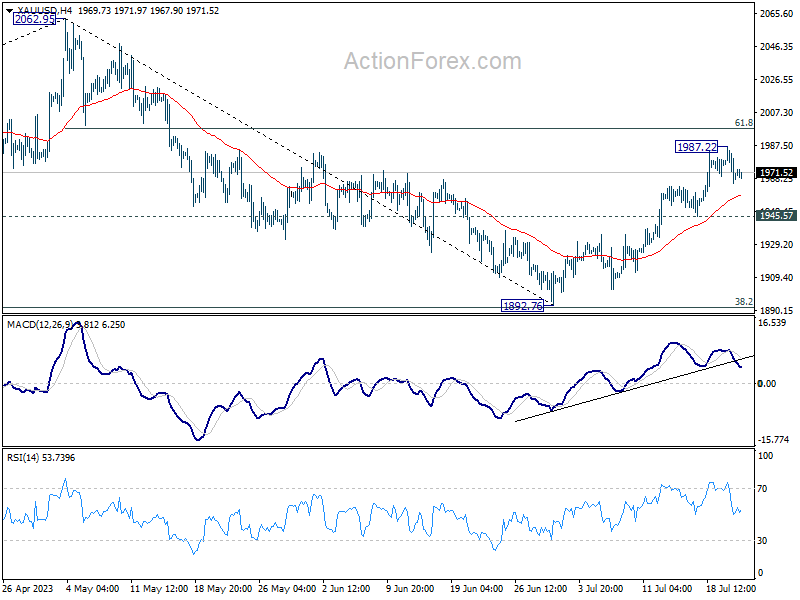
Technically, the breaks of 1.1173 minor support in EUR/USD and 0.8629 minor resistance in USD/CHF argue that Dollar is turned into a consolidation phase. There is no clear sign of reversal for the greenback yet, and thus upside of current recovery could be limited. Gold is also in a retreat after hitting 1987.22. But as long as 1945.57 support holds, further rise is in favor to 2000 handle and above after the consolidation completes.
In Asia, Nikkei closed down -0.57%. Hong Kong HSI is up 0.53%. China Shanghai SSE is down -0.05%. Singapore Strait Times is down -0.05%. Japan 10-year JGB yield is up 0.0198 at 0.479. Overnight, DOW rose 0.47%. S&P 500 dropped -0.68%. NASDAQ dropped -2.05%. 10-year yield rose 0.112 to 3.854.
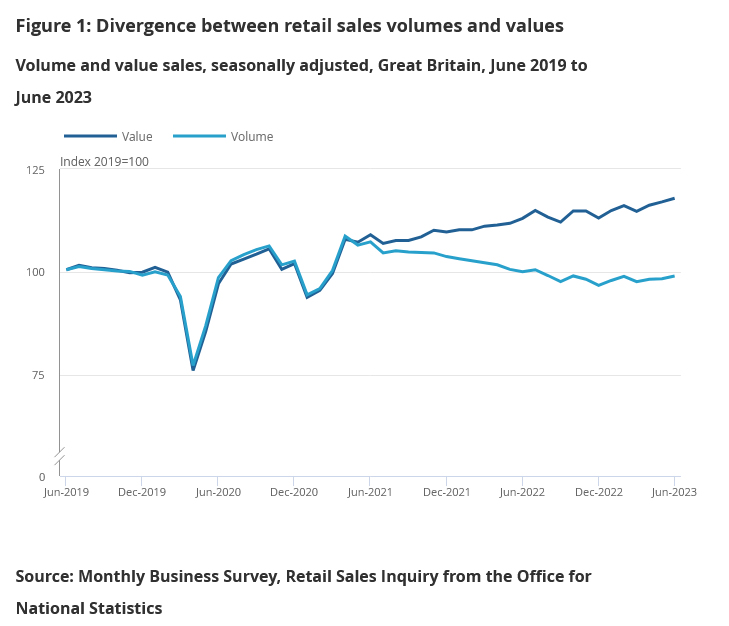
UK retail sales volume rose 0.7% mom in Jun, sales value up 0.7% mom
UK retail sales volume rose 0.7% mom in June, well above expectation of 0.2% mom. Retail sales value also rose 0.7% mom. During the month, sales volumes increased across all the main sectors (food, non-food and non-store retailing) except automotive fuel.
Quarterly comparing with the three months to March, sales volume rose 0.4 in the three months to June. Sales value rose 1.7
Comparing with the same month a year ago, sales volume dropped -1.0% yoy. Sales value rose 4.3% yoy.
Japan CPI core ticked up to 3.3% yoy, CPI core-core edged down to 4.2% yoy
Japan's Core CPI, which excludes food, matched expectations, also ticked up from 3.2% yoy to 3.3% yoy. This marks the 15th month that the inflation reading has remained above BoJ's 2% target.
Meanwhile, CPI core-core, which excludes both food and energy, dropped marginally from 4.3% yoy to 4.2% yoy, aligning with expectations. This slight decrease represents the index's first slowdown since January 2022. Headline CPI edged higher from 3.2% yoy to 3.3% yoy in June, surpassing 3.2% yoy expectation.
Looking at some details, service prices slightly decelerated from 1.7% yoy to 1.6% yoy. Nevertheless, food prices remained robust, rising by 9.2% yoy. A significant increase was also observed in durable household goods, which rose by 6.7% yoy. Conversely, energy prices fell by -6.6% yoy.
These figures raises the probability of BoJ making an upward revision to its inflation outlook for the current fiscal year, with its two-day policy-setting meeting slated for next week. However, BOJ might still perceive the economy as being far from a virtuous cycle of higher wages, robust consumption, and further price hikes. As Governor Kazuo Ueda indicated earlier this week, if this assumption holds true, "our overall narrative on monetary policy remains unchanged."
NASDAQ poised for deeper correction
US stocks ended mixed overnight, driven primarily by disparate earnings results. DOW registered its first 9-day rally since 2017, gaining 0.47%, largely boosted by better-than-expected earnings results from pharmaceutical giant Johnson & Johnson. On the other hand, the tech-heavy NASDAQ slipped -2.05% due to disappointing results from streaming giant Netflix and electric carmaker Tesla.
The notable pullback in NASDAQ suggests that US stock markets could be broadly transitioning into a consolidation phase. This shift happens in anticipation of the FOMC rate decision scheduled for next week, followed by crucial employment data in the subsequent week.
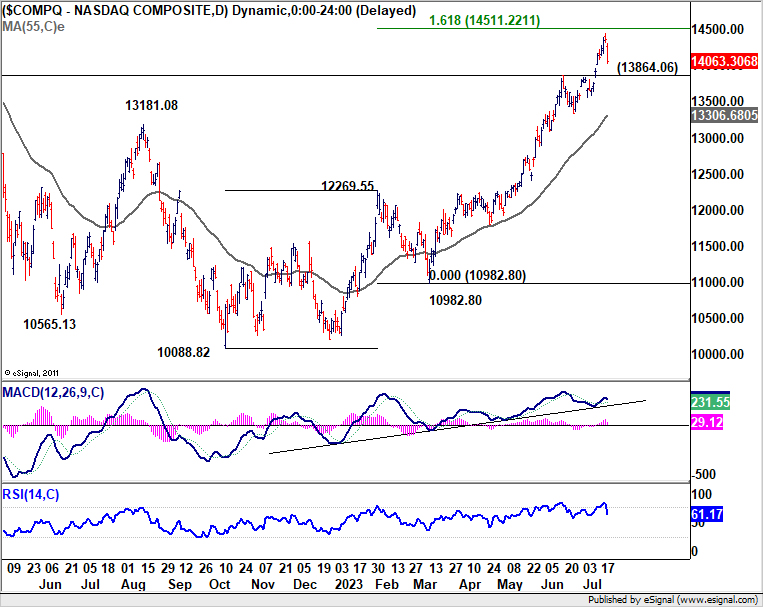
From a technical perspective, NASDAQ could be bracing for a deeper correction, given that it was already close to 161.8% projection of 10088.82 to 12269.55 from 10982.80 at 14511.22. Break of 13864.06 resistance turned support would likely trigger deeper fall to 55 D EMA (now at 13306.68).
Should this scenario transpire, it should confirm a near term shift in risk sentiment, potentially providing a boost to Dollar and extending its current rebound.
Looking ahead
Canada retail sales is the main feature for the rest of the day, while new housing price index will also be released.
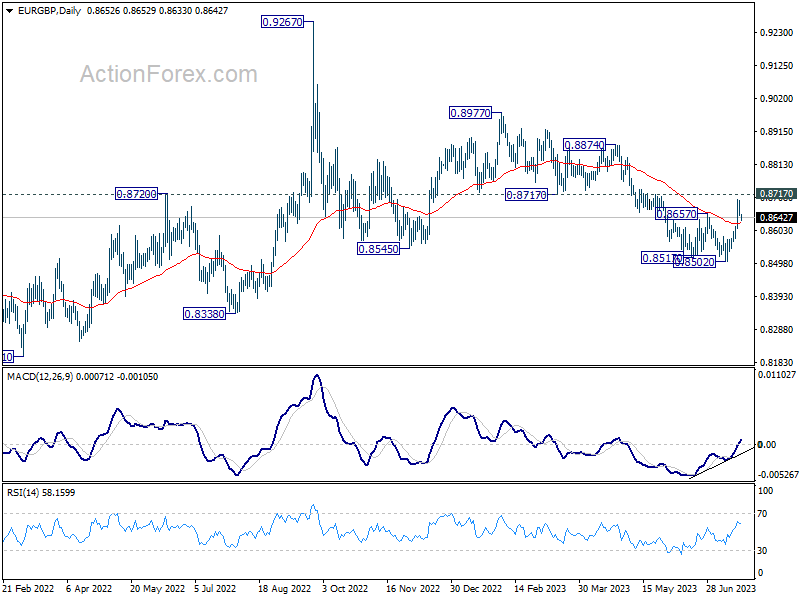
EUR/GBP Daily Outlook
Daily Pivots: (S1) 0.8633; (P) 0.8666; (R1) 0.8682; More...
Intraday bias in EUR/GBP is turned neutral with current retreat. Outlook is unchanged that fall from 0.8977 might have completed its five-wave sequence. Firm break of 0.8717 support resistance will solidify this bullish case and target 0.8977 resistance next. On the downside, though, below 0.8619 minor support will mix up the outlook and turn bias back to the downside for retesting 0.8502 low.
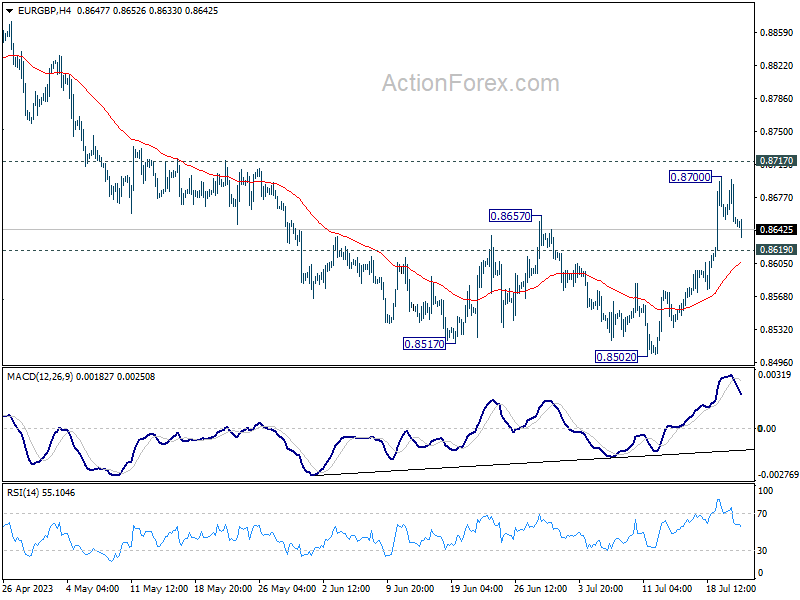
In the bigger picture, the down trend from 0.9267 (2022 high) is seen as part of the long term range pattern from 0.9499 (2020 high). Firm break of 0.8717 support turned resistance will argue that it has completed with three waves down to 0.8502. Further break of 0.8977 will bring retest o f0.9267 high. Nevertheless, break of 0.8502 will resume the decline towards 0.8201 (2022 low).
Economic Indicators Update
| GMT | Ccy | Events | Actual | Forecast | Previous | Revised |
|---|---|---|---|---|---|---|
| 23:01 | GBP | GfK Consumer Confidence Jul | -30 | -26 | -24 | |
| 23:30 | JPY | National CPI Y/Y Jun | 3.30% | 3.20% | 3.20% | |
| 23:30 | JPY | National CPI Core Y/Y Jun | 3.30% | 3.30% | 3.20% | |
| 23:30 | JPY | National CPI Core-Core Y/Y Jun | 4.20% | 4.20% | 4.30% | |
| 06:00 | GBP | Retail Sales M/M Jun | 0.70% | 0.20% | 0.30% | 0.10% |
| 06:00 | GBP | Public Sector Net Borrowing (GBP) Jun | 17.7B | 20.7B | 19.2B | 15.8B |
| 12:30 | CAD | Retail Sales M/M May | 0.50% | 1.10% | ||
| 12:30 | CAD | Retail Sales ex Autos M/M May | 0.20% | 1.30% | ||
| 12:30 | CAD | New Housing Price Index M/M Jun | 0.00% | 0.10% |
Stocks, Bonds Downbeat on Earnings Disappointment, Jobs Data
Stocks and bonds in the US fell yesterday. Stocks fell, sent down by a nearly 10% plunge in Tesla and more than a 8% dive in Netflix. Chip stocks fell as well around the world as TSM cut its annual outlook for revenue due to geopolitical tensions and weak global demand, and announced that its Arizona production plant will be delayed due to shortage of qualified labour that could build the plant. TSM shares fell 5% to below $100 a share in NYSE, while Nvidia lost more than 3% as investors started wondering whether the chipmaker will be able to deliver the $11bn revenue estimate that it announced last quarter! All in all, the S&P500 retreated 0.68% and Nasdaq 100 lost 2.28%.
Bonds, on the other hand, fell as well yesterday, as unemployment claims unexpectedly fell in the US. That strengthened the Federal Reserve (Fed) hawks’ hand yesterday on the reasoning that the US jobs market just won’t loosen and challenge the latest expectation where investors and economists, including the ex-Fed Chair Ben Bernanke, think that the Fed’s next week rate hike will also be its last in this tightening cycle due to easing price pressures. There is no expectation of another hike in September, while some 20% predict that there could be another hike in November. The rising question is, when will the Fed start cutting rates, in January, or in March? It will depend on inflation, really. The rising geopolitical tensions between Russia and Ukraine in the Black Sea, where Ukraine also said that ships going to Russian ports may be military targets threatens the crop trade. Wheat futures jumped past their 200-DMA yesterday and are up by more than 20% since last week. If that’s not enough, India bans shipments of non-basmati rice to contain domestic prices and rice futures are also upbeat right now. While succeed in crude tests the 200-DMA to the upside, and technicals hint that the bulls could succeed breaking the resistance this time, as trend and momentum indicators are positive, and we are not in the overbought market just yet. So there is room for further recovery. And the European nat gas futures gained nearly 4% yesterday. So all these jumps in commodity prices will certainly show up in next inflation figures as the favourable base effect will also gently fade away.
The US dollar index is better bid after hitting the lowest levels since April earlier this week. The US dollar index is up from its recent lows but is still at the lowest levels seen this year, the EURUSD is down below the 1.12 mark, on the back of a broadly stronger US dollar, and a lack of consensus. In one hand, the European Central Bank (ECB) members said that a 2nd rate hike following the next ECB hike is not guaranteed. On the other hand, the higher-than-expected core inflation and the positive revision in growth figures leave the ECB enough space to stay on a hawkish policy path. We will likely see a rangebound EURUSD between the 1.10-1.12 range into next week’s policy meeting. Gold is upbeat on the back of rising geopolitical tensions as the price of an ounce stands around the $1970 this morning, while the USDJPY tests the 140 mark and the 50-DMA, after inflation in Japan came in higher than last month but softer than the expectations, and kept investors pricing the persistent divergence between dovish Bank of Japan (BoJ) and sufficiently hawkish Fed expectations.
One place where the doves are also very persistent is Turkey. The Central Bank of Turkey (CBT) increased its policy rate by 250bp at yesterday’s policy meeting, versus 500bp hike expected by analysts. This is Turkey’s new economic team’s – who was supposed to normalize policy and regain investor confidence – second policy meeting and it’s the second time the rate hike is well below expectations. Inflation on Turkey on the other hand will be skyrocketing in the coming releases as the lira took a dive since May. Official inflation, which fell below 40% in June, will likely spike above 50% in the coming readings, and if the CBT normalizes policy at the current speed, the divergence between where the Turkish policy rates will be, and where they should be will keep the lira under further pressure. And of course, the softer than expected action from the CBT’s new team will hardly restore investor confidence and remedy worries that the CBT decisions remain highly influenced by political pressure. The USDTRY rallied by around 40% since May and risks remain comfortably tilted to the upside with the next targets sitting at 28, and 30 levels. Note that the USDTRY is expected to jump by chunks as the CBT relaxes FX interventions from time to time to let the lira find a fair market valuation after a year-and-a-half long heavy FX purchases. Therefore, the timing of price moves are unknown, but there is little doubt about the direction.
UK retail sales volume rose 0.7% mom in Jun, sales value up 0.7% mom
UK retail sales volume rose 0.7% mom in June, well above expectation of 0.2% mom. Retail sales value also rose 0.7% mom. During the month, sales volumes increased across all the main sectors (food, non-food and non-store retailing) except automotive fuel.
Quarterly comparing with the three months to March, sales volume rose 0.4 in the three months to June. Sales value rose 1.7
Comparing with the same month a year ago, sales volume dropped -1.0% yoy. Sales value rose 4.3% yoy.
Technical Outlook and Review
DXY:
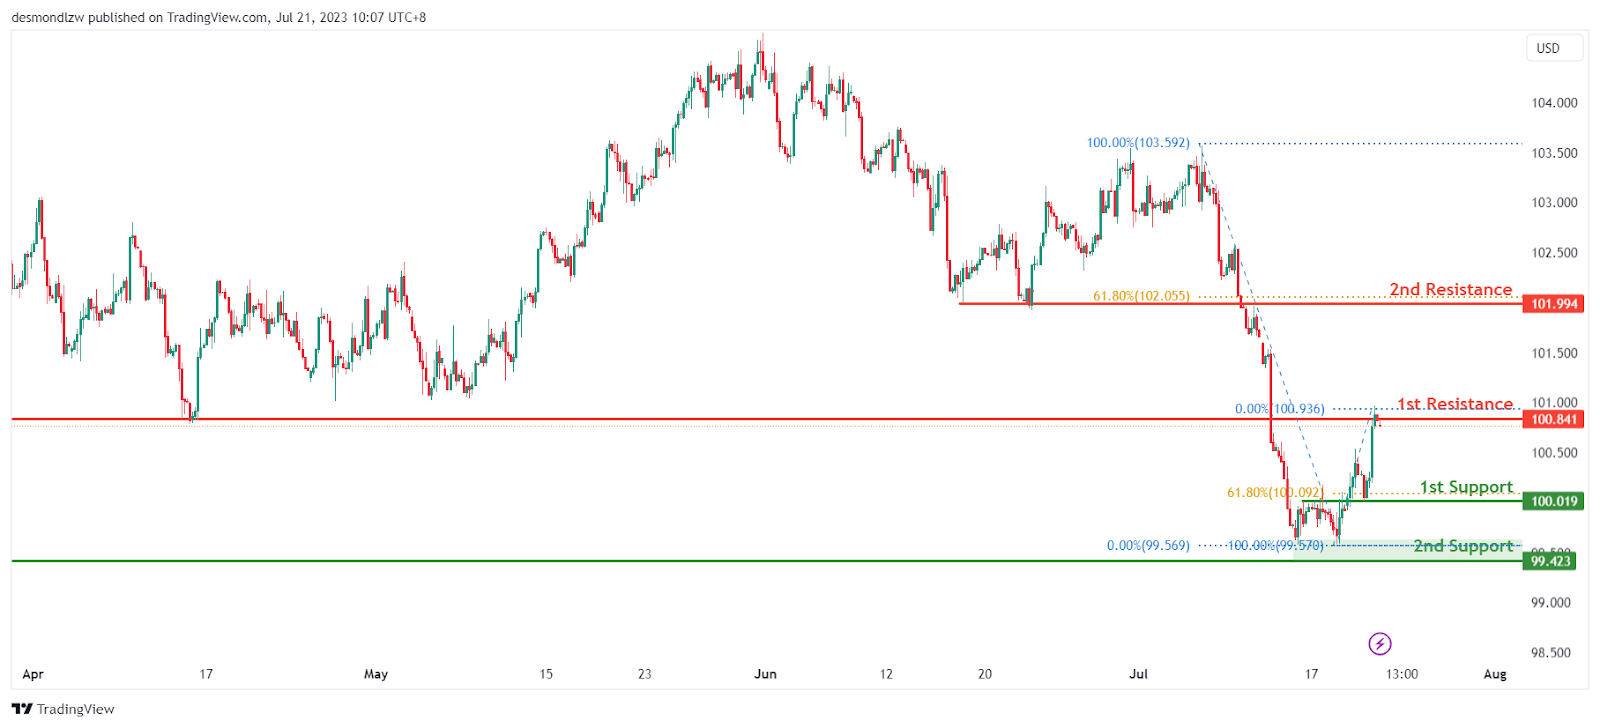
The chart for the DAY instrument indicates a prevailing bearish momentum, suggesting a potential continuation of the downward movement towards the 1st support level. This support level, located at 100.01, holds significance as an overlap support and aligns with the 61.80% Fibonacci retracement. Furthermore, the 2nd support level at 99.42 also acts as an overlap support.
On the other hand, if the price manages to reverse its bearish course, it could face resistance at the 1st resistance level of 100.84, which is identified as an overlap resistance. Additionally, the 2nd resistance level at 101.99 serves as a pullback resistance and coincides with the 61.80% Fibonacci retracement. These resistance levels may impede further upward movement.
EUR/USD:
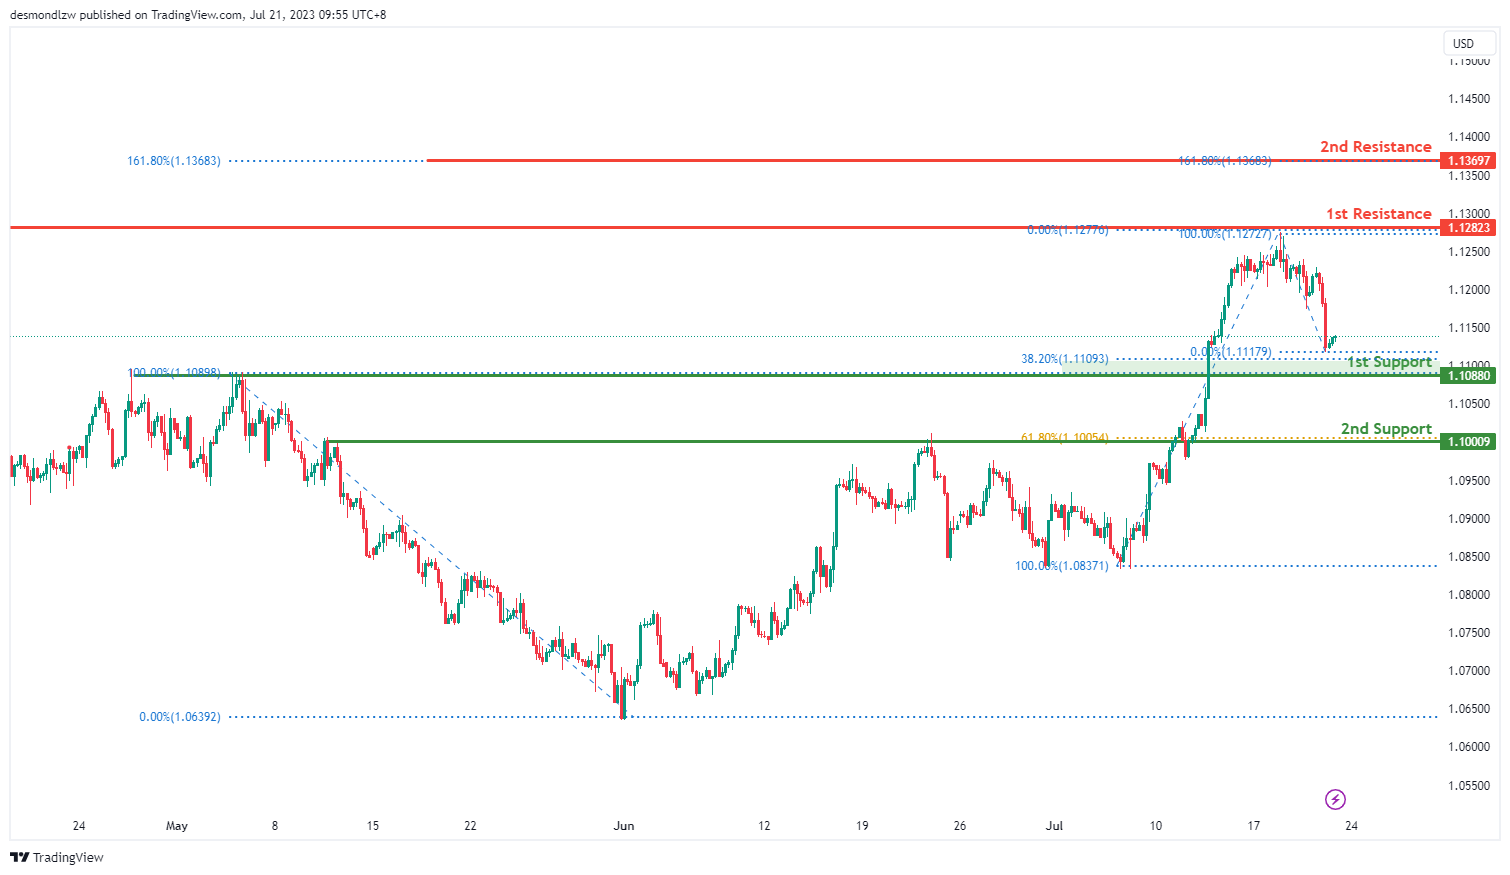
The EUR/USD chart shows a bullish overall momentum, indicating a potential continuation of the upward movement towards the 1st resistance level. The 1st support level at 1.1088 is considered a pullback support, coinciding with the 38.20% Fibonacci retracement. Additionally, the 2nd support level at 1.1000 acts as another pullback support, aligning with the 61.80% Fibonacci retracement.
On the upside, the 1st resistance level at 1.1282 represents a significant swing high resistance. Furthermore, the 2nd resistance level at 1.1369 corresponds to the 161.80% Fibonacci extension, adding to its significance.
EUR/JPY:
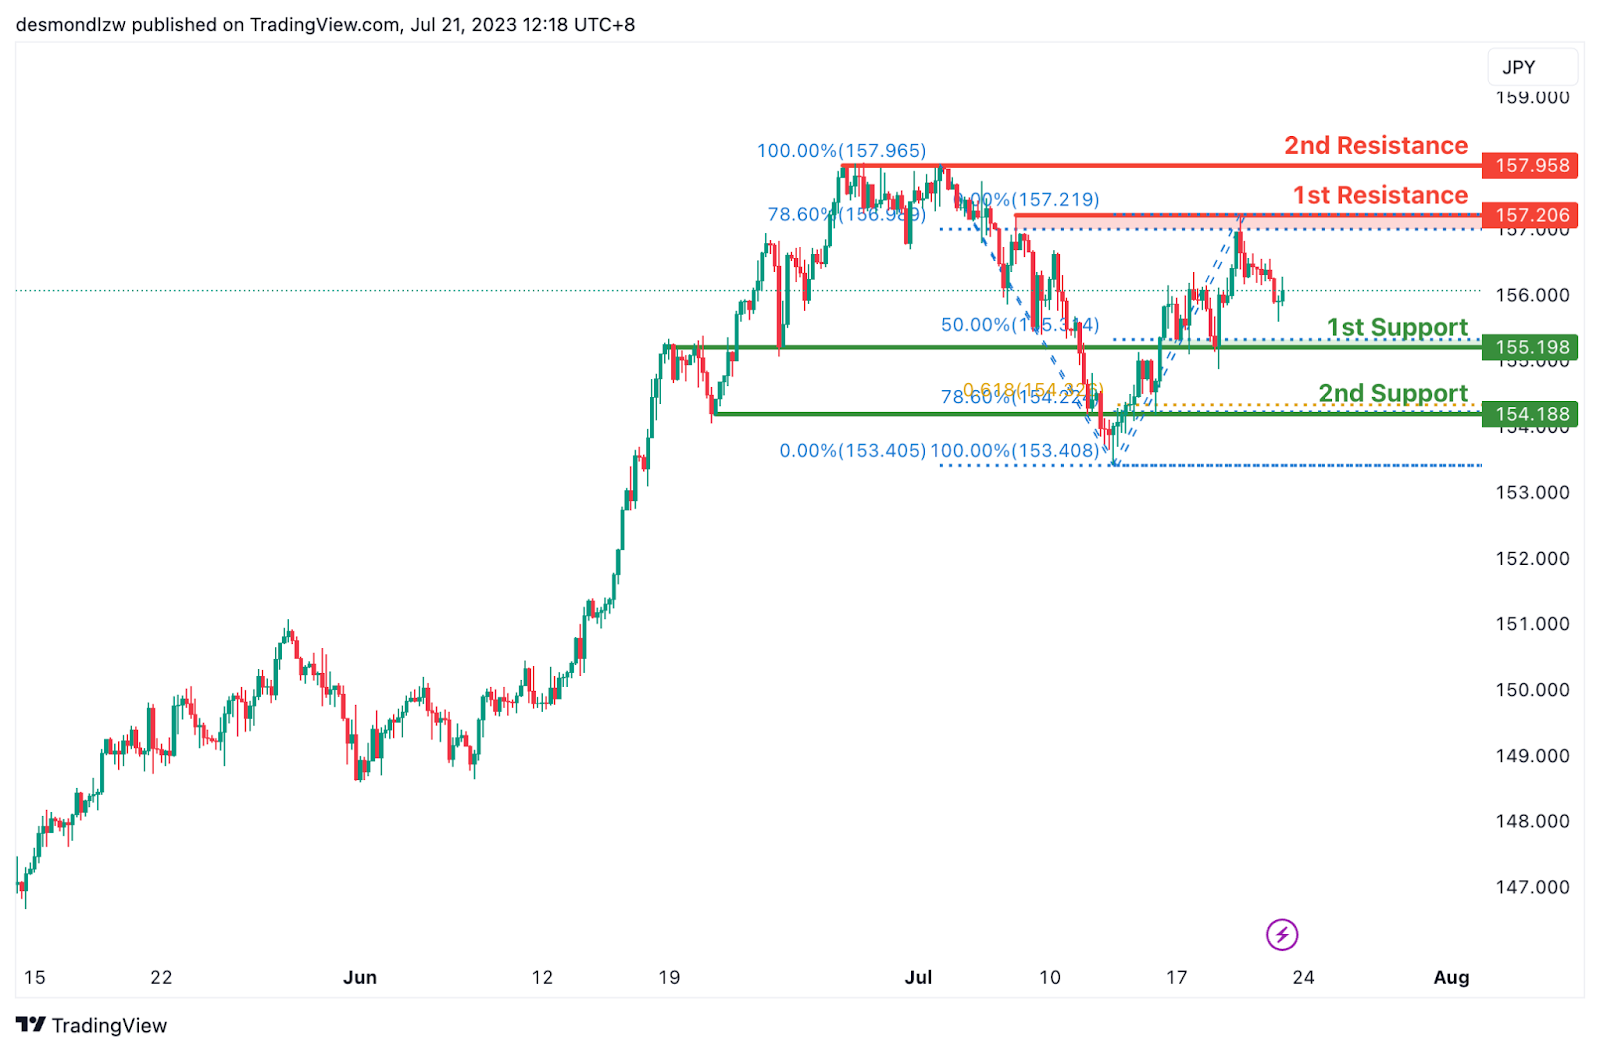
The EUR/JPY chart displays a bearish momentum, suggesting a potential continuation of the downward movement towards the 1st support level at 155.19. This support level aligns with the 50% Fibonacci retracement and serves as an overlap support.
If the price continues to decline, the 2nd support at 154.18 becomes significant as it aligns with the 78.60% Fibonacci retracement and the 61.80% Fibonacci projection, indicating Fibonacci confluence.
On the upside, the 1st resistance at 157.20 is a notable multi-swing high resistance, coinciding with the 78.60% Fibonacci retracement.
Furthermore, the 2nd resistance at 157.95 also acts as a multi-swing high resistance. These resistance levels could potentially impede the price’s upward movement.
EUR/GBP:
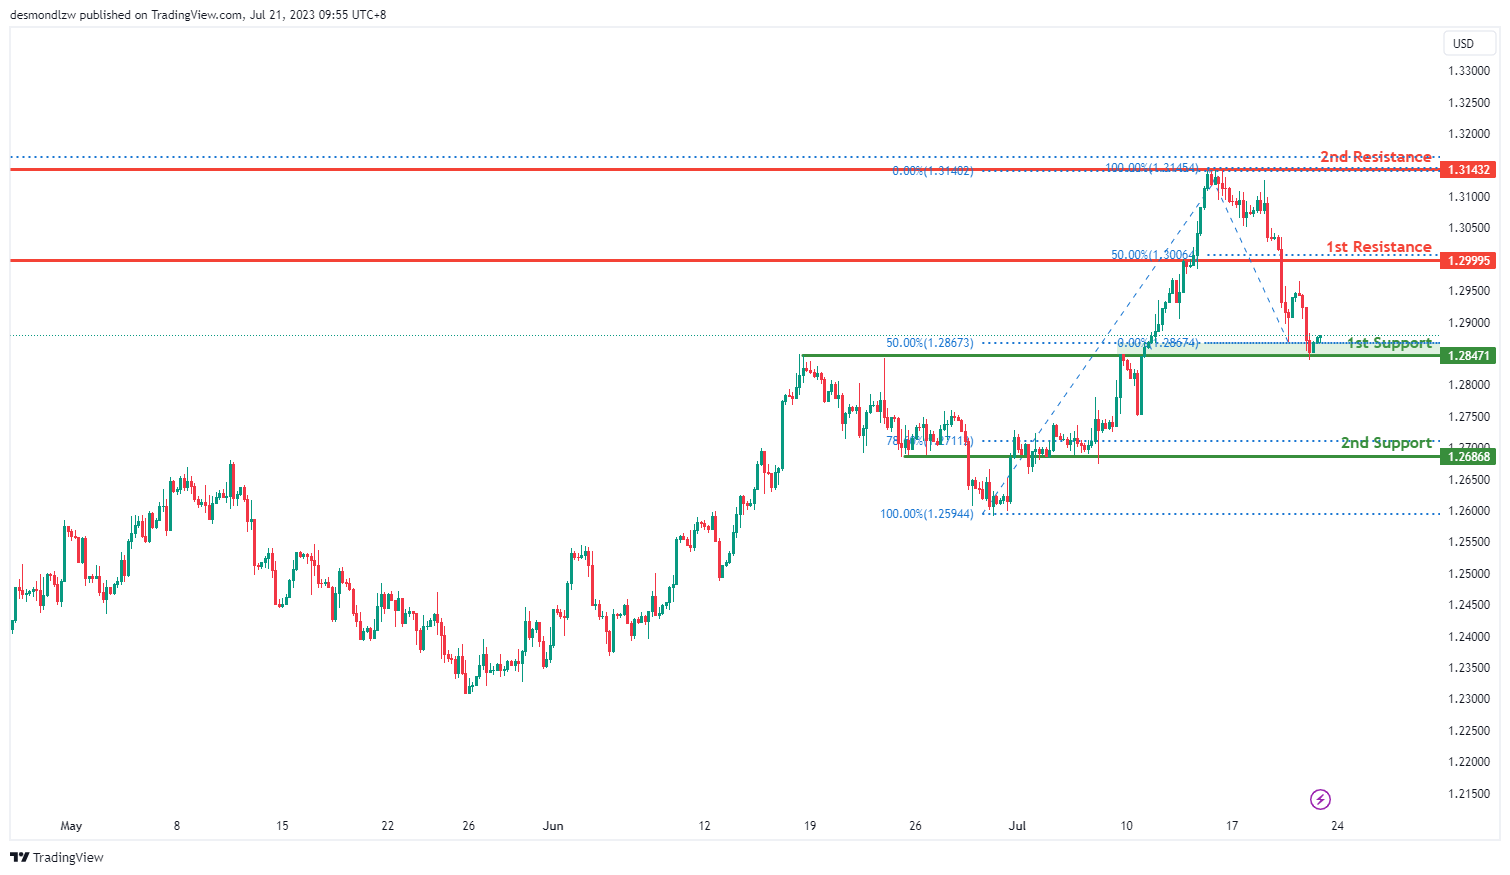
The EUR/GBP chart demonstrates a bullish momentum, suggesting the potential for a bullish bounce off the 1st support level and a subsequent move towards the 1st resistance level.
The 1st support at 0.8649 acts as a pullback support, coinciding with the 23.60% Fibonacci retracement. Additionally, the 2nd support at 0.8614 serves as an overlap support, aligning with the 50% Fibonacci retracement and the 61.80% Fibonacci projection, indicating Fibonacci confluence.
On the upside, the 1st resistance at 0.8686 represents a multi-swing high resistance, coinciding with the 50% Fibonacci retracement.
Furthermore, the 2nd resistance at 0.8730 acts as an overlap resistance, aligned with the 61.80% Fibonacci retracement. These resistance levels may impede the price’s upward movement.
GBP/USD:
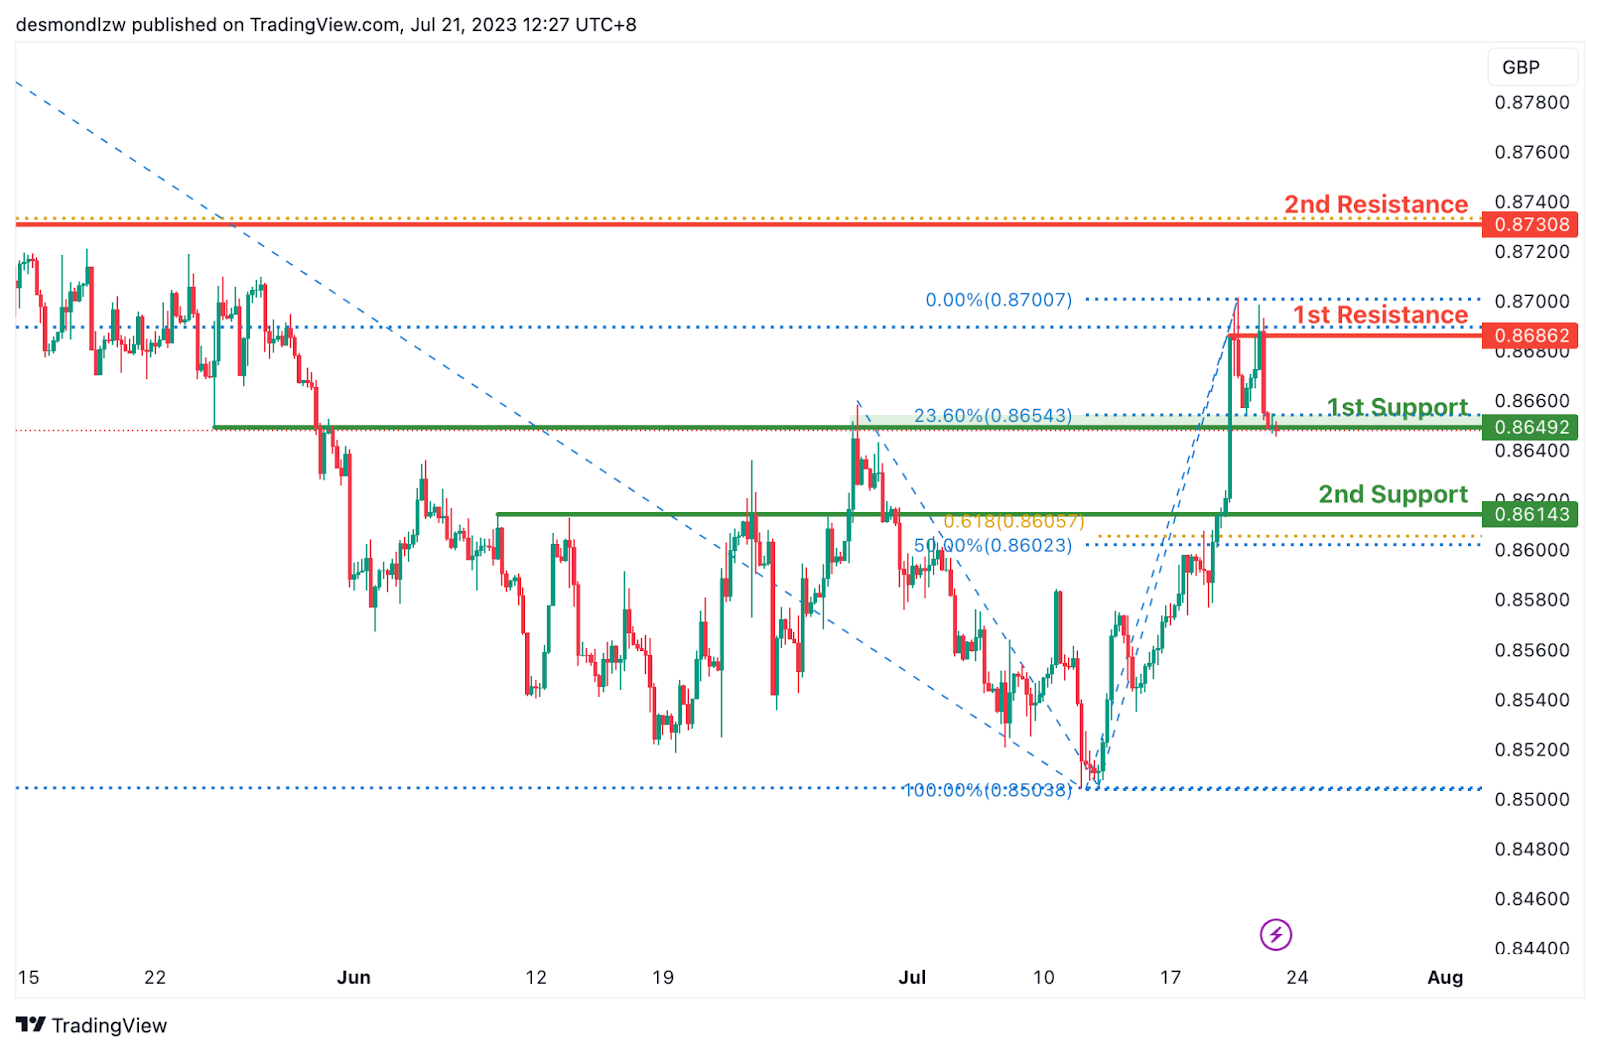
The GBP/USD chart indicates a bullish overall momentum, suggesting a potential continuation of the upward movement towards the 1st resistance level. The 1st support level at 1.2847 is an overlap support, coinciding with the 50% Fibonacci retracement, while the 2nd support level at 1.2686 is also an overlap support, aligning with the 78.60% Fibonacci retracement.
On the upside, the 1st resistance level at 1.2999 is considered a pullback resistance, corresponding to the 50% Fibonacci retracement. Additionally, the 2nd resistance level at 1.3143 is a multi-swing high resistance. These levels may act as barriers to the price’s upward movement.
GBP/JPY:
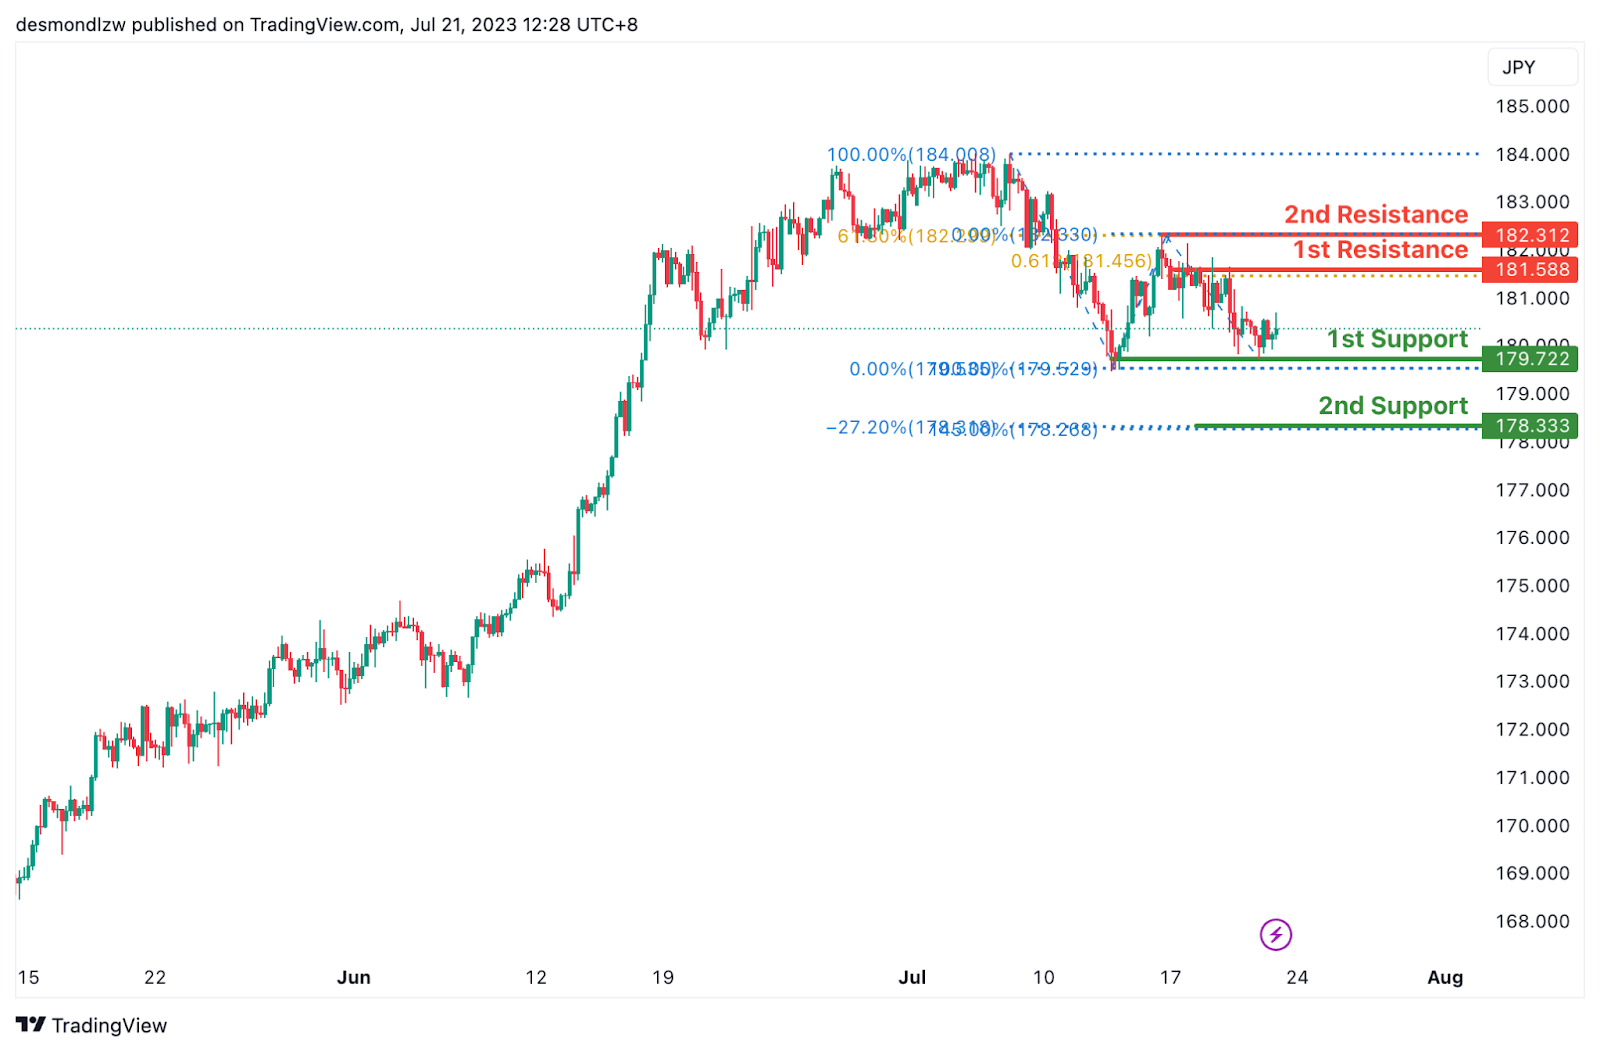
The GBP/JPY chart exhibits a bullish momentum, suggesting the potential for a bullish bounce off the 1st support level and a subsequent move towards the 1st resistance level.
The 1st support at 179.72 is a multi-swing low support, indicating its significance in providing potential price stability. Additionally, the 2nd support at 178.33 aligns with the -27% Fibonacci expansion and the 145.00% Fibonacci extension, highlighting Fibonacci confluence and reinforcing its role as a support level.
On the upside, the 1st resistance at 181.58 represents a multi-swing high resistance, coinciding with the 61.80% Fibonacci projection. Furthermore, the 2nd resistance at 182.31 acts as a swing high resistance, aligning with the 61.80% Fibonacci retracement. These resistance levels may pose challenges to the price’s upward movement.
USD/CHF:
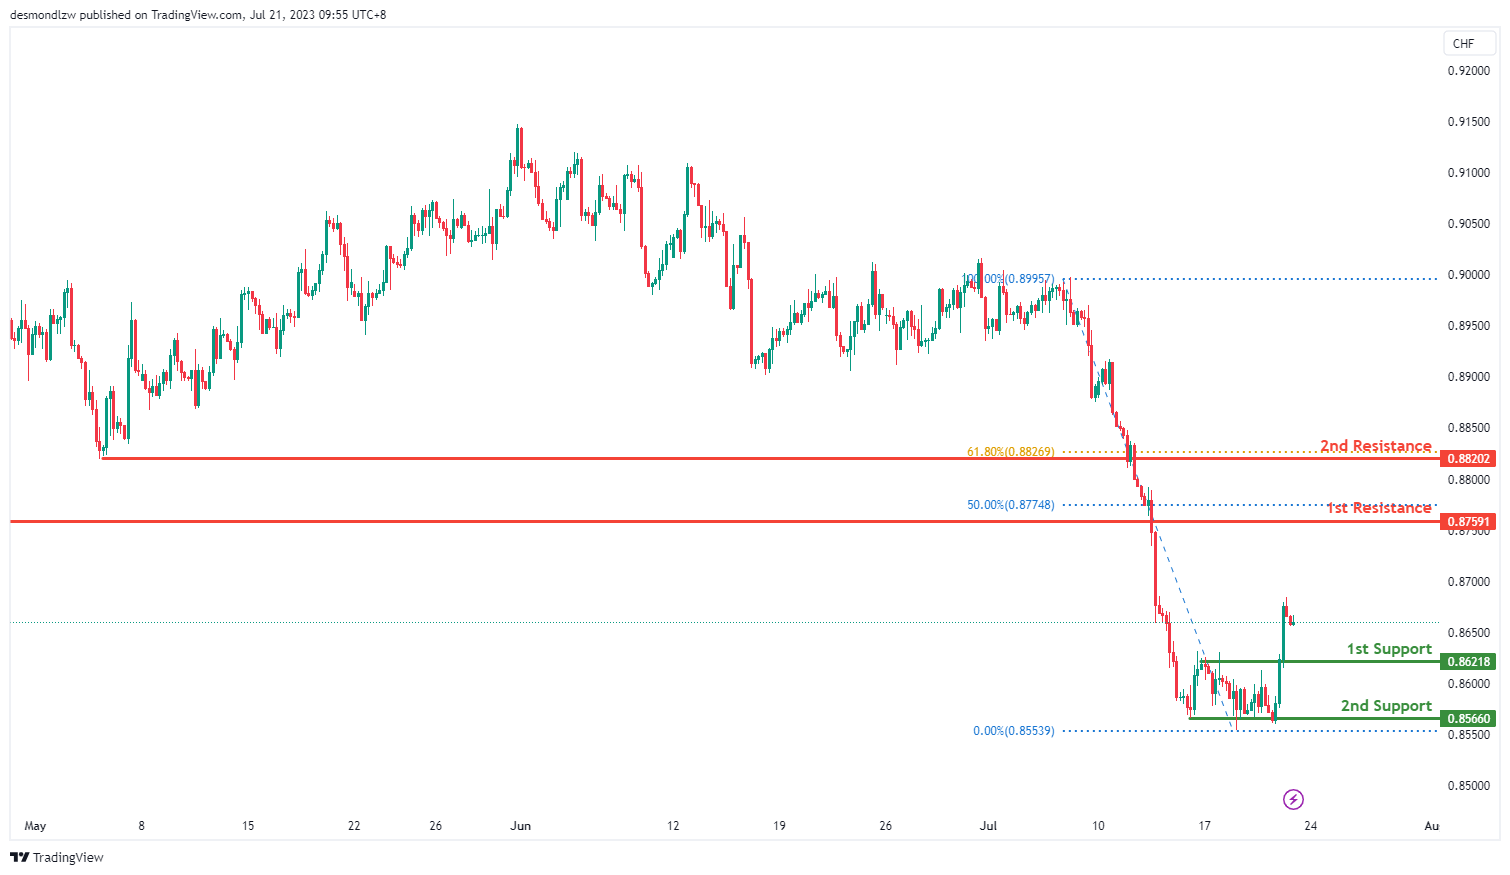
.The USD/CHF chart demonstrates a bullish overall momentum, indicating a potential continuation of the upward movement towards the 1st resistance level. The 1st support at 0.8621 serves as a pullback support, while the 2nd support at 0.8566 is identified as a multi-swing low support.
On the upside, the 1st resistance level at 0.8759 is considered a pullback resistance, coinciding with the 50% Fibonacci retracement. Additionally, the 2nd resistance level at 0.8820 is a pullback resistance, aligning with the 61.80% Fibonacci retracement. These resistance levels may impede the price’s upward movement.
USD/JPY:
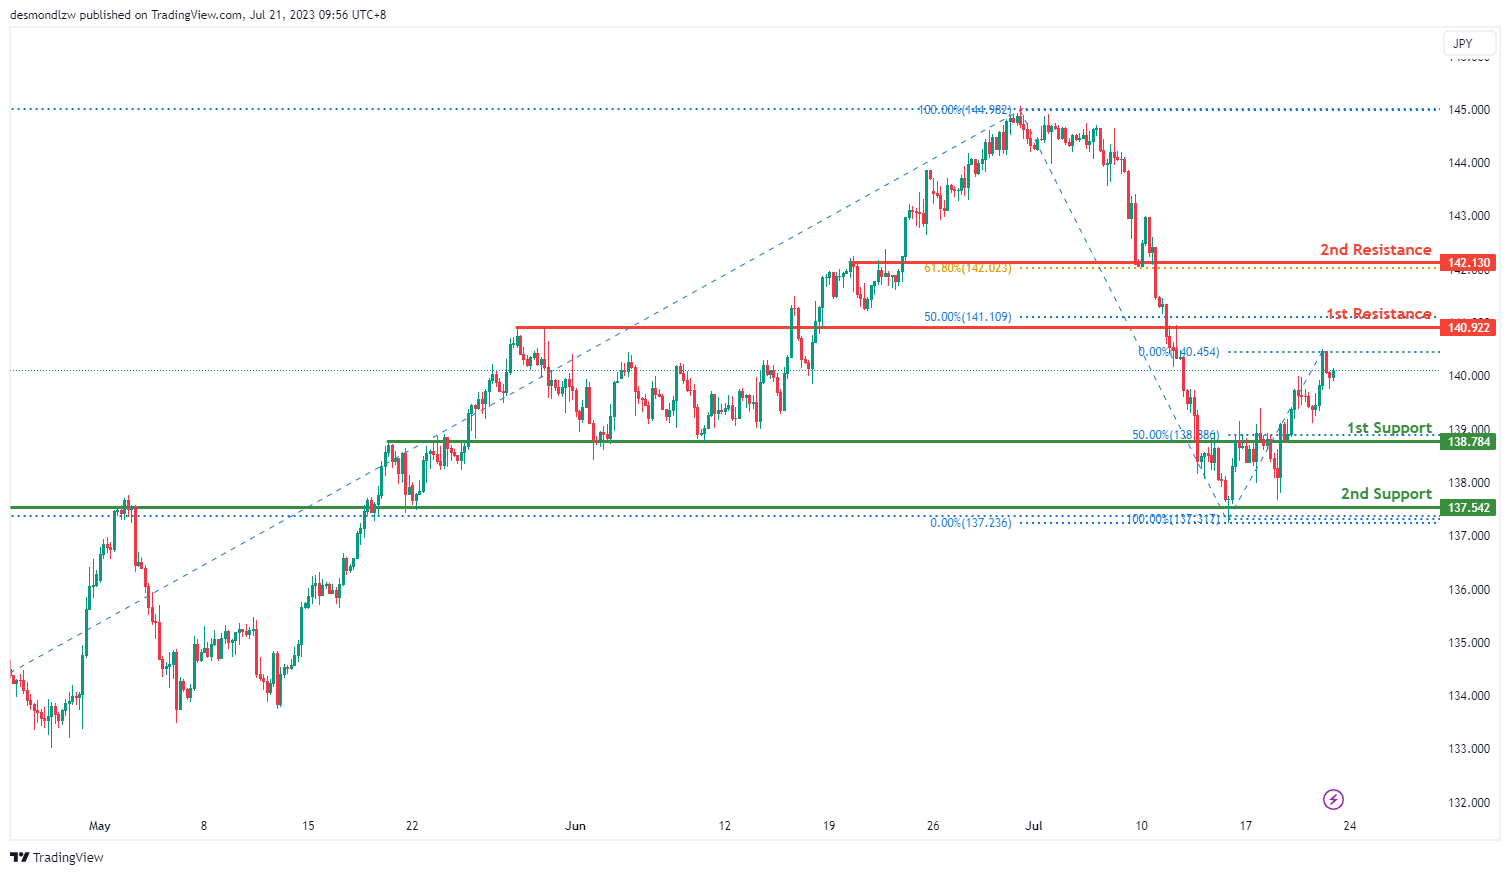
The USD/JPY chart demonstrates a bullish overall momentum, indicating a potential continuation of the upward movement towards the 1st resistance level. The 1st support at 138.7800 is recognized as an overlap support, coinciding with the 50% Fibonacci retracement. Additionally, the 2nd support at 13754.0000 acts as another overlap support.
On the upside, the 1st resistance level at 140.9200 is identified as an overlap resistance, aligning with the 61.80% Fibonacci retracement. Furthermore, the 2nd resistance level at 142.1300 serves as a pullback resistance, coinciding with the 50% Fibonacci retracement. These resistance levels may impede the price’s upward movement.
USD/CAD:
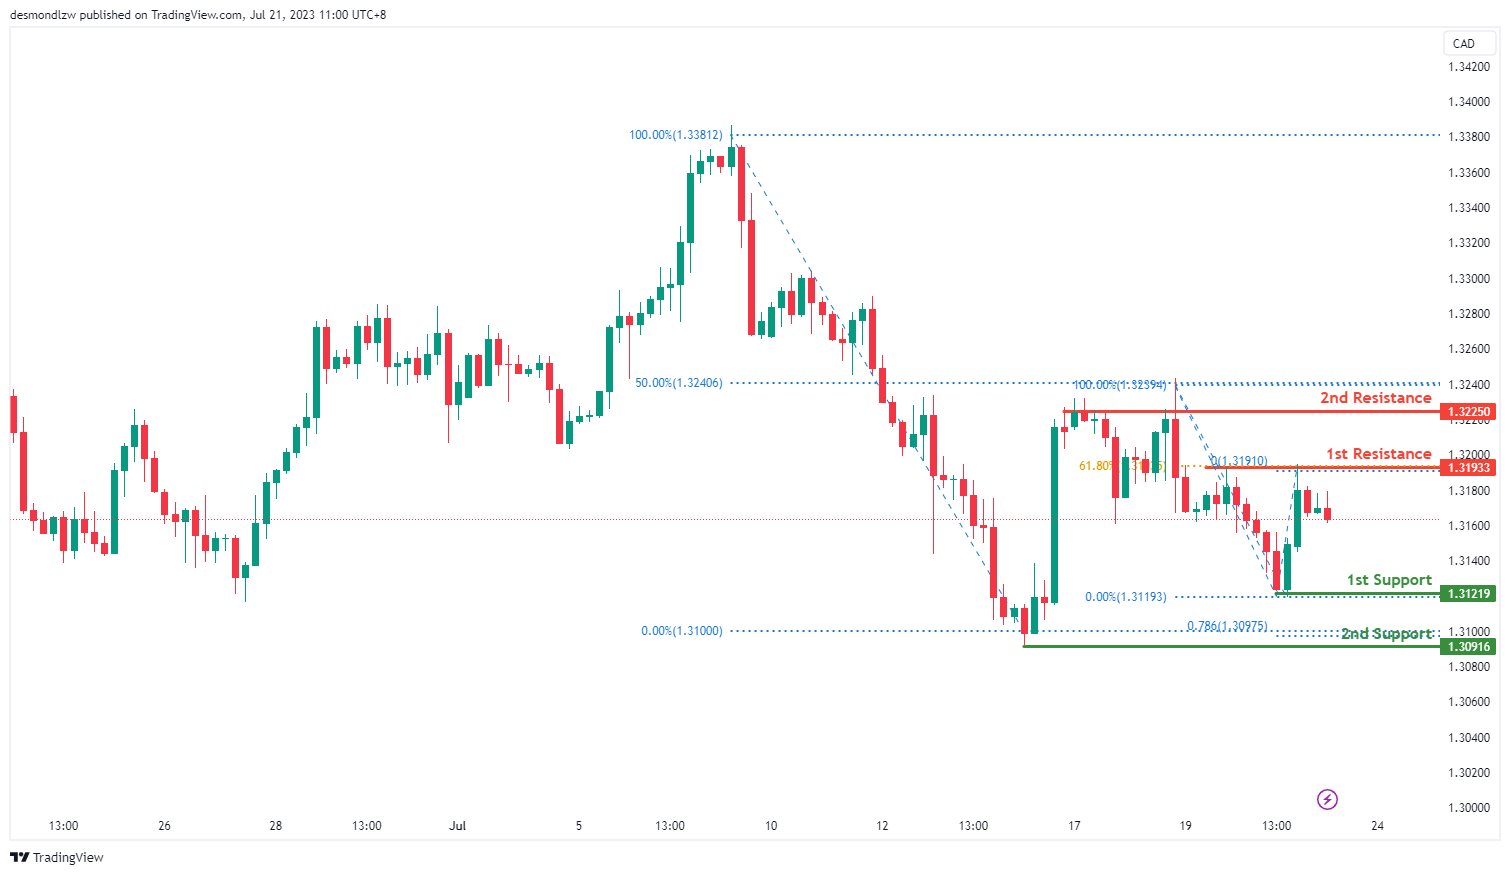
The USDCAD chart currently exhibits a bearish overall momentum, suggesting a potential continuation of the downward movement towards the 1st support level. The 1st support at 1.3121 is identified as a swing low support, coinciding with the 50% Fibonacci retracement. Additionally, the 2nd support at 1.3091 acts as a swing low support, aligning with the 78.60% Fibonacci projection.
On the upside, the 1st resistance level at 1.3193 is recognized as a swing high resistance, corresponding to the 61.80% Fibonacci retracement. Furthermore, the 2nd resistance level at 1.3225 serves as a multi-swing high resistance, coinciding with the 50% Fibonacci retracement. These resistance levels may impede the price’s upward movement.
AUD/USD:
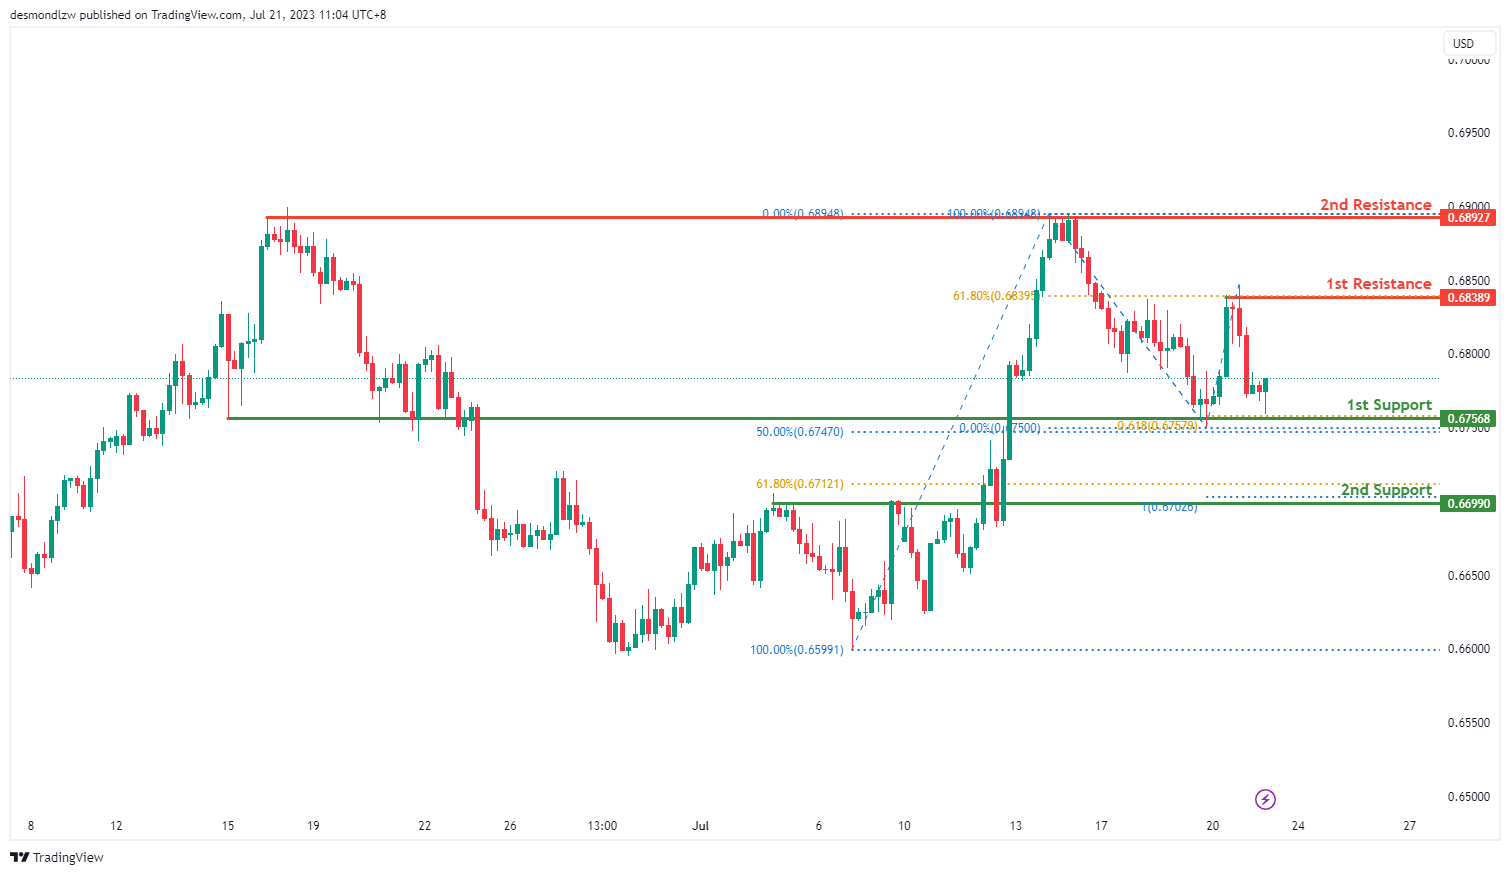
The AUD/USD chart currently demonstrates a bullish overall momentum, indicating a potential continuation of the upward movement towards the 1st resistance level. The 1st support level at 0.6756 is identified as an overlap support, showing Fibonacci confluence with the 50% and 61.80% Fibonacci retracement levels. Additionally, the 2nd support level at 0.6699 acts as a pullback support, aligning with the 61.80% Fibonacci retracement.
On the upside, the 1st resistance level at 0.6838 represents a swing high resistance, coinciding with the 61.80% Fibonacci retracement. Furthermore, the 2nd resistance level at 0.6892 serves as a multi-swing high resistance. These resistance levels may impede the price’s upward movement.
NZD/USD
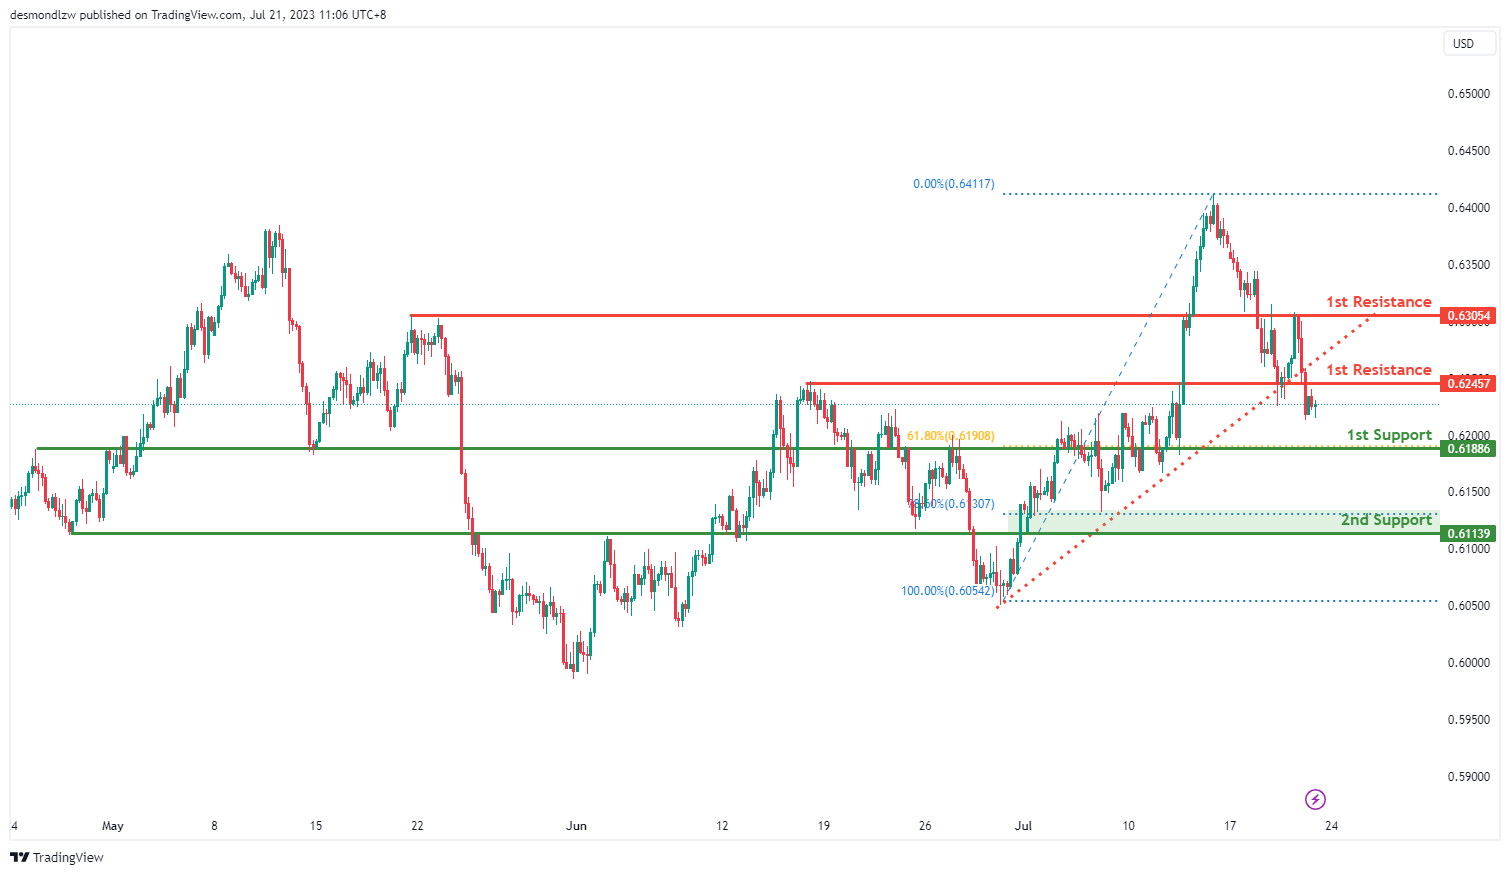
The NZD/USD pair is showing a bearish trend after breaking below an ascending support line, indicating a possible continuation of the bearish move.
In the event of a further drop, the first support is anticipated at 0.6189, an overlap support coinciding with the 61.8% Fibonacci retracement level, providing a potential floor for the price. Should the price drop beyond this point, the second support at 0.6114, another overlap support that coincides with the 78.6% Fibonacci retracement level, might act as a strong barrier against further price fall.
On the other hand, if the bearish momentum reverses, the price could face resistance at 0.6246, an overlap resistance level. If the price surges and overcomes this level, the next hurdle could be the second resistance level at 0.6305, another overlap resistance. These resistance levels might potentially hinder the price’s upward movement.
DJ30:
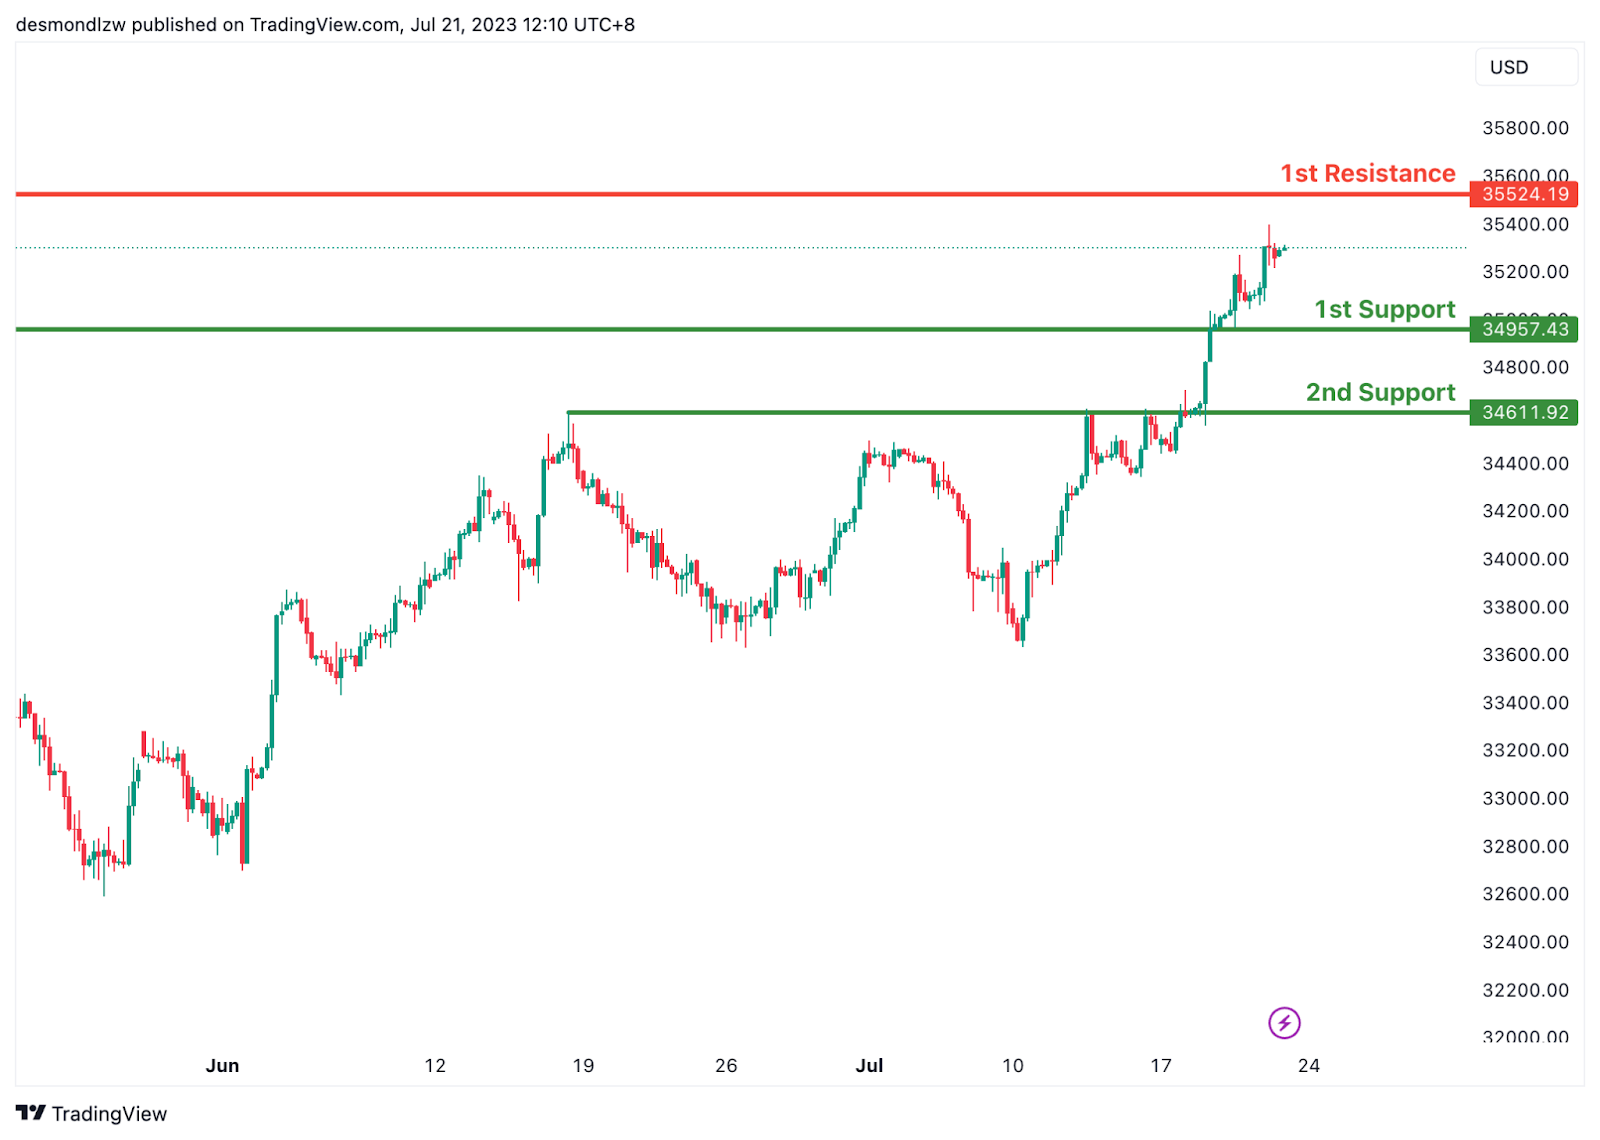
The DJ30 (Dow Jones Industrial Average) is exhibiting a bullish trend, suggesting a potential continuation of this upward momentum towards the first resistance level.
If the price declines, the first support is expected at 34957.43, which acts as a pullback support. If the price continues to fall further, the second support level at 34611.92 (another pullback support) could offer a strong barrier to prevent further decline.
On the other hand, if the bullish trend persists, the price could face resistance at 35524.19, which is a swing high resistance level. If the price manages to surpass this level, it might suggest further bullish momentum.
GER30:
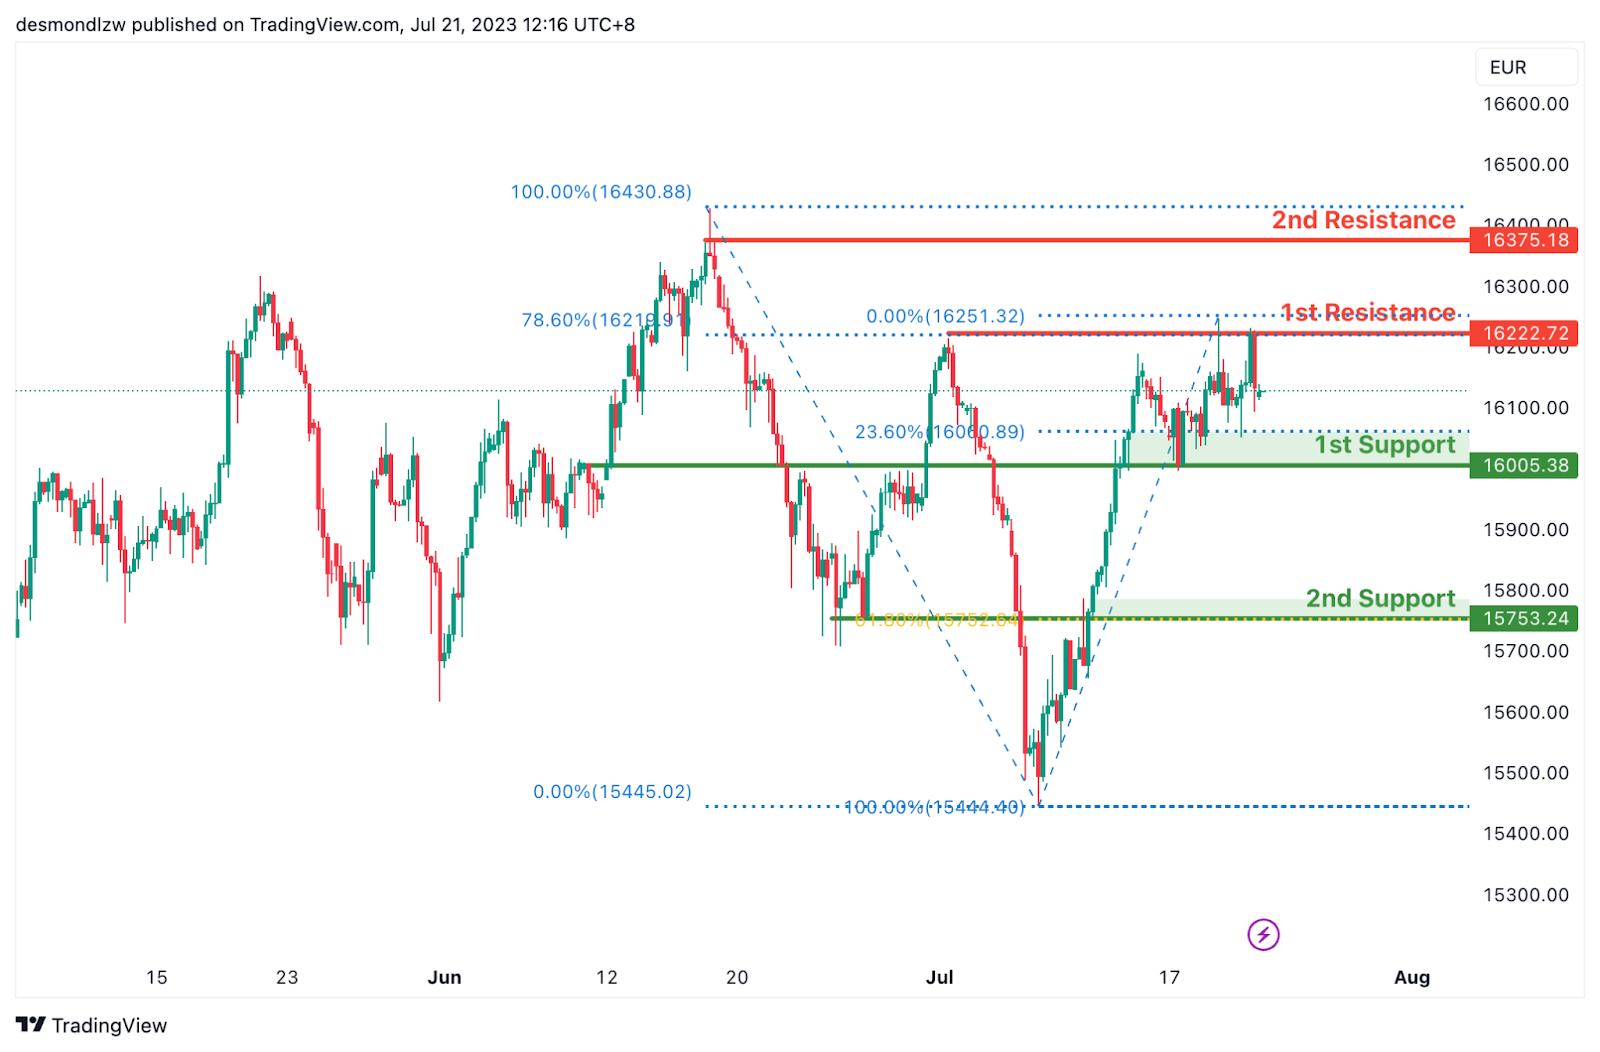
The GER30 (DAX) chart currently indicates a bearish overall momentum. There is a potential for a bearish continuation towards the 1st support level.
The 1st support level at 16005.38 is identified as an overlap support and coincides with the 23.60% Fibonacci Retracement level. Additionally, the 2nd support level at 15753.24 acts as an overlap support and aligns with the 61.80% Fibonacci Projection level.
On the upside, the 1st resistance level at 16222.72 represents a multi-swing high resistance and coincides with the 78.60% Fibonacci Retracement level. Furthermore, the 2nd resistance level at 16375.18 is identified as a swing high resistance. These resistance levels may limit further price advancement.
US500
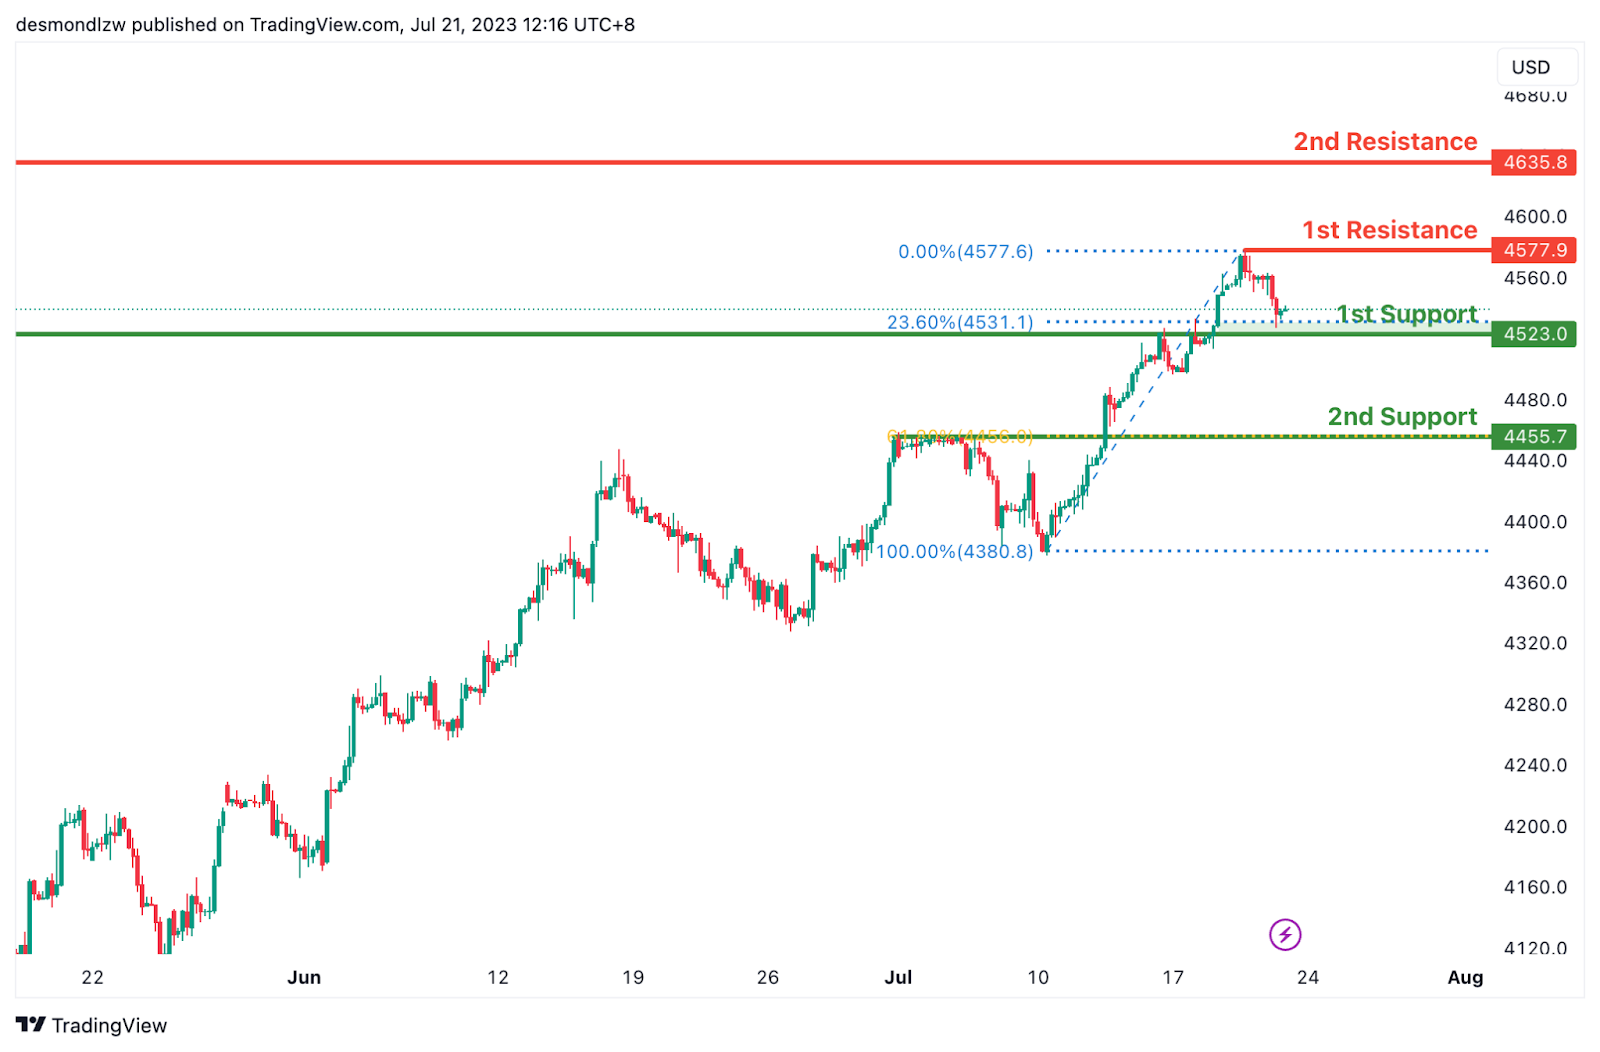
The US500 (S&P 500) is showing a bullish momentum. As such, there’s potential for a bullish bounce off the first support level, followed by an upward trend towards the first resistance level.
The 1st support level at 4523.0 is identified as a pullback support and coincides with the 23.60% Fibonacci Retracement level. Additionally, the 2nd support level at 4455.7 acts as an overlap support and aligns with the 61.80% Fibonacci Retracement level.
On the upside, the 1st resistance level at 4577.9 represents a swing high resistance. Furthermore, the 2nd resistance level at 4635.8 is also identified as a swing high resistance. These resistance levels may impede further price advancement.
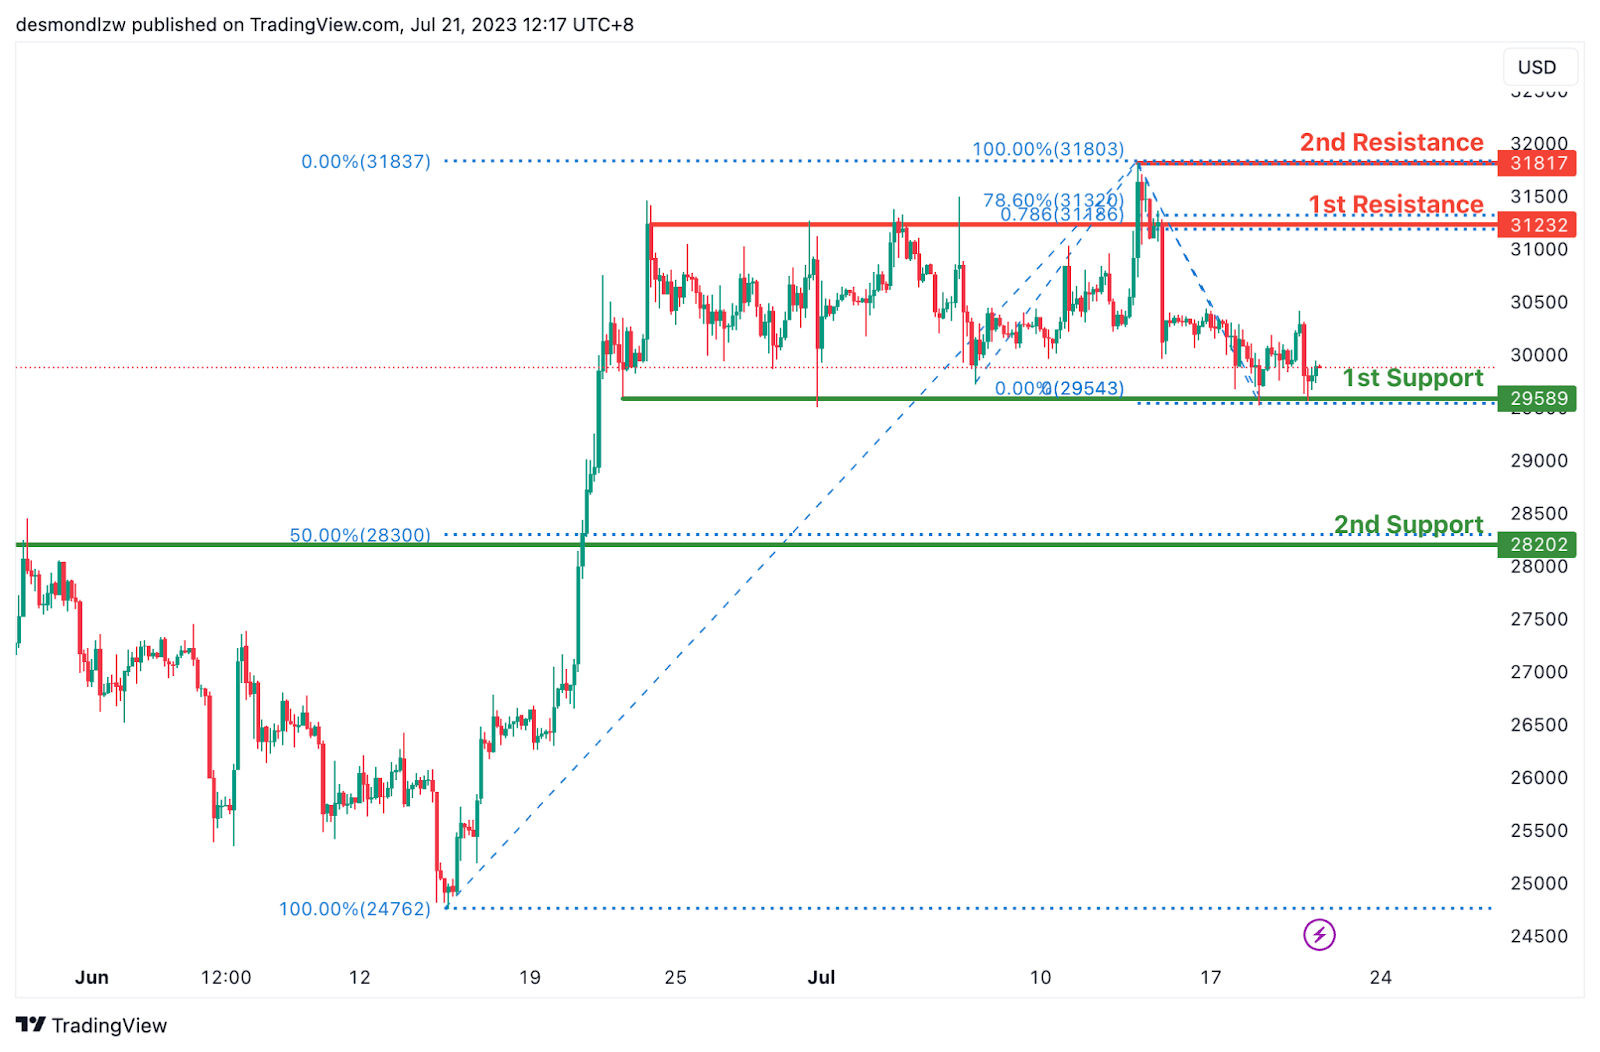
BTC/USD:
The BTC/USD chart is showing a bullish momentum. As such, there’s potential for a bullish bounce off the first support level, followed by an upward trend towards the first resistance level.
The first support level at 29,589 is identified as a multi-swing low support, indicating its significance in providing potential price stability. Additionally, the second support level at 28,202 is considered a pullback support, coinciding with the 50% Fibonacci Retracement.
On the upside, the first resistance level at 31,232 represents an overlap resistance and exhibits Fibonacci confluence with the 78.60% Fibonacci Projection and 78.60% Fibonacci Retracement, suggesting its importance as a potential barrier. Furthermore, the second resistance level at 31,817 is recognized as a swing high resistance.
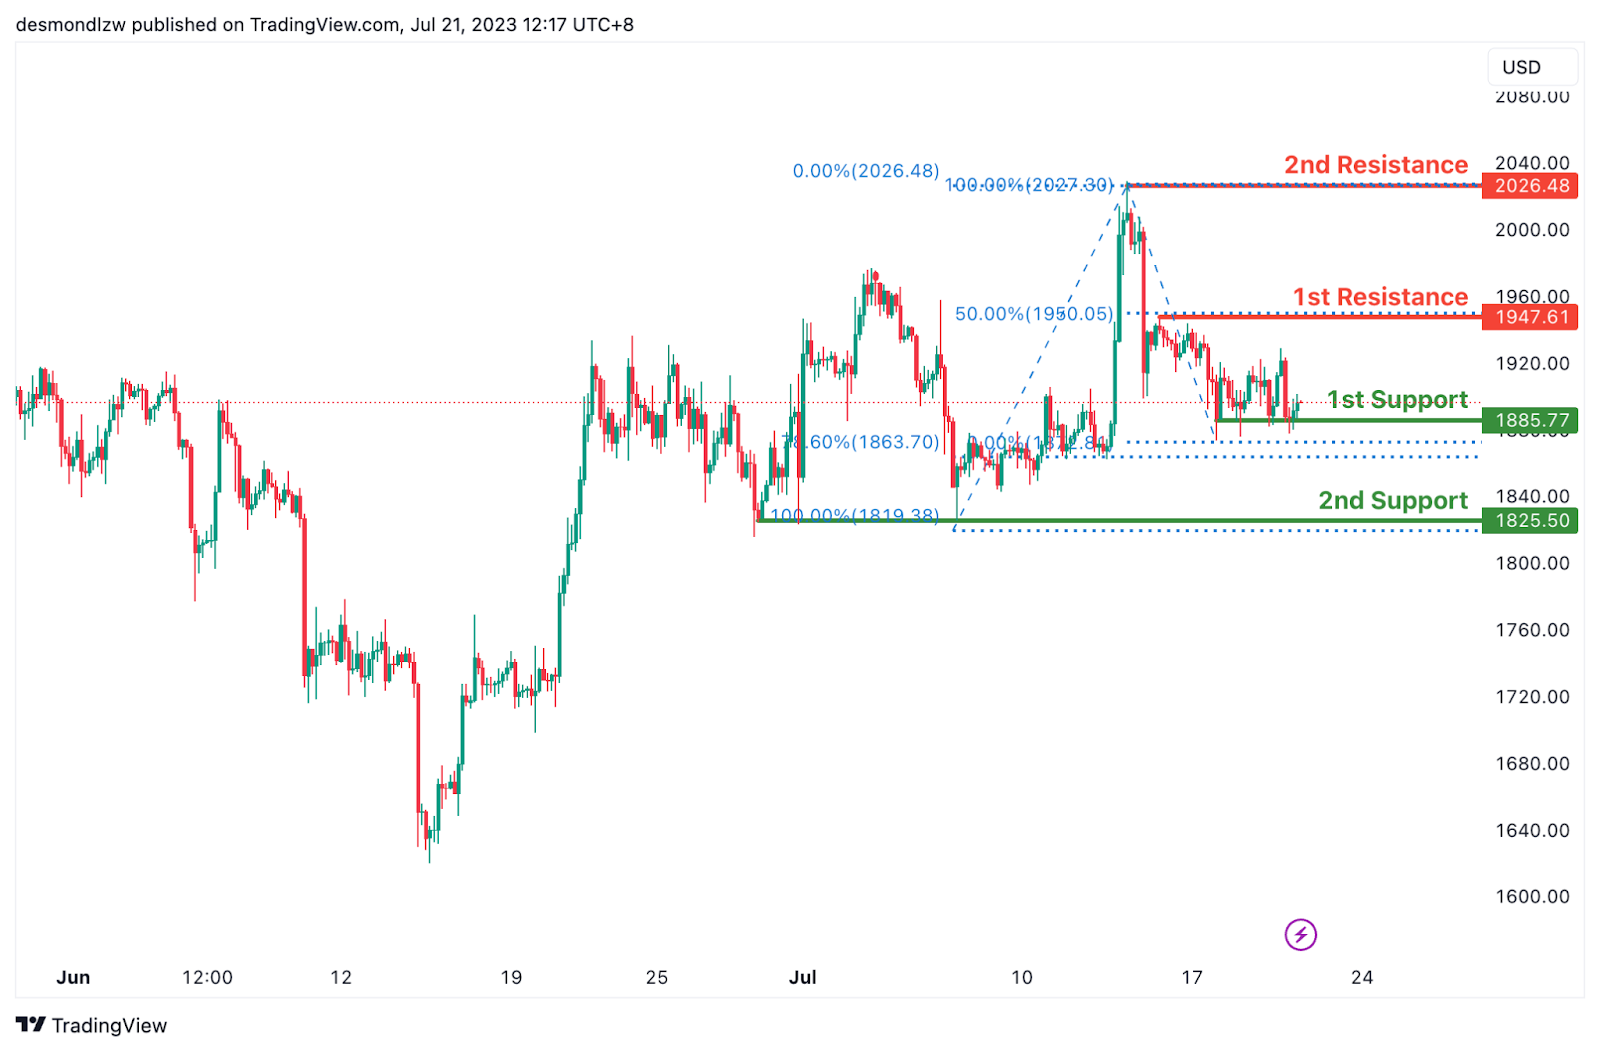
ETH/USD:
The ETH/USD chart is showing a bullish momentum. As such, there’s potential for a bullish bounce off the first support level, followed by an upward trend towards the first resistance level.
The 1st support level at 1872.11 is considered good due to its status as an overlap support and aligning with the 78.60% Fibonacci Retracement level. Additionally, the 2nd support at 1825.50 acts as a multi-swing low support.
On the upside, the 1st resistance level at 1947.61 represents a multi-swing high resistance and coincides with the 50% Fibonacci Retracement level. Furthermore, the 2nd resistance at 2026.48 is identified as a swing high resistance.
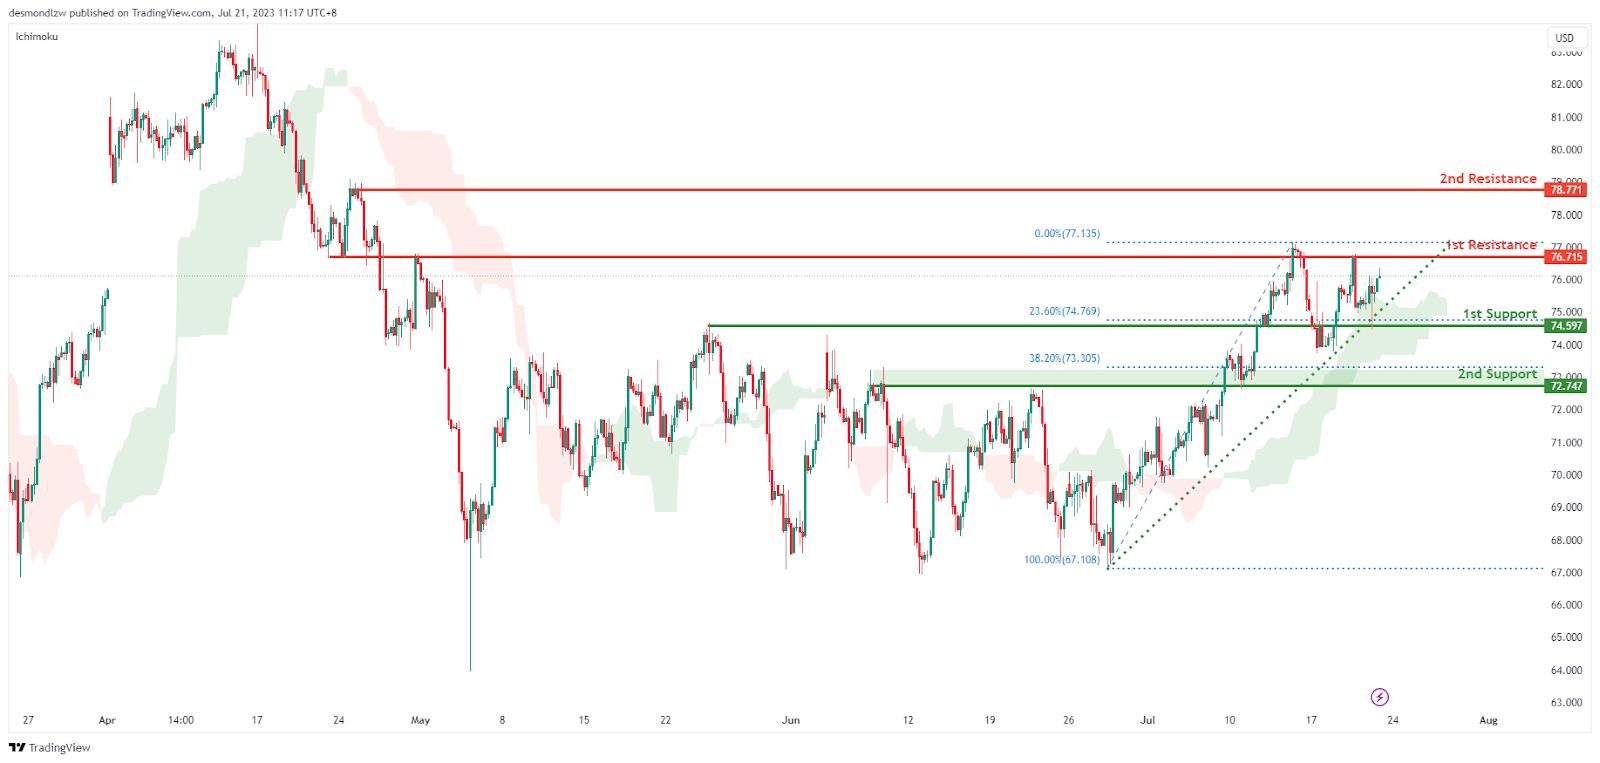
WTI/USD:
The WTI/USD pair is on a bullish trend, indicated by its position above the bullish Ichimoku cloud and a major ascending trend line, suggesting a potential continuation of this upward momentum.
If the price drops, the first support is expected at 74.59, an overlap support coinciding with the 23.6% Fibonacci retracement level. If the price continues to drop further, the second support level at 72.75 (an overlap support and the 38.2% Fibonacci retracement level) could act as a strong barrier to prevent further decline.
However, if the bullish trend continues, the price could face resistance at 76.72, an overlap resistance level. If the price continues to surge and surpasses this level, the next hurdle could be the second resistance level at 78.77, which is also an overlap resistance. These resistance levels might potentially hinder the price’s upward movement.
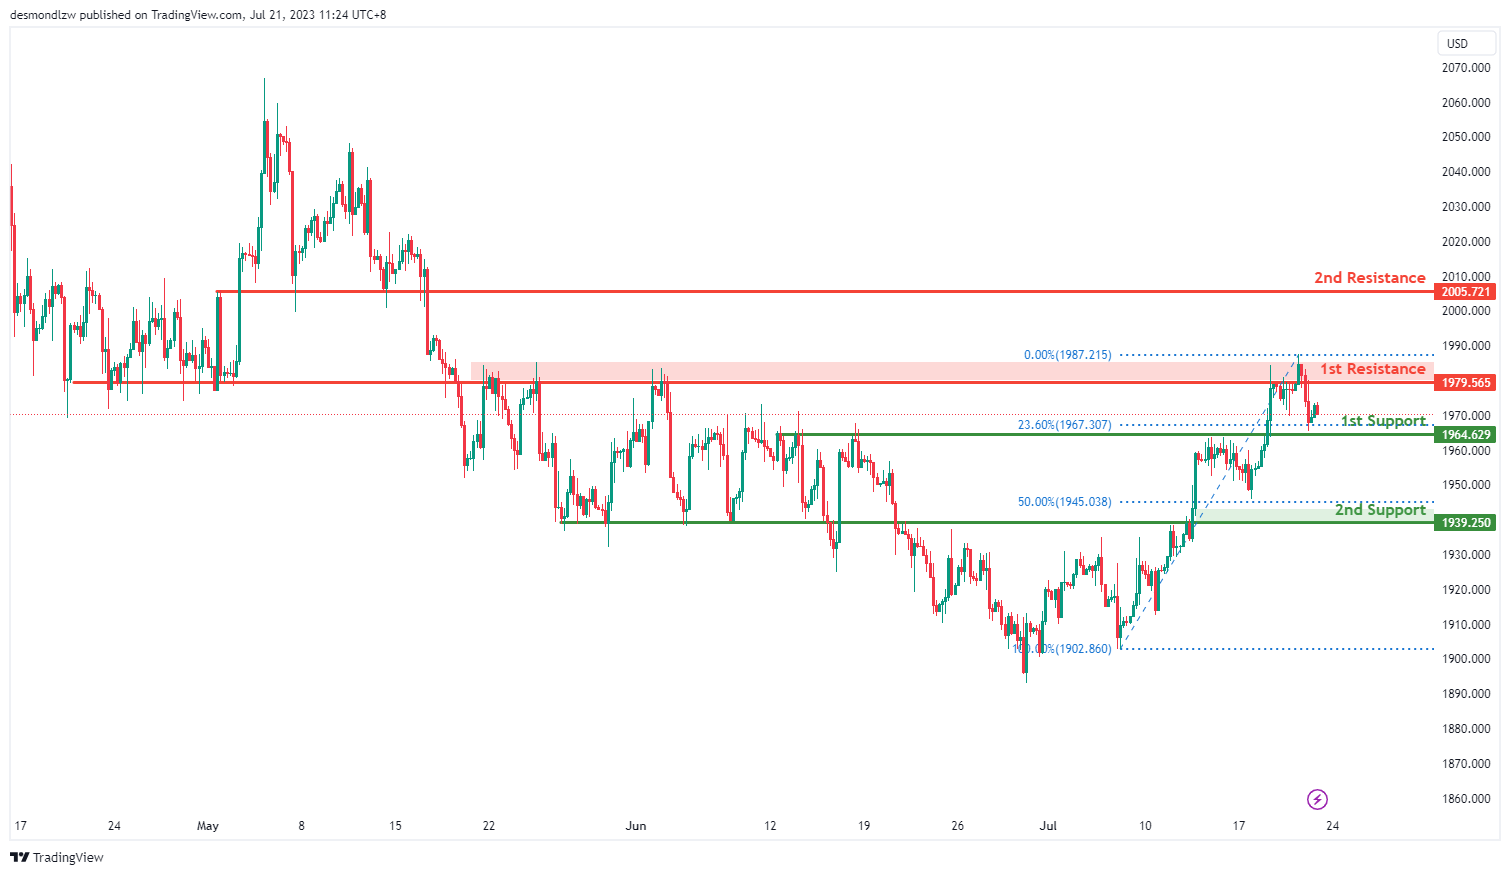
XAU/USD (GOLD):
The XAU/USD chart currently exhibits a neutral overall momentum, suggesting a potential fluctuation between the 1st resistance and 1st support level. The 1st support level at 1964.62 is identified as an overlap support, coinciding with the 23.60% Fibonacci retracement. Additionally, the 2nd support level at 1939.25 acts as a pullback support, aligning with the 50% Fibonacci retracement.
On the upside, the 1st resistance level at 1979.56 represents an overlap resistance. Furthermore, the 2nd resistance level at 2005.72 serves as a pullback resistance. As the overall momentum is neutral, the price may continue to fluctuate within these support and resistance levels.
NASDAQ poised for deeper correction
US stocks ended mixed overnight, driven primarily by disparate earnings results. DOW registered its first 9-day rally since 2017, gaining 0.47%, largely boosted by better-than-expected earnings results from pharmaceutical giant Johnson & Johnson. On the other hand, the tech-heavy NASDAQ slipped -2.05% due to disappointing results from streaming giant Netflix and electric carmaker Tesla.
The notable pullback in NASDAQ suggests that US stock markets could be broadly transitioning into a consolidation phase. This shift happens in anticipation of the FOMC rate decision scheduled for next week, followed by crucial employment data in the subsequent week.
From a technical perspective, NASDAQ could be bracing for a deeper correction, given that it was already close to 161.8% projection of 10088.82 to 12269.55 from 10982.80 at 14511.22. Break of 13864.06 resistance turned support would likely trigger deeper fall to 55 D EMA (now at 13306.68).
Should this scenario transpire, it should confirm a near term shift in risk sentiment, potentially providing a boost to Dollar and extending its current rebound.
Japan CPI core ticked up to 3.3% yoy, CPI core-core edged down to 4.2% yoy
Japan's Core CPI, which excludes food, matched expectations, also ticked up from 3.2% yoy to 3.3% yoy. This marks the 15th month that the inflation reading has remained above BoJ's 2% target.
Meanwhile, CPI core-core, which excludes both food and energy, dropped marginally from 4.3% yoy to 4.2% yoy, aligning with expectations. This slight decrease represents the index's first slowdown since January 2022. Headline CPI edged higher from 3.2% yoy to 3.3% yoy in June, surpassing 3.2% yoy expectation.
Looking at some details, service prices slightly decelerated from 1.7% yoy to 1.6% yoy. Nevertheless, food prices remained robust, rising by 9.2% yoy. A significant increase was also observed in durable household goods, which rose by 6.7% yoy. Conversely, energy prices fell by -6.6% yoy.
These figures raises the probability of BoJ making an upward revision to its inflation outlook for the current fiscal year, with its two-day policy-setting meeting slated for next week. However, BOJ might still perceive the economy as being far from a virtuous cycle of higher wages, robust consumption, and further price hikes. As Governor Kazuo Ueda indicated earlier this week, if this assumption holds true, "our overall narrative on monetary policy remains unchanged."
Cliff Notes: Labour and Inflation Pressures Persist
Key insights from the week that was.
The July RBA meeting minutes presented a detailed account of the Board’s deliberations and their assessment of risks. The case presented for raising the cash rate was familiar, centred on the strength of the labour market and upside risks to both wages and inflation. On the arguments to leave the cash rate unchanged – the Board’s eventual decision – it was emphasised that policy was “clearly restrictive” and that the full effect of this stance is still to be seen. That said, highlighting the scale and breadth of inflation risks, the Board again emphasised as they concluded that “some further tightening of monetary policy may be required”. This week’s June labour force survey and next week’s Q2 CPI report will prove critical to the RBA’s August deliberations.
A mark of the economy’s resilience under intense interest rate pressures, the June labour force survey provided yet another robust and well-rounded update on the labour market. Of note, the average pace of employment growth remains virtually unchanged from last year – when Australia’s reopening ‘burst’ was in full flight – and the unemployment rate now sits just 0.04ppts above the cycle low observed in October 2022. The detail also indicates recent job growth has been of high quality.
On inflation, taking into consideration the signal from the April and May monthly CPI indicators, we expect the Q2 CPI report to show inflation materially below peak but still a long way from target. With the labour market tight and unease over inflation expectations lingering, we believe hikes in August and September to a cash rate peak of 4.60% and a length pause to May 2024 is justified. For a detailed view of our Q2 CPI forecast and the likely risks, refer to our Q2 CPI preview on Westpac IQ.
Offshore, the focus was on China's June data round, European prices, and US’ partial indicators.
The week started with sound 0.8%qtr growth in GDP for Q2 in China, resulting in robust growth over the first half of 3%, 6% annualised. In any other year, this would be an achievement; but, being the first 6 months after COVID-zero, the market deemed it lacklustre. Issues with seasonality and/or a desire to smooth the annual result to compensate for base effect volatility also saw the annual rate come in well below the market’s expectation at 6.3%. The timing of growth through the year now means a year-average gain at or above 5.5% is highly unlikely absent very aggressive stimulus early in Q3. We now forecast year-average growth of 5.2% in 2023 and 5.5% in 2024.
Looking at the partial data for June, industrial production grew 3.8%ytd with chips and EVs adding strength. While in the near term the data is likely to remain volatile given global uncertainties, June’s outcomes should provide businesses with confidence in China’s resilience and the growth opportunities before it in Asia.
Fixed asset investment grew modestly at 3.8%ytd as the property market’s woes continued, property investment falling 7.9%ytd. New home sales growth also slowed from 11.9%ytd in May to 3.7%ytd in June. Retail sales meanwhile point to consumers also becoming more hesitant to spend day-to-day, year-over-year growth to June at 3.1% compared to the year-to-date result of 8.2%. Important to recognise for both property investment and consumption is that households have the capacity to spend but are being held back by a lack of confidence. The provision of additional modest stimulus, sooner than later, should reset their expectations. Our full analysis can be found here.
Over in Europe, inflation continues to force central banks' hand. Europe's HCIP decelerated to 5.5%yr in June from 6.1%yr. The easing came as a result of negative contributions from energy (-0.6ppts) and transport (-0.1ppts), and falling contributions from housing, water, electricity, and other fuels (0.6ppts from 0.9ppts). However, demand-side components such as restaurants and hotels, recreation and culture as well as furnishing remain robust. Consequently, core inflation, which the European Central Bank pays close attention to, accelerated to 5.5%yr.
Highlighting the tough task before the ECB in taming above-target inflation, core inflation has exceeded 5%yr since December 2022, and currently around 86% of the CPI basket remains above the 2% target. This points to a risk emerging, not only in Europe, of inflation settling outside the target band. The ECB is set to continue with its planned hike for July. However, another weak reading alongside easing core inflation may allow for a more sanguine view of inflation from the September meeting.
In the UK meanwhile, headline inflation eased to 7.9%yr in June, undershooting expectations of a 8.3%yr increase. This came as a result of a declining contribution from the transport segment, with all other components still buoyant. Underlying figures also point to breadth in inflation pressures, with an unchanged 89% of the CPI basket still growing faster than the 2% target in June versus May. Within the CPI basket, services inflation remains the pre-eminent risk, having accelerated to 7.3%yr – the fourth consecutive lift – with travel and recreation mostly to blame. Given the survey detail, the BoE is unlikely to view this print optimistically, leading to debate over another 50bp hike in August, despite market pricing having eased since the CPI release.
Finally to the US, partial indicators suggest risks to activity are starting to materialise. Retail sales rose 0.2%mth in June, bringing the 3-month average annualised figure to flat. Industrial production came in weaker, declining 0.5%mth, with the weakness among all industry groups except computers and natural gas. Housing also reflected signs of weakness as June's permits and starts data reversed some of the strength seen in May. Multi-family homes drove the decline for both permits and starts, reflecting hesitancy from builders to commence large projects. Permits point to weakness in the construction industry overall, a concerning outlook given the market is already suffering from a lack of supply, pressuring rents and home prices higher.
USD/JPY Could Gain Bullish Momentum Above 141.20
Key Highlights
- USD/JPY is recovering higher from the 137.25 zone.
- It is facing many hurdles near 141.20 on the 4-hour chart.
- EUR/USD started a downside correction below 1.1200.
- GBP/USD extended its decline toward the 1.2840 support.
USD/JPY Technical Analysis
The US Dollar declined heavily below the 141.20 support zone against the Japanese Yen. USD/JPY even traded below 139.00 before the bulls appeared.
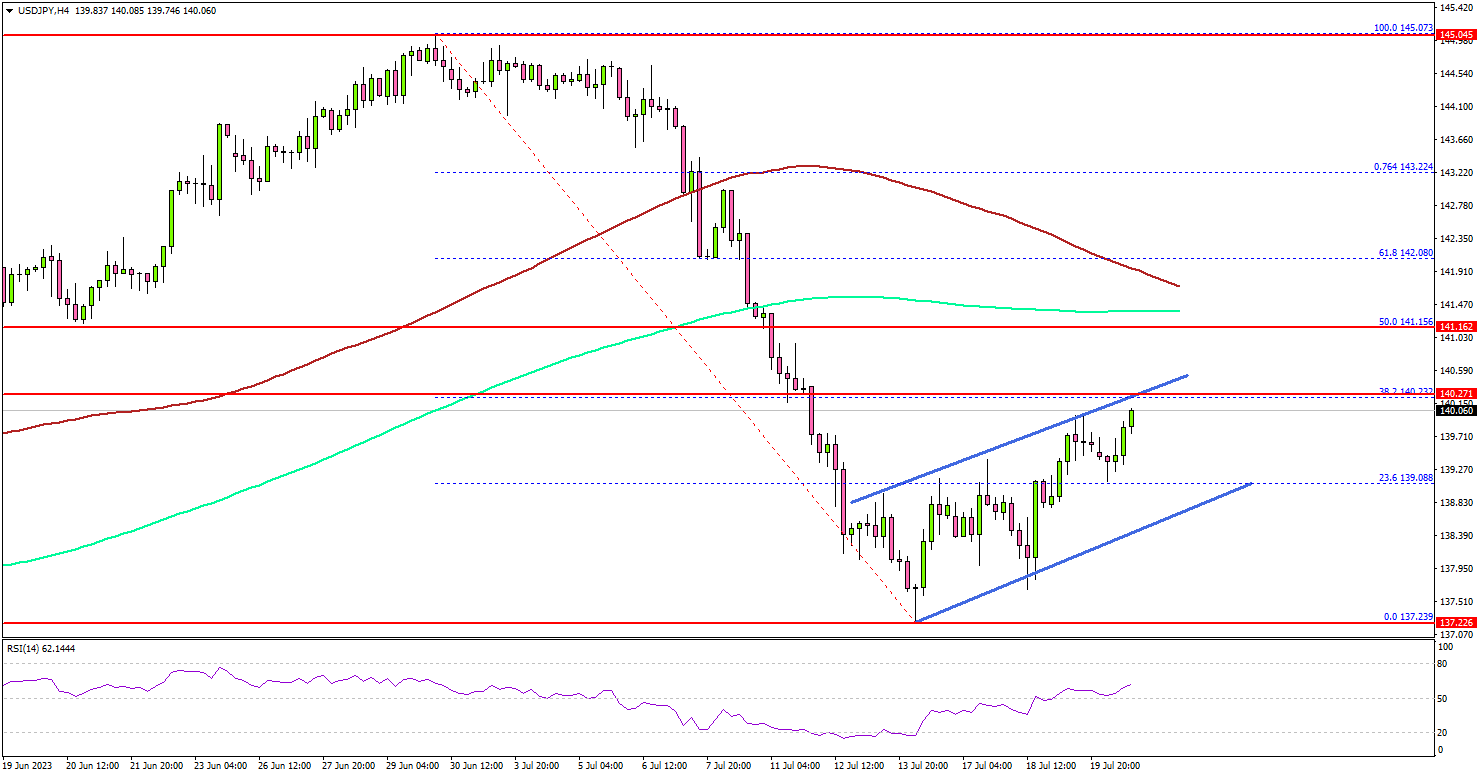
Looking at the 4-hour chart, the pair tested the 137.25 zone. A low was formed near 137.23 and the pair is now recovering higher. There was a move above the 139.00 resistance.
The pair climbed above the 23.6% Fib retracement level of the downward move from the 145.07 swing high to the 137.23 low. It is now facing resistance near the 141.20 level and the 200 simple moving average (green, 4 hours).
The next resistance is near the 100 simple moving average (red, 4 hours) or the 61.8% Fib retracement level of the downward move from the 145.07 swing high to the 137.23 low.
Any more gains might send the pair toward the 145.00 resistance zone in the near term. Immediate support is near the 139.00 level. There is also a rising channel forming with support at 139.00.
The next major support is seen near the 138.50 level, below which there could be a drop to 137.25. Any more losses might send the pair toward the 136.50 support zone.
Looking at EUR/USD, the pair failed to start a fresh increase and recently started a downside correction below the 1.1200 support.
Economic Releases
- UK Retail Sales for June 2023 (YoY) - Forecast -1.5%, versus -2.1% previous.
- UK Retail Sales for June 2023 (MoM) - Forecast +0.2%, versus +0.3% previous.
USD/JPY Technical: Potential Continuation of the Bearish Trend
- The +326 pips rebound seen in the USD/JPY from the 14 July 2023 low of 137.24 has reached a minor key inflection point.
- Short-term momentum (hourly RSI) has turned bearish.
- 60 is the key short-term resistance to watch.
The USD/JPY has staged the expected corrective rebound after a test on the 200-day moving average and hit the 139.70/140.10 resistance zone as highlighted in our previous report. It printed an intraday high of 140.50 during yesterday, 20 July US session.
Japan’s nationwide inflation for June came in within expectation
Considering today’s Asian morning release of Japan’s nationwide inflation data for June that came in within expectation, remained sticky, and elevated at a 32-year high, the USD/JPY has ticked down by -75 pips from yesterday’s US session high to today’s Asian session current intraday low of 139.75 at this time of the writing.
Japan’s core inflation (excluding fresh food) came in at 3.30% year-on-year, above May’s reading of 3.20%. Core-core inflation (excluding fresh food & energy) rose to 4.2% year-on-year, slightly below the 4.3% recorded in May.
From a technical analysis standpoint, the +326 pips rebound from the 137.24 swing low of 14 July 2023 has started to show signs of bullish exhaustion which indicates a potential continuation of its short-term downtrend phase from 30 June 2023 high of 145.07.
Short-term momentum has turned bearish
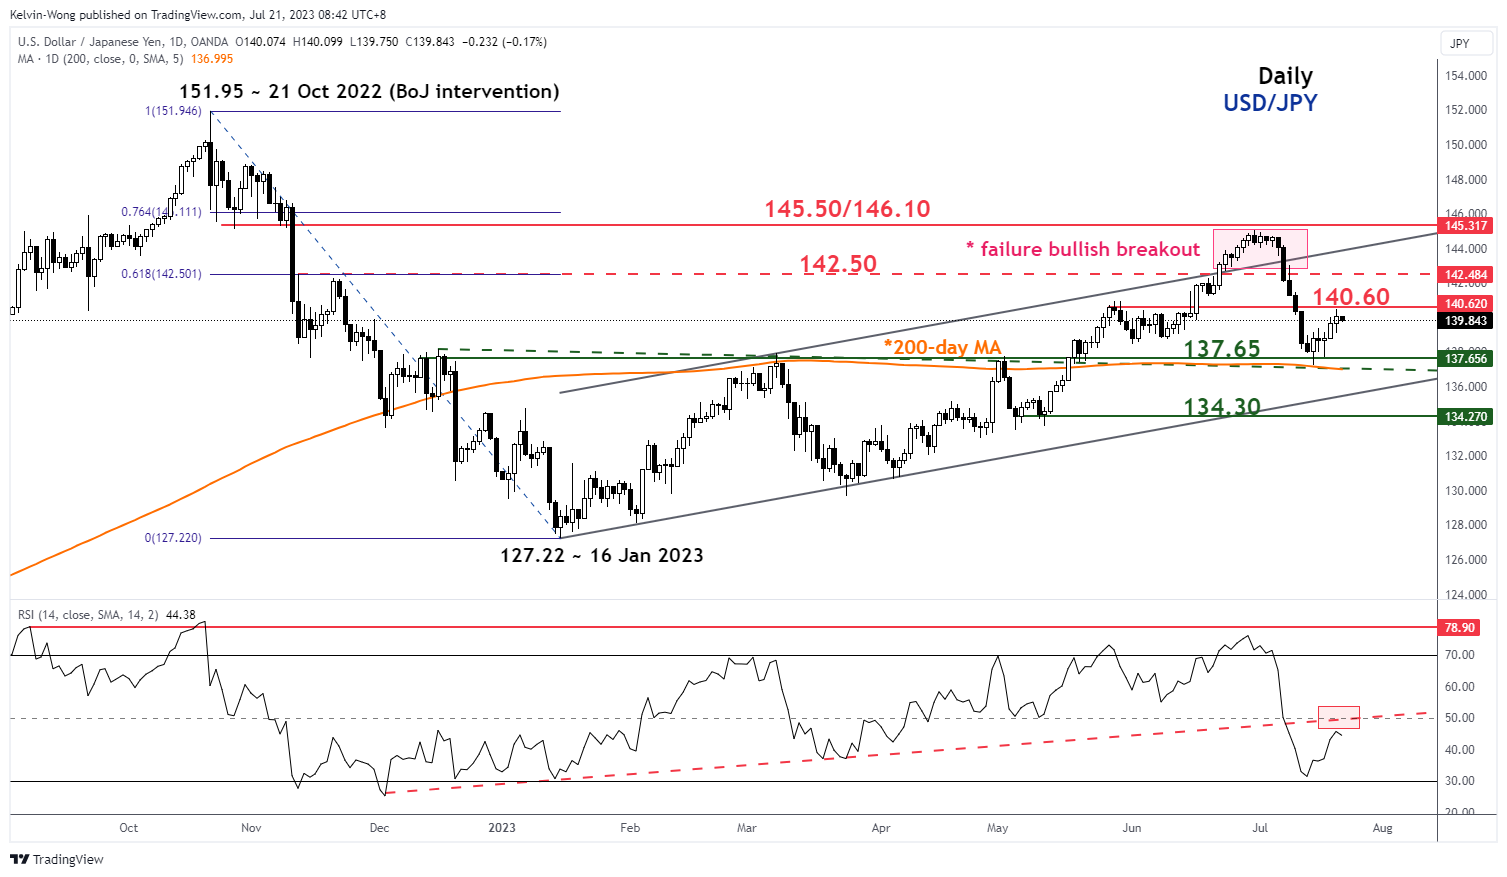
Fig 1: USD/JPY medium-term trend as of 21 Jul 2023 (Source: TradingView, click to enlarge chart)
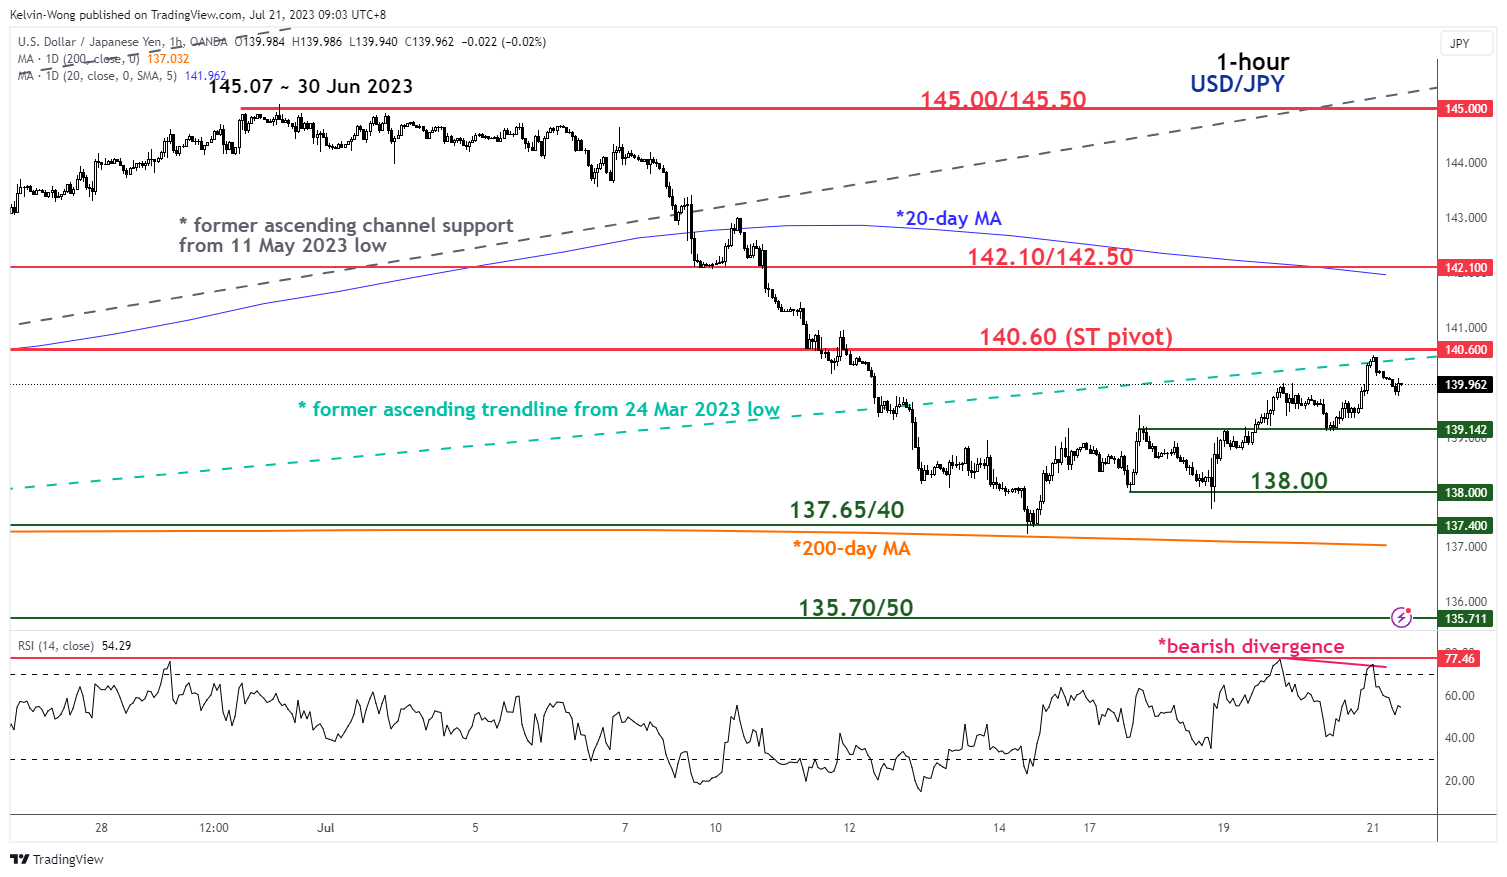
Fig 2: USD/JPY minor short-term trend as of 21 Jul 2023 (Source: TradingView, click to enlarge chart)
The hourly RSI oscillator has flashed a bearish divergence signal at its overbought region which indicates the minor up move from the 14 July 2023 low to 21 July 2023 high has started to lose upside momentum.
This negative observation in momentum occurred when the price actions of USD/JPY retested its former medium-term ascending trendline support from the 24 March 2023 low during yesterday’s 20 July US session (see 1-hour chart).
Watch the 140.60 short-term pivotal resistance and a break below 139.15 exposes the next near-term supports of 138.00, and 137.65/40 in the first step.
On the other hand, a clearance above 140.60 negates the bearish tone to see the key medium-term resistance zone of 142.10/50 (20-day moving average & the 61.8% Fibonacci retracement of the prior down move from the 30 June 2023 high to 14 July 2023 low).
Natural Gas Wave Analysis
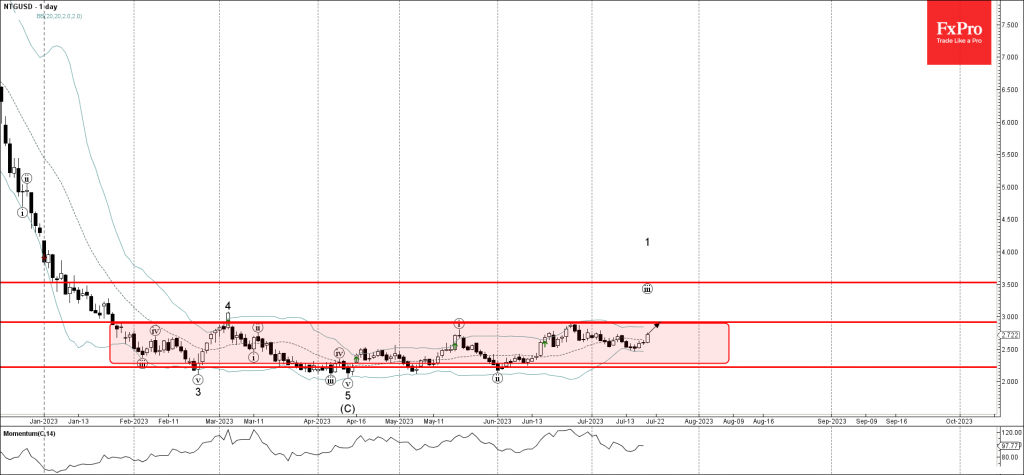
- Natural gas rising inside sideways price range
- Likely to rise to resistance level 2.915
Natural gas continues to rise inside the narrow extended sideways price range from the start of this year (enclosed by the price levels 2.224 and 2.915).
The price earlier reversed up from the support level 2.500 continuing the active impulse waves iii and 1.
Given approaching end of summer and the strength of the lower boundary of this price range, 2.224, Natural gas can be expected to soon test the upper border of this price range, 2.915.