Sample Category Title
GBP/USD: Bears Taking a Breather Above Important Supports
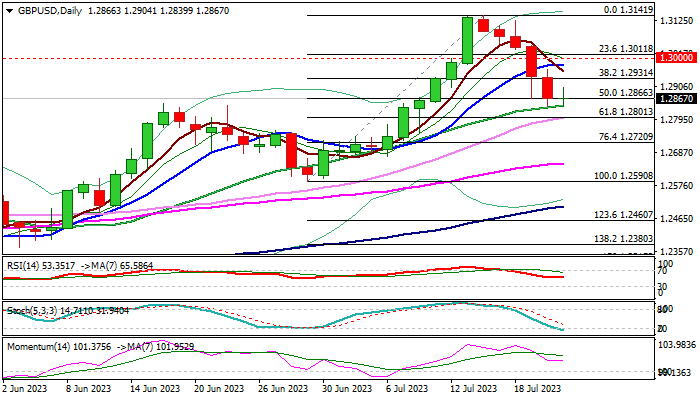
Pullback from new 2023 peak extends into sixth straight day, although bears face headwinds at important support zone at 1.2866/43 (50% retracement of 1.2590/1.3141 upleg / 20DMA) and consolidating above these levels in European session on Friday.
Oversold stochastic contributes to scenario, however, consolidation is likely to be narrow and short, as dollar continues to strengthen and weighs on sterling.
Firm break of 1.2866/43 pivots is needed to generate fresh bearish signal for test of immediate support at 1.2801 (Fibo 61.8% / 30DMA) and possible stronger acceleration.
The pair is on track for bearish weekly close and the biggest weekly drop since the last week of January, with potential formation of bearish engulfing pattern on weekly chart, to add to negative signals.
Broken Fibo 38.2% (1.2931) should cap extended upticks and keep bears in play.
Res: 1.2904; 1.2931; 1.3000; 1.3041.
Sup: 1.2843; 1.2801; 1.2750; 1.2720.
EUR/USD Technical Analysis
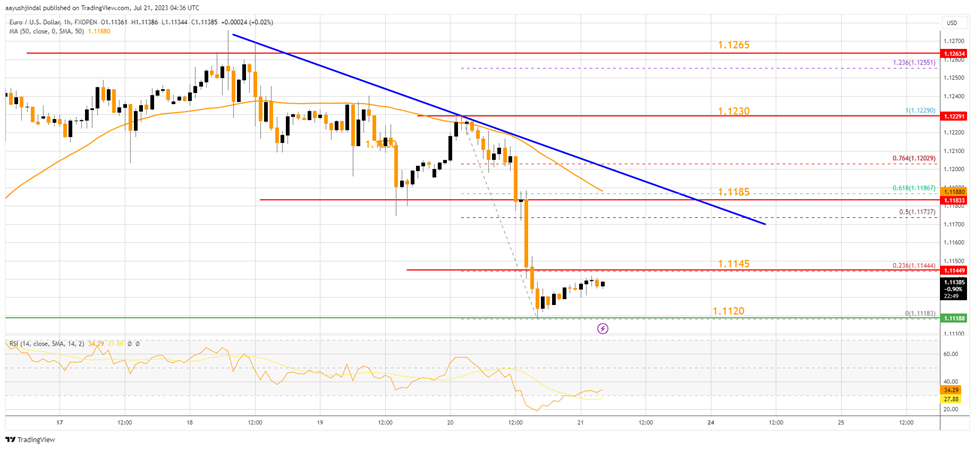
On the hourly chart of EUR/USD at FXOpen, the pair started a downside correction from the 1.1265 zone. The Euro declined below the 1.1230 and 1.1185 support levels against the US Dollar.
The pair settled below the 50-hour simple moving average and tested 1.1120. It is now consolidating losses and facing resistance near 1.1145. A clear move above the 1.1145 level might send the pair toward the 50-hour simple moving average.
There is also a connecting bearish trend line with resistance at 1.1185. The next major resistance is near the 1.1230 zone. Any more gains might send the pair toward 1.1265.
Conversely, the pair might continue to move down below 1.1120. The next major support is near 1.1080, below which EUR/USD could test 1.1050. Any more losses could send the pair toward 1.1000.
Yen tumbles following reports that BoJ likely to stand pat, CHF/JPY a top mover
Japanese Yen falls sharply following a Reuters report, which cited five anonymous sources, suggesting BoJ is predisposed towards maintaining its yield curve control at the upcoming meeting next week. Particularly significant is the current trading of 10-year JGB yield comfortably below 0.5%, negating any necessity to adjust even the yield cap.
Furthermore, BoJ appears to be in a position to bide its time until there is greater clarity surrounding the global economy's ability to circumvent a hard landing. This clarity is particularly relevant in determining if Japanese corporations can generate sufficient profits to continue raising wages in the following year. Meanwhile, doubts persist over the sustainability of inflation, a factor largely contingent on corporate profits and the wage outlook for next year.
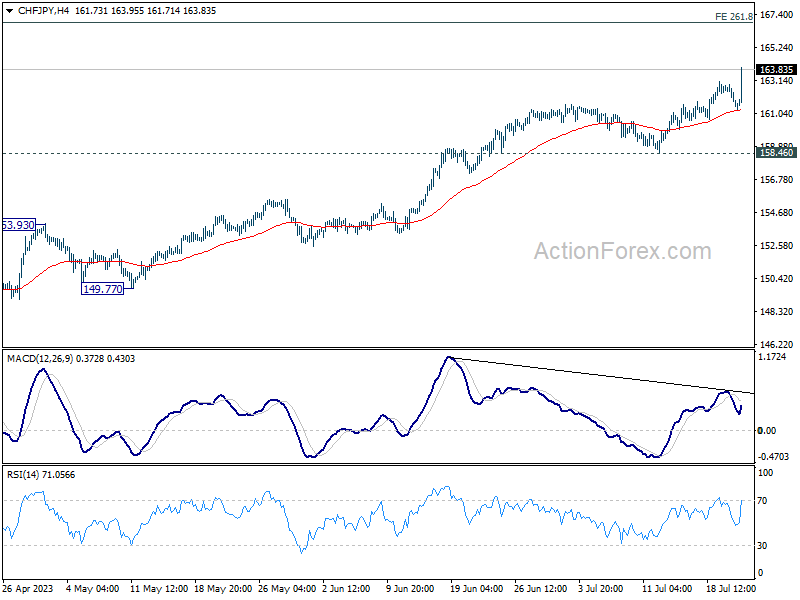
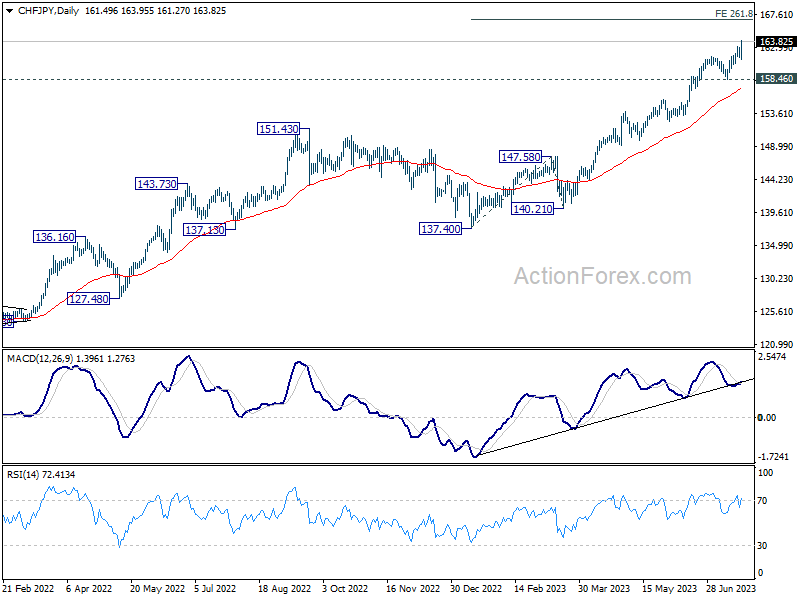
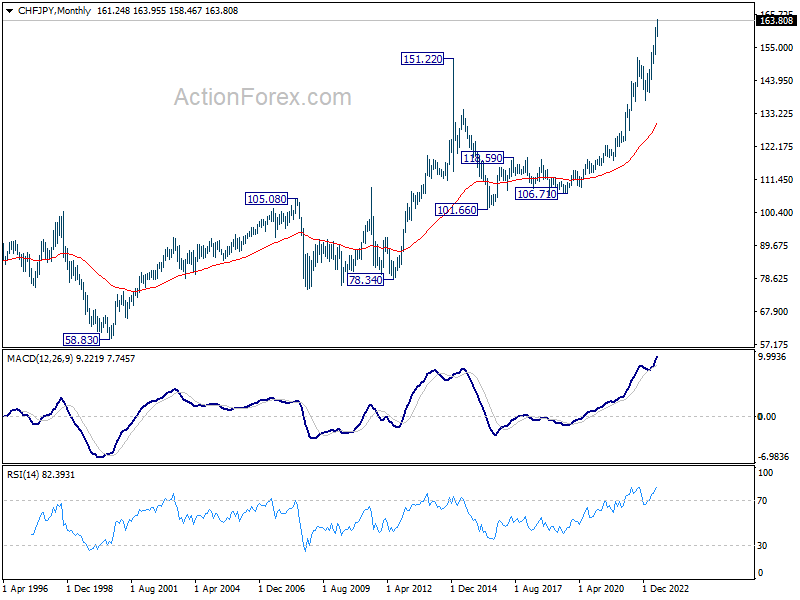
CHF/JPY is currently among the top movers for the day. Current up trend is set to target 261.8% projection of 137.40 to 147.58 from 140.21 at 166.86 next. In any case, outlook will stay bullish as long as 158.46 support holds.
USD/JPY: Recovery Accelerates on Expectations of Further Widening of Fed/BOJ Policy Gap
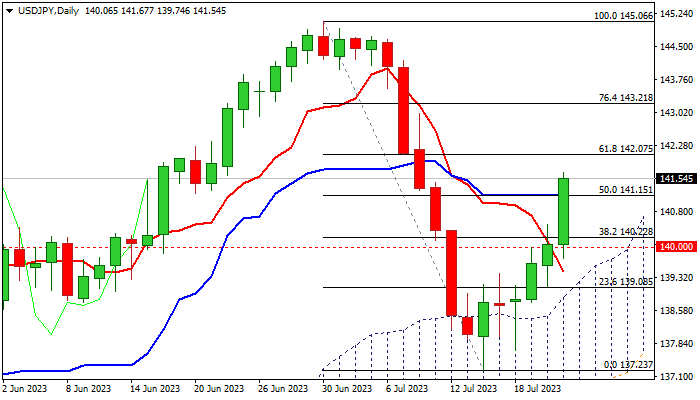
USDJPY rose to 1 ½ week high in early Friday, following break of pivotal barriers at 140.00/22 (psychological / Fibo 38.2% of 145.06/137.23 bear-leg).
Bulls remain firmly in play for the third straight day and verifying reversal signals on daily chart, as fresh advance retraced over 50% of 145.06/137.23 pullback and confirming a higher low at 137.23 (July 14).
Rising daily Ichimoku cloud contained correction from 145.06 (2023 high, posted on June 30) as penetration into cloud was short-lived and price action returned above the cloud, which is currently underpinning recovery.
Daily technical studies are improving, but more work at the upside is still needed to shift into bullish configuration, with close above cracked barrier at 141.15 (50% of 145.06/137.23 / daily Kijun-sen) to generate fresh bullish signal.
Markets shift focus to key events, Fed and BOJ policy meetings, due next week.
The US central bank is widely expected to deliver another 25 basis points hike this month and likely to keep interest rates high for extended period, as the latest economic data show that US economy is resilient and sideline recession threats.
On the other hand, the Bank of Japan is unlikely to change its monetary policy this year, despite the fact that inflation remains above central bank’s target, which may keep yen under pressure.
Res: 141.83; 142.07; 143.00; 143.21.
Sup: 141.15; 140.50; 140.22; 140.00.
WTI Oil Technical: Potential Bullish Reversal “Descending Wedge” in Play
- Major downtrend phase from the 7 March 2022 swing high has evolved into a potential bullish reversal “Descending Wedge” configuration.
- US$77.30 is the key intermediate resistance (200-day moving average & upper boundary of “Descending Wedge”).
- Key short-term support rests at US$72.20, also the 50-day moving average.
Since its 7 Nov 2020 medium-term swing high of US$94.11 per barrel, the price actions of West Texas Oil (a proxy of WTI crude oil futures) have been oscillating within an 8-month bullish “Descending Wedge” configuration which suggests a potential major bullish reversal configuration in the process since its major downtrend phase from 7 March 2022 high of US$131.30 to 4 May 2023 low of US$63.67 that recorded a loss of -51.5%.
Major downtrend phase has evolved into a potential bullish reversal “Descending Wedge”
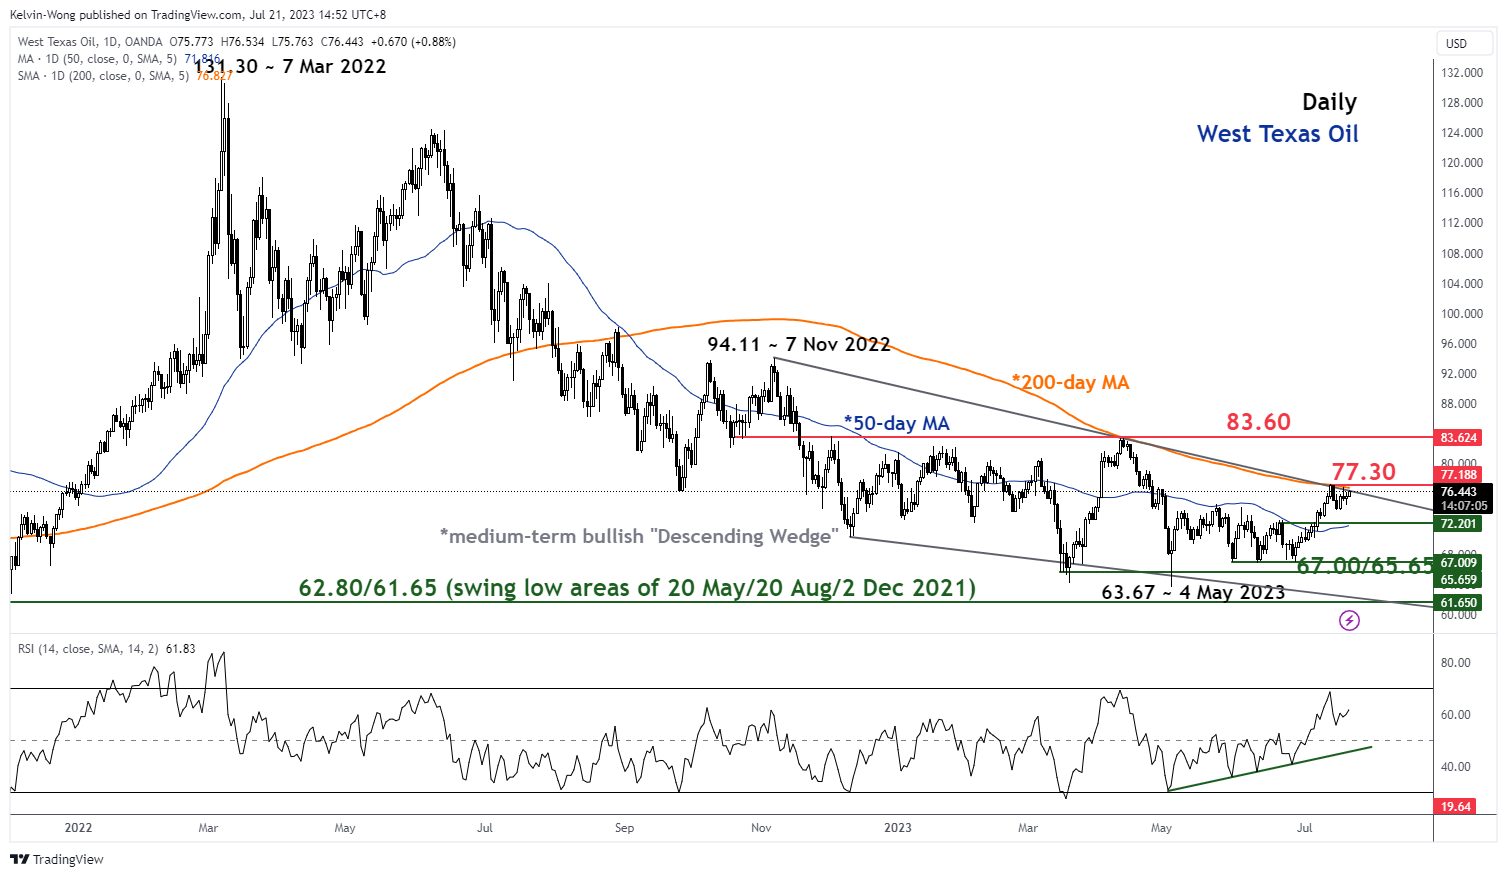
Fig 1: West Texas Oil major & medium-term trends as of 21 Jul 2023 (Source: TradingView, click to enlarge chart)
Oscillating within a short-term uptrend phase since 28 June 2023 low of US$66.95
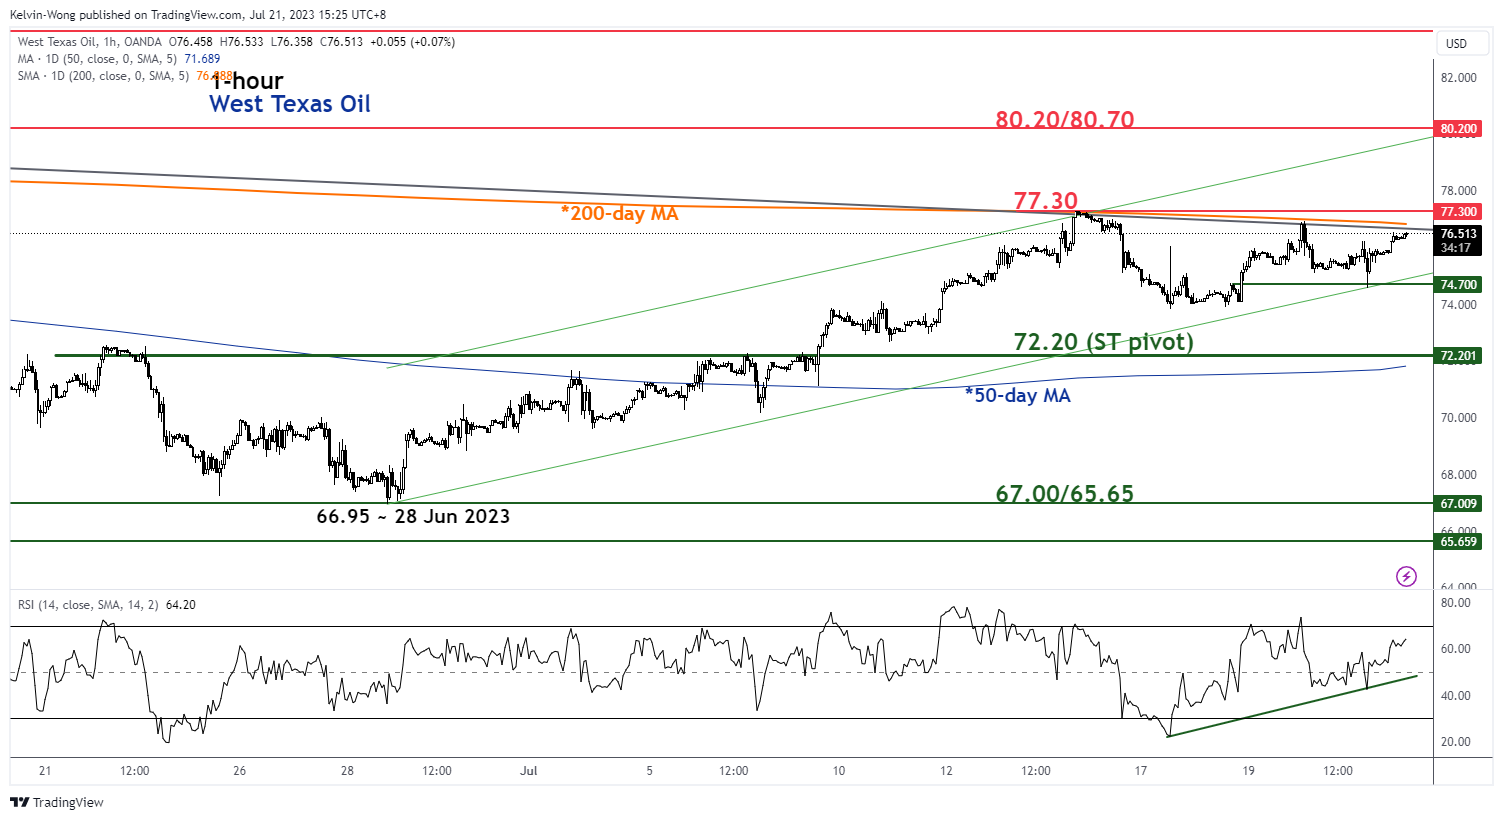
Fig 2: West Texas Oil minor short-term trend as of 21 Jul 2023 (Source: TradingView, click to enlarge chart)
Since its recent 28 June 2023 low of US$66.95, its price actions have started to evolve into a minor short-term uptrend phase and cleared above the 50-day moving average that is now turning upwards.
In addition, both the daily and hourly RSI oscillators are exhibiting positive configurations and readings which indicates that medium-term and short-term upside momentum remains intact.
A clearance above US$77.30 key intermediate resistance (the 200-day moving average & the upper boundary of the medium-term “Descending Wedge”) may see a bullish breakout towards the next resistance at US$80.20/80.70 (the upper boundary of the minor ascending channel from 28 June 2023 low & a Fibonacci extension cluster) (see 1-hour chart).
However, failure to hold above US$72.20 key short-term pivotal support (also the 50-day moving average) negates the bullish tone to expose the key medium-term support at US$67.00/65.65.
GBPJPY Neutral Outlook Unchanged for Now
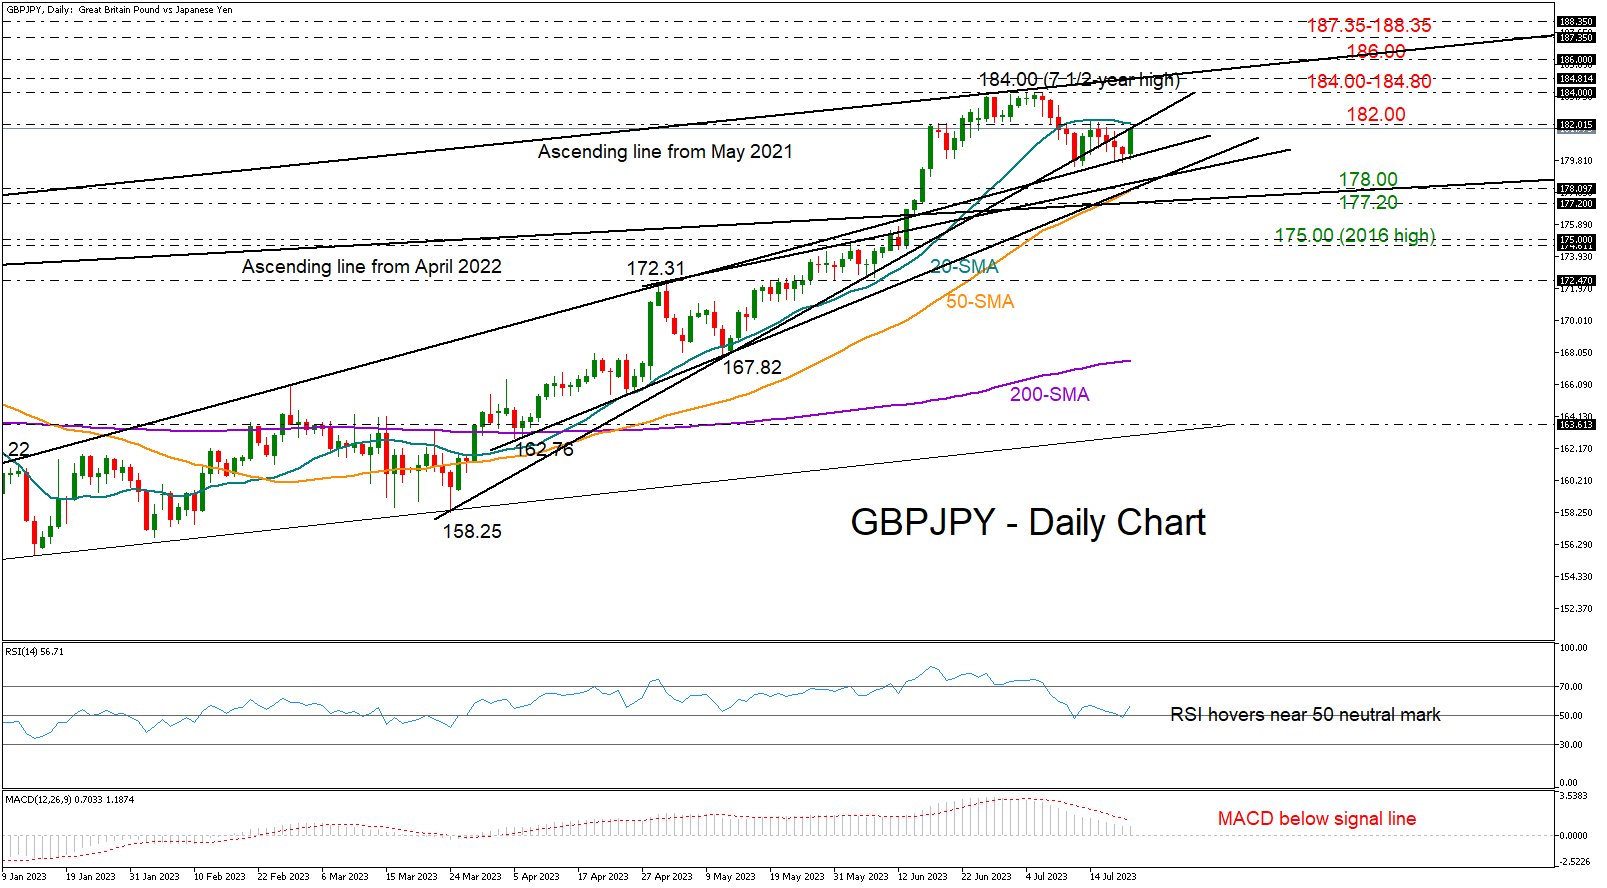
GBPJPY is set to close the week with mild losses for the third time in a row, remaining below July’s seven-and-half year-high of 184.00.
The market sentiment weakened this week. The price tiptoed lower to test the lower band of its one-month-old range at 179.80 and the broken 2023 resistance trendline after being rejected near the 20-day simple moving average (SMA).
The short-term bias is neutral-to-bearish as the RSI is consolidating its downtrend near 50 and the MACD is slowing below its red signal line.
If the 179.80 floor collapses, there is potential for a negative correction towards the 50-day SMA at 178.00. A couple of trendlines are in the region, including the support trendline from March. Slightly lower, the constraining line that links the highs from April and October 2022 could be interesting to watch at 177.20. If sellers dominate there, the decline could pick up pace towards the 175.00-174.60 zone.
On the upside, the bulls will need to do some extra homework to pierce through the restrictive 20-day SMA at 182.00. If efforts prove successful, the price could fly directly to the 184.00 top or slightly higher to test the long-term resistance line from May 2021. Claiming that territory, the focus will turn to the 186.00 round level, where the pair faced some limitations during 2015-2014. Should buyers push higher, the next obstacle could develop within the 187.35-188.35 and then around 190.00.
Summing up, GBPJPY is still in a neutral phase in the short-term picture, with traders waiting for a move below 179.80 or above 182.00 to drive the market accordingly.
Gold Price Dips While Crude Oil Price Could Extend Gains
Gold price is correcting lower from the $1,988 resistance. Crude oil price is rising, and it could climb further higher toward the $77.10 resistance.
Important Takeaways for Gold and Oil Prices Analysis Today
- Gold prices failed to clear the 1,988 resistance and corrected lower against the US Dollar.
- Gold traded below a key bullish trend line with support at $1,980 on the hourly chart at FXOpen.
- Crude oil prices are moving higher, above the $75.00 resistance zone.
- There is a key bullish trend line forming with support near $75.60 on the hourly chart of XTI/USD at FXOpen.
Gold Price Technical Analysis
On the hourly chart of gold at FXOpen, the price climbed above the $1,966 resistance. The price even broke the $1,980 level before the bearish sentiment arose.
XAU/USD traded as high as $1,987 before the downside correction. There was a move below a key bullish trend line with support at $1,980. The price settled below the 50-hour simple moving average, and RSI dipped below 50.
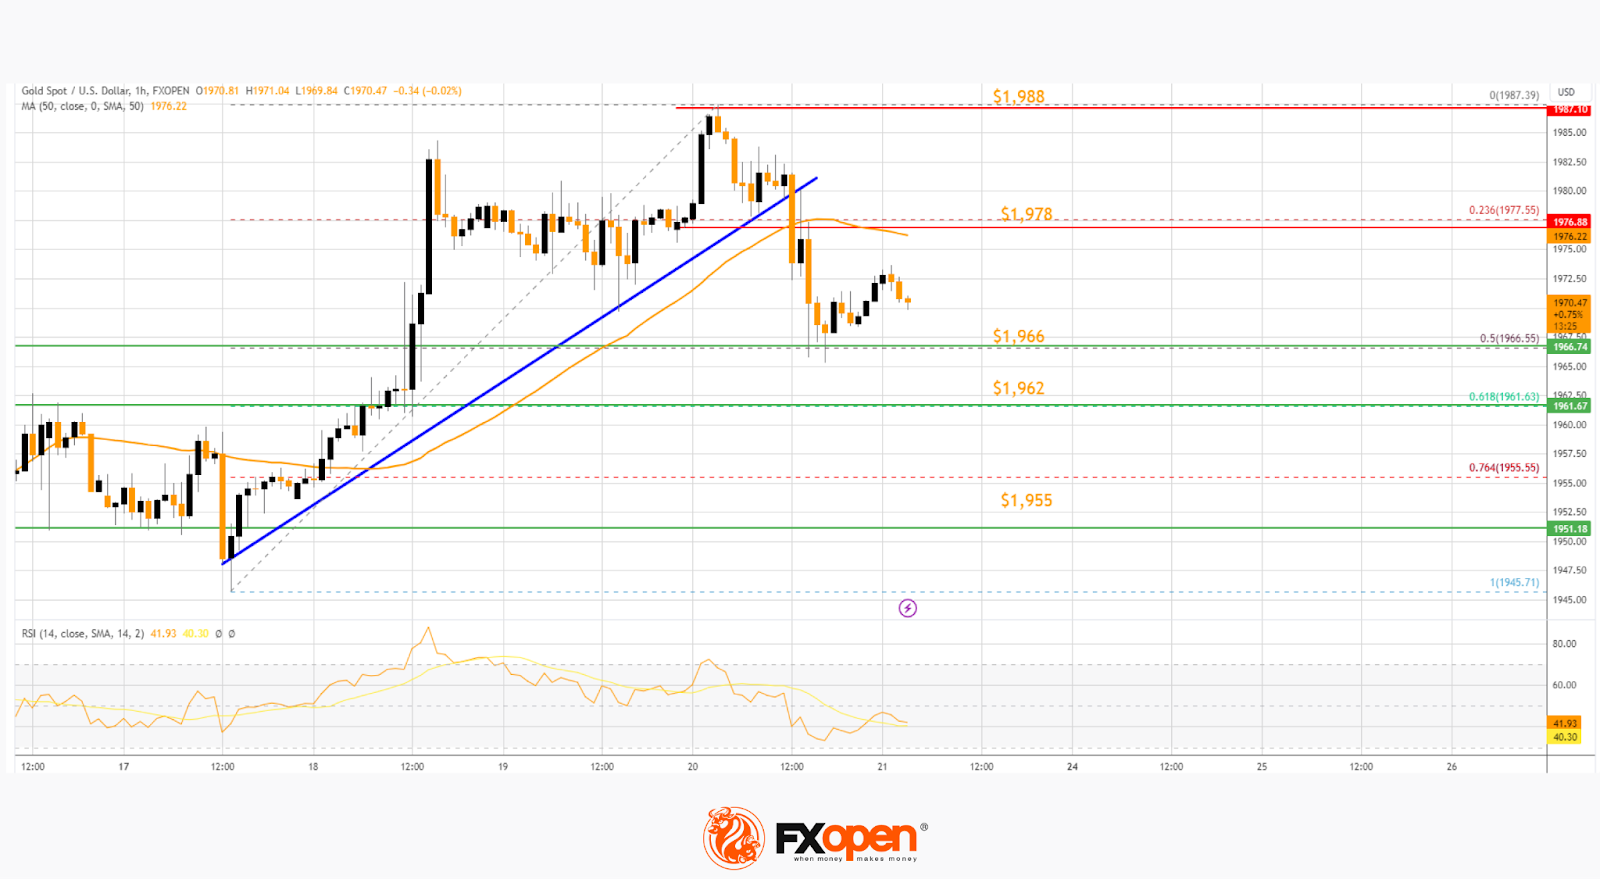
The bulls are now protecting the 50% Fib retracement level of the upward move from the $1,945 swing low to the $1,987 high at $1,966. If they remain active, the price could start a fresh increase.
Immediate resistance is near the 50-hour simple moving average at $1,978. The next major resistance is near the $1,988 level. An upside break above $1,988 could send the Gold price toward $1,995. Any more gains may perhaps set the pace for an increase toward the $2,000 level.
Initial support on the downside is near $1,966. The first major support is near the 61.8% Fib retracement level of the upward move from the $1,945 swing low to the $1,987 high at $1,962.
If there is a downside break below this level, the price might decline further. In the stated case, it may drop toward the $1,955 support.
Oil Price Technical Analysis
On the hourly chart of WTI Crude Oil at FXOpen, the price started a decent increase against the US Dollar. It gained bullish momentum after it broke the $72.50 resistance, as mentioned in the previous analysis.
There was a sustained upward move above the $75.00 and $75.60 resistance levels. The bulls pushed the price above the 61.8% Fib retracement level of the downward move from the $76.81 swing high to the $74.45 low.
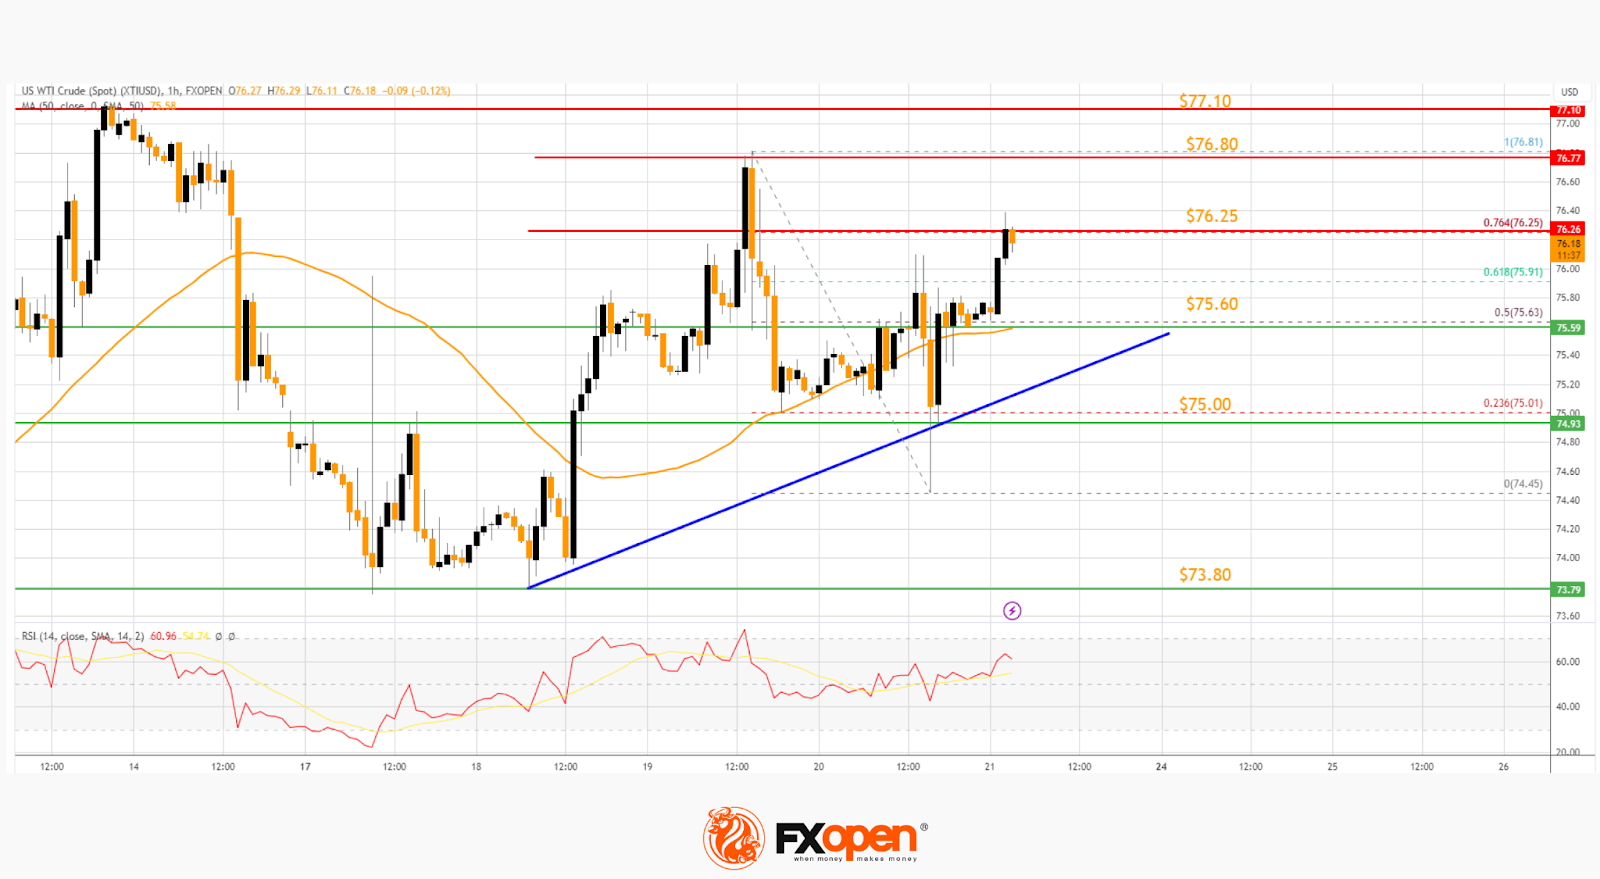
It is now trading above the 50-hour simple moving average, and the RSI is rising above 60. The bears seem to be active near the 76.4% Fib retracement level of the downward move from the $76.81 swing high to the $74.45 low.
If the price climbs further, it could face resistance near $76.80. The first major resistance is near the $77.10 level. Any more gains might send the price toward the $78.80 level.
Conversely, the price might correct gains and retest the 50-hour simple moving average and a connecting bullish trend line at $75.60. The next major support on the WTI crude oil chart is near $75.00.
If there is a downside break, the price might decline toward $73.80. Any more losses may perhaps open the doors for a move toward the $72.50 support zone.
EUR/USD Daily Outlook
Daily Pivots: (S1) 1.1089; (P) 1.1159; (R1) 1.1200; More...
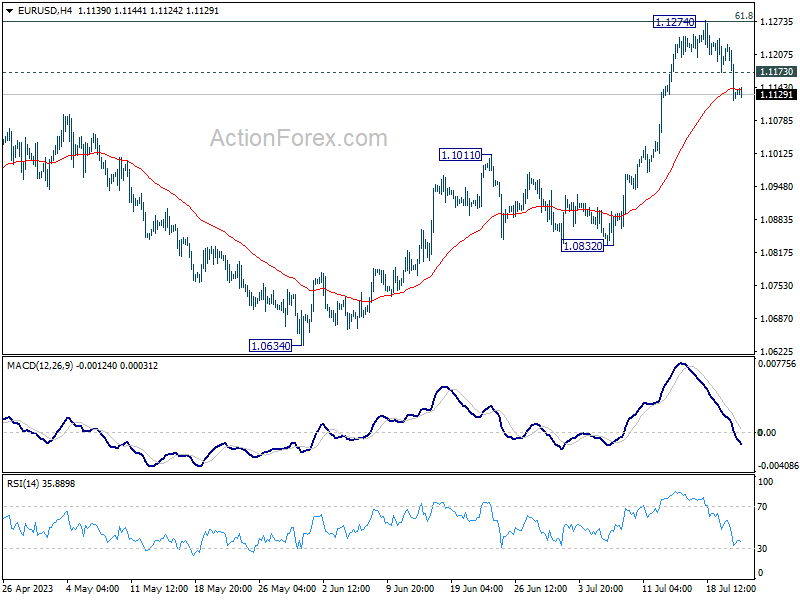
EUR/USD's break of 1.1173 minor support suggests short term topping at 1.1274, after rejection by 1.1273 fibonacci level. Intraday bias is back on the downside for deeper pull back towards 1.1011 resistance turned support. For now, risk is mildly on the downside as long as 1.1274 resistance holds, in case of recovery.
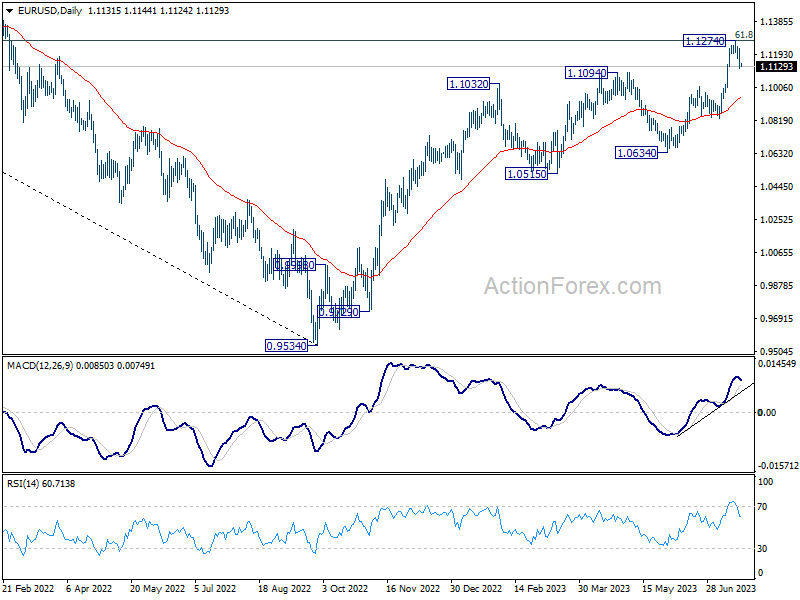
In the bigger picture, as rise from 0.9534 extends, focus is now on 61.8% retracement of 1.2348 (2021 high) to 0.9534 at 1.1273. Sustained break there will solidify the case of bullish trend reversal and target 1.2348 resistance next. Meanwhile, outlook will continue to stay bullish as long as 1.0832 support holds, even in case of deep pull back.
USD/CHF Daily Outlook
Daily Pivots: (S1) 0.8591; (P) 0.8637; (R1) 0.8714; More...
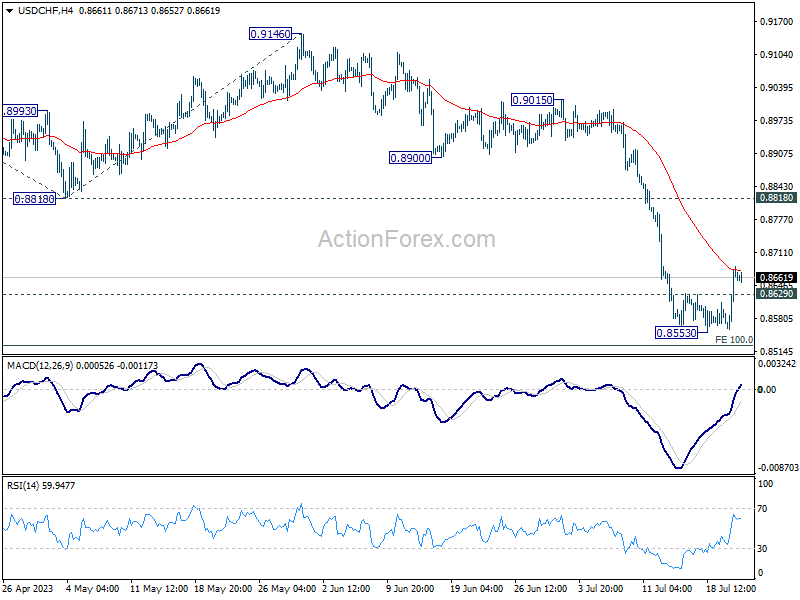
USD/CHF's break of 0.629 minor resistance suggests short term bottoming at 0.8553, just ahead of 100% projection of 0.9439 to 0.8818 from 0.9146 at 0.8525. Intraday bias is back on the upside for stronger rebound towards 0.8818 support turned resistance. For now, risk will stay mildly on the upside as long as 0.8553 holds, in case of retreat.
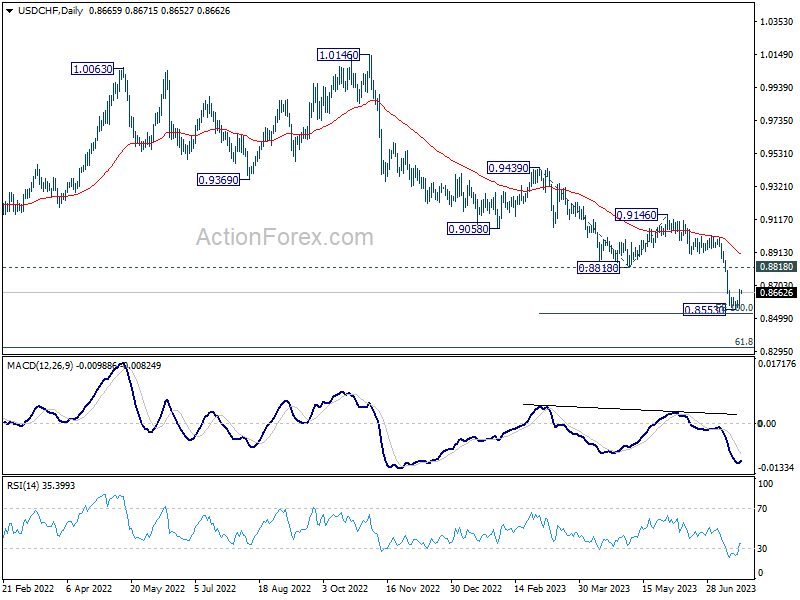
In the bigger picture, the break of 0.8756 (2021 low) indicates break out from the long term range pattern. For now, medium term outlook will stay bearish as long as 0.9146 resistance holds. Further fall would be seen to 61.8% retracement of 0.7065 (2011 low) to 1.0342 (2016 high) at 0.8317 next.
GBP/USD Daily Outlook
Daily Pivots: (S1) 1.2816; (P) 1.2891; (R1) 1.2941; More...
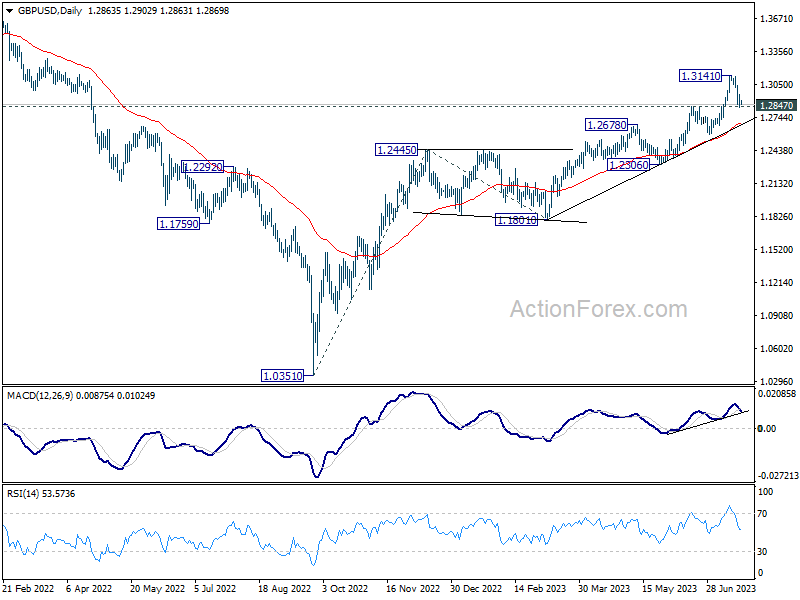
Intraday bias in GBP/USD stays neutral and outlook is unchanged. With 1.2847 resistance turned support intact, outlook stays bullish. On the upside, above 1.2963 minor resistance will turn bias back to the upside for retesting 1.3141 high. Nevertheless, decisive break of 1.2847 will argue that larger correction is underway and target 1.2589 support next.
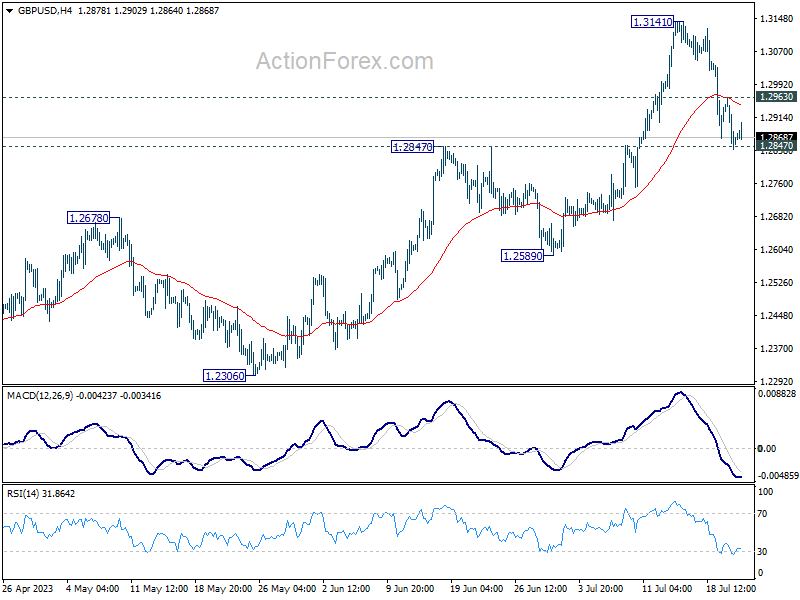
In the bigger picture, rise from 1.0351 medium term bottom (2022 low) is in progress. Next target is 100% projection of 1.0351 to 1.2445 from 1.1801 at 1.3895. Break there will target 1.4248 key long term resistance (2021 high) next. This will now remain the favored case as long as 1.2678 resistance turned support holds.