Sample Category Title
EUR/GBP Daily Outlook
Daily Pivots: (S1) 0.8602; (P) 0.8623; (R1) 0.8634; More...
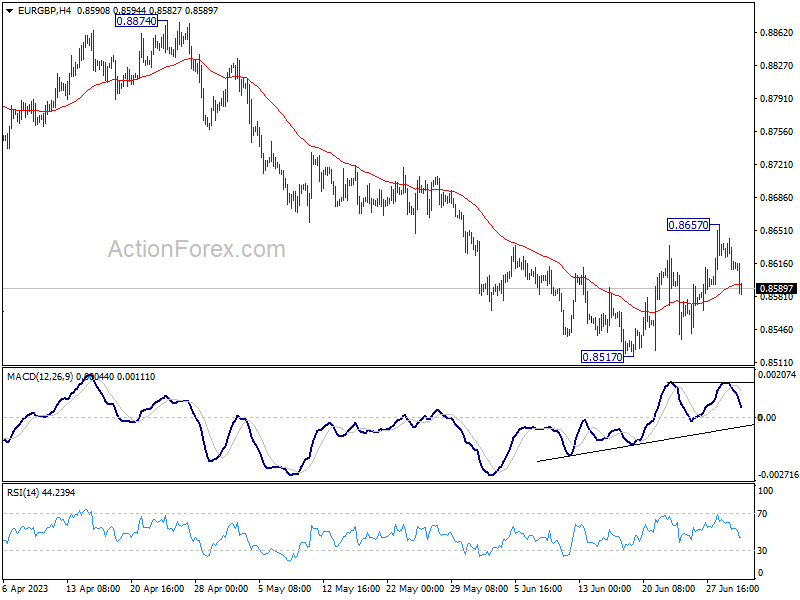
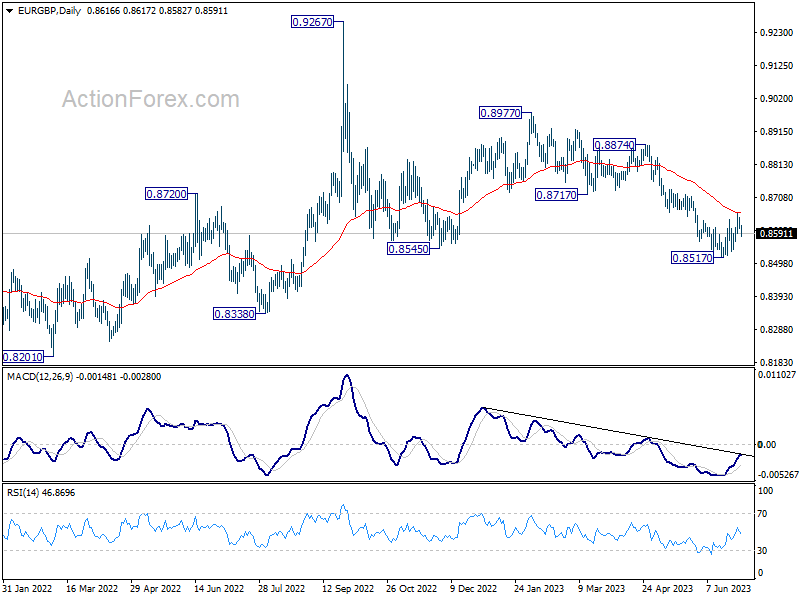
Intraday bias in EUR/GBP is turned neutral with current retreat. Rejection by 55 D EMA retains near term bearishness. Break of 0.8517 will resume the decline from 0.8977. On the upside, above 0.8657 resistance will resume the rebound from 0.8517.
In the bigger picture, the down trend from 0.9267 (2022 high) is still in progress. It's seen as part of the long term range pattern from 0.9499 (2020 high). Deeper fall could be seen towards 0.8201 (2022 low). But strong support should be seen from there to bring reversal. This will now remain the favored case as long as 0.8717 support turned resistance holds.
EUR/AUD Daily Outlook
Daily Pivots: (S1) 1.6365; (P) 1.6454; (R1) 1.6509; More...
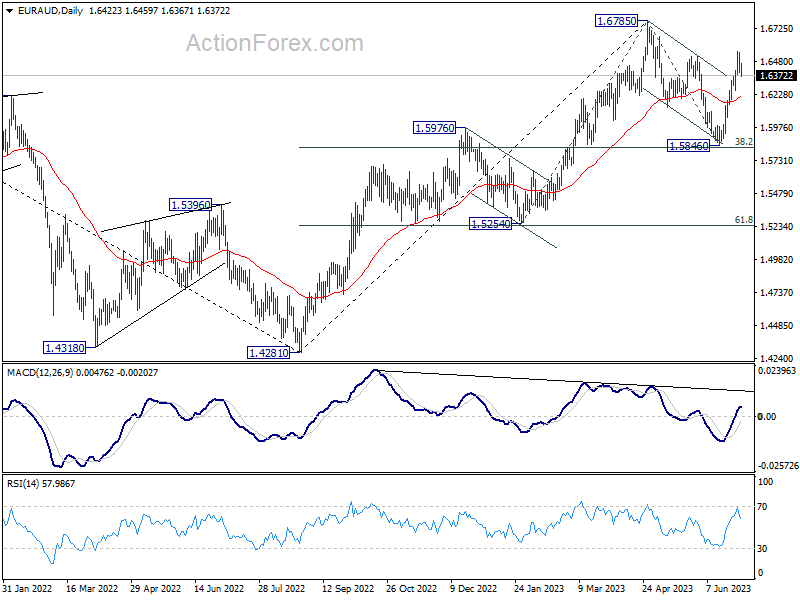
Intraday bias in EUR/AUD is turned neutral with current retreat. Further rally is expected as long as 1.6255 support holds. Correction from 1.6785 should have completed with three waves down to 1.5846. Above 1.6552 will target a retest on 1.6785 high next. Nevertheless, on the downside, break of 1.6255 will dampen this view and turn bias to the downside for 1.5846 support.
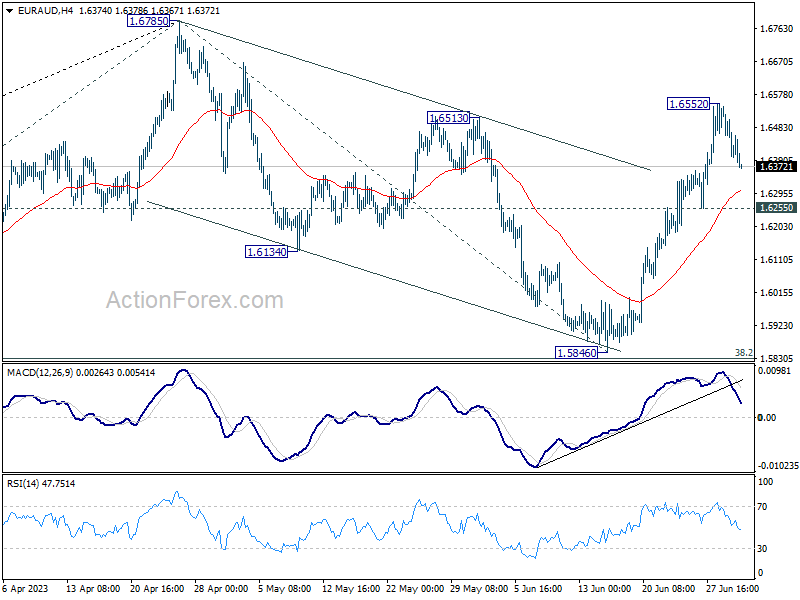
In the bigger picture, with 38.2% retracement of 1.4281 to 1.6785 at 1.5828 intact, rally from 1.4281 is still in progress. Firm break of 1.6785 will confirm rally resumption. Next target is 100% projection of 1.5254 to 1.6785 from 1.5846 at 1.7377. On the other hand, rejection by 1.6785 will extend the corrective pattern with another fall leg. But outlook will stay bullish as long as 1.5828 holds.
EUR/CHF Daily Outlook
Daily Pivots: (S1) 0.9757; (P) 0.9782; (R1) 0.9797; More...
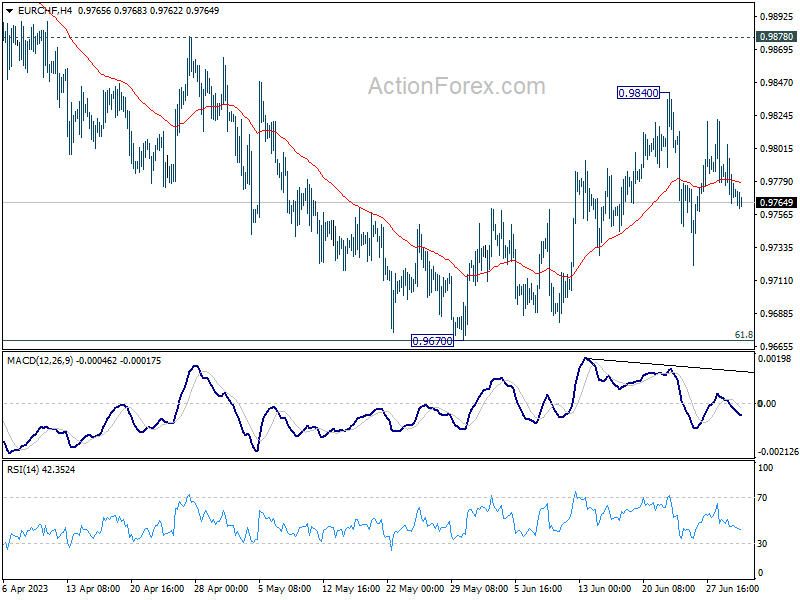
Range trading continues in EUR/CHF and intraday bias stays neutral for the moment. Another fall cannot be ruled out, to retest 0.9670 low. Sustained break there will resume the whole fall from 1.0095. Nevertheless, break of 0.9840 will resume the rebound from 0.9670 to 0.9878 resistance.
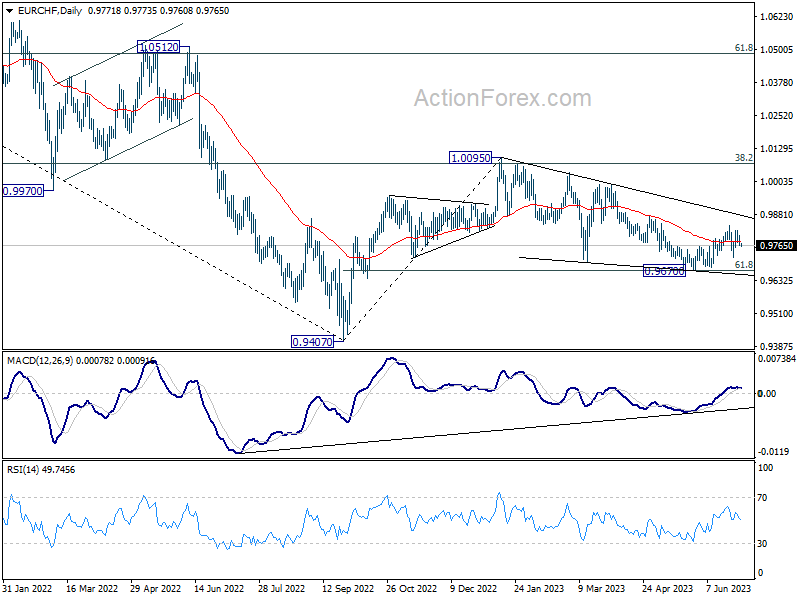
In the bigger picture, medium term outlook is staying bearish as the pair is capped below falling 55 W EMA (now at 0.9918). Down trend form 1.2004 (2018 high) is in favor to extend through 0.9407 at a later stage. Nevertheless, decisive break of 38.2% retracement of 1.1149 to 0.9407 will raise the chance of bullish trend reversal.
Japanese Yen Flirts with 145, Core CPI Ticks Upwards
- Japanese yen briefly falls below 145 line
- Tokyo Core CPI rises to 3.2%
- US GDP revised higher, unemployment claims slide
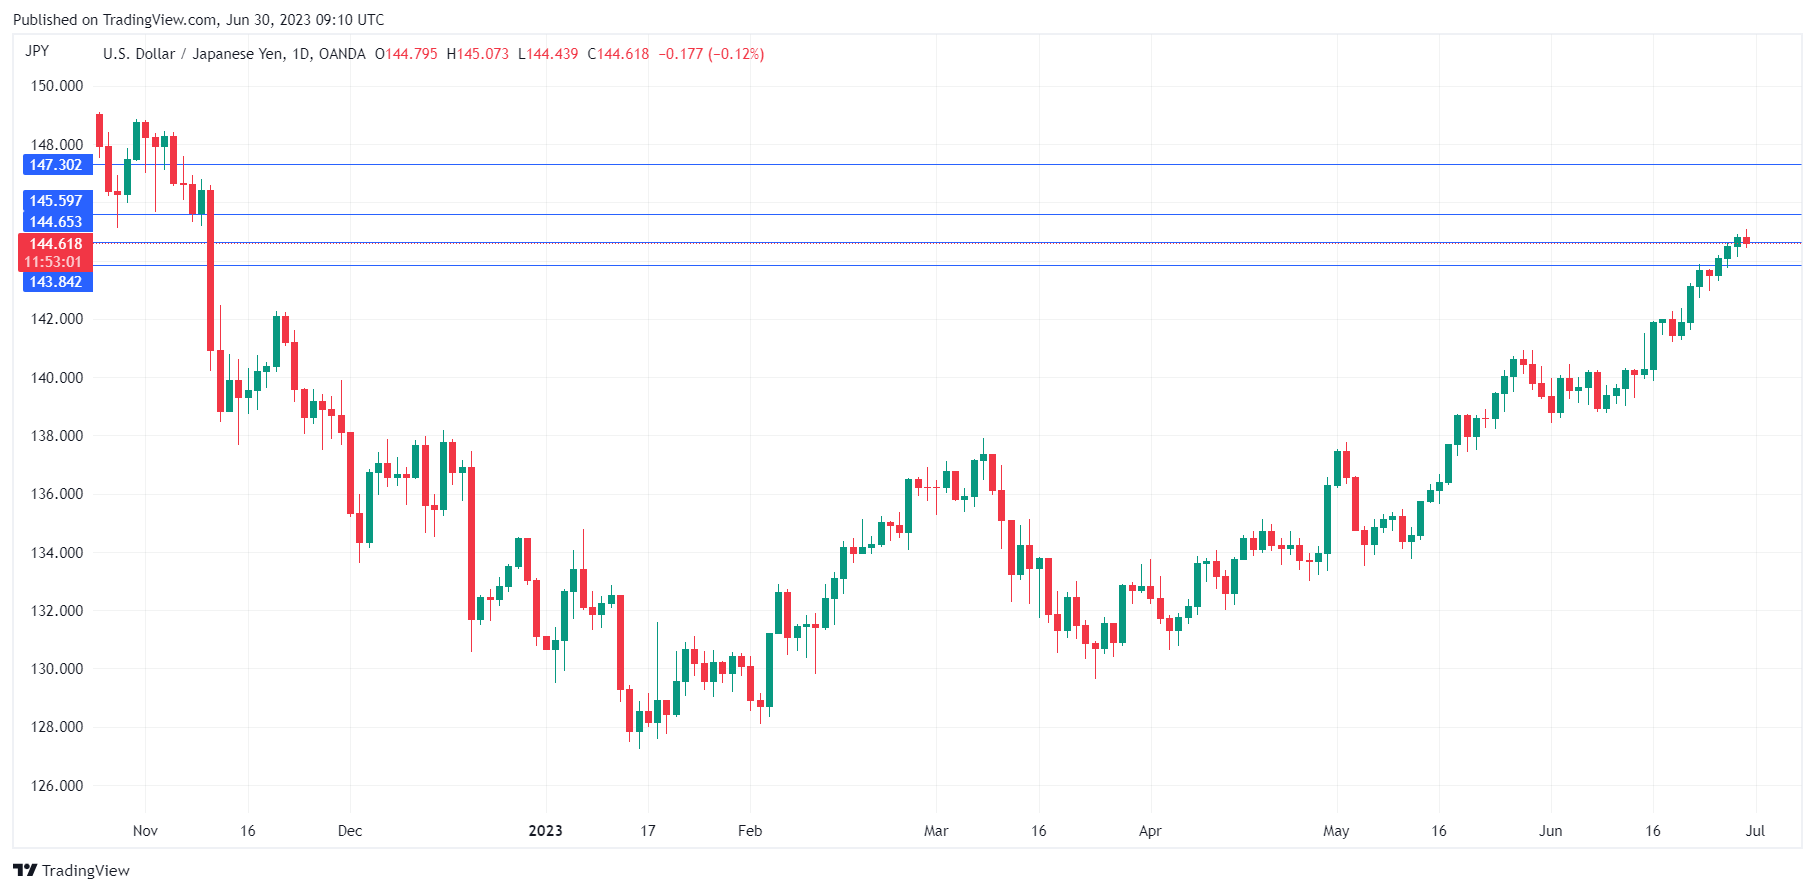
USD/JPY is showing limited movement, trading at 144.62 in the European session. The yen briefly fell below the symbolic 145 line earlier today.
Tokyo Core CPI inches higher
Tokyo Core CPI, a key inflation gauge, moved slightly higher in June. The index came in at 3.2% y/y, up from 3.1% in May but below the consensus of 3.3%. This marks the 13th straight month that Tokyo Core CPI has remained above the Bank of Japan’s 2% target.
The Tokyo inflation release, considered a leading indicator of inflation trends nationwide, points to inflation remaining high across the economy and puts into question the central bank’s stance that high inflation levels are temporary. BoJ Governor Ueda has stated often that he will maintain the Bank’s ultra-loose policy until stronger wage growth keeps inflation sustainably around the 2% target. I’m not sure how Ueda defines “sustainable”, but it’s clear that the BoJ has no intention of tightening rates anytime soon.
The BoJ’s ultra-loose policy has sent the yen on another sharp decline – USD/JPY is up a massive 9% since April 1st. The yen breached 145 on Friday, and Finance Minister Suzuki responded with a warning that Tokyo “would respond appropriately if the moves become excessive.” The Finance Ministry intervened in the currency markets late last year when the yen fell below 150, and intervention will become more likely if the yen continues to lose ground.
US GPD revised upwards, jobless claims sink
The US economy remains in solid shape. Final GDP for the first quarter rose 2.0%, a major revision from the 1.3% gain in the second estimate. Still, the Fed’s aggressive tightening is dampening economic activity. GDP growth in the third and fourth quarters of 2022 was 3.2% and 2.6%, respectively, and has declined to 2.0% in Q1. The US labor market continues to thrive despite the Fed’s rate hikes. Initial jobless claims plunged to 235,000, down from 239,000 prior and below the consensus of 264,000.
The GDP revision and the strong unemployment claims report have caused the markets to reprice upwards the probability of a rate hike in July. The CME FedWatch tool has priced in a 25-bp hike at 89%, up from 72% just one week ago.
USD/JPY Technical
- There is resistance at 144.65 and 145.36
- 143.94 and 142.94 are providing support
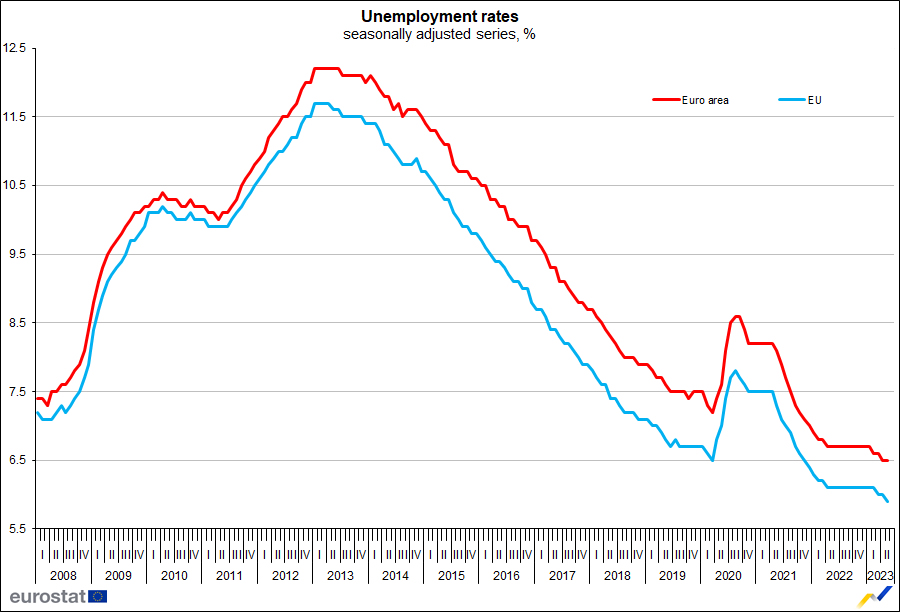
Eurozone unemployment rate unchanged at 6.5%, EU down to 5.9%
Eurozone unemployment rate was unchanged at 6.5% in May, matched expectations. EU unemployment rate ticked down from 6.0% to 5.9%.
Eurostat estimates that 12.937m persons in the EU, of whom 11.014, in Eurozone, were unemployed in May 2023. Compared with April 2023, unemployment decreased by -75k in the EU and by -57k in Eurozone.
Eurozone CPI slowed to 5.5% yoy in Jun, CPI core rose to 5.4% yoy
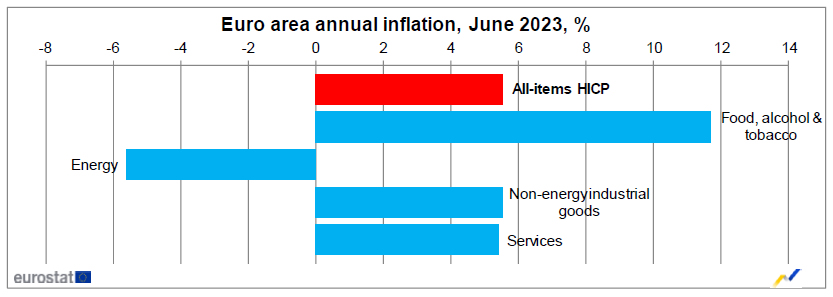
Eurozone CPI slowed from 6.1% yoy to 5.5% yoy in June, below expectation of 5.6% yoy. CPI core rose from 5.3% yoy to 5.4% yoy, matched expectations.
Looking at the main components, food, alcohol & tobacco is expected to have the highest annual rate(11.7%, compared with 12.5% in May), followed by non-energy industrial goods (5.5%, compared with 5.8% in May), services (5.4%, compared with 5.0% in May) and energy (-5.6%, compared with -1.8% in May).
EUR/USD Holding at Key Support Zone Ahead of EU Inflation Data
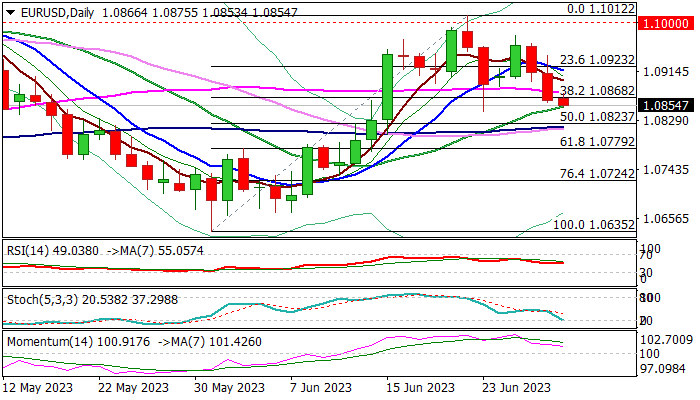
Bears are taking a breather early Friday and consolidating ahead of release of EU June inflation data.
The pair was down almost 0.9% in past two days, pressured by stronger dollar on solid US economic data which add to Fed’s hawkish stance.
Thursday’s close below important Fibo support at 1.0868 (38.2% of 1.0635/1.1012) generated initial bearish signal, which will look for verification on weekly close below this level, with violation of nearby supports at 1.0853/44 (20DMA / June 23 trough) top to strengthen bearish near-term stance and open way for deeper drop.
Daily studies weakened and Monday’s twist of daily cloud is magnetic, contributing to negative outlook, however, overall picture is still bullishly aligned (14-d momentum is in positive territory and price action remains above daily cloud), requiring caution, as bears may face headwinds at this zone.
EU annualized headline inflation is expected to drop further in June (5.6% f/c vs May 6.1%) and provide some relief, but core CPI, closely watched by the ECB, is expected to rise to 5.5% in June from 5.3% previous month, which keeps the policymakers alerted and contributes to signals that the central bank will remain on hiking path.
We will be watching the reaction at 1.0840/50 zone, which is expected to generate fresh direction signal.
Firm break lower to signal bearish continuation and expose targets at (1.0823 (daily Kijun-sen / 50% retracement of 1.0653/1.1012) and 1.0779 (Fibo 61.8%) in extension.
Conversely, failure to break lower would question near-term bears, with lift and close above 55DMA (1.0877) to ease downside pressure, but more work at the upside will be required (break above 10DMA at 1.0916) to signal reversal.
Res: 1.0868; 1.0877; 1.0916; 1.0976.
Sup: 1.0844; 1.0823; 1.0813; 1.0779.
GBPJPY Flatlines Near 7½-Year Peak
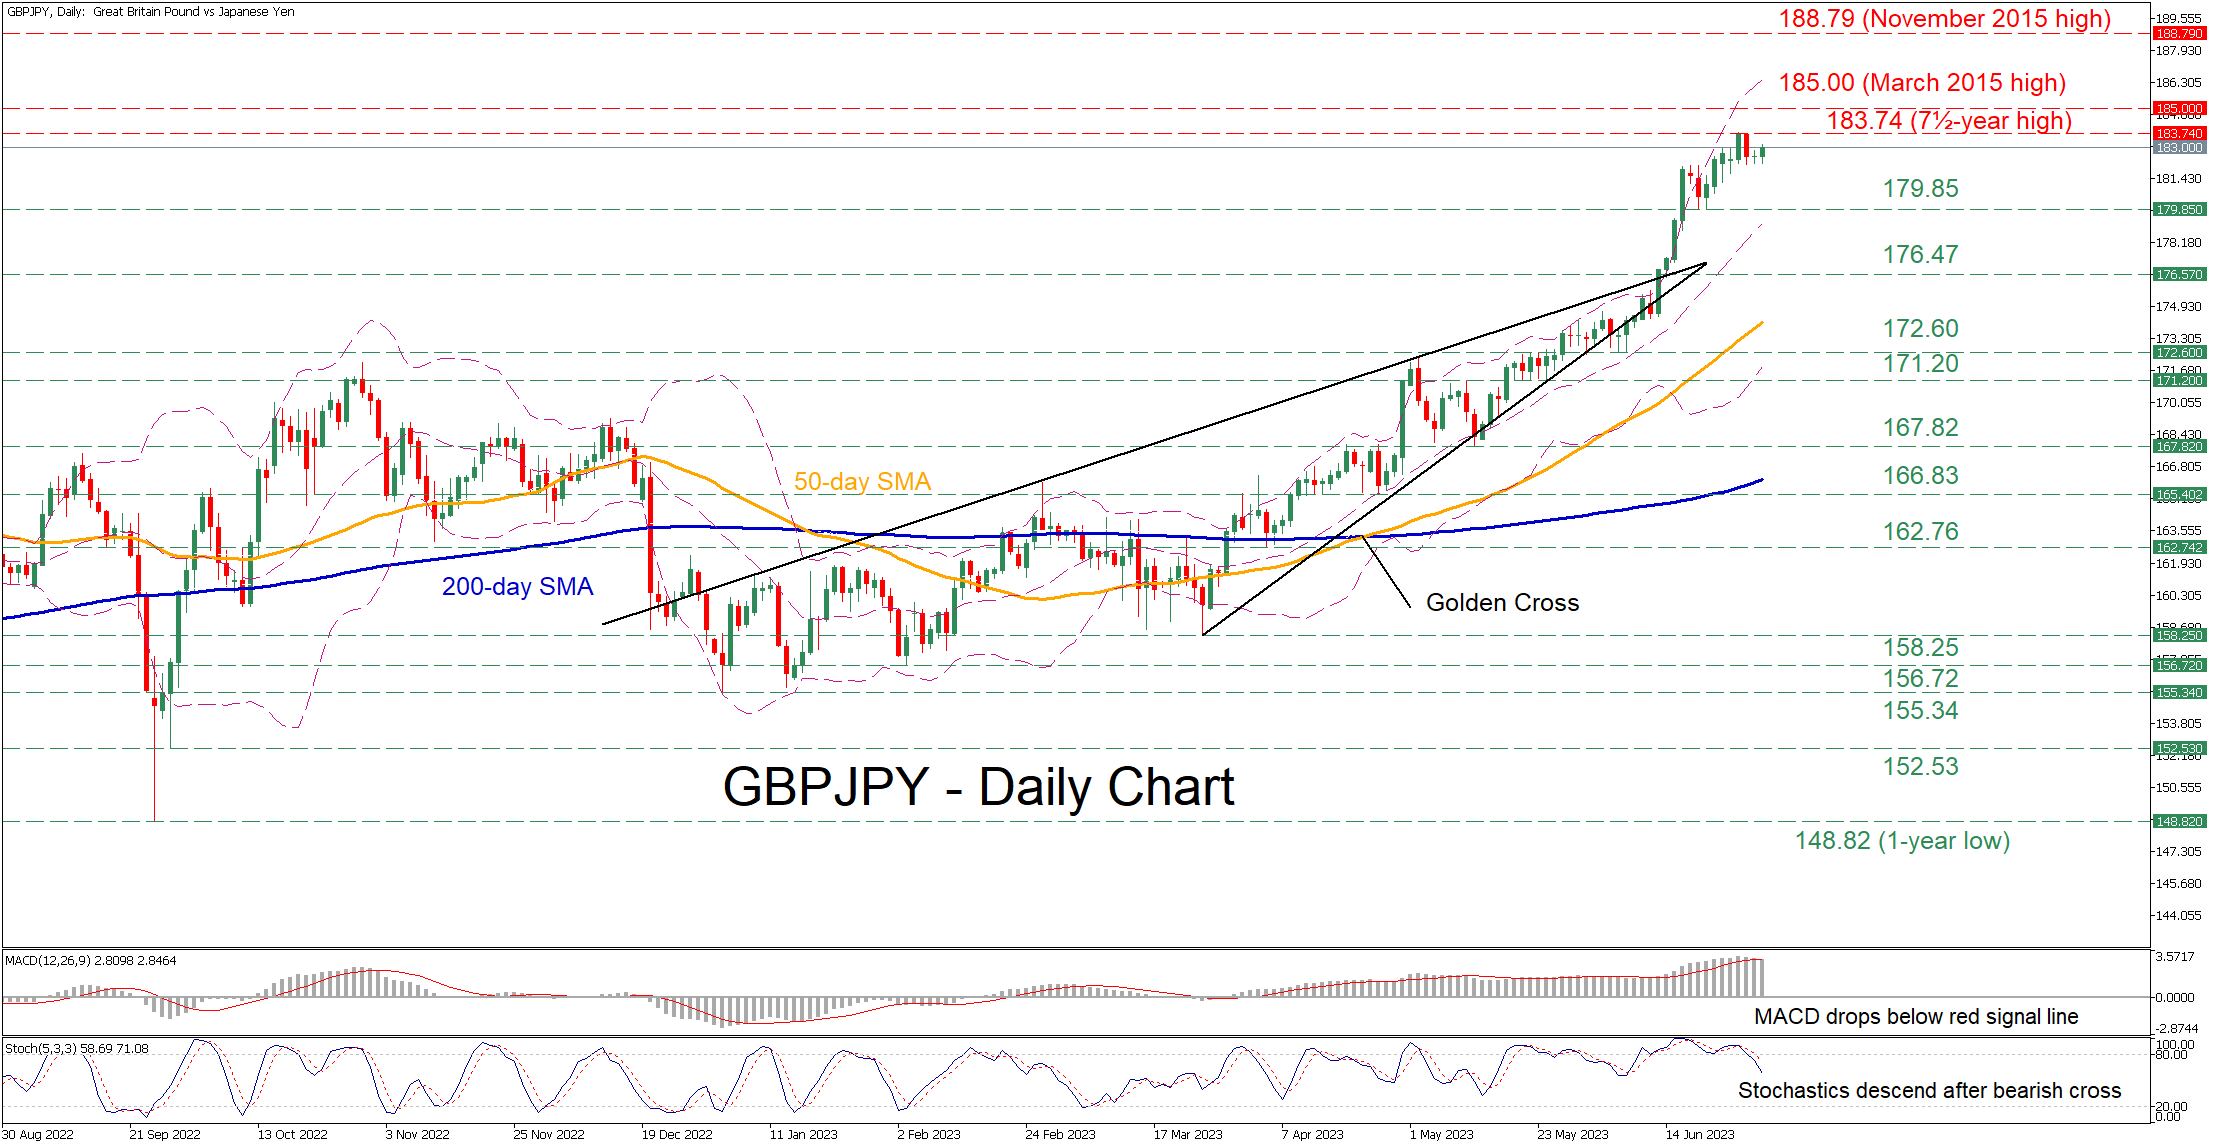
GBPJPY has been stuck in a prolonged uptrend since the beginning of the year, generating a structure of consecutive multi-year highs. In the near-term, the price seems to be consolidating near the 7½-year high of 183.74, appearing to be unable to extend its rally.
The momentum indicators currently suggest that bullish forces are waning. Specifically, the MACD dropped below its red trigger line but remains positive, while the stochastic oscillator is descending after exiting its oversold zone.
Should buying pressures fade and the price reverse lower, the recent support of 179.65 could act as the first line of defense. If that barricade fails, the spotlight could turn to 176.47 before the June low of 172.60 gets tested. Breaking below the latter, the pair could then face the May support of 171.20.
Alternatively, if the pair resumes its advance, the 7½-year high of 183.74 could prove to be the first hurdle for buyers to clear. Breaking above that wall, the price could ascend to post fresh multi-year highs, where the March 2015 peak of 185.00 could cap its upside. A violation of that zone could trigger a rally towards the November 2015 high of 188.79.
In brief, GBPJPY is consolidating near its multi-year highs as positive momentum seems to be fading. Therefore, the pair could adopt a sideways pattern or even experience a pullback before the bulls try to push the price higher.
Gold at a Crossroads
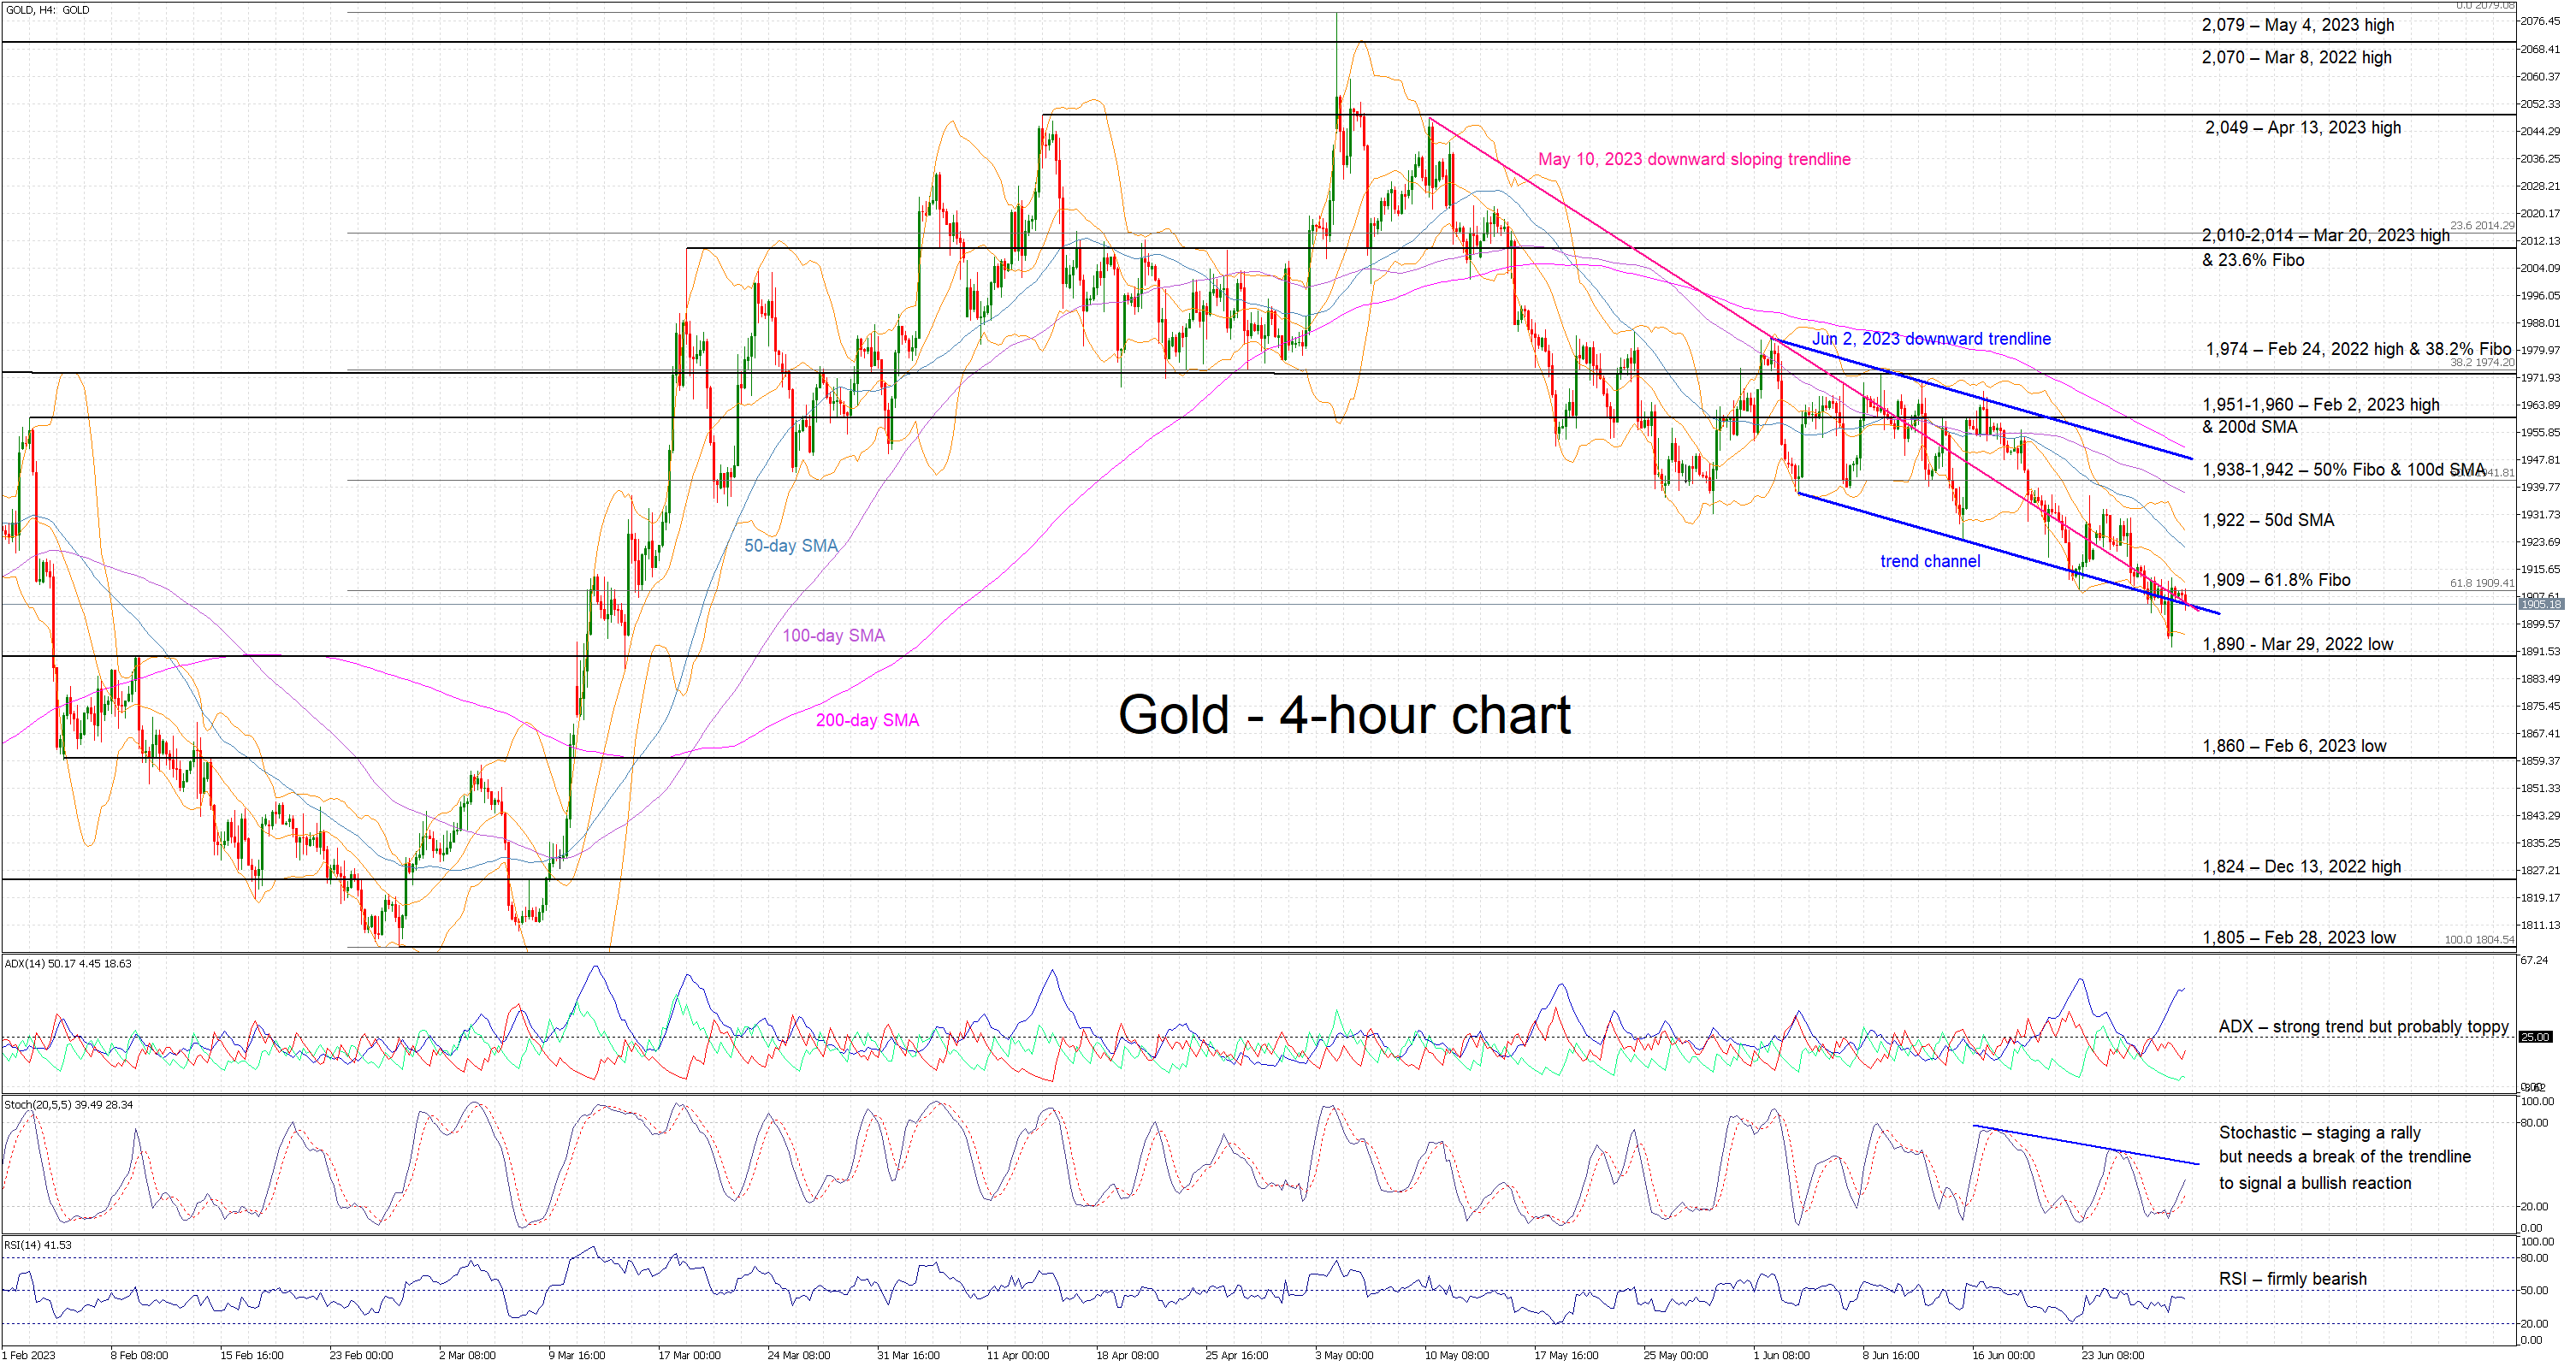
Gold is gliding lower today, trading close to its lowest level since March 2023 and carrying on the bearish trend that kicked off on June 2, 2023. It is currently battling with the lower boundary of the recent trend channel and the May 10, 2023 downward sloping trendline. Gold had a quick look at the sub-1,900 area yesterday but quickly bounced higher, revealing pockets of resistance in this area.
The momentum indicators are somewhat split at this stage. The RSI remains below its 50-midpoint, confirming the current bearish pressure. In addition, the Average Directional Movement Index (ADX) has jumped to an extremely high level, reflecting the underlying strength of the current downleg, but also showing some initial signs that it is probably close to its peak.
Should the bears believe that the current pullback has not run its course, they would love a move below the critical 1,900 threshold. This appears to be the ultimate test of the bears’ determination and, if they are successful, they could then test the support set March 29, 2022 low at 1,890. Even lower, the February 6, 2023 low at 1,860 awaits them.
On the other hand, the stochastic oscillator is staging a small rally. This is pointing to a bullish tendency in the market that is not yet enough to halt the short-term bearish trend. Should the stochastic break its formed downward trendline, it would allow the bulls to make an attempt to recover part of their recent losses. They would quickly try to push gold above the 61.8% Fibonacci retracement of February 28, 2023 – May 4, 2023 uptrend at 1,909, before looking higher, and more specifically, at the 50-day simple moving average (SMA) at 1,922.
To sum up, gold is firmly in a short-term bearish trend, but the biggest battle for the 1,900 threshold has just begun.
Has USDCAD Started a New Bullish Cycle?
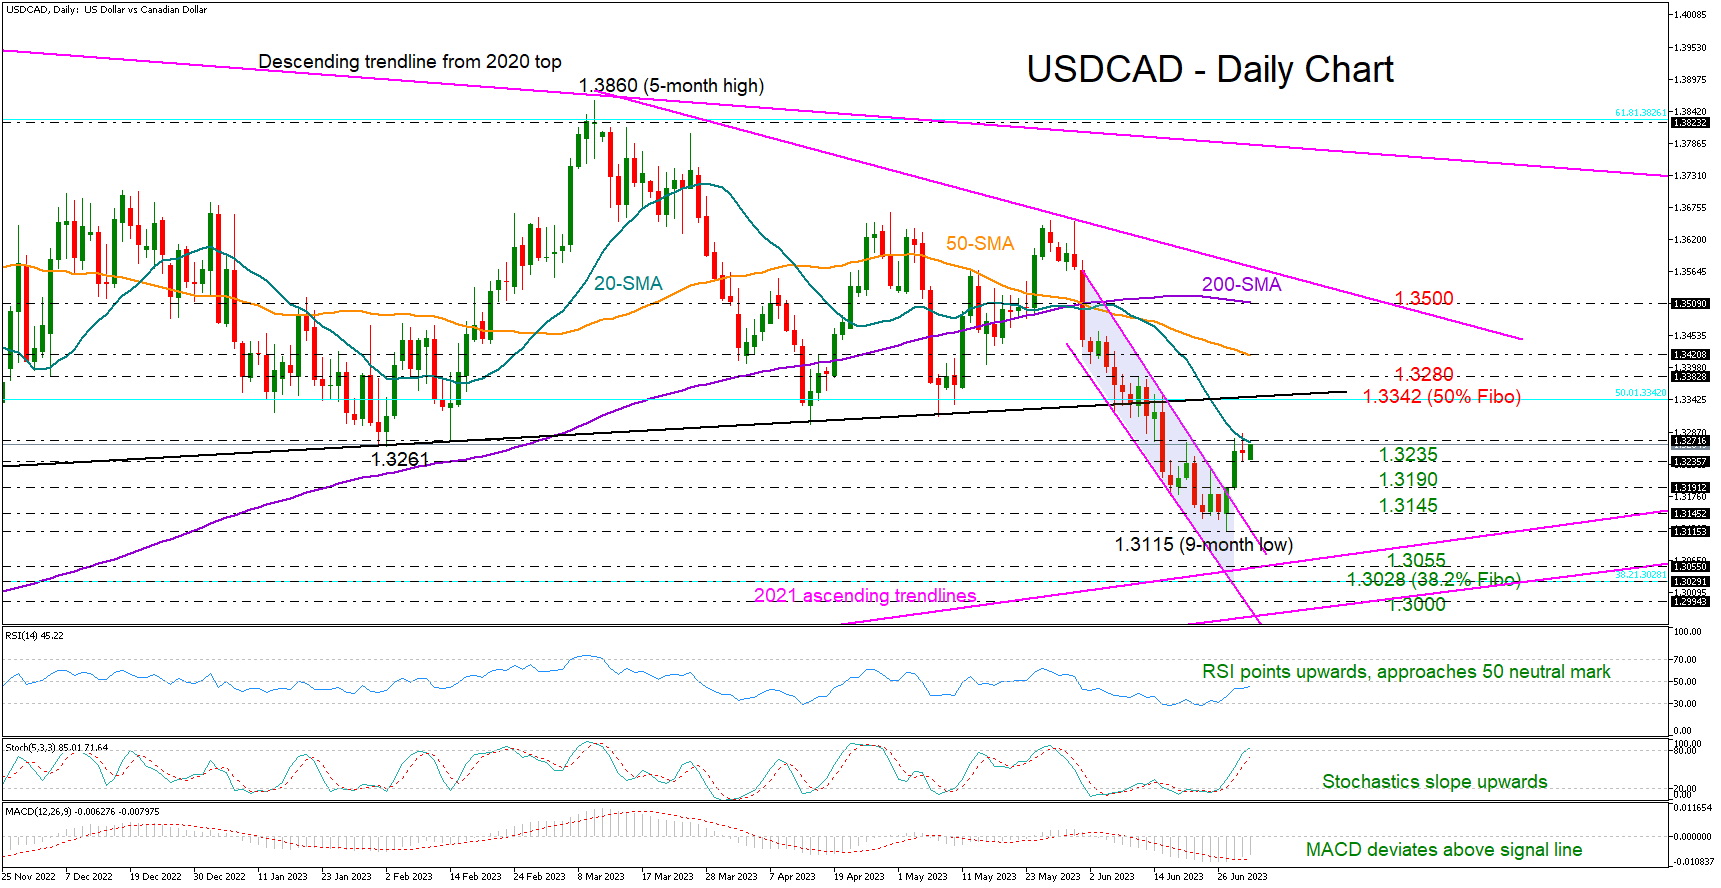
USDCAD rose quickly above the tight bearish channel, but soon stopped around February's lows and near its 20-day SMA on Thursday.
The pair is set to close the month down by 2.3%, marking its worst monthly performance since 2021. That said, the recent bullish channel breakout continues to look promising as both the RSI and MACD are showing a convincing improvement, indicating an encouraging start to July.
If the 20-day SMA at 1.3270 gives way, the price may advance straight to the broken, almost- flat support trendline from November 2022 seen at 1.3350. The 50% Fibonacci retracement of the 1.4667-1.2006 downtrend is adding extra importance to this region. Therefore, a successful move higher and above the nearby resistance of 1.3380 might add extra impetus to the price, bringing the 50-day SMA at 1.3420 next into view. Should the latter prove fragile, the recovery could pick up steam towards the 200-day SMA at 1.3500.
Alternatively, the price could slide to retest Thursday’s low of 1.3235. A continuation lower could examine the 1.3190 constraining zone ahead of June’s floor of 1.3145. Another failure here might threaten a downtrend extension towards the 1.3055-1.3000 zone, which encapsulates two key ascending trendlines from the 2021 lows and the 38.2% Fibonacci level.
In brief, USDCAD is expected to preserve its recovery mood, but traders might wisely wait for a close above the 20-day MA before they drive the pair higher.