Sample Category Title
We Confirm Our Call for 0.25% Increase in Cash Rate Next Week
The Reserve Bank Board meets next week on July 4. We confirm our view that the Board will decide to lift the cash rate by 0.25% to 4.35% at the July meeting with a further 0.25% increase to follow in August.
With core inflation holding above 6%; the unemployment rate holding nearly 1 ppt below the NAIRU (RBA's estimate) and the cash rate only around 1 ppt into contractionary territory (we see neutral around 3%) the cash rate will need to go higher. A second pause, to gather further information, seems unnecessary and only risks the need for the cycle to extend even further into 2023 when the prospects for damage to the economy increase substantially.
A terminal cash rate of 4.6% is likely to be sufficient to achieve the Bank's inflation objectives, although growth is forecast to slow to a crawl this year and next. Westpac's forecasts, which are based on a 4.6% terminal rate, point to very weak growth in both 2023 (0.6%) and 2024 (1.0%) and an earlier achievement of the inflation target than currently forecast by the RBA.
The case for a further rate increase has strengthened since the last Board meeting on June 6.
Of most importance are indications that the Board has, appropriately, adjusted its reaction function at the June meeting to prioritise containing inflationary expectations and addressing the risk (admittedly low) of a 1970s-style extended period of high inflation. Specifically, the minutes to the meeting noted that: "Members discussed the possibility of implicit indexation of wages to past high inflation and the potential for this to become widespread."
The objective of "preserving as many of the gains in employment as possible" is still noted by the Board in the minutes but other communication suggests it is taking a more cautious approach to safeguarding employment gains. Deputy Governor Bullock in a speech on June 20 indicated that the Board's inflation objective could not be achieved without the unemployment rate rising to 4.5%. Recall that the unemployment rate was around 5% before the pandemic, so an unemployment rate objective of 4.5% only represents a modest 0.5% net gain.
There have been some the key developments in the economy since that last Board meeting.
- The unemployment rate fell from 3.7% to 3.6% in May – remaining near recent lows despite the 4% tightening cycle.
- Jobs growth printed 76,000 in May – well above market consensus of 15,000 and Westpac's forecast of 40,000, meaning that the monthly pace of jobs growth has hardly slowed since the tightening cycle began.
- Business surveys continue to point to intense labour shortages. Official job vacancies fell a modest 2% between February and May – a slightly slower pace than the 2.2% fall we saw between November and February with the vacancy-to-unemployed ratio still 0.83 compared to 0.27 before the pandemic.
- The May CPI indicator showed a sharp fall in headline inflation to 5.6% in May from 6.8% in April but was largely due to volatile items (fruit, vegetables and fuel) and holiday travel. The Reserve Bank typically strips out these items when assessing inflation trends. Annual inflation in the CPI excluding volatile items and holiday travel fell from 6.5% to 6.4%, while the monthly increase in this measure lifted from 0.2% in April to 0.5% in May. Fuel provides a clear example of the risks involved with relying on monthly moves without adjusting for volatile items. Fuel prices fell 7.6% in May but are already up 6.4% over the June month to date.
- The measure for the trimmed mean inflation fell from 6.7% to 6.1%. Even if the fall is confirmed by the much more reliable June quarter CPI, annual underlying inflation at over 6% at a time when the unemployment rate is holding well below full employment is not consistent with pausing.
- The RBA should be unnerved by dwelling prices which have continued to post gains despite recent rate hikes – an unwelcome 1.4% rise in May has been followed by what looks to be a further 1.3% lift in June.
- A surprise 0.7% lift in nominal retail sales in May suggests consumer demand has retained some momentum in the second quarter, albeit with volumes still tracking a subdued pace.
- The March quarter national accounts reported a further lift in annual unit labour costs growth, surging to 7.9%yr, up from 7%yr in December and just 4%yr in June last year. Unit labour costs, which are closely linked to market services inflation, have become a particular source of concern for the Board.
- The surprise 50 basis point lift by the Bank of England, last week, highlights the general mood overseas that central banks expect that their tightening cycles have further to run.
What are the arguments against a move?
The July decision comes one month before the Board can assess the staff's revised inflation and growth forecasts, which are refreshed in February, May, August and November. This will include an extension of the forecasting horizon out to the end of 2025.
The minutes to the June meeting show there is already unease on the Board about the time being taken to reach the inflation target. Specifically: "… members noted that a more prolonged period of above-target inflation would increase the risk that firms' and households' expectations for inflation rise." Waiting for the refreshed forecasts is always a respectable reason not to move. It seems unlikely that they will entail any change in the 'timetable' and should include the expectation that inflation will be in the centre of the target band by end 2025.
The Board minutes describe the arguments for and against the June tightening as 'finely balanced'. My view is that arguments will always be 'finely balanced' near the peak of a tightening cycle.
But from the perspective of our forecast for July, a much more troubling aspect of the minutes is the absence of the comment that "some further tightening of monetary policy may be required". This was used by the Governor in his statement following the decision and repeated in his speech the following day, which the Board minutes noted "would provide an opportunity to explain the decision in more detail."
It would be extraordinary if the omission of this sentence was a basic oversight, especially when used twice by the Governor in other communication.
With the Governor nearing the end of his tenure, the spectre of the recommendations of the recent Review of the Reserve Bank, and some turnover at Board level the current task of forecasting monetary policy has become even more challenging.
We can only promote what we think is the appropriate decision given the issues outlined above.
Last month the Board had two high profile triggers to move – the award wage agreements and the increase in the monthly inflation gauge.
A more tentative Board than we think should be appropriate at this stage of the cycle which does not have the high profile "trigger" of the wage agreements and the temporary boost from the monthly Inflation Indicator could choose to pause pending more information.
Given the issues, which are clearly pointing to the need for higher rates, a second pause in this cycle seems inappropriate and unnecessarily complicates the central task of bringing inflation back into line.
Cliff Notes: Persistence of Underlying Inflation Continues to Trouble Policy Makers
Key insights from the week that was.
The main data release for Australia this week was the Monthly CPI Indicator which provided a mixed read on current inflation trends. The headline index surprised to the downside in May, the 0.4% monthly decline seeing the annual rate ease from 6.8%yr in April to 5.6%yr. The detail was broadly as anticipated, with prices for many services still rising on a monthly basis; however, a large decline in holiday travel and accommodation prices (–11.3%mth) more than offset this.
Measures of underlying inflation were more resilient however, the recently reinstated annual trimmed mean only falling from 6.7%yr to 6.1%yr, while the index that excludes volatile items (including holiday travel) was little changed. If anything, the May update reinforces the fact that the Monthly CPI Indicator is a volatile gauge, making it difficult to obtain a clear read through the quarter.
The decline in job vacancies was modest. From a high level, the 2.0% fall over the three months to May leaves vacancies just 10% below their May 2022 peak and still almost twice the level observed before the onset of the pandemic. This is consistent with other labour market indicators, including the Labour Force Survey and business surveys like the Westpac-ACCI Survey on Industrial Trends, which suggest the labour market remains historically tight with only tentative signs of easing evident.
It is also interesting to note that retail sales surprised to the upside in May, rising 0.7%mth after a poor run since December. Considering the context — high inflation and strong population growth — nominal spending in May is still best considered weak. We estimate that sales volumes were flat in Q2.
As outlined by Chief Economist Bill Evans, the persistence of service sector inflation and labour market strength warrant the RBA tightening further in July and August; and, as important, thereafter holding the resulting 4.60% cash rate peak into 2024. That said, from May 2024 to end-2025, there will be need for concerted policy easing as activity growth remains materially below trend and the unemployment rate rises above the RBA’s estimate of full employment.
Offshore, attention was focussed on the ECB Forum on Central Banking in Sintra, Portugal. Overall, the policy panel, which included the heads of the Bank of England, Bank of Japan, the European Central Bank and the US Federal Reserve, made clear that further tightening is likely to prove necessary in coming months.
The ECB’s Lagarde signalled a hike in July remains the Council’s expectation; however, she pushed back on the idea that a follow-up move in September was certain, citing the slew of data to be released between now and then. Sticky underlying inflation and labour market strength justify the ECB’s hawkish bias.
Looking back to the June decision, the BoE’s Bailey clarified that the step up to a 50bp hike occurred because the Bank believed data to hand warranted two further 25bp hikes. Bailey also pointed out that policy transmission was slower in this tightening cycle, with circa 85% of all mortgages being fixed rate loans. The UK’s tight labour market is expected to remain a concern for inflation, with many businesses expected to hold on to labour through the impending downturn.
Unsurprisingly, FOMC’s Chair Powell also highlighted strength in the labour market, although he pointed out that momentum was heading in the right direction and risks coming into balance. The Committee’s median expectation of two more hikes in 2023 was referenced, but Chair Powell also made clear the FOMC’s actions would remain data dependent. (Note, Chair Powell subsequently spoke at a Bank of Spain event, although the primary focus was financial stability.)
In stark contrast to the above speakers, BoJ’s Governor Ueda subsequently justified holding policy steady, referencing moderate ‘underlying inflation’ and a continued belief that headline and core inflation would return below target towards the end of 2025.
Coupled with the light but constructive data flow for the US and other markets, the above comments on policy led the market to price in a greater chance of ‘higher rates for longer’, the US 2 and 10-year yields, as examples, currently 12bps and 10bps higher than the end of last week, respectively 4.86% and 3.84%. With respect to the short-term risks for policy rates, the market’s concern is acute for the UK, with 5 more hikes priced by December/February versus the 1-2 moves for the FOMC and ECB.
Turning then to the international data received. While modest in scale, the market was most surprised by the revision in the third estimate of Q1 US GDP from 1.3% to 2.0% annualised. This update occurred because of a mix of modestly stronger consumption; slightly less inflation; and better exports. The market’s response also looked to be supported by initial jobless claims retreating near their historic lows.
Earlier in the week, the US saw a substantial 12% gain in new home sales in May as existing home supply remained constrained – pending home sales 21% lower than a year ago in May and S&P CoreLogic CS’ April house price gain of 0.9% attesting to the latter. Durable goods orders also gained 1.7% in May, though much of the orders uptick reportedly came from the transportation sector as easing supply chain pressures prompted car manufacturers to ramp up production.
USD/JPY Accelerates Higher and Seems Unstoppable
Key Highlights
- USD/JPY extended gains above the 144.00 resistance zone.
- A key bullish trend line is forming with support near 144.15 on the 4-hour chart.
- EUR/USD is stuck in a range below the 1.1000 resistance.
- GBP/USD extended its decline below the 1.2680 support.
USD/JPY Technical Analysis
The US Dollar started a steady increase above the 142.50 resistance against the Japanese Yen. USD/JPY broke many hurdles near 143.50 to move further into a positive zone.
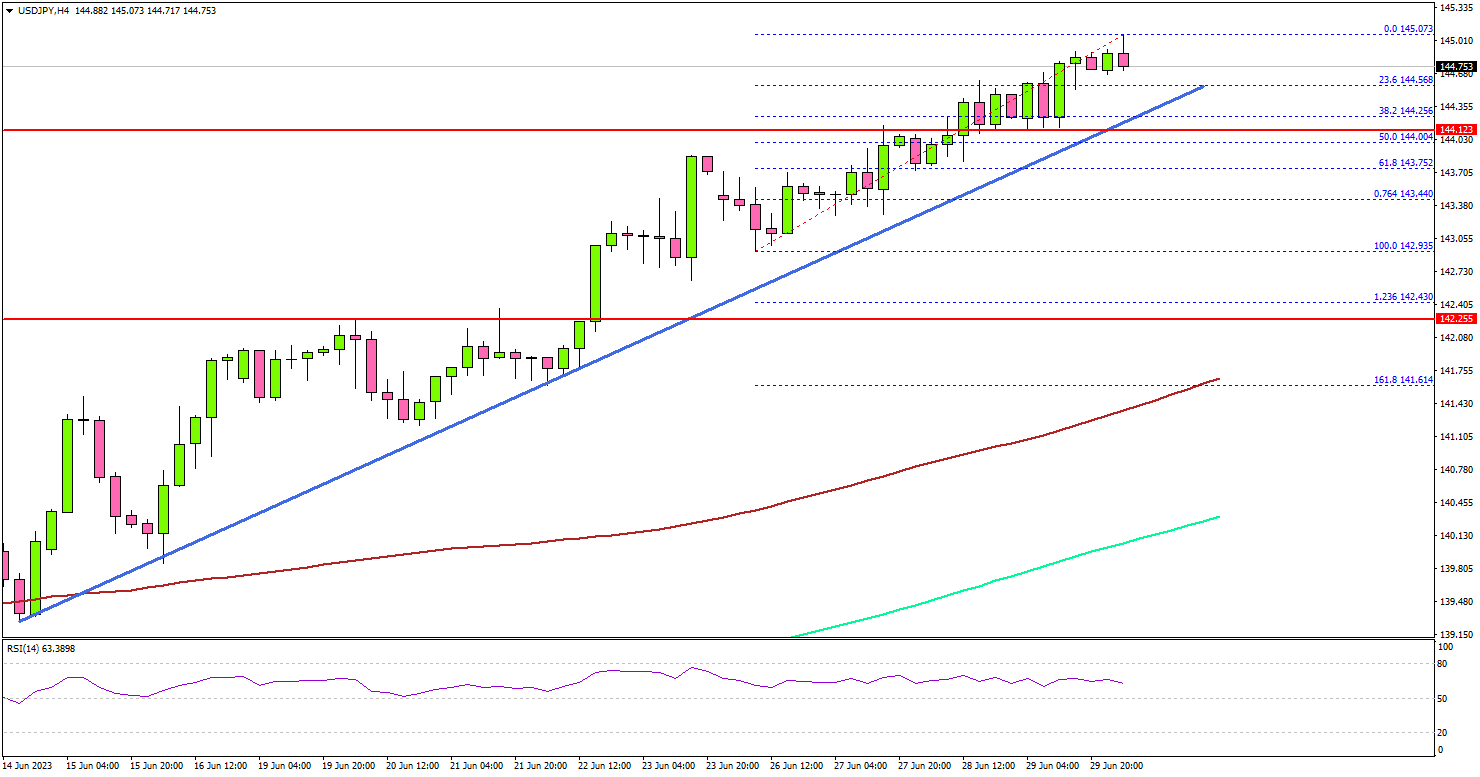
Looking at the 4-hour chart, the pair gained pace above 144.00. It also settled well above the 144.00 level, the 100 simple moving average (red, 4 hours), and the 200 simple moving average (green, 4 hours).
It seems like the bulls are aiming for more gains above the 145.00 resistance. On the upside, the first major resistance above 145.00 is near the 145.50 zone.
If there is a move above the 145.50 resistance, the pair could rise toward 146.20. Any more gains might send USD/JPY toward the 147.00 level.
Immediate support is near the 144.20 level. There is also a key bullish trend line forming with support near 144.15 on the same chart. The next major support is near the 143.65 level. If there is a downside break below the 143.65 support, the pair could decline toward the 143.00 support.
Looking at EUR/USD, the pair is struggling to clear the 1.1000 resistance zone and there are chances of a downside correction.
Economic Releases
- UK GDP for Q1 2023 (QoQ) - Forecast +0.1%, versus +0.1% previous.
- Euro Zone CPI for June 2023 (YoY) - Forecast +5.6%, versus +6.1% previous.
- Euro Zone CPI for June 2023 (MoM) - Forecast 0%, versus 0% previous.
EURJPY Bullish Impulse Elliott Wave Structure Calling Higher
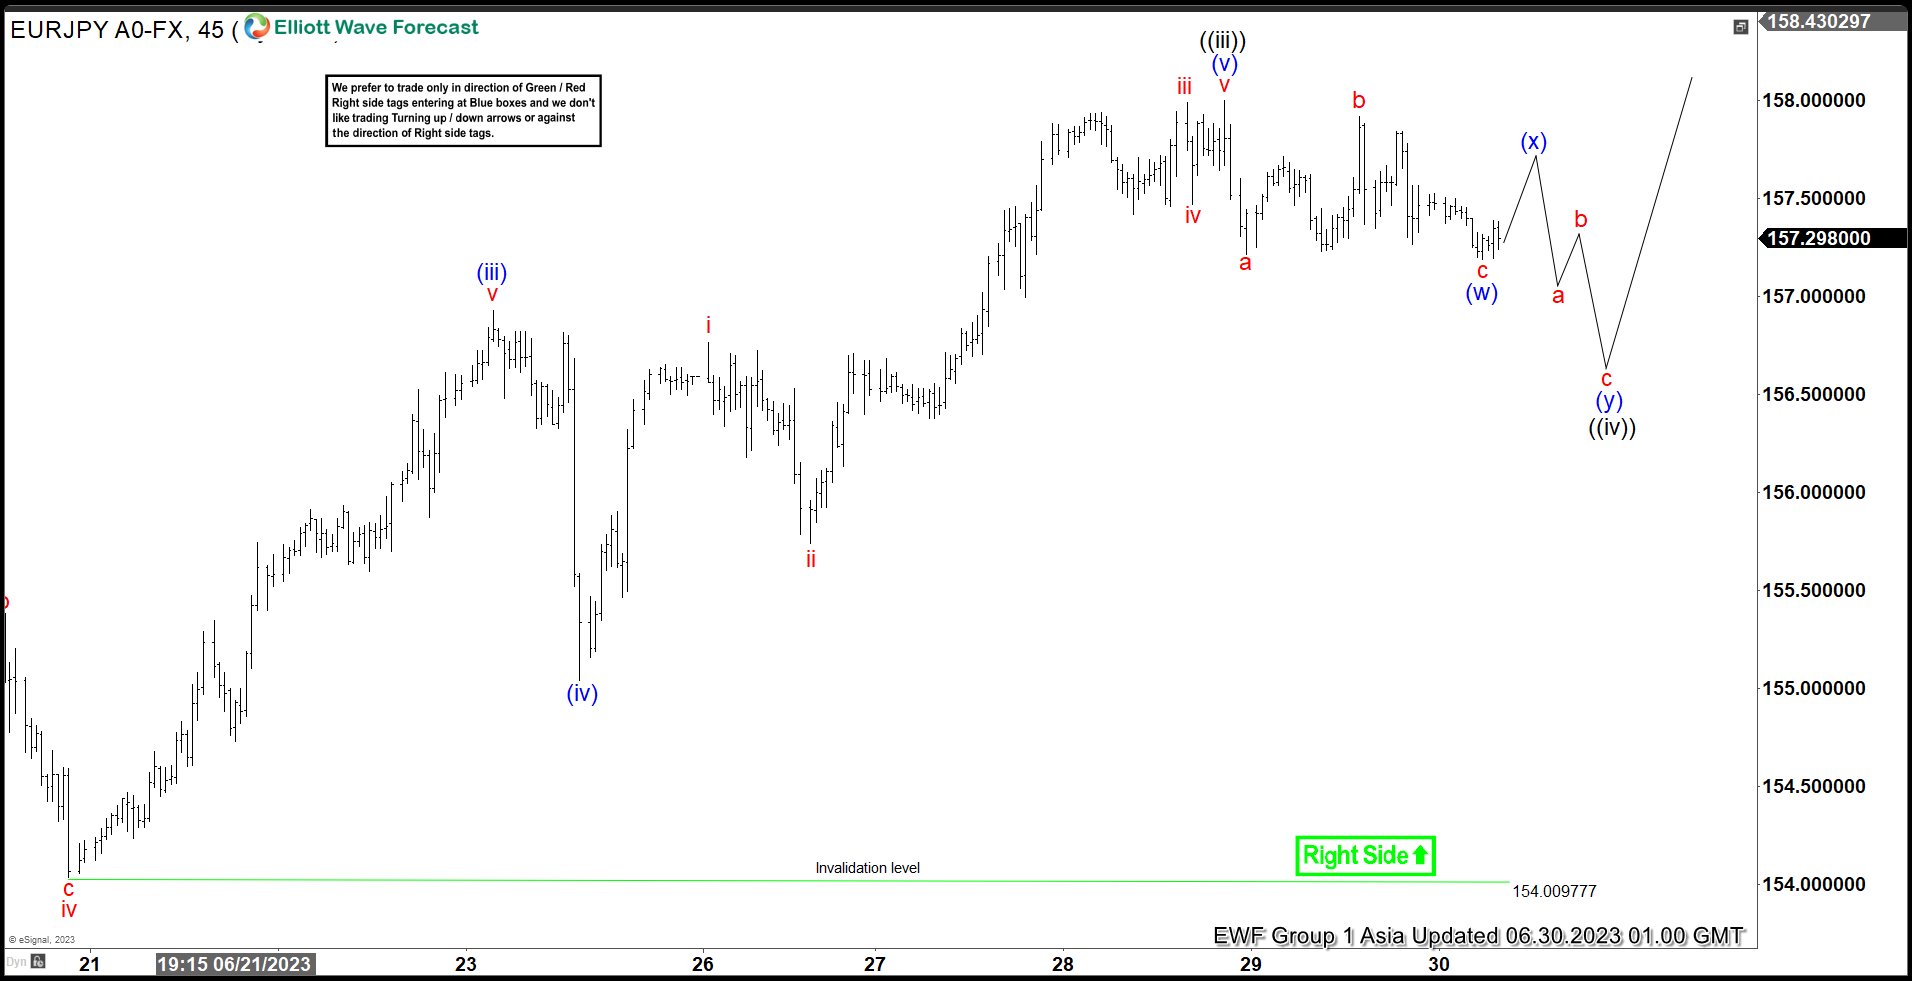
Short term view in EURJPY suggests rally from 5.11.2023 low is unfolding as a 5 waves impulse. Up from 5.11.2023 low, wave ((i)) ended at 151.06 and pullback in wave ((ii)) ended at 148.596. The pair then rallies higher in wave ((iii)) in 5 waves of lesser degree. Up from wave ((ii)), wave (i) ended at 150.19 and pullback in wave (ii) ended at 148.61. Pair extended higher in wave (iii) towards 156.93 and pullback in wave (iv) ended at 155.04. Final leg wave (v) ended at 158 which completed wave ((iii)) in higher degree as the 45 minutes chart below shows.
Pullback in wave ((iv)) is currently in progress as a double three Elliott Wave structure. Down from wave ((iii)), wave a ended at 157.216 and wave b ended at 157.919. Wave c lower ended at 157.19 which completed wave (w). Expect pair to rally in wave (x) to correct cycle from 6.28.2023 high (158) before turning lower again in 3 waves to complete wave (y). This should complete wave ((iv)) in higher degree before pair resumes higher again. Near term, as far as pivot at 154 low stays intact, expect pullback to find support in 3, 7, or 11 swing for further upside.
EURJPY 45 Minutes Elliott Wave Chart
EURJPY Elliott Wave ChartEURJPY Elliott Wave Video
https://www.youtube.com/watch?v=zYV9E02jb8c
EURCAD Wave Analysis
- EURCAD reversed from resistance level 1.4500
- Likely to fall to support level 1.4300
EURCAD currency pair recently reversed down from the key resistance level 1.4500 (top of the previous impulse wave (i)) intersecting with the upper daily Bollinger Band.
The downward reversal from the resistance level 1.4500 created the daily Japanese candlesticks reversal pattern Shooting Star Doji.
EURCAD currency pair can be expected to fall further toward the next support level 1.4300 (low of the previous waves (ii), (C)).

GBPAUD Wave Analysis
- GBPAUD reversed from resistance level 1.9175
- Likely to fall to support level 1.8945
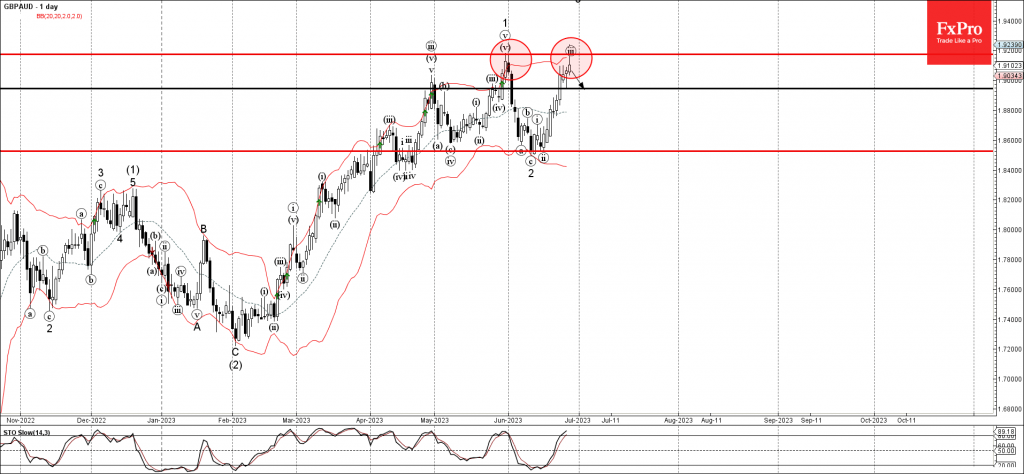
GBPAUD currency pair recently reversed down from the pivotal resistance level 1.9175 (top of the previous impulse wave 1 from the end of May) standing near the upper daily Bollinger Band.
The downward reversal from the resistance level 1.9175 created the daily Japanese candlesticks reversal pattern Shooting Star, which stopped the previous short-term impulse wave 3.
Given the overbought daily Stochastic, GBPAUD currency pair can be expected to fall further toward the next support level 1.8945.
What To Trade In July
July is right around the corner, and it heralds the start of the year's second half. In this article, I hope to share with you, my dear readers, a few of my trade ideas for July in hopes that it fetches you all some sizable profits and makes your July fun and fruitful. Let’s go!
AUDCAD - W1 Timeframe
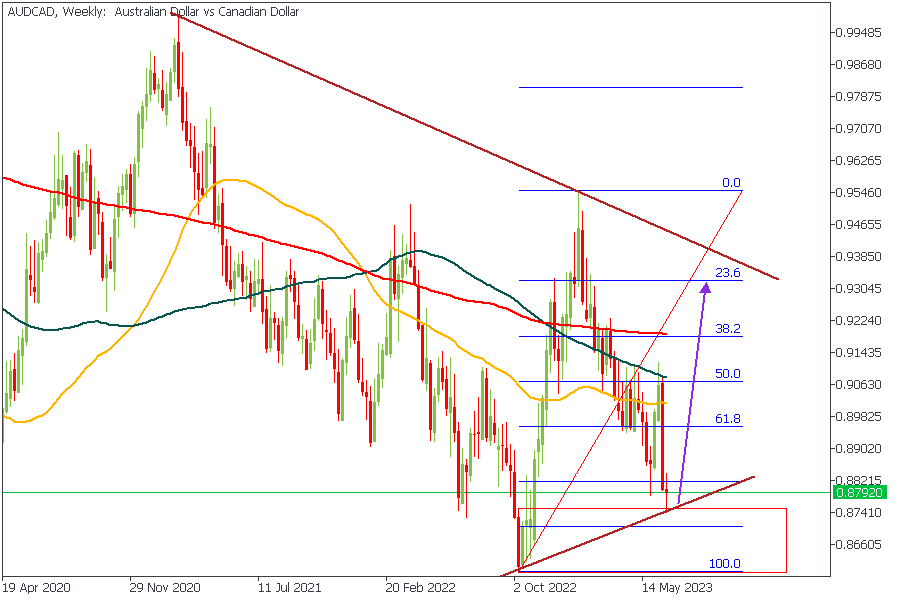
Let’s take a look at AUDCAD first of all. Here we see the wick of the current weekly candle resting on top of a trendline support that cuts across the drop-base-rally demand zone. Also, there is a clear break above the previous structural high, with a retest at 76% of the Fibonacci retracement zone. In line with these criteria, I would expect to see AUDCAD get rejected from the demand zone with a bullish price action extending to the 38% region of the Fibonacci retracement.
Analyst’s Expectations:
- Direction: Bullish
- Target: 0.91267
- Invalidation: 0.86010
USDCAD - W1 Timeframe
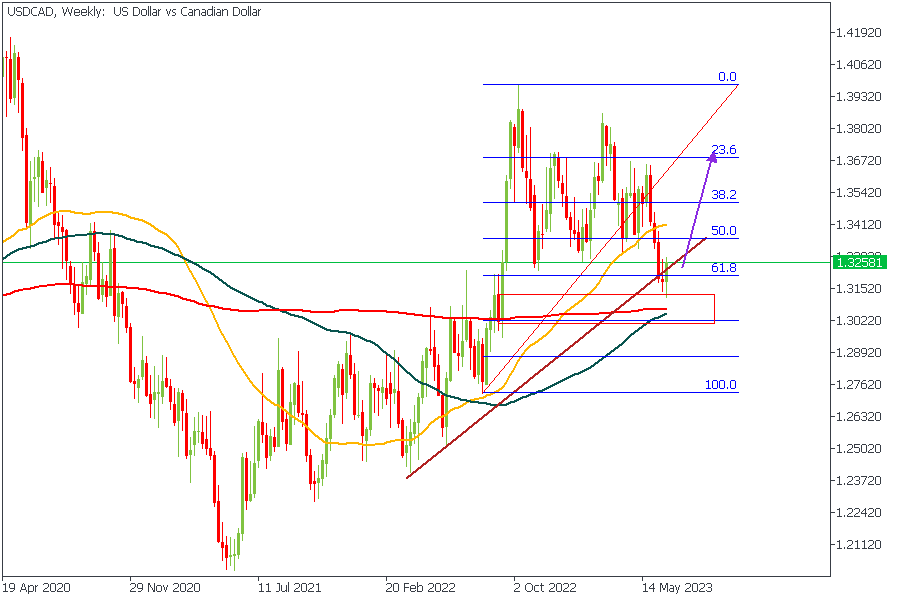
The price action on USDCAD appears pretty obvious. We can see a rally-base-rally demand zone that aligns with the 200 and 100 period moving averages as support and 76% of the Fibonacci retracement. In this scenario, I expect USDCAD to rise to 24% of the Fibonacci retracement since we also have a trendline support as an added confluence in favor of a bullish rebound.
Analyst’s Expectations:
- Direction: Bullish
- Target: 1.35727
- Invalidation: 1.30139
GBPCAD - W1 Timeframe
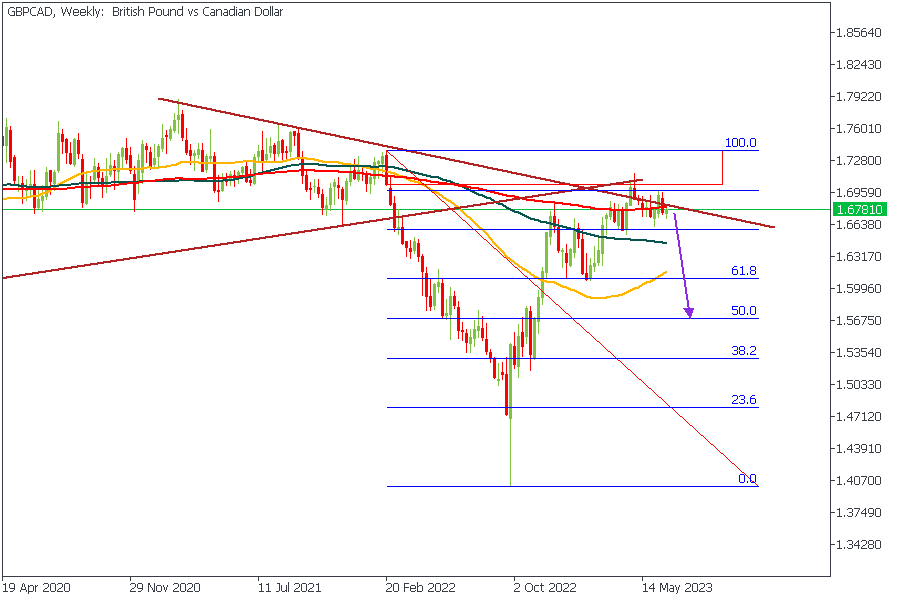
GBPCAD presents another interesting setup. In this case, we even see price trading at an intersection of two resistance trendlines - one of my favorite confluences for trend continuation trades. In addition to these, we also have a rally-base-drop supply zone, a 200-period moving average resistance, and the 88% Fibonacci retracement level as resistance. Did you notice the moving averages? They are also arrayed in a clear bearish order, meaning we have at least five confluences in favor of a bearish outcome on GBPCAD.
Analyst’s Expectations:
- Direction: Bearish
- Target: 1.58063
- Invalidation: 1.70099
CONCLUSION
The trading of CFDs comes at a risk. Thus, to succeed, you have to manage risks properly. To avoid costly mistakes while you look to trade these opportunities, be sure to do your due diligence and manage your risk appropriately.
Is Crypto Season Back Now?
Exciting news from Mastercard: they are launching a Multi-Token Network (MTN) to explore the potential of tokenized bank deposits, stablecoins, and central bank digital currencies (CBDCs). The MTN will begin with testing tokenized bank deposits and will be available in beta mode this summer in the UK. They have invited banks and financial institutions to participate in the initiative. Mastercard aims to bring programmability and flexibility to regulated money by making bank deposits digital assets on the blockchain. This aligns with their blockchain analytics application, Mastercard Crypto Credentials, which ensures compliance with regulations like anti-money laundering. The MTN will enable cross-border transfers of value between banks, allowing for fast and flexible movement. Selected teams will be able to develop use cases powered by tokenized deposits and digital assets in an MTN Innovation Sprint happening in London this summer.
BTCUSD - W1 Timeframe
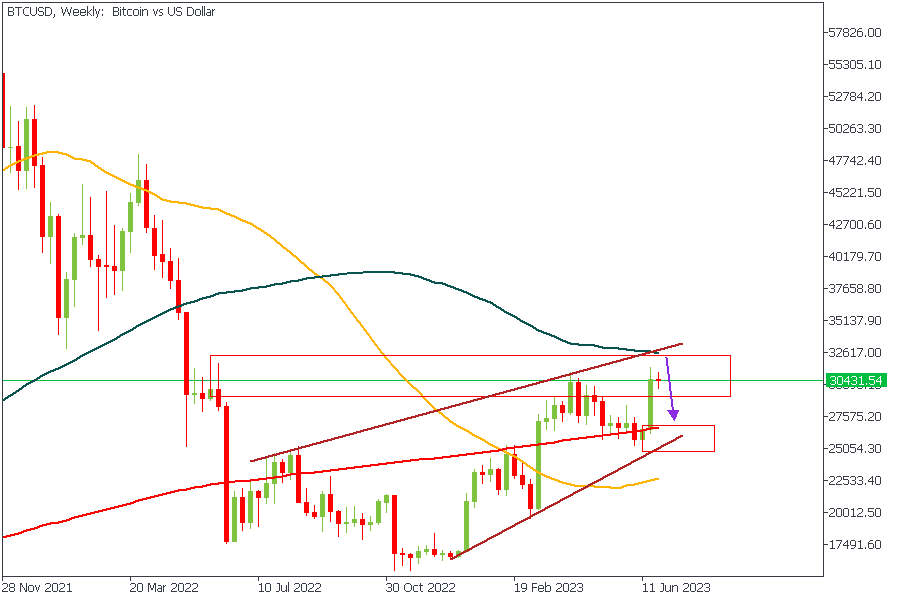
Bitcoin has had an interesting couple of weeks, with a remarkable, bullish recovery. However, BTCUSD is struggling to keep up the bull run due to selling pressure from the supply zone, as highlighted in the chart. The rally-base-drop supply zone is expected to yield some bearish pressure, potentially derailing the bullish intent. Here’s my take; wait to see a clear rejection from this supply zone from the Daily timeframe before proceeding to take a position on the commodity.
Analyst’s Expectations:
- Direction: Bearish
- Target: 27000.00
- Invalidation: 32728.84
XRPUSD - D1 Timeframe
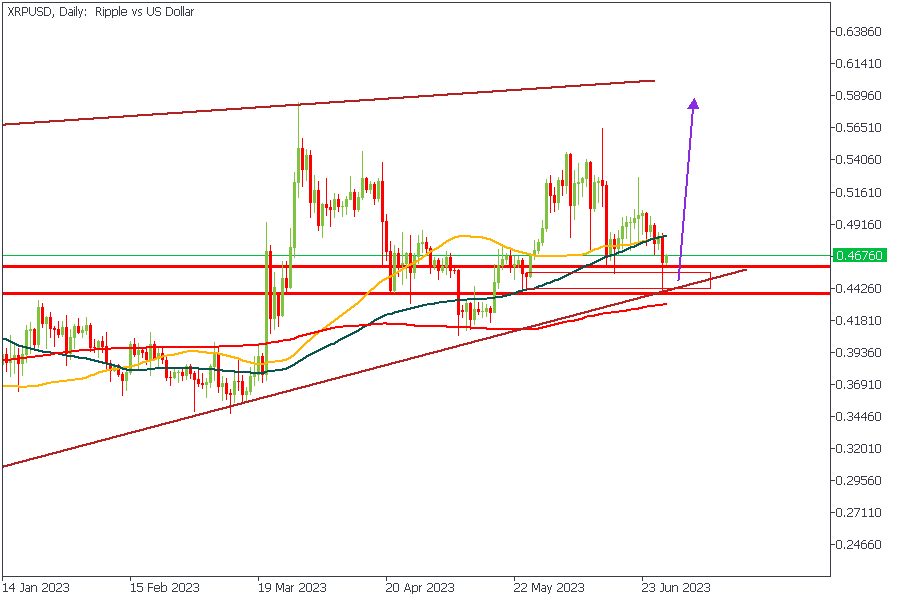
XRPUSD is sitting pretty in a well-cushioned area of demand - the likelihood of breaking this demand zone is minimal. First, we see the trendline support, then the bullish array of the moving averages, followed by the drop-base-rally demand zone, and finally, the 200-day moving average as support. All these confluences serve strictly to bolster the bullish sentiment on XRPUSD.
Analyst’s Expectations:
- Direction: Bullish
- Target: 0.56699
- Invalidation: 0.44237
ETHUSD - D1 Timeframe
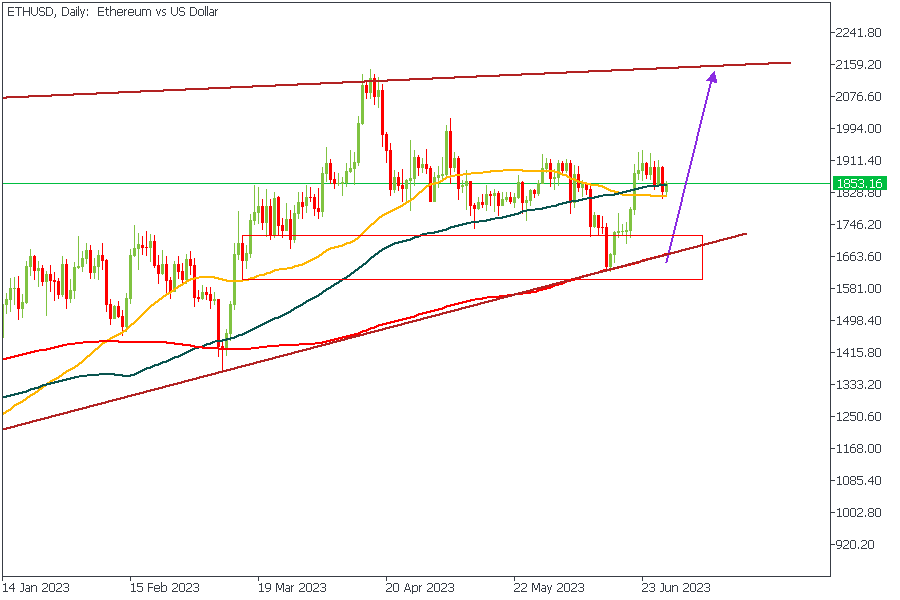
ETHUSD is yet another cryptocurrency pair that is also prepping for a bull run. So far, we’ve seen Ethereum react succinctly to the confluence of the 200-day MA, the demand zone, and the trendline support, leading to a price action that slightly broke above the previous high of the market structure. On this basis, I expect to see a seamless continuation of the same bullish price action from the 100-day moving average as an area of support.
Analyst’s Expectations:
- Direction: Bullish
- Target: 2066.42
- Invalidation: 1690.03
CONCLUSION
The trading of CFDs comes at a risk. Thus, to succeed, you have to manage risks properly. To avoid costly mistakes while you look to trade these opportunities, be sure to do your due diligence and manage your risk appropriately.
USD/JPY Steady Ahead of Key Japanese Inflation Release
- Japan releases Tokyo Core CPI on Friday
- USD/JPY moves closer to symbolic 145 line
- Ueda says no changes to policy unless core inflation rises
USD/JPY has edged lower on Thursday. In the European session, the yen is trading at 144.19, down 0.20%. The yen dropped as low as 144.70 in the Asian session, as the symbolic 145 line remains under pressure.
Tokyo Core CPI expected to tick higher
Japan releases a key inflation indicator, Tokyo Core CPI, on Friday. The indicator dipped to 3.2% in May but is expected to inch up to 3.3% in June. Tokyo CPI excluding food and energy, currently at 2.4% and known as the “core core index”, will be under the microscope after the National “core core index” rose unexpectedly in June. Earlier this week, BoJ Core CPI, the preferred inflation gauge of the central bank, rose from 2.9% to 3.1%, above the consensus of 3.0%.
If today’s inflation report also shows that inflation is creeping higher, it will put into question the BoJ’s stance that cost-driven inflation is temporary and therefore there is no need to tighten monetary policy.
Governor Ueda reiterated this position at the ECB Bank Forum on Wednesday. Ueda stated that he would continue the BoJ’s ultra-easy monetary policy unless he was “reasonably sure” that inflation accelerated in 2024. He said that the BoJ was not confident that this would occur, noting that even though headline inflation was above 3%, core inflation remained below the Bank’s 2% target.
The BoJ’s ultra-accommodative policy has seen the yen slide to 7-month lows, which has drawn warnings from the Ministry of Finance about intervening in the currency markets. Ueda declined to comment on the possibility of intervention, saying that the BoJ was closely monitoring the exchange rate and that the yen was influenced by many other factors besides BoJ policy.
USD/JPY Technical
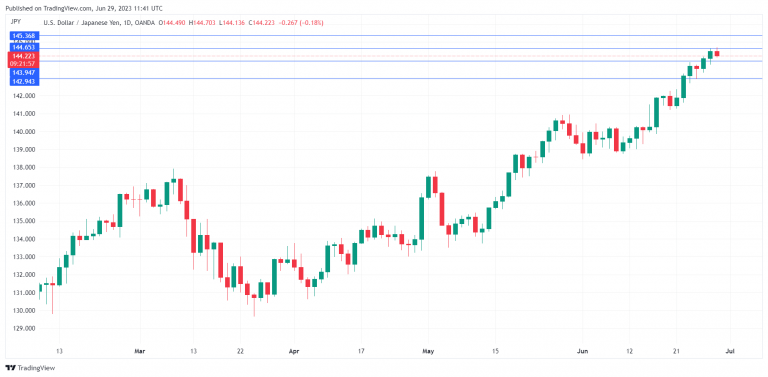
- There is resistance line at 144.65 and 145.36
- 143.94 and 142.94 are providing support