Sample Category Title
Gold Drops to 3-Month Low
Yesterday, a forum of heads of central banks was held, organized by the ECB, with speeches by Lagarde, Powell, Ueda, Bailey. In general (with the exception of Japan), according to bankers, they intend to maintain a tight monetary policy, not excluding new increases in interest rates, and plan that inflation will continue to decline.
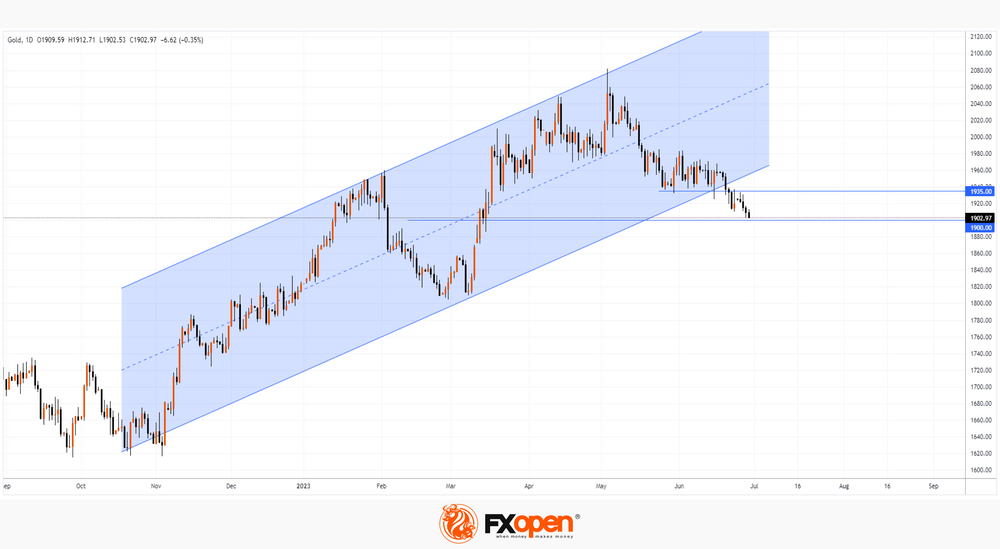
Against the background of this information, the price of gold in dollars fell — perhaps because forecasts for lower inflation, according to market participants, reduce the value of gold as a "rescue" asset.
The XAU/USD price chart shows that it has made a bearish breakout of the ascending channel that has been in place since last fall and is approaching the psychological level of USD 1,900 per ounce. A rebound can be expected from this level — for example, to the resistance of 1,935 USD per ounce, which was still a pronounced support in early May.
US 30 Cash Index Range-Trading Continues
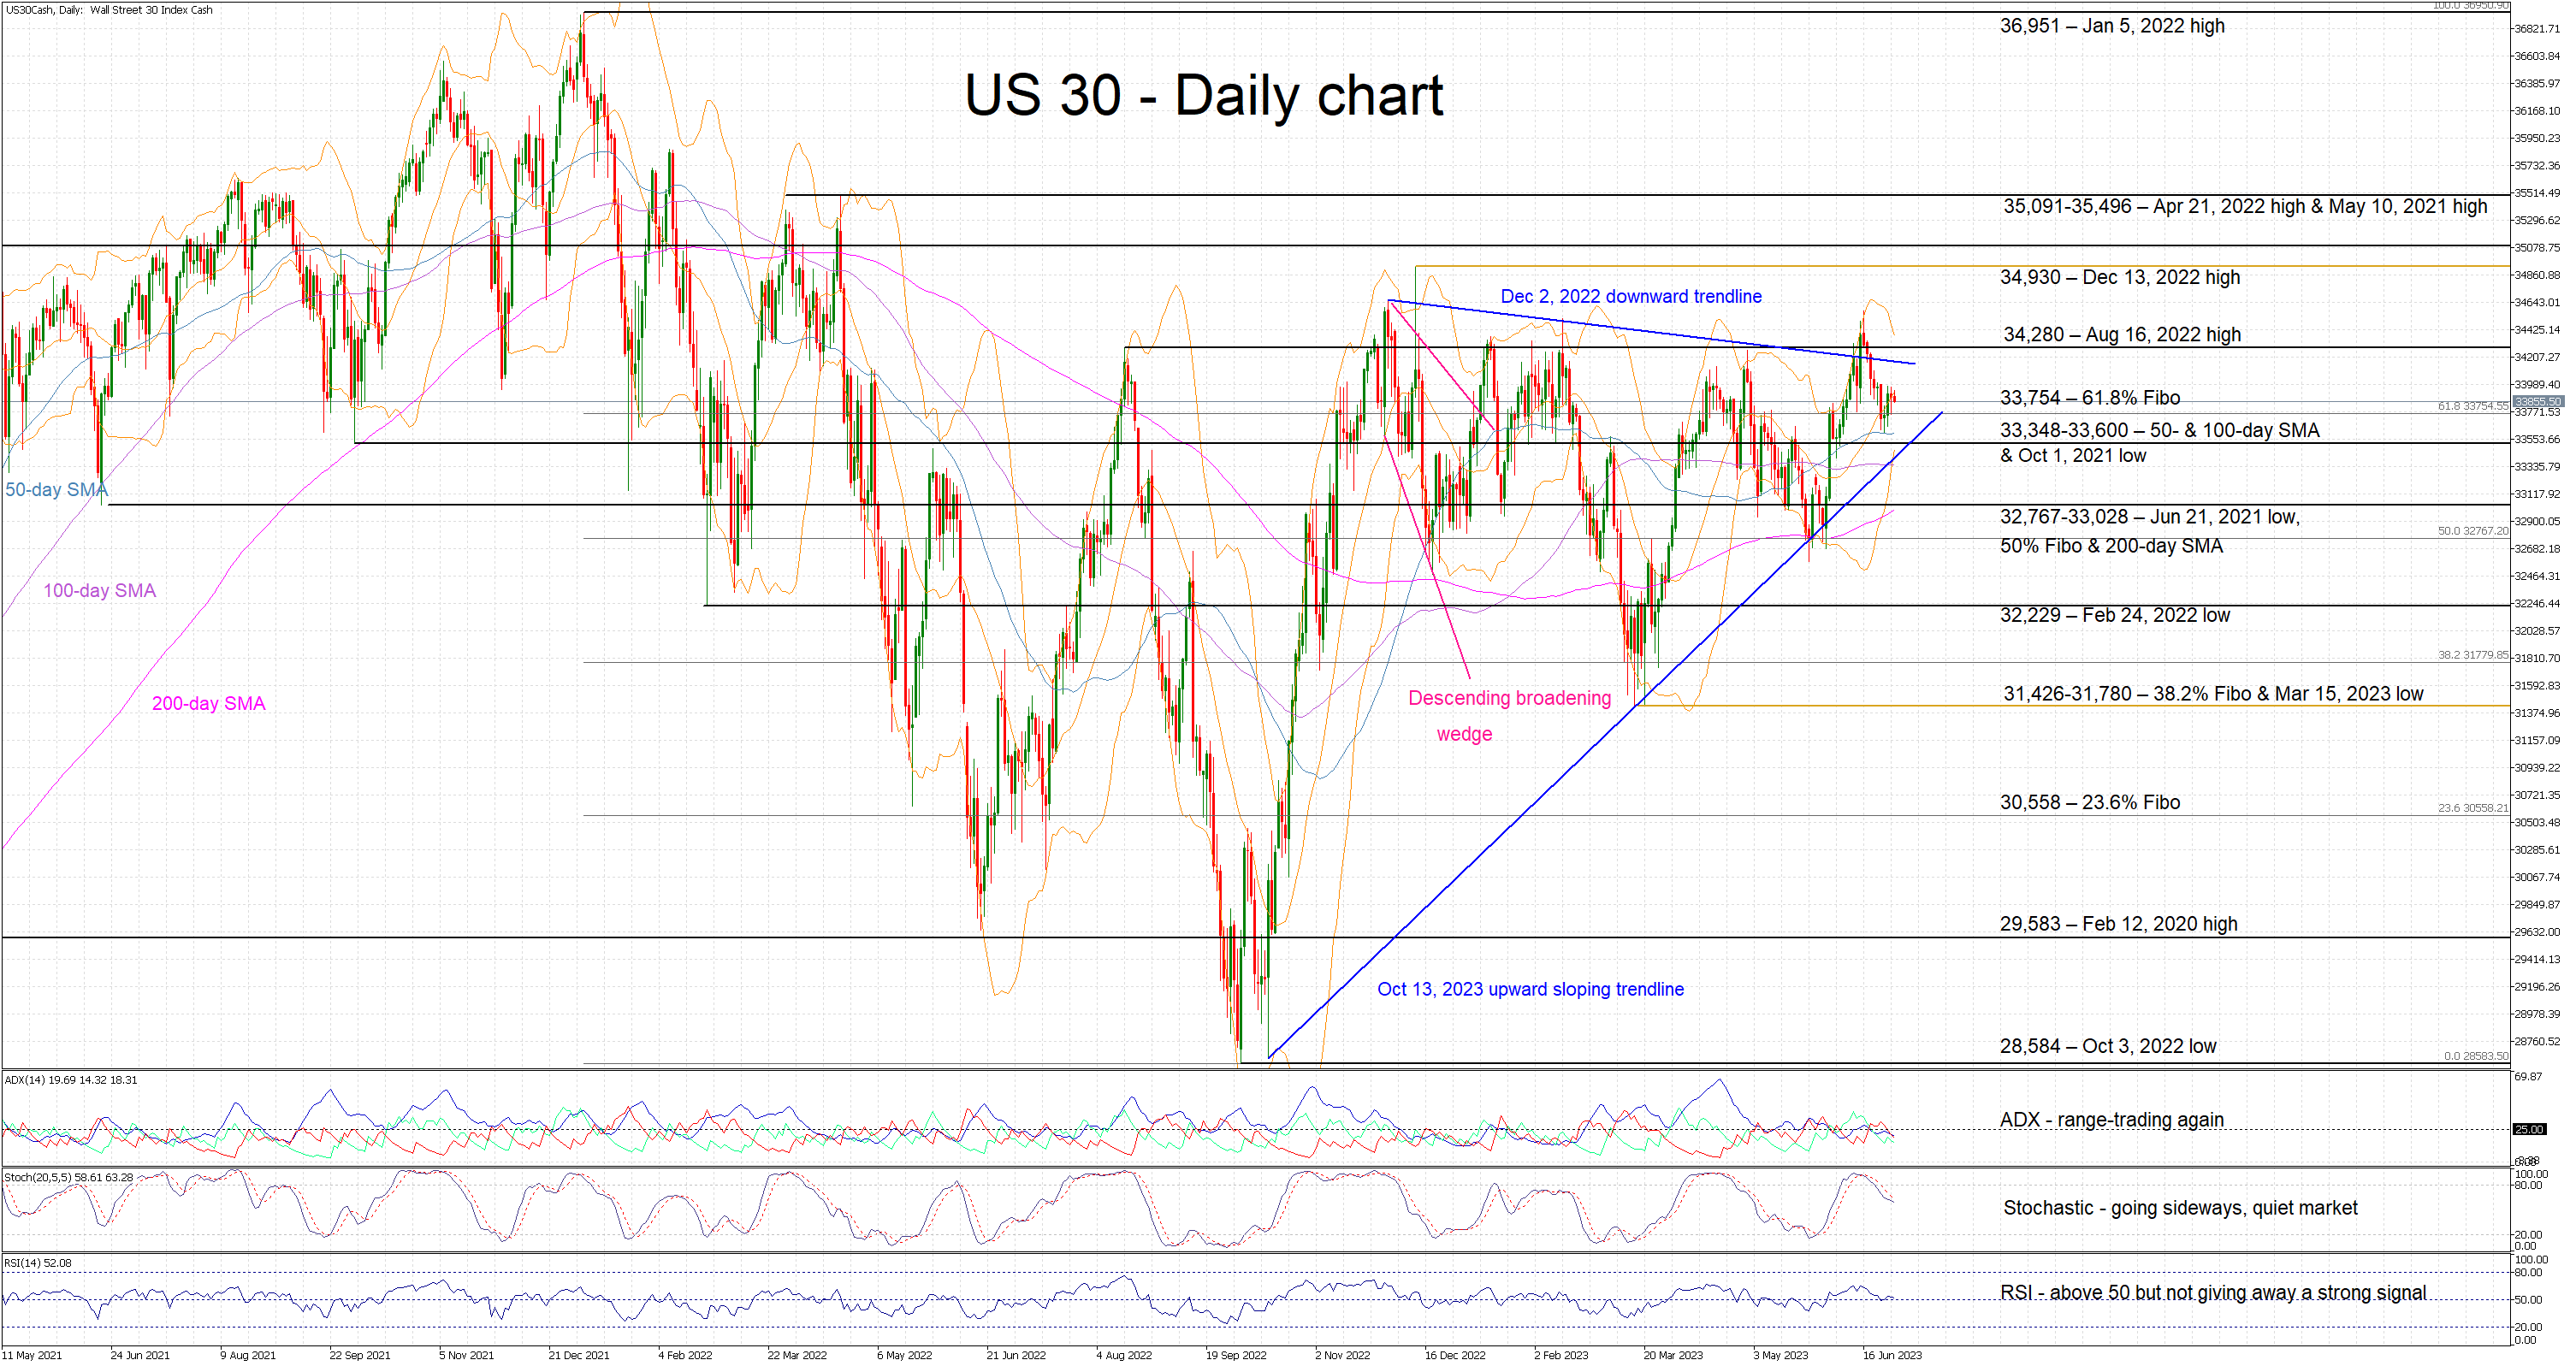
The US 30 cash index bounced off its 50-day simple moving average (SMA) and it is now hovering around the 33,754 area. The bulls have managed to record a series of higher lows and they are apparently looking ahead to the recent 34,577 high in their attempt to establish a more sustained bullish trend. However, they firstly have to overcome the current market lull that is clearly depicted in the relative tightening of the Bollinger bands.
Similarly, the momentum indicators appear to have taken a back seat at this juncture. The Average Directional Movement Index (ADX) is hovering below its 25-threshold and signaling a range-trading market, and the RSI is moving sideways, a tad above its 50-midpoint. Even the stochastic oscillator appears to be embracing the quiet market conditions as it is gliding towards the middle of its range.
Should the bears decide to grab the market reins, they would try to overcome the arguably very important 33,348-33,600 area. The combination of the 50- and 100-day simple moving averages (SMAs), the October 1, 2021 low and the October 13, 2023 upward sloping trendline means that the bears’ determination would really be put to the test there. Even lower, the 32,767-33,028 range will probably prove tougher to crack than currently anticipated.
On the other hand, the bulls would love a retest of the August 16, 2022 high at 34,280 but they firstly have to break the December 2, 2022 downward trendline. The December 13, 2022 high at 34,930 would be the next aim, a tad below the busier 35,091-35,496 range defined by the April 21, 2022 and May 10, 2021 highs respectively.
To sum up, with the path of least resistance being higher prices, the US 30 bears need to act soon if they wish to stage a significant pullback towards the 33,000 area.
WTI Futures Remain Flat Within Bearish Channel
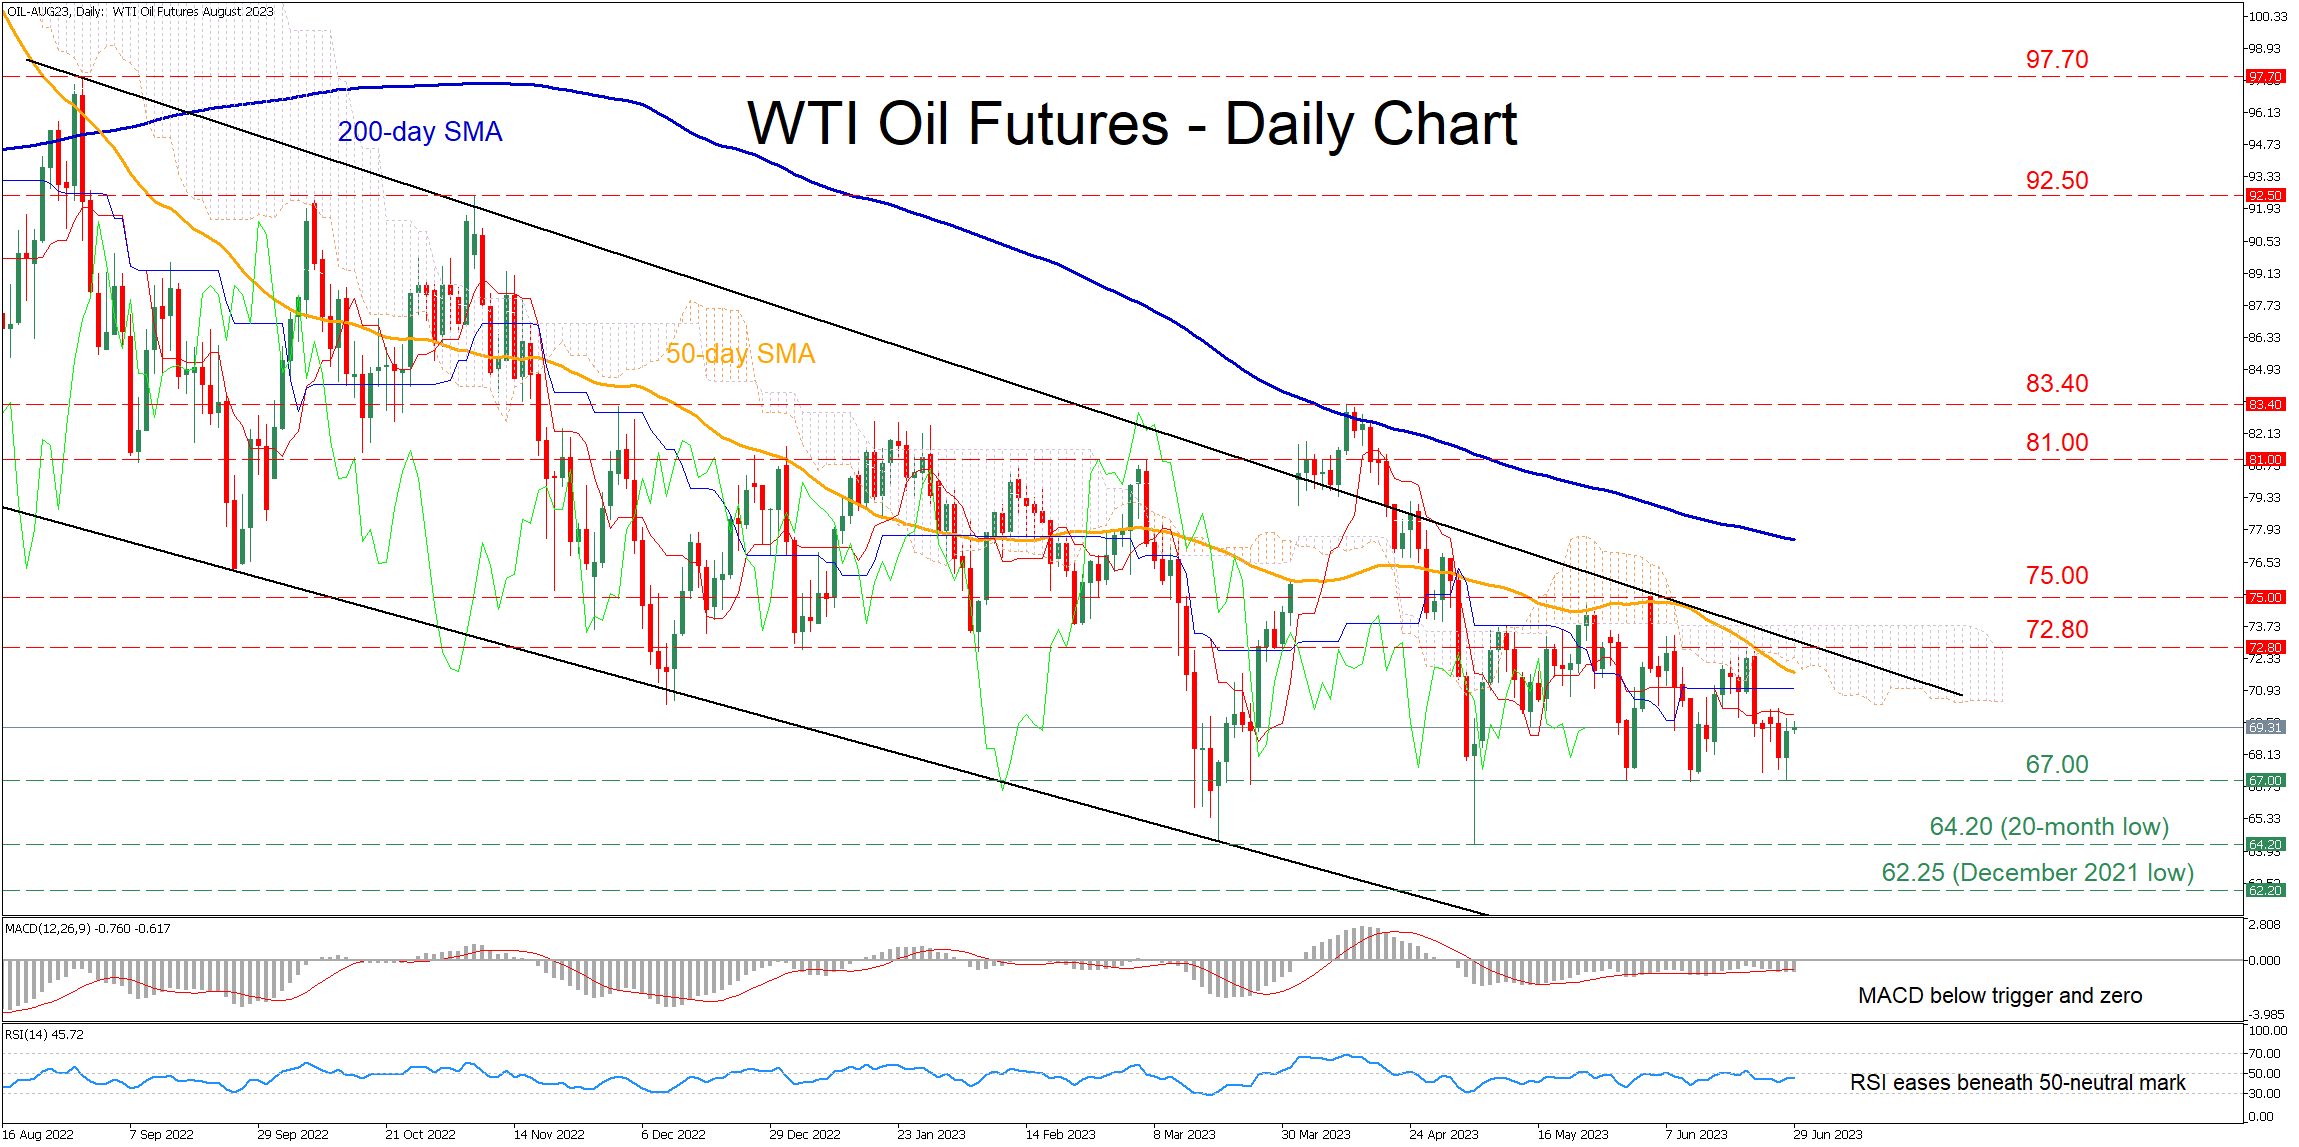
WTI oil futures (August delivery) have been moving within their downward sloping channel for the last 10 months, creating a structure of lower highs. In the near term, the price has been directionless, slightly below the 70.00 region following a moderate pullback from the 50-day simple moving average (SMA).
The momentum indicators currently suggest that bearish forces are holding the upper hand. Specifically, the RSI has flatlined below its 50-neutral mark, while the MACD is softening below both zero and its red signal line.
Should the bears try to push the price lower, immediate support could be found at 67.00, which has held strong three times during the past two months. A dive below that floor could open the door for the double-bottom region of 64.20, which is also a 20-month low. Failing to halt there, the price could retreat towards a fresh multi-month low, where the December 2021 bottom of 62.25 could curb further downside attempts.
On the flipside, if the positive momentum intensifies and the price reverses higher, the recent resistance of 72.80 might be the first barrier for buyers to conquer. Crossing above that zone, WTI futures might face the June high of 75.00 before the March peak of 81.00 comes under scrutiny. Even higher, the price could revisit 83.40, its highest level in 2023.
In brief, WTI oil futures have been trading sideways in the past few daily sessions, waiting for developments that could provide fresh directional impetus. However, for the broader outlook to change, the price needs to escape its downward sloping channel.
EUR/USD Daily Outlook
Daily Pivots: (S1) 1.0883; (P) 1.0928; (R1) 1.0957; More...
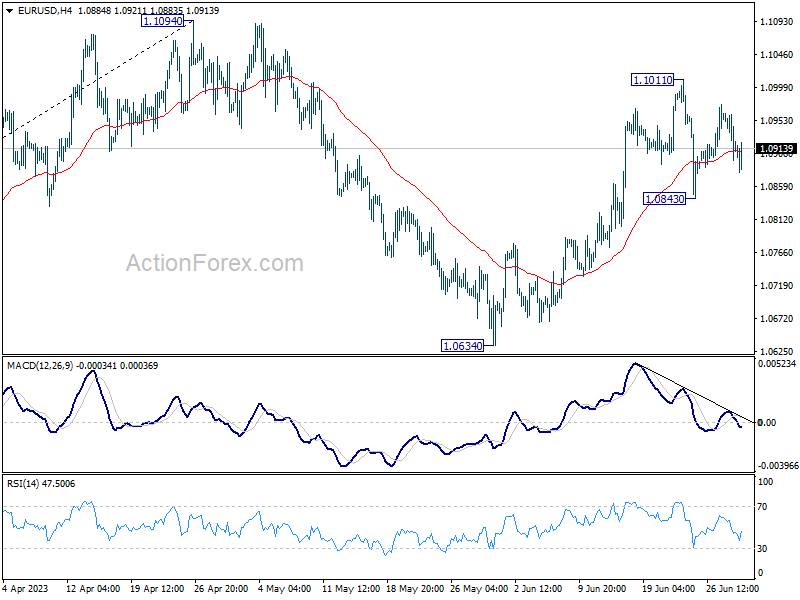
Intraday bias in EUR/USD remains neutral as range trading continues. Strong support from 55 D EMA (now at 1.0850) retains near term bullishness. Break of 1.1011 will resume the rally from 1.0634 and target 1.1094 resistance. Decisive break there will resume larger up trend from 0.9534.
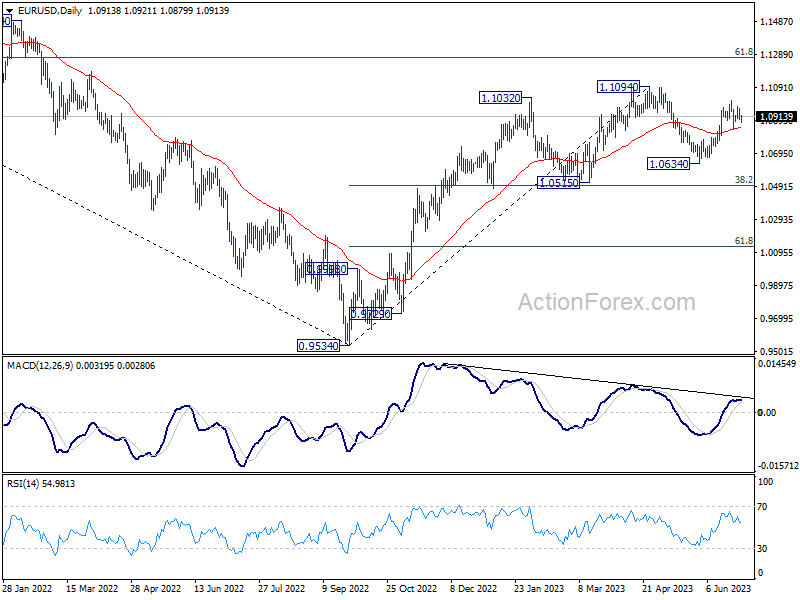
In the bigger picture, as long as 1.0515 support holds, rise from 0.9534 (2022 low) would still extend higher. Sustained break of 61.8% retracement of 1.2348 (2021 high) to 0.9534 at 1.1273 will solidify the case of bullish trend reversal and target 1.2348 resistance next (2021 high).
GBP/USD Daily Outlook
Daily Pivots: (S1) 1.2577; (P) 1.2665; (R1) 1.2723; More...
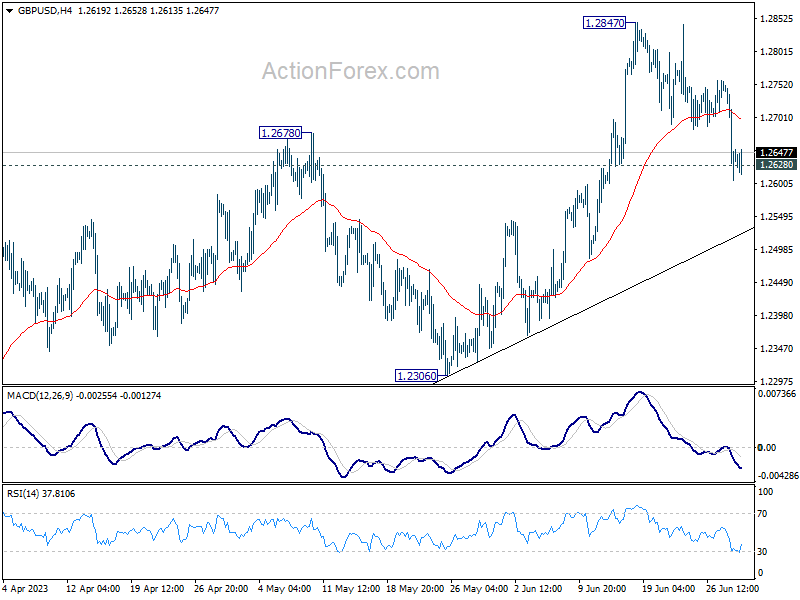
Focus stays on 1.2628 support in GBP/USD. Firm break there will bring deeper fall to 55 D EMA (now at 1.2531). Considering bearish divergence condition in D MACD, sustained break of the EMA will argue that it's already in correction to larger up trend and target 1.2306 support. Nevertheless, rebound from current level will retain near term bullishness for up trend resumption through 1.2847 later.
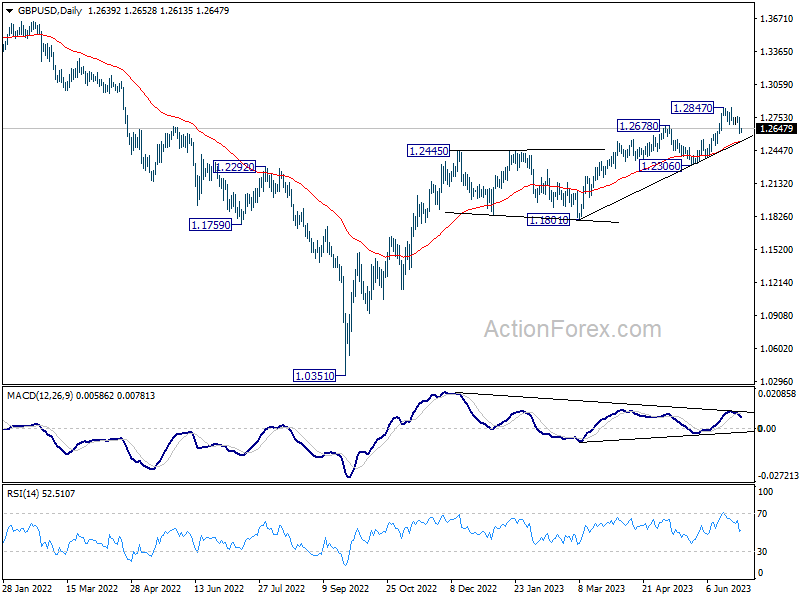
In the bigger picture, the strong support from 55 W EMA (now at 1.2341) is a medium term bullish sign. Outlook will stay bullish as long as 1.2306 support holds. Rise from 1.0351 medium term bottom (2022 low) is expected to extend further to retest 1.4248 key resistance (2021 high).
USD/CHF Daily Outlook
Daily Pivots: (S1) 0.8937; (P) 0.8962; (R1) 0.8995; More...
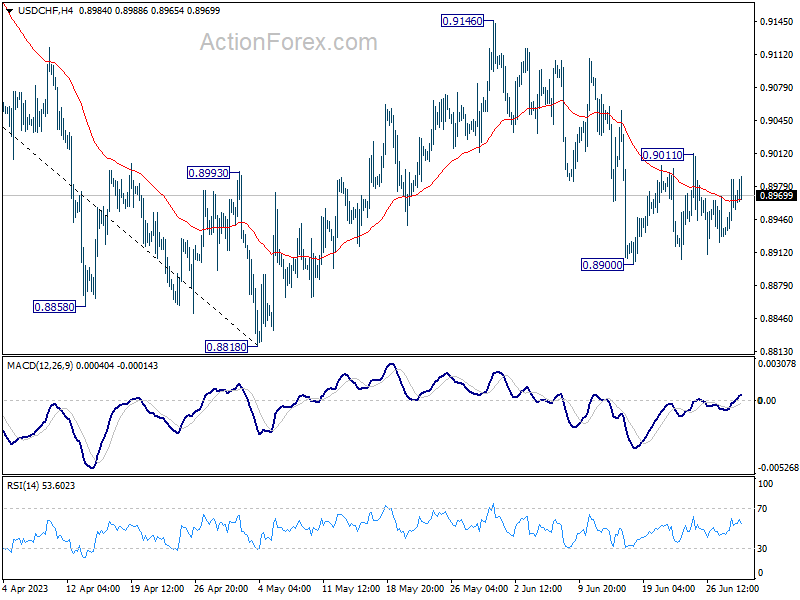
Intraday bias in USD/CHF remains neutral as sideway trading continues. On the downside, break of 0.8900 will resume the fall from 0.9146 to 0.8818 low or below. But for now, strong support is still expected from 0.8756 long term support to bring rebound. On the upside, above 0.9011 will bring stronger rise towards 0.9146 resistance.
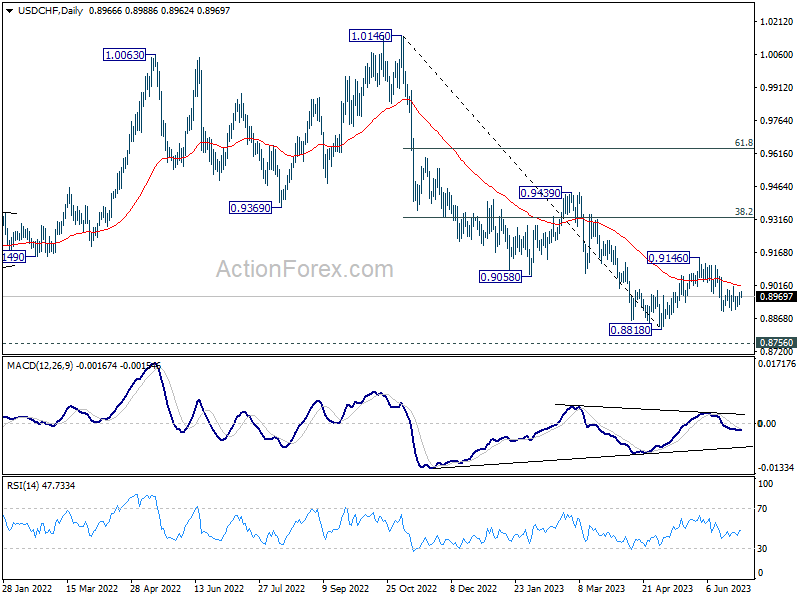
In the bigger picture, fall from 1.1046 (2022 high) is seen as a leg in the long term range pattern from 1.0342 (2016 high), which might have completed at 0.8818 already, just ahead of 0.8756 long term support. Sustained trading above 0.9058 support turned resistance should confirm medium term bottoming.
USD/JPY Daily Outlook
Daily Pivots: (S1) 143.94; (P) 144.28; (R1) 144.83; More...
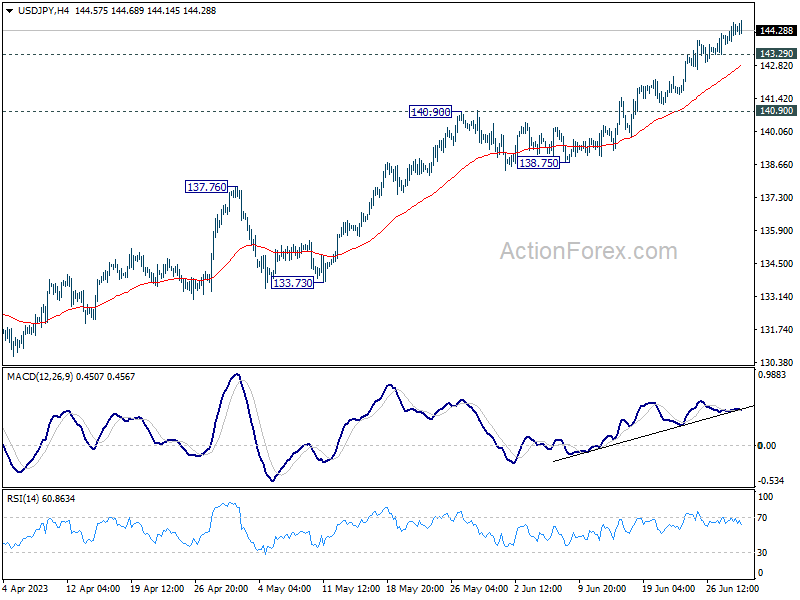
Intraday bias in USD/JPY remains on the upside for the moment. Current rise from 127.20 should target 161.8% projection of 127.20 to 137.90 from 129.62 at 146.93. On the downside, below 143.29 minor support will turn bias again and bring consolidations. Down further rally will remain in favor as long as 140.90 resistance turned support holds.
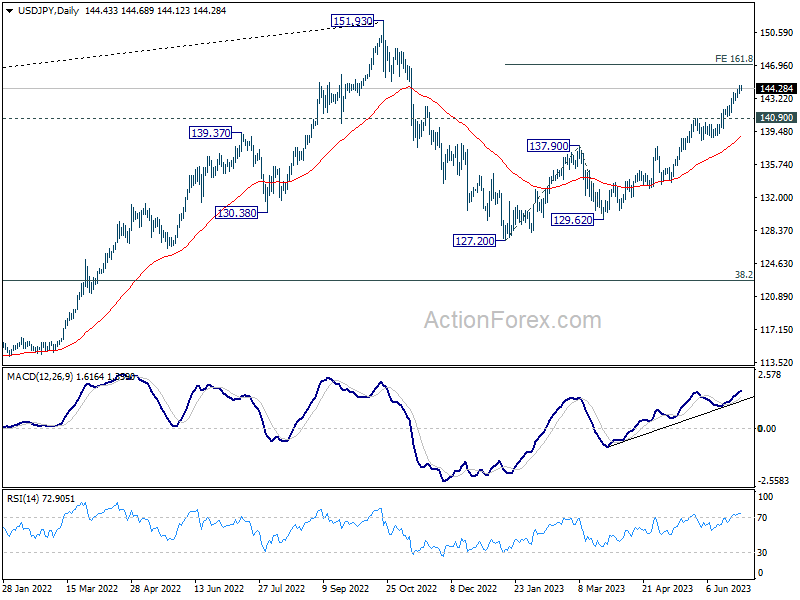
In the bigger picture, rise from 127.20 is currently seen as the second leg of the corrective pattern from 151.93 high. Further rally is expected as long as 137.90 resistance turned support holds, to retest 151.93. But strong resistance could be seen there to limit upside. Break of 137.90 will indicate the the third leg has started back towards 127.20.
AUD/USD Daily Report
Daily Pivots: (S1) 0.6568; (P) 0.6629; (R1) 0.6661; More...
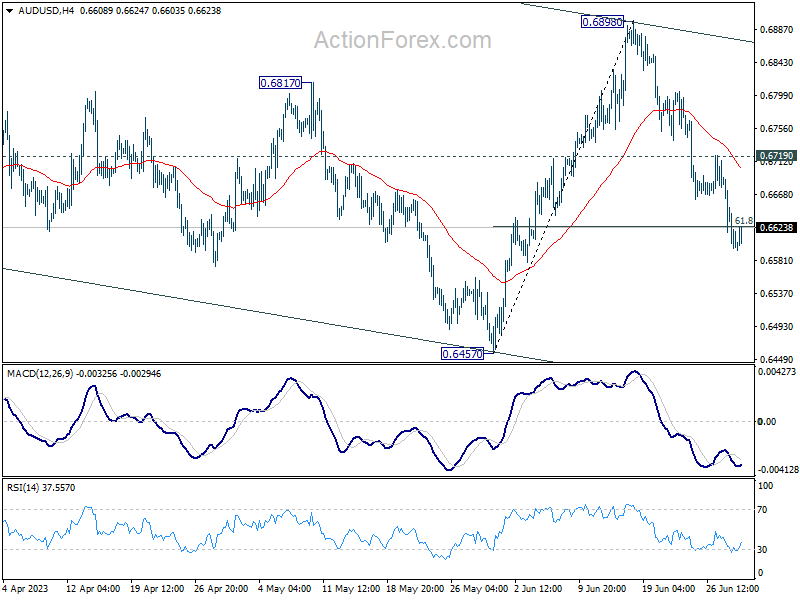
Intraday bias in AUD/USD stays on the downside at this point. Sustained break of 61.8% retracement of 0.6457 to 0.6898 at 0.6625 will path the way back to 0.6457 key support level. On the upside, above 0.6719 resistance will turn intraday bias neutral again first.
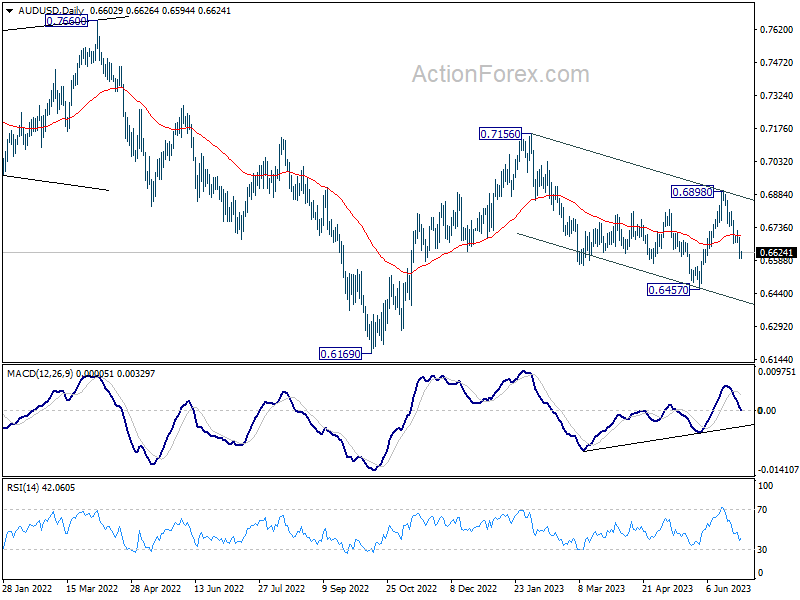
In the bigger picture, outlook is mixed up by the deeper than expected pull back from 0.6898. Still, price actions from 0.7156 are seen as a correction to rebound from 0.6169. Break of 0.6457 will resume the fall towards 0.6169 low. On the upside, though, break of 0.6898 resistance will argue that rise from 0.6169 is ready to resume through 0.7156.
Fed Powell: A long way to go to bring inflation down to 2%
In a speech today, Fed Chair Jerome Powell underscored the ongoing battle with inflation, asserting, "Inflation pressures continue to run high, and the process of getting inflation back down to 2 percent has a long way to go."
He added that "a strong majority of Committee participants expect that it will be appropriate to raise interest rates two or more times by the end of the year," referring to the latest dot plot.
Powell painted a mixed picture of the U.S. economy. He noted that "recent indicators suggest that economic activity has continued to expand at a modest pace." He also pointed to the effects of higher interest rates and slower output growth on business fixed investment.
His comments also highlight the persistent tightness in the labor market. "Over the past three months, payroll job gains have been robust," Powell said, adding that "labor demand still substantially exceeds the supply of available workers." Nevertheless, he also observed "some easing in nominal wage growth, and declining vacancies."
AUDUSD Erases June’s Upleg; Bias Bearish
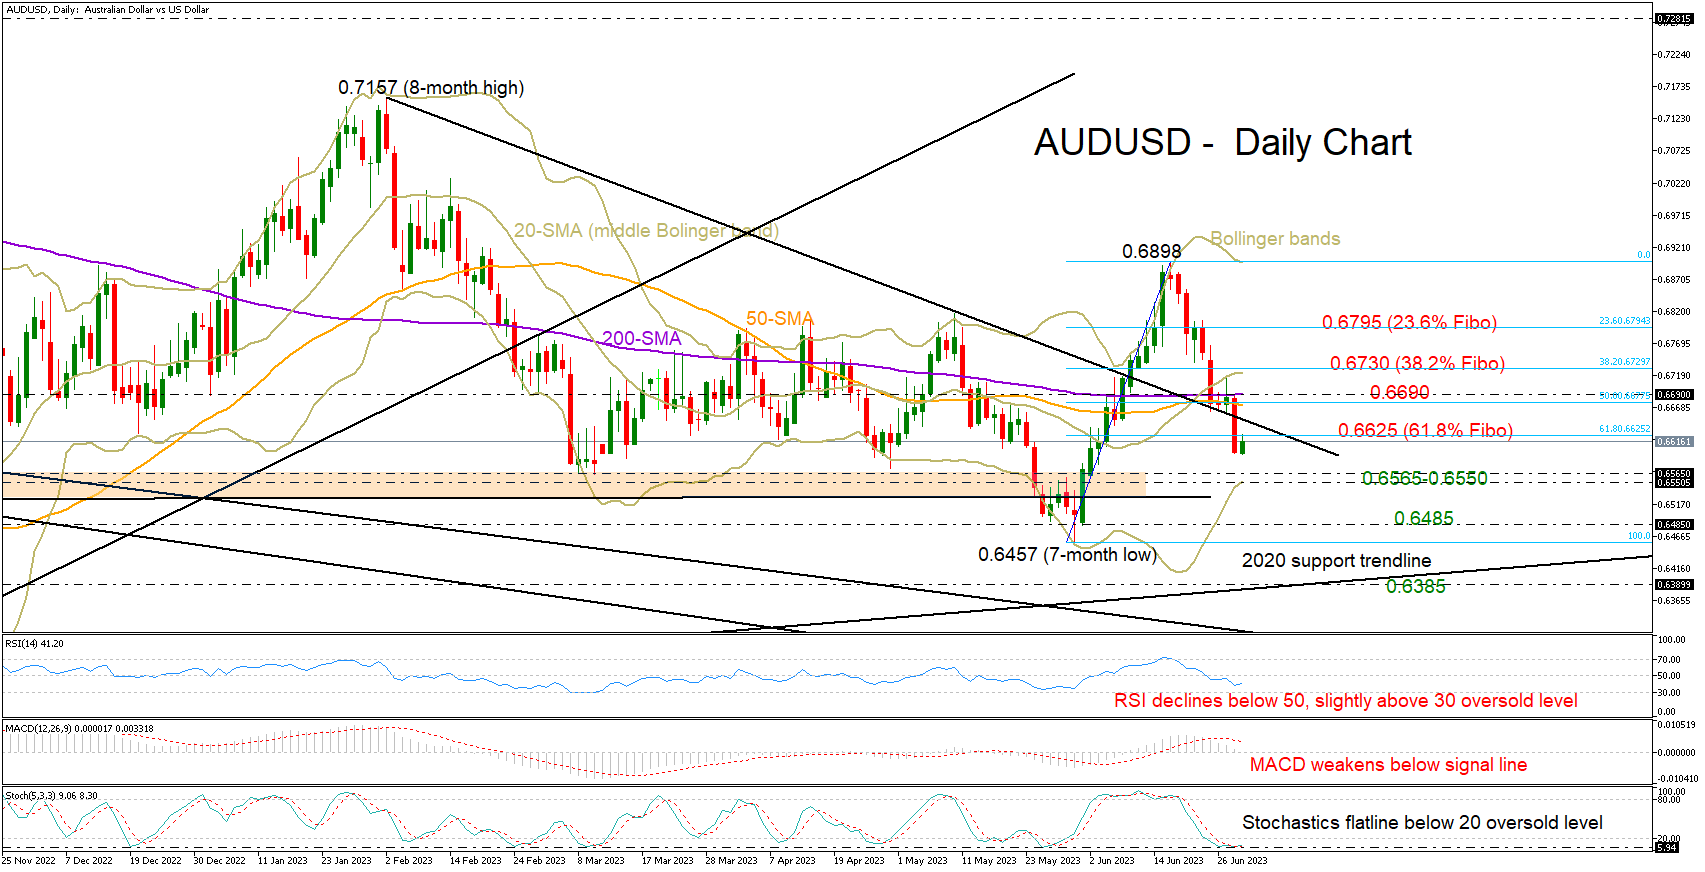
AUDUSD sank to a three-week low of 0.6596 on Wednesday as the bulls could not find enough buyers to jump above the 200-day simple moving average (SMA) at 0.6690.
The pair is marking its second negative week, having trimmed more than half of June’s bull run to 0.6898.
Downside pressures could persist in the coming sessions as the technical indicators continue to slope southwards. The falling RSI has yet to reach its 30 oversold level, while the MACD remains negatively charged below its red signal line. That said, the stochastic oscillator has flattened near its previous lows, suggesting selling interest could fade soon.
The lower Bollinger band could prompt some consolidation within the 0.6565-0.6550 region, where the price faced limitations several times from the end of 2022 onwards. Failure to pivot here could direct the market back to May’s lows registered within the 0.6485- 0.6457 zone. A decisive close lower could stretch the February-May downtrend towards the 2020 support trendline seen around 0.6385.
On the upside, the 61.8% Fibonacci retracement of June’s bullish wave is currently capping the price around 0.6625. The resistance trendline is within short distance too, while the 50- and 200-day simple moving averages (SMAs) could be more challenging, cementing again the ceiling around the 50% Fibonacci mark and the 0.6690 bar. If the bulls breach that wall this time, the recovery could pick up steam towards the upper Bollinger band and the 38.2% Fibonacci of 0.6730. Then, another notable increase could take place, lifting the price up to the 23.6% Fibonacci of 0.6795.
In brief, the short-term risk for AUDUSD remains skewed to the downside, with support expected to develop within the 0.6565-0.6550 area.