

Sample Category Title
Technical Outlook and Review
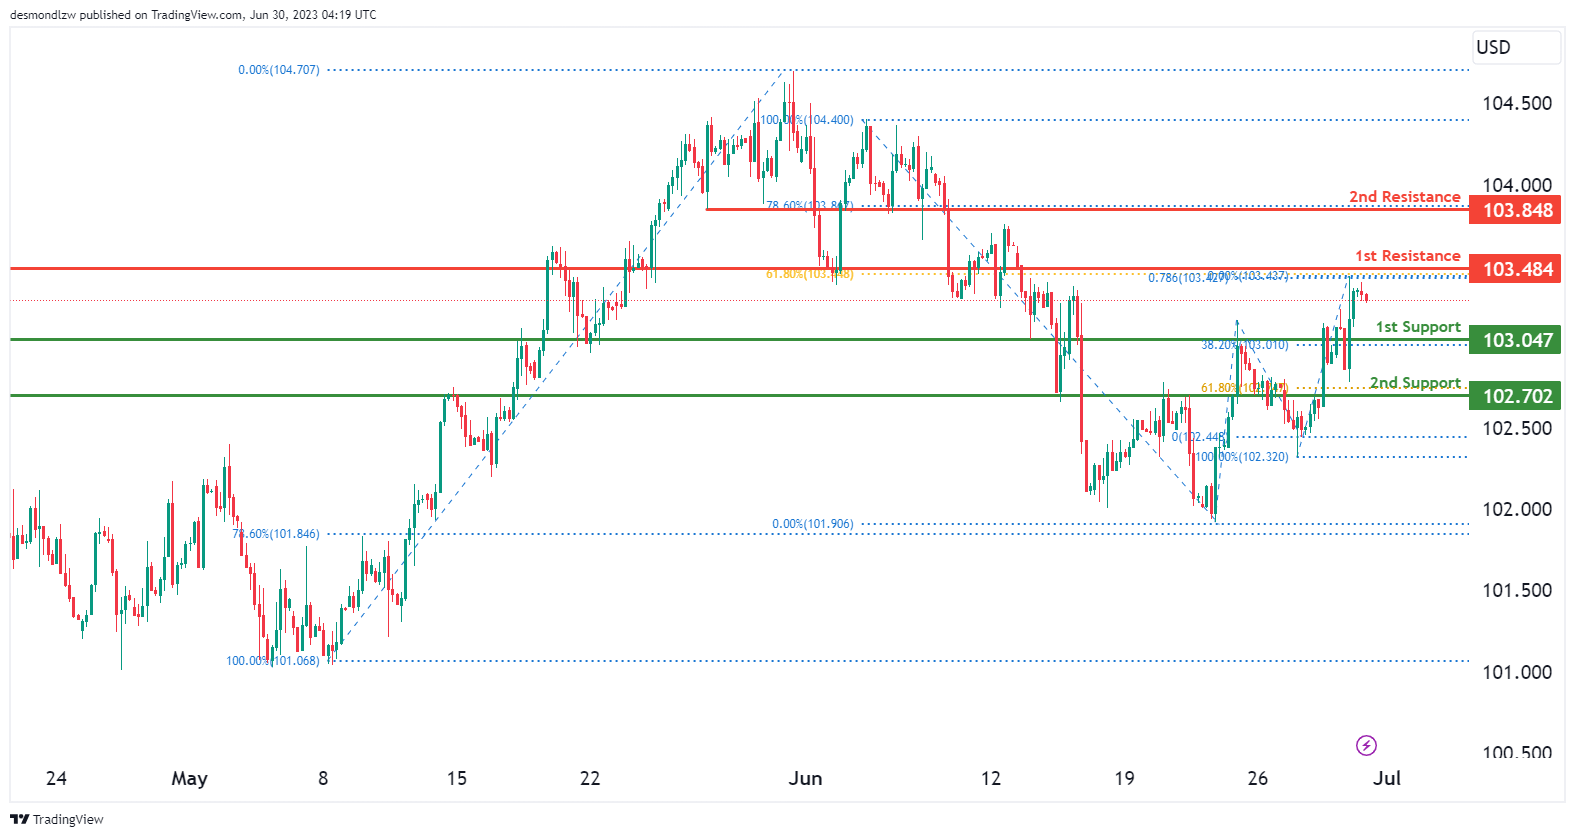
DXY:
The DXY (US Dollar Index) chart currently exhibits a neutral momentum, suggesting a lack of clear direction. There is a possibility for the price to fluctuate between the 1st support level at 103.047, which is an overlap support and coincides with the 38.2% Fibonacci Retracement. The 2nd support level at 102.702 is an overlap support and coincides with the 61.8% Fibonacci Retracement. The 1st resistance level at 103.484, which represents an overlap resistance, conincides with the 61.8% Fibonacci Retracement and 78.6% Fibonacci Projection, resulting in a Fibonacci confluence.. An additional level to consider is the 2nd resistance at 103.848, an overlap resistance aligning with the 78.6% Fibonacci Retracement.
EUR/USD:
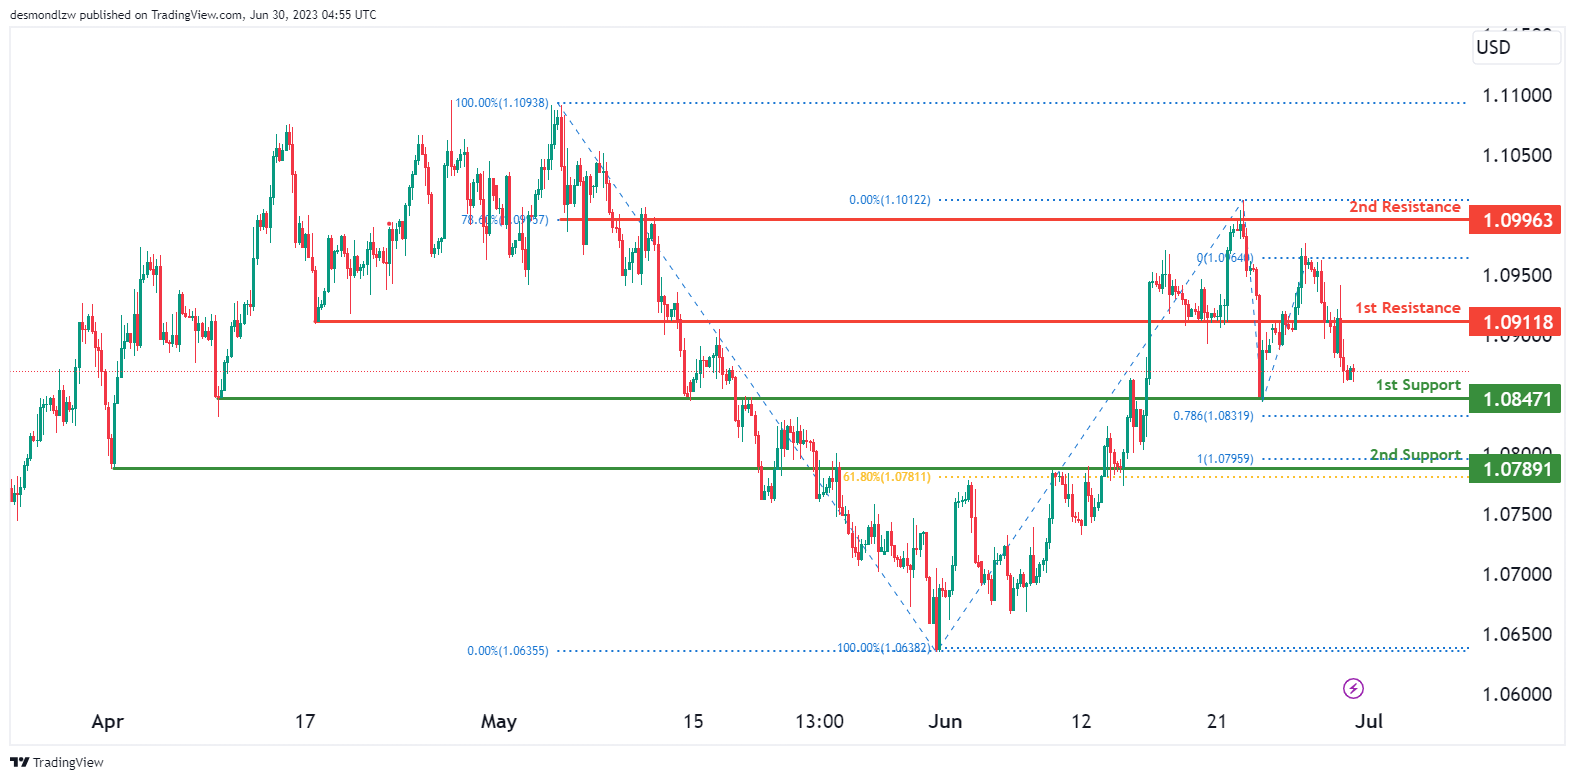
The EUR/USD chart currently shows a bearish momentum, indicating a downward bias in the market. There is a possibility for the price to continue its bearish movement towards the 1st support level at 1.08471, which is considered an overlap support.
Additional support is found at the 2nd support level at 1.07891, identified as an overlap support that aligns with the 61.8% Fibonacci Retracement. On the upside, the 1st resistance level at 1.09118 acts as an overlap resistance, potentially impeding upward price advancement. Furthermore, the 2nd resistance level at 1.109963 represents another overlap resistance that aligns withe 78.6% Fibonacci Retracement.
GBP/USD:
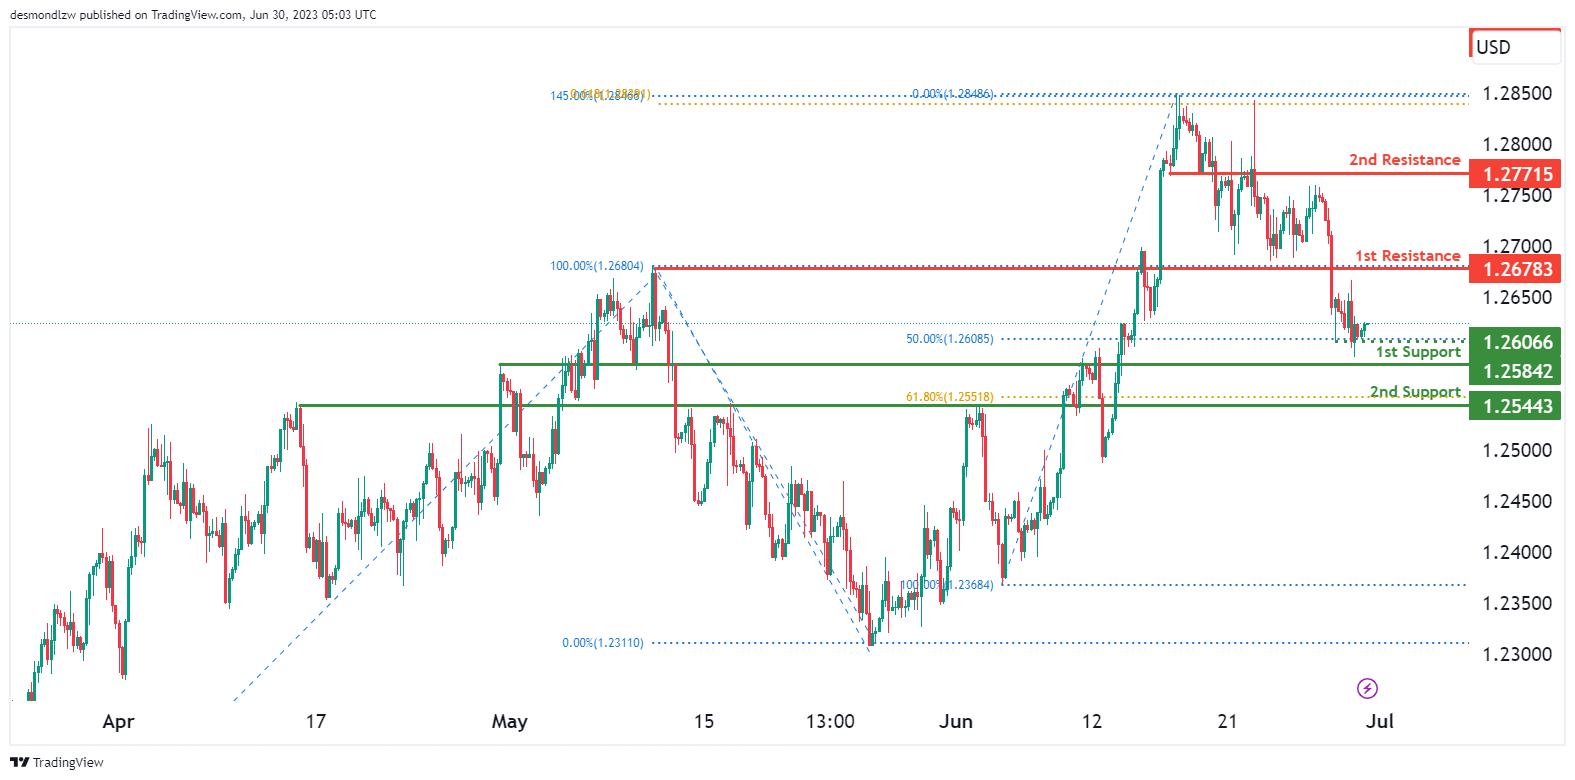
The GBP/USD chart currently indicates a bearish momentum, suggesting a downward trend in the market. There is a potential for the price to continue its bearish movement towards the 1st support level at 1.25842, which is identified as an overlap support, if price breaks below the intermediate support first at 1.26066..
Additional support is found at the 2nd support level at 1.25443, characterized as an overlap support and coincides with the 61.80% Fibonacci Retracement.
On the upside, the 1st resistance level at 1.26783 acts as an overlap resistance, potentially impeding upward price advancement. Furthermore, the 2nd resistance level at 1.27715 represents an overlap resistance.
USD/CHF:
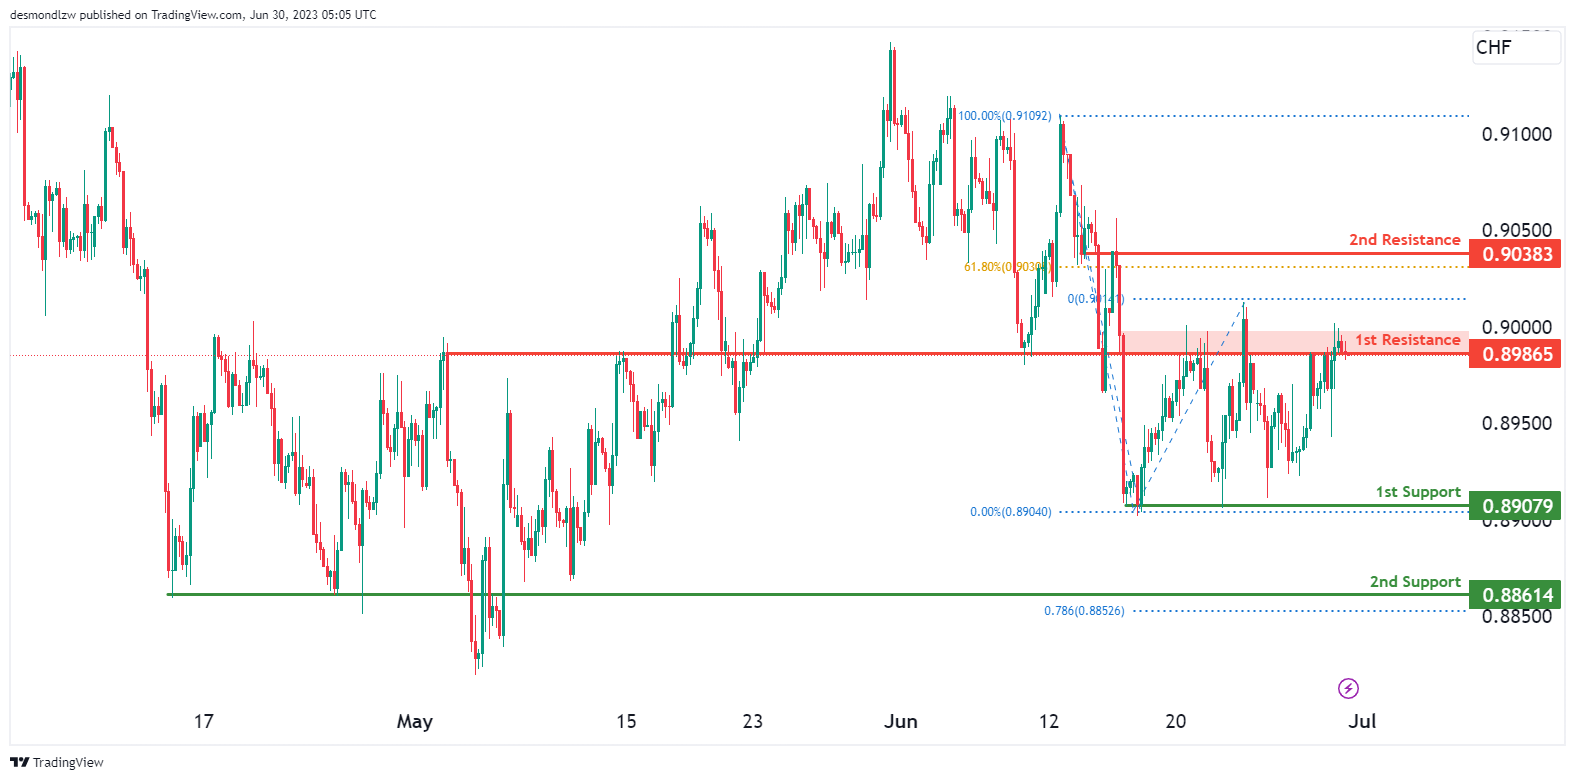
The USD/CHF chart currently demonstrates a weak bearish momentum. There is a potential for the price to reverse from the 1st resistance level at 0.89865, which is identified as an overlap resistance, and drop lower.
The 1st support level at 0.89079 is a multi-swing low overlap support while the 2nd support at 0.88614 is an overlap support that aligns close to the 78.6% Fibonacci Projection.
Additionally, the 2nd resistance level at 0.9038 is considered an overlap resistance that aligns with close to the 61.8% Fibonacci Retracement.
USD/JPY:
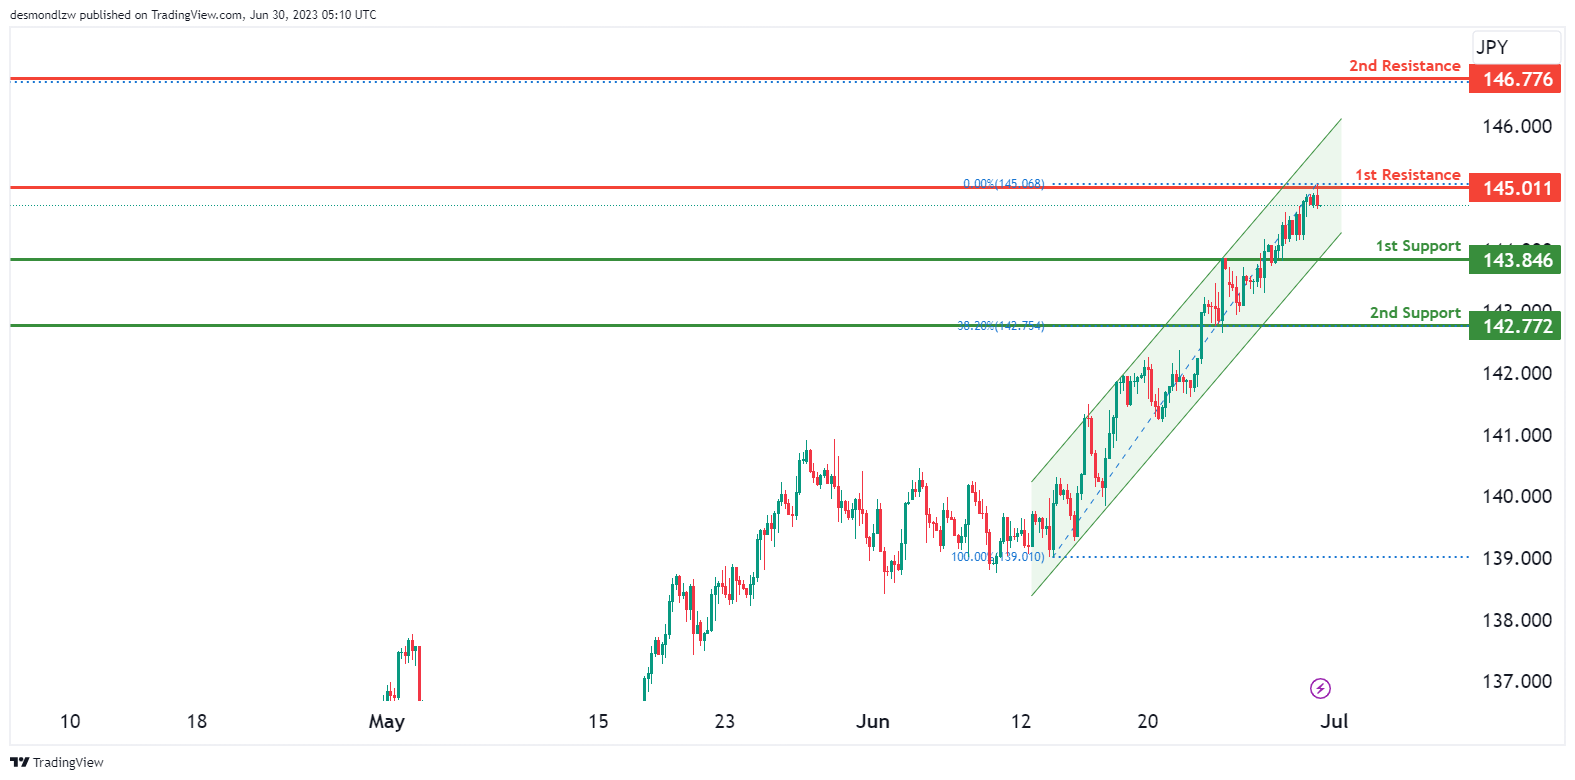
The USD/JPY chart currently exhibits a bullish momentum, characterized by the price movement within a bullish ascending channel, suggesting a potential for further upward movement.
There is a possibility of a bullish continuation towards the 1st resistance level at 145.011. Additionally, the 2nd resistance level at 146.776 acts as another resistance level which coincides with the 78.60% Fibonacci Retracement.
On the downside, the 1st support level at 143.846 is identified as an overlap support, providing potential strength to the support zone. Furthermore, the 2nd support level at 142.772 is an overlap support and also aligns with the 38.2% Fibonacci Projection.
USD/CAD:
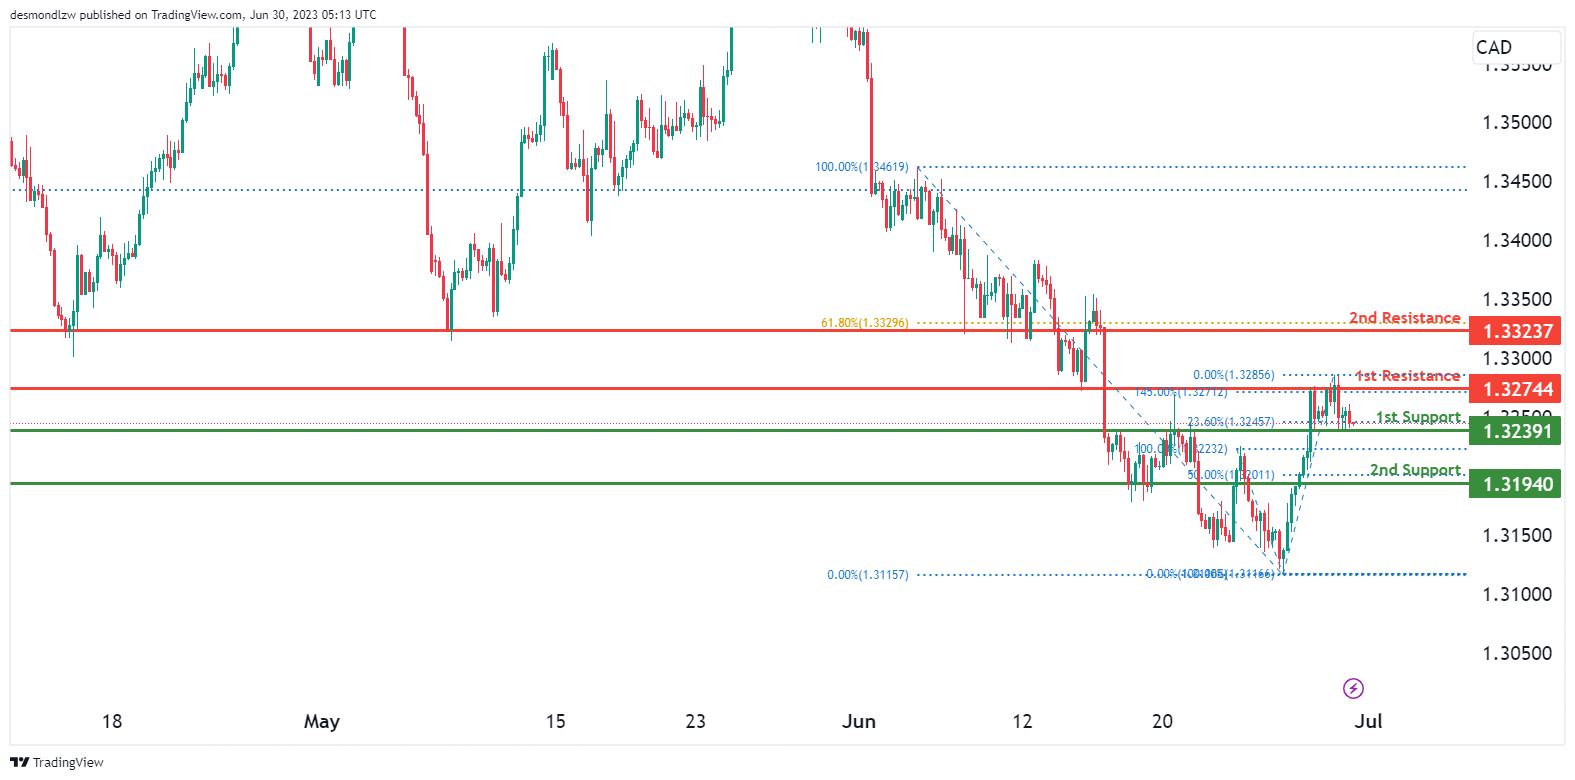
USD/CAD currently exhibits a weak bullish momentum on the chart. Several factors contribute to this momentum, indicating that the price could potentially continue its bullish movement if it bounces from the 1st support level.
The 1st support level is located at 1.32391 and is considered good due to its overlap support characteristics and also aligns with the 23.6% Fibonacci Retracement. Additionally, there is a 2nd support level at 1.31940, which is significant as it represents an overlap support.
On the resistance side, the 1st resistance is positioned at 1.32744 and is considered good because it represents overlap resistance. Furthermore, there is a 2nd resistance level at 1.33237, which is significant as it represents overlap resistance and aligns with a 61.8% Fibonacci Retracement.
AUD/USD:
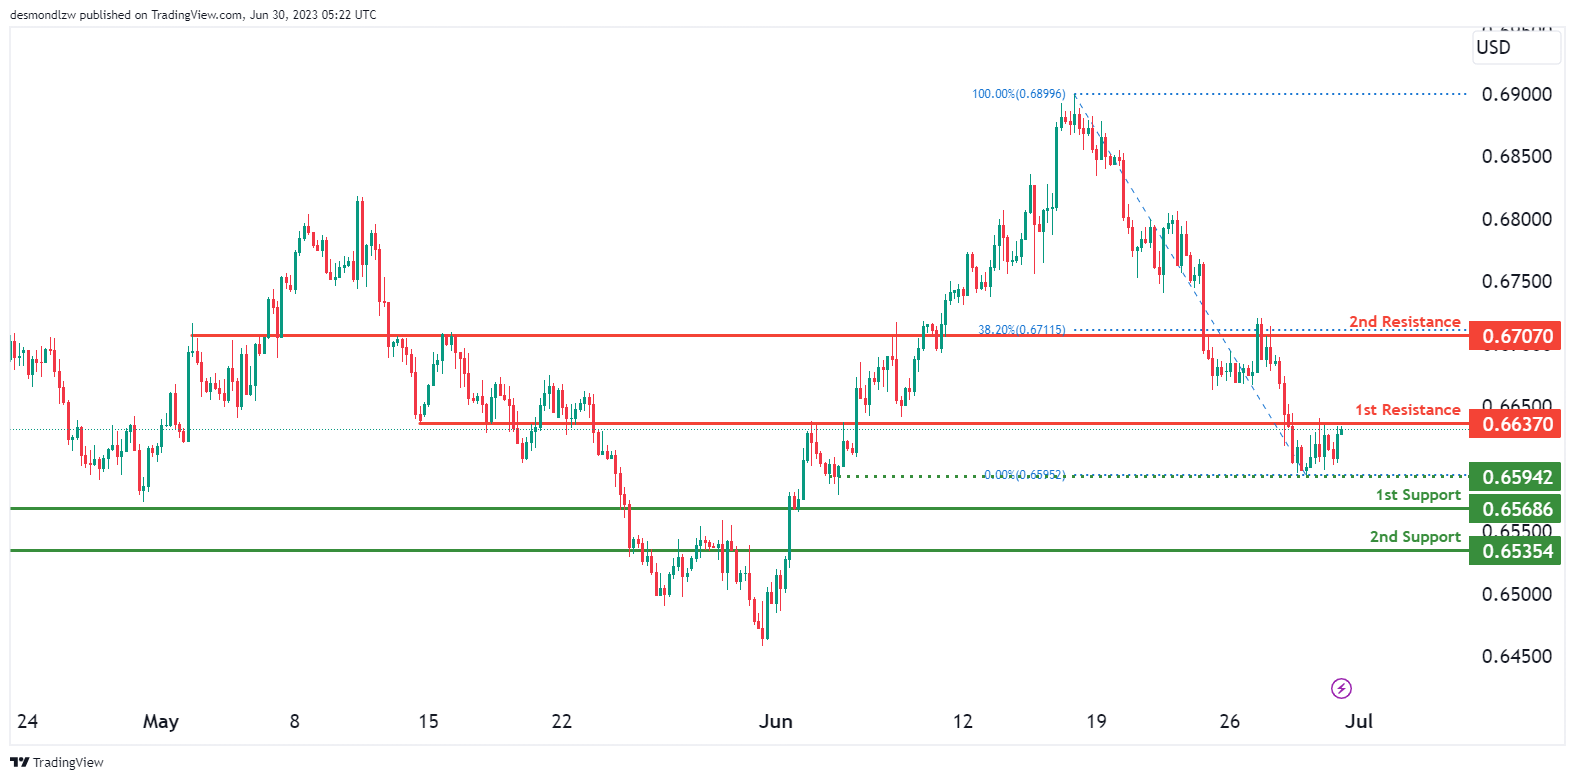
AUD/USD currently exhibits bullish momentum on the chart. Several factors contribute to this momentum, indicating that the price could potentially continue its bearish movement towards the 1st resistance level.
The 1st support level is located at 0.65686 and is considered good due to its overlap support characteristics. Additionally, there is a 2nd support level at 0.65354, which is significant as it represents an overlap support.
On the resistance side, the 1st resistance is positioned at 0.66370 and is considered good because it represents overlap resistance. Furthermore, there is a 2nd resistance level at 0.67070, which is significant as it also represents overlap resistance that aligns with the 38.2% Fibonacci Retracement.
NZD/USD
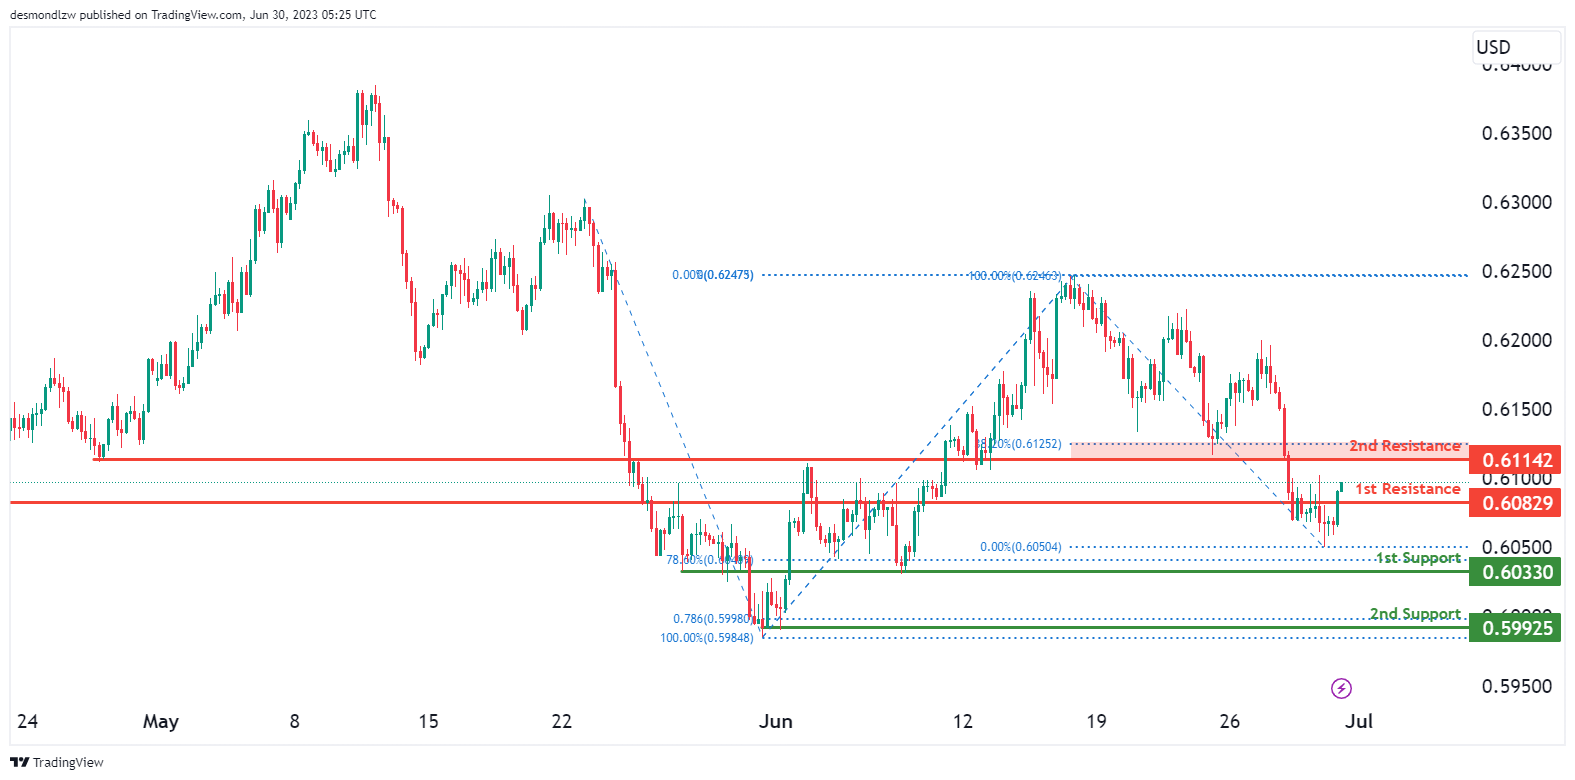
NZD/USD currently shows bullish momentum on the chart. Several factors contribute to this momentum, indicating that the price could potentially continue its bullish movement towards the 1st resistance level.
The 1st support level is located at 0.60330 and is considered good due to its overlap support characteristics and also aligns with the 78.6% Fibonacci Retracement. Additionally, there is a 2nd support level at 0.59925, which is is a swing-low support..
On the resistance side, the 1st resistance is positioned at 0.60829 and is considered good because it represents an overlap resistance. Furthermore, there is a 2nd resistance level at 0.61142, which is significant as it represents an overlap resistance that aligns close to the 38.2% Fibonacci retracement level.
DJ30:
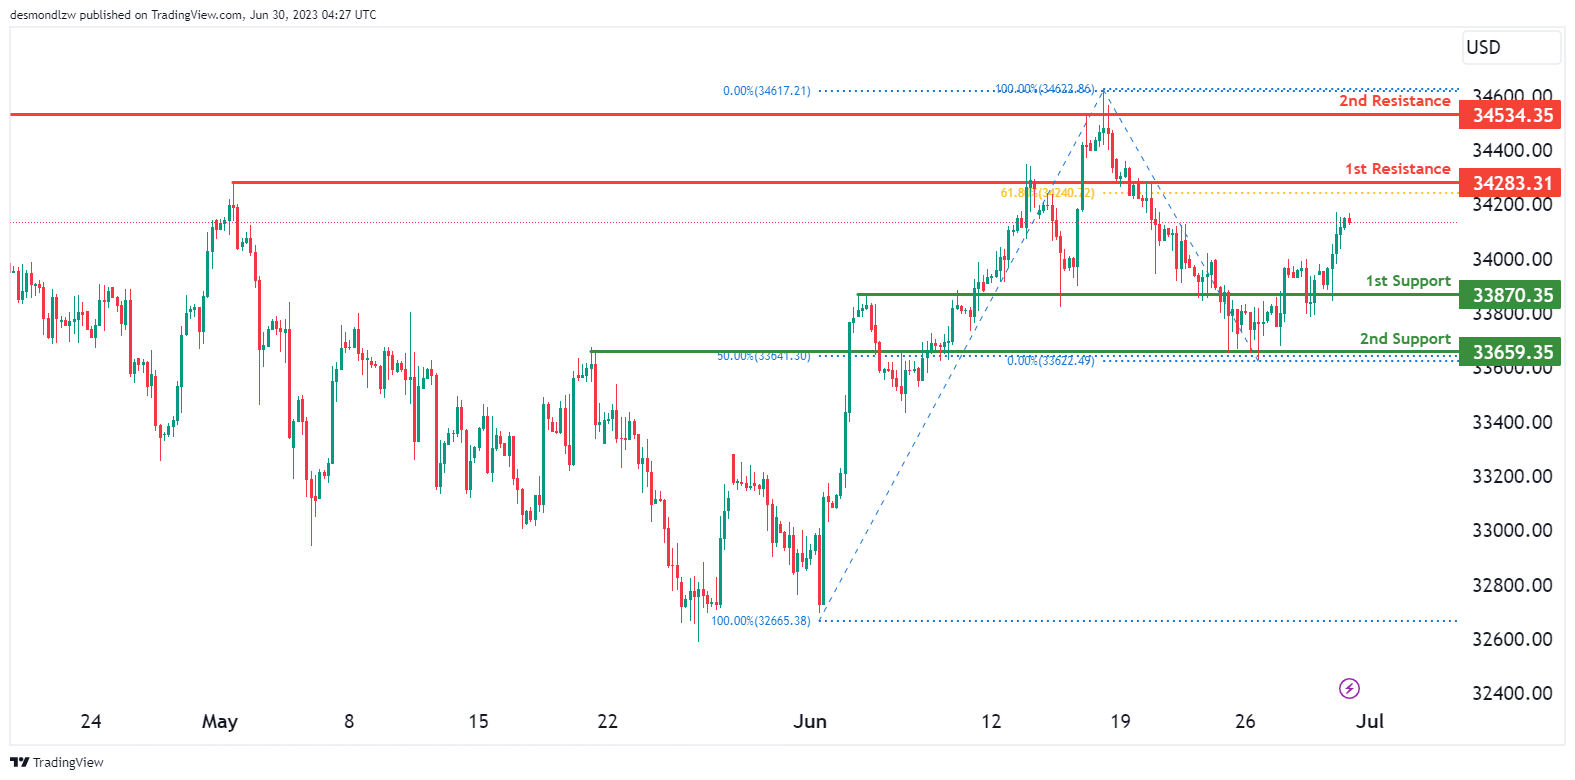
DJ30 (Dow Jones Industrial Average) currently exhibits a bullish overall momentum on the chart. Several factors contribute to this momentum, indicating that the price could potentially continue its bullish movement towards the 1st resistance at 34283.31.
The 1st support level is located at 33870.35 and is considered good due to its overlap support characteristics. Additionally, there is a 2nd support level at 33659.35, which is significant as it represents multi-swing low support and aligns with a 50% Fibonacci Retracement.
On the resistance side, the 1st resistance is positioned at 342283.31 and is considered good because it represents an overlap resistance that aligns with a 61.8% Fibonacci Retracement.. Furthermore, there is a 2nd resistance level at 34534.35, which is significant as it represents swing high resistance.
GER30:
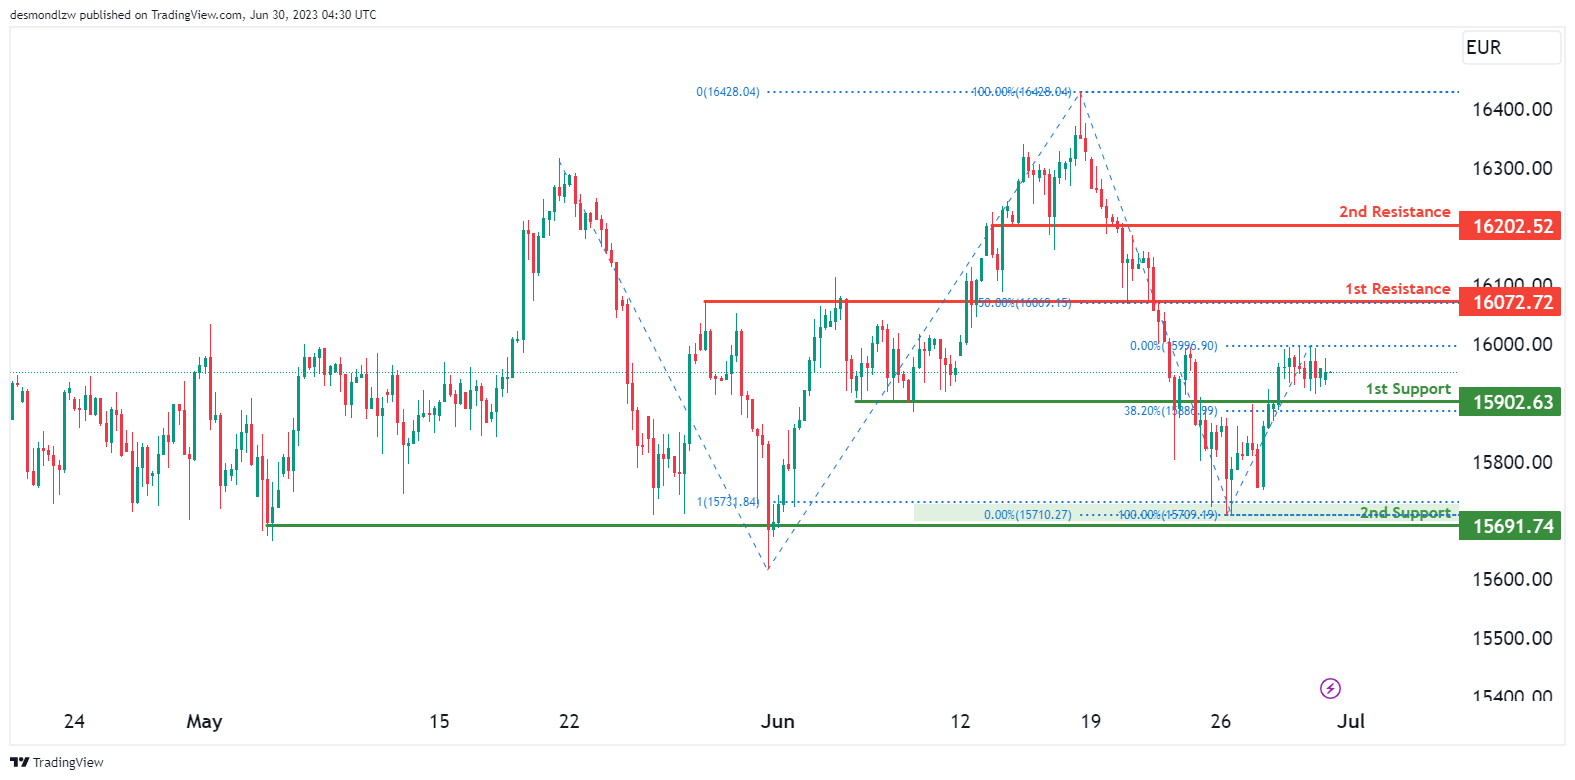
GER30 (German DAX) currently exhibits a bullish overall momentum on the chart. Several factors contribute to this momentum, indicating that the price could potentially continue its bullish movement towards the 1st resistance at 16072.72.
The 1st support level at 15902.63 is considered good due to its overlap support characteristics and aligns with the 38.2% Fibonacci Retracement. Additionally, there is a 2nd support level at 15691.74, which is significant as it represents a multi-swing low overlap support.
On the resistance side, the 1st resistance is positioned at 16072.72 and is considered good because it represents an overlap resistance that aligns with the 50% Fibonacci Retracement while the 2nd resistance is positioned at 16202.52 which is an overlap resistance.
US500
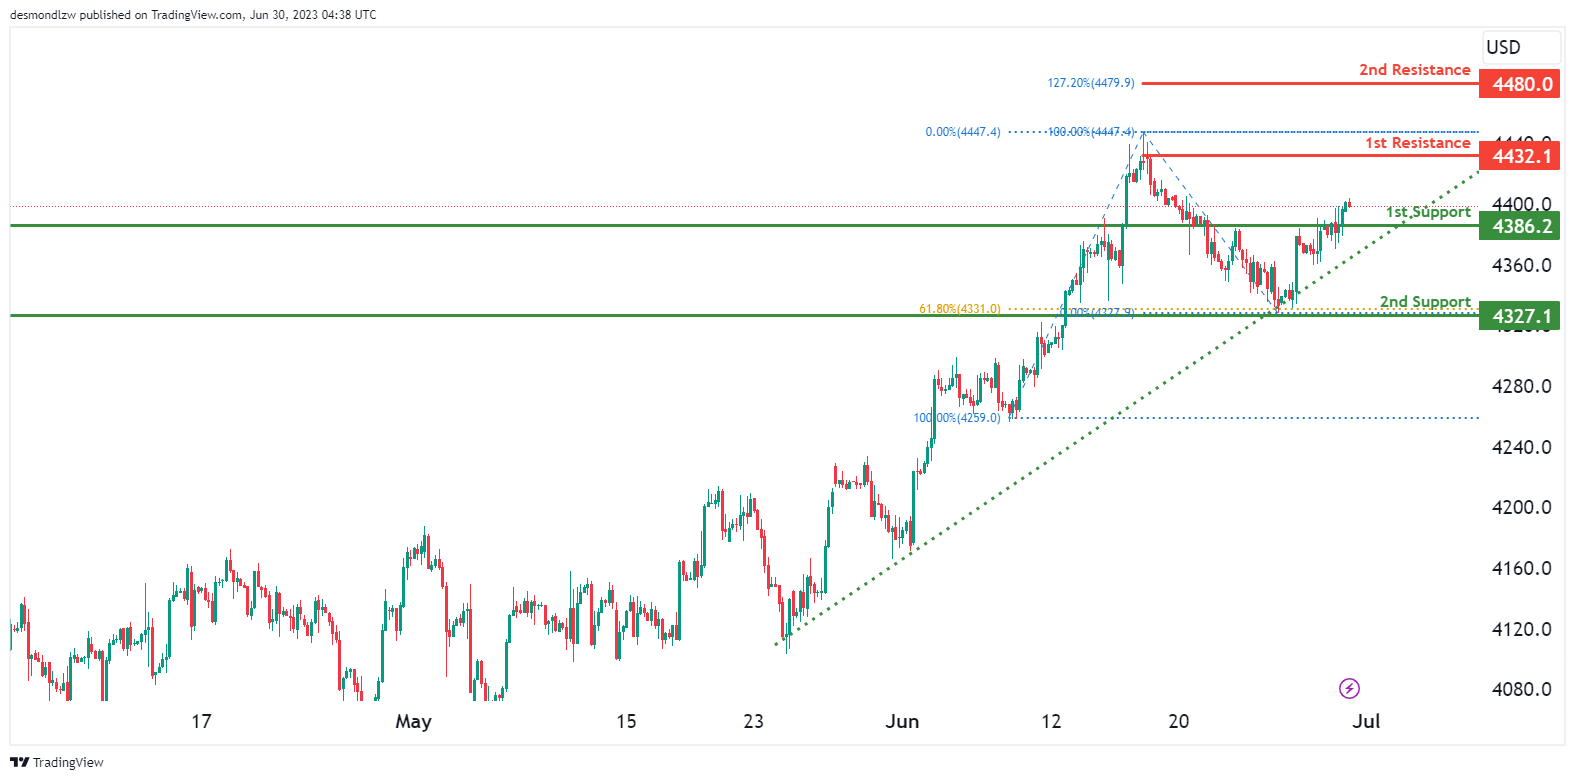
US500 (S&P 500) currently exhibits a bullish momentum on the chart with high confidence. Several factors contribute to this momentum, suggesting that the price could potentially continue its bullish movement towards the 1st resistance level.
The 1st support level is located at 4386.20 and is considered as an overlap support. Additionally, there is a 2nd support level at 4327.10, which is significant as it represents overlap support and aligns with the 61.8% Fibonacci Retracement.
On the resistance side, the 1st resistance is positioned at 4432.10 and is considered good because it represents swing high resistance. Furthermore, there is a 2nd resistance level at 4480.00, which aligns with the 127.2% Fibonacci Extension..
BTC/USD:
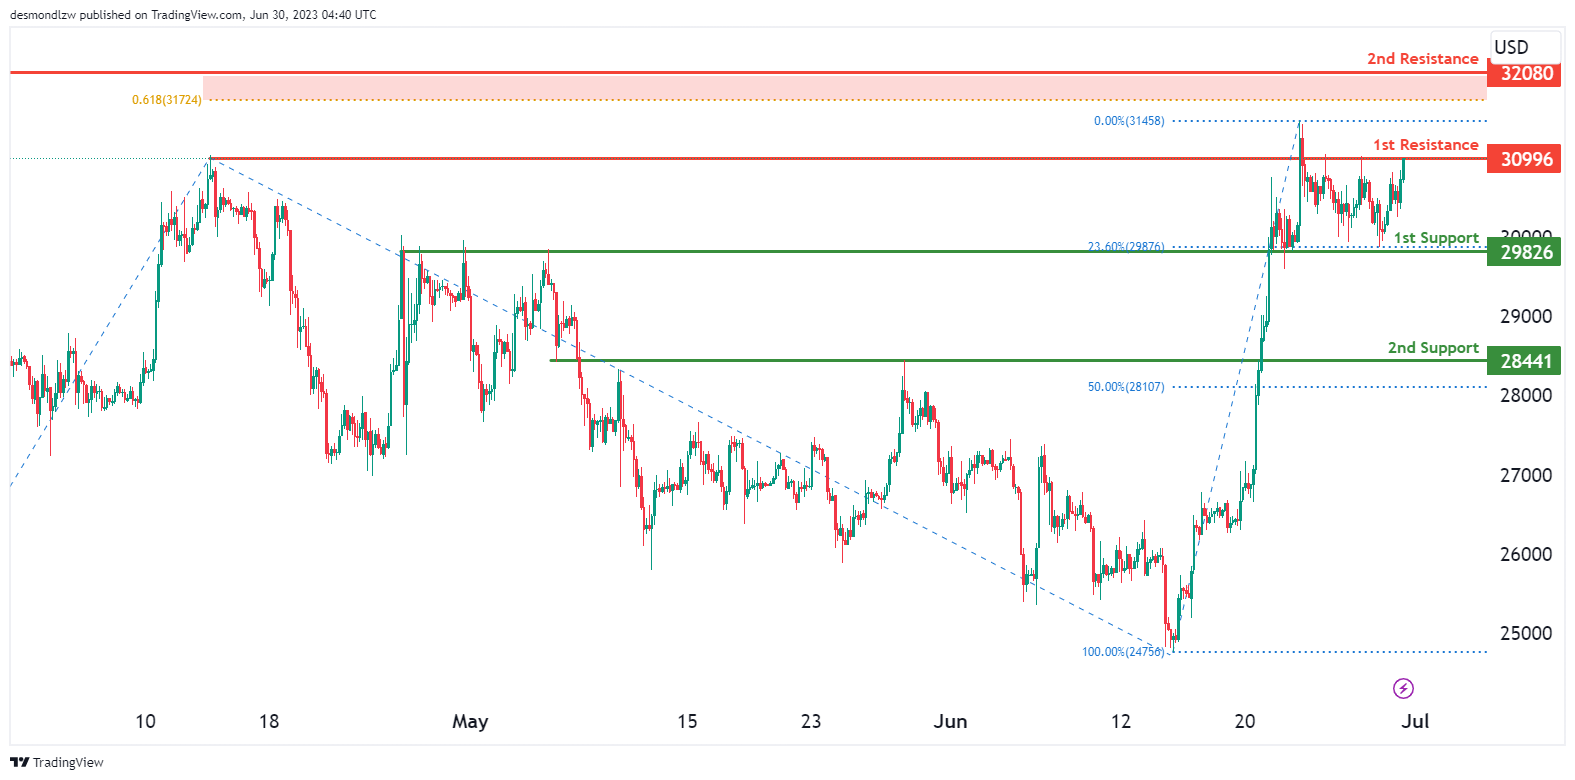
BTC/USD currently exhibits a bullish overall momentum on the chart. Several factors contribute to this momentum, indicating that the price could potentially continue its bullish movement towards the 1st resistance level at 30996.00. The 1st support level at 29826.00 is considered good due to its pullback support and also aligns with the 23.6% Fibonacci Retracement..
On the resistance side, the 1st resistance at 30996.00 is significant because it represents an overlap resistance. The 2nd resistance at 32080.00 is also noteworthy as it is an overlap resistance and aligns close to a 61.8% Fibonacci Projection.
ETH/USD:
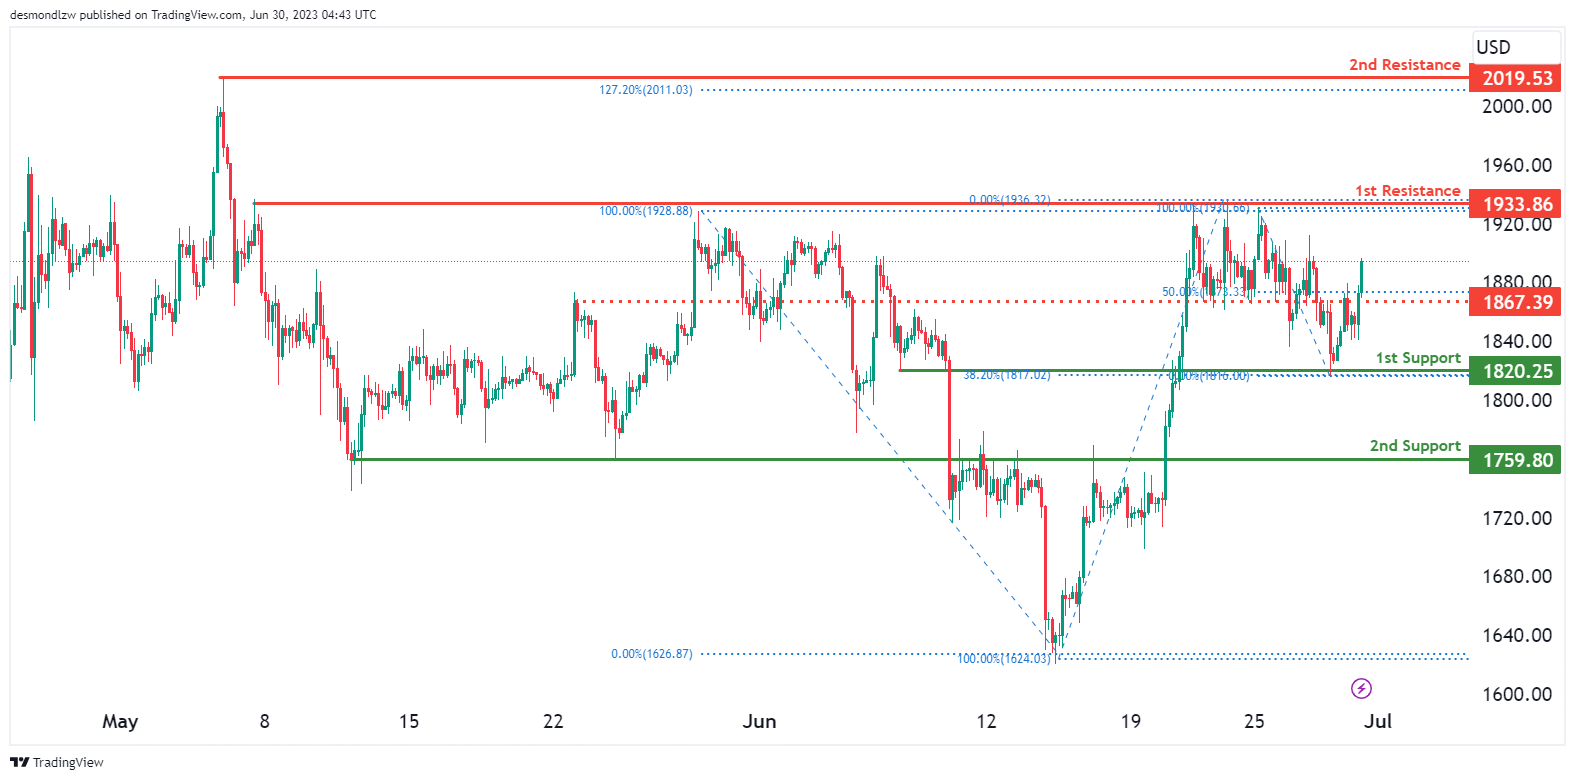
ETH/USD currently exhibits a strong bullish momentum on the chart with high confidence.Based on the bullish momentum, the price could potentially continue its upward movement towards the 1st resistance level.
The 1st support level is located at 1820.25 and is considered good due to its overlap support characteristics, as well as aligning with a 38.2% Fibonacci Retracement. Additionally, there is a 2nd support level at 1759.80, which is an overlap support.
On the resistance side, the 1st resistance is positioned at 1933.86 and is considered good because it represents multi-swing high resistance. Furthermore, there is a 2nd resistance level at 2019.53, which is significant as it represents swing high resistance and aligns with a 127.20% Fibonacci Extension.
WTI/USD:
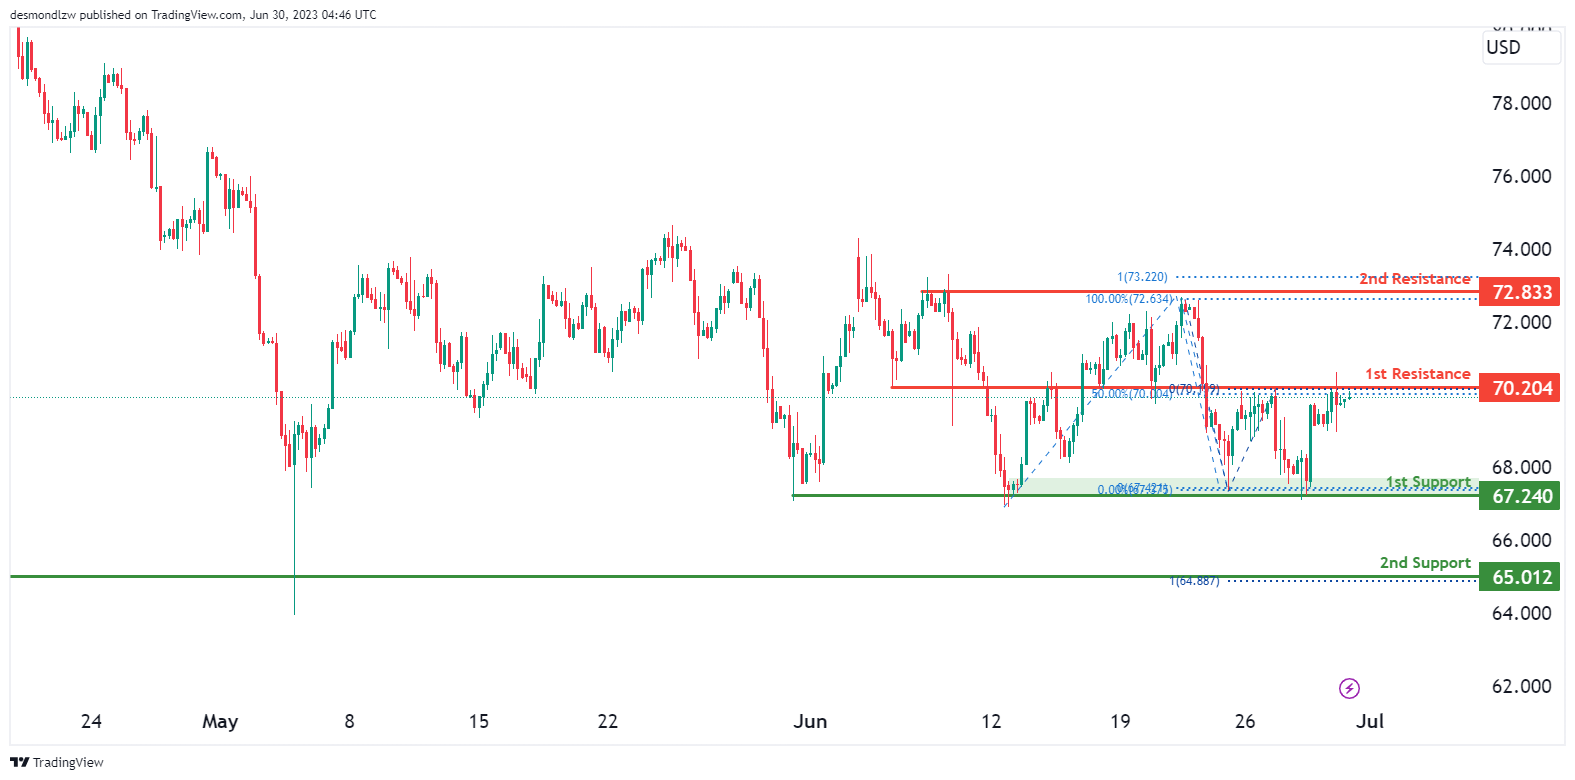
WTI (West Texas Intermediate) currently shows a wek bullish momentum on the chart. Several factors contribute to this momentum, indicating that the price could potentially move above the 1st resistance at 70.204 before reversing from this level. The 1st support level is considered good as it represents multi-swing low support. The 2nd support level at 65.012 is an overlap support that aligns with the 100% Fibonacci Projection.
On the resistance side, the 1st resistance at 70.204 is significant as it represents multi-swing high resistance. Similarly, the 2nd resistance at 72.833 is noteworthy as it also represents multi-swing high resistance.
XAU/USD (GOLD):
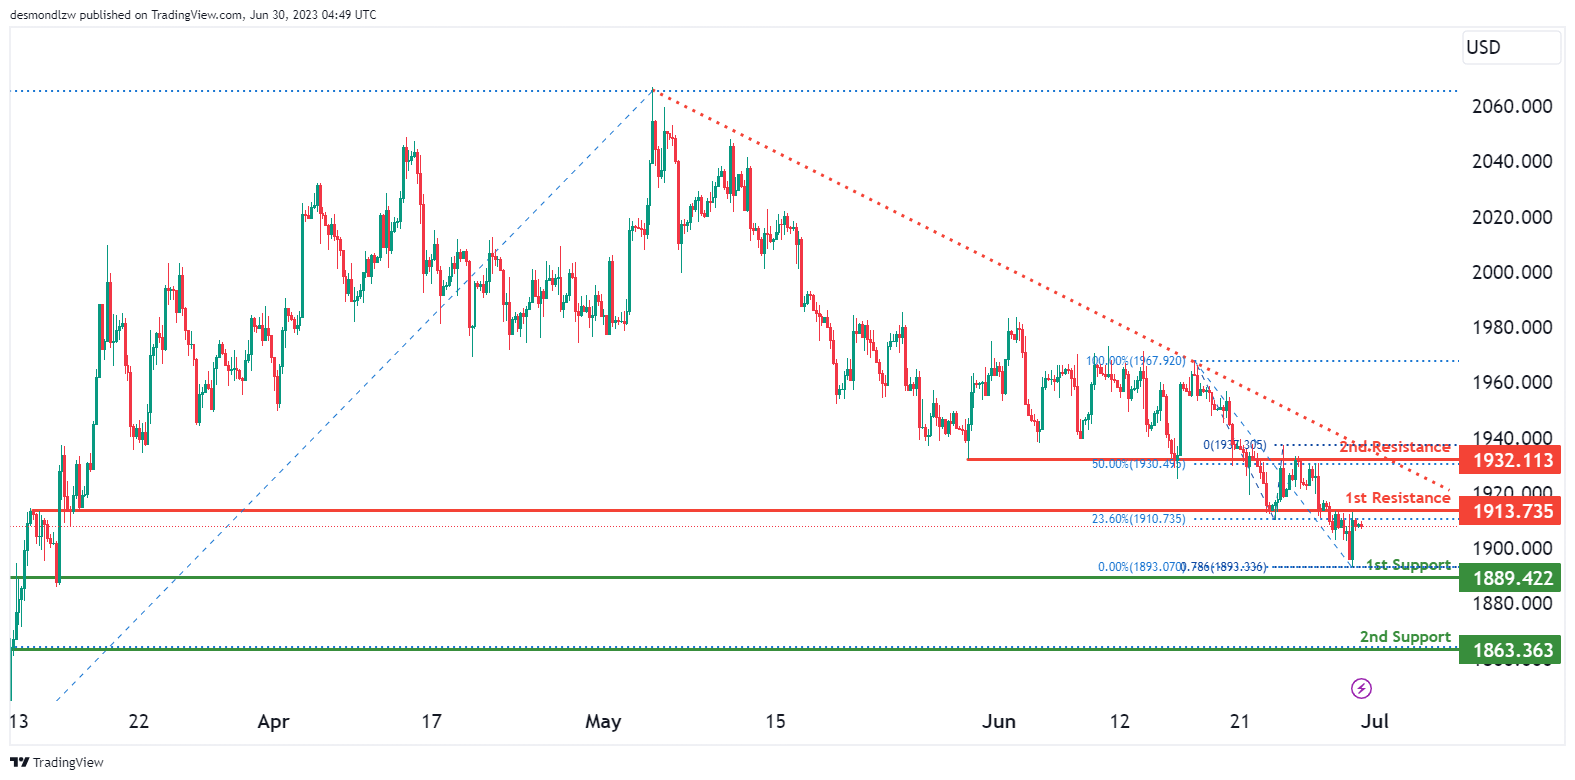
The XAU/USD (Gold) chart displays a bearish momentum, indicating a negative outlook for the market. Factors contributing to this momentum include the potential for a bearish reversal off the 1st resistance level and a move towards the 1st support level.
The 1st support level at 1889.422 is identified as an overlap support, suggesting its significance in providing potential price stability. The 2nd support level at 1863.363 also acts as an overlap support that aligns with the 78.6% Fibonacci Retracement.
On the upside, the 1st resistance level at 1913.735 represents an overlap resistance that aligns with the 23.6% Fibonacci Retracement. Furthermore, the 2nd resistance level at 1932.113 is classified as an overla resistance that aligns with the 50.0% Fibonacci Retracement.
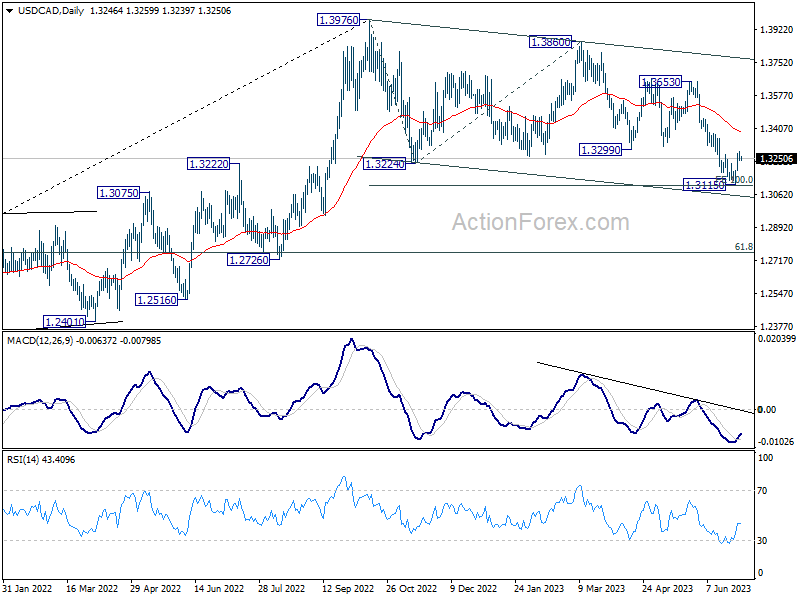
USD/CAD Daily Outlook
Daily Pivots: (S1) 1.3233; (P) 1.3259; (R1) 1.3280; More....
Intraday bias in USD/CAD remains mildly on the upside for the moment. Rebound from 1.3115 short term bottom would target 1.3229 support turned resistance. Firm break there will extend the rebound to 55 D EMA (now at 1.3384). On the downside, break of 1.3115 is needed to confirm resumption of recent decline. Otherwise, more consolidative trading should be seen first, in case of retreat.
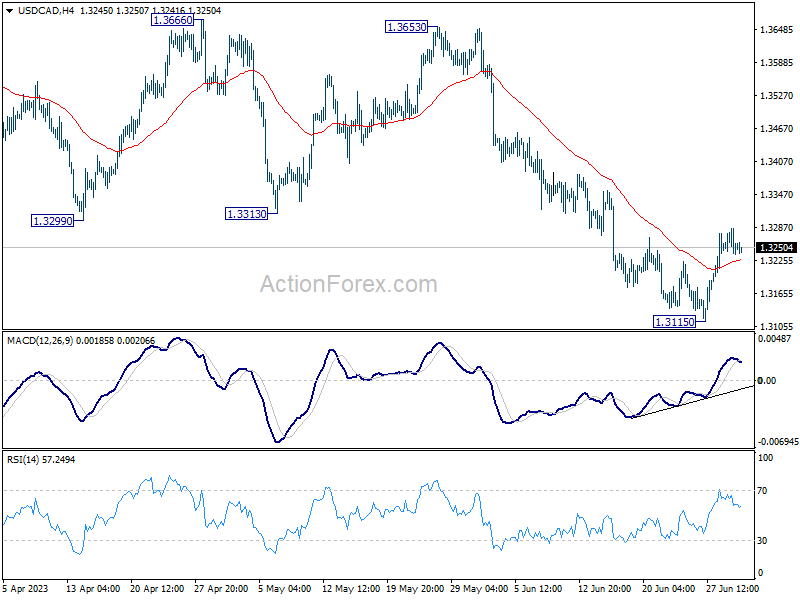
In the bigger picture, price actions from 1.3976 are still viewed as a correction to up trend from 1.2005 (2021 low), but chance of trend reversal is increasing with current decline. In either case, risk will stay on the downside as long as 1.3299 support turned resistance holds, even in case of strong rebound. Next target is 61.8% retracement of 1.2005 to 1.3976 at 1.2758. Sustained trading above 1.3229 will raise the chance that the correction has completed and turn focus back to 1.3653 resistance.
AUD/USD Daily Report
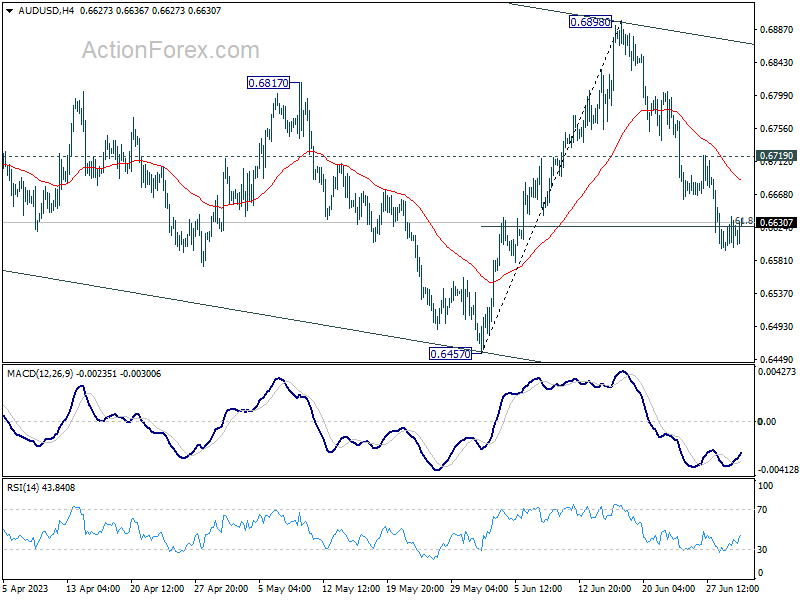
Daily Pivots: (S1) 0.6595; (P) 0.6618; (R1) 0.6639; More...
AUD/USD continues to gyrate around 61.8% retracement of 0.6457 to 0.6898 at 0.6625 and intraday bias is turned neutral first. Further decline will remain in favor as long as 0.6719 resistance holds. Sustained trading below 0.6625 will pave the way to 0.6457 key support level.
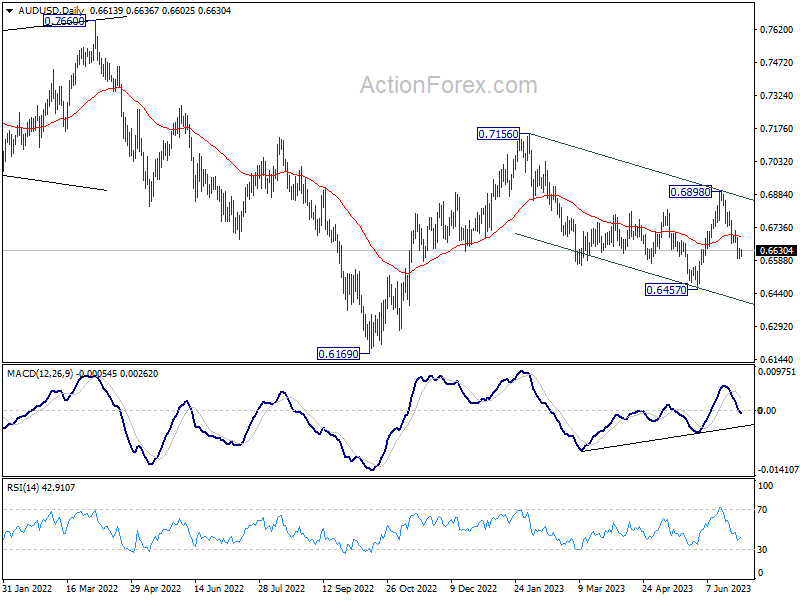
In the bigger picture, outlook is mixed up by the deeper than expected pull back from 0.6898. Still, price actions from 0.7156 are seen as a correction to rebound from 0.6169. Break of 0.6457 will resume the fall towards 0.6169 low. On the upside, though, break of 0.6898 resistance will argue that rise from 0.6169 is ready to resume through 0.7156.
USD/JPY Daily Outlook
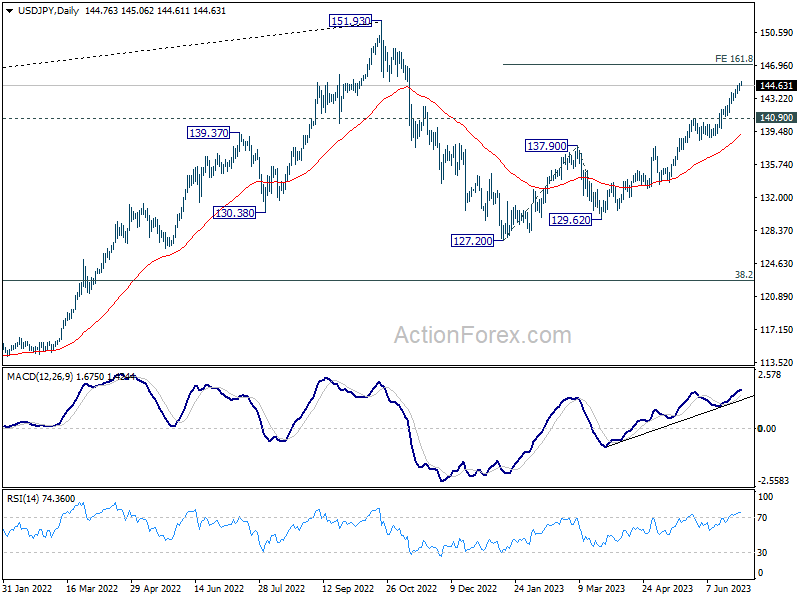
Daily Pivots: (S1) 144.31; (P) 144.61; (R1) 145.08; More...
While USD/JPY continues to lose upside momentum as seen in 4H MACD, there is no sign of topping yet. Intraday bias stays on the upside for 161.8% projection of 127.20 to 137.90 from 129.62 at 146.93. On the downside, below 143.72 minor support will turn bias again and bring consolidations. But further rally will remain in favor as long as 140.90 resistance turned support holds.
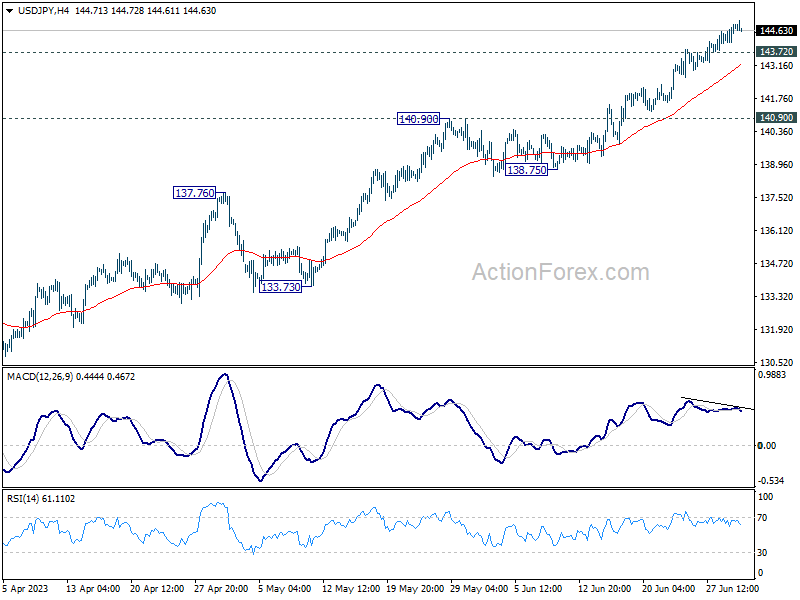
In the bigger picture, rise from 127.20 is currently seen as the second leg of the corrective pattern from 151.93 high. Further rally is expected as long as 137.90 resistance turned support holds, to retest 151.93. But strong resistance could be seen there to limit upside. Break of 137.90 will indicate the the third leg has started back towards 127.20.
USD/CHF Daily Outlook
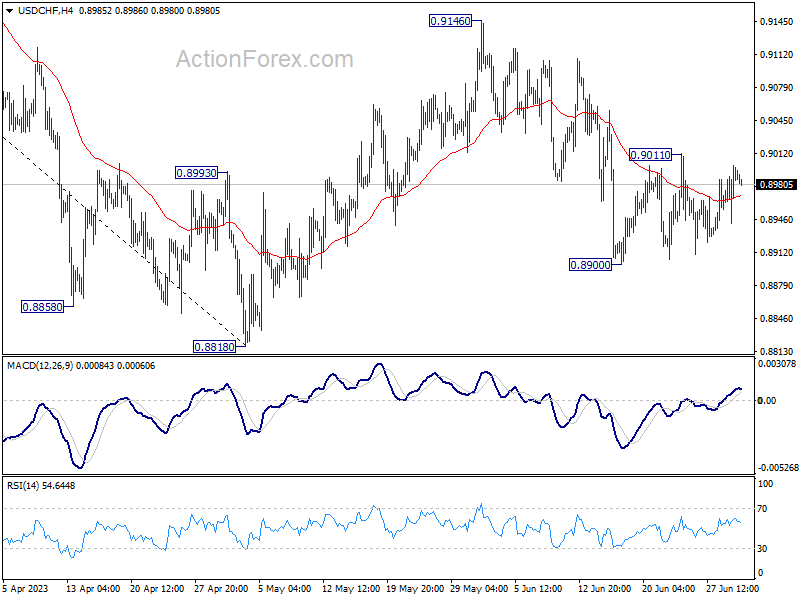
Daily Pivots: (S1) 0.8959; (P) 0.8980; (R1) 0.9018; More...
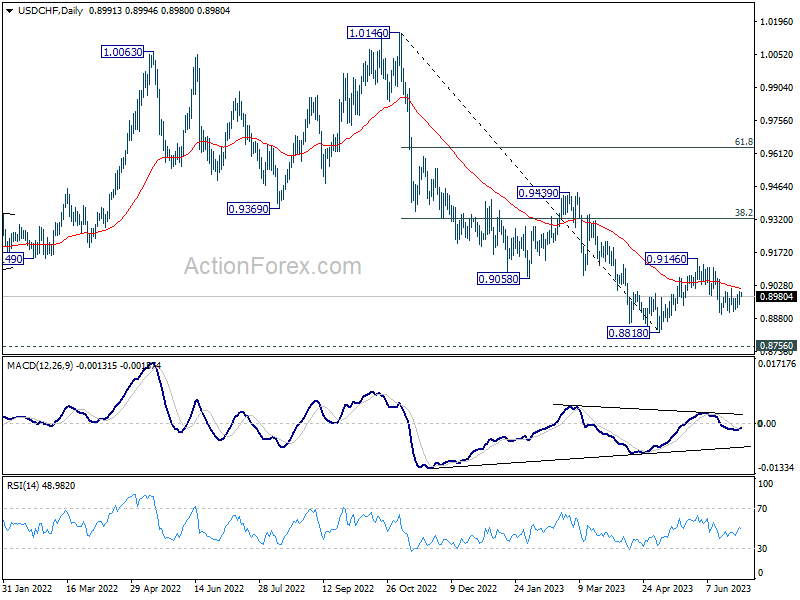
Intraday bias in USD/CHF stays neutral as range trading continues and outlook is unchanged. On the downside, break of 0.8900 will resume the fall from 0.9146 to 0.8818 low or below. But for now, strong support is still expected from 0.8756 long term support to bring rebound. On the upside, above 0.9011 will bring stronger rise towards 0.9146 resistance.
In the bigger picture, fall from 1.1046 (2022 high) is seen as a leg in the long term range pattern from 1.0342 (2016 high), which might have completed at 0.8818 already, just ahead of 0.8756 long term support. Sustained trading above 0.9058 support turned resistance should confirm medium term bottoming.
GBP/USD Daily Outlook
Daily Pivots: (S1) 1.2580; (P) 1.2623; (R1) 1.2656; More...
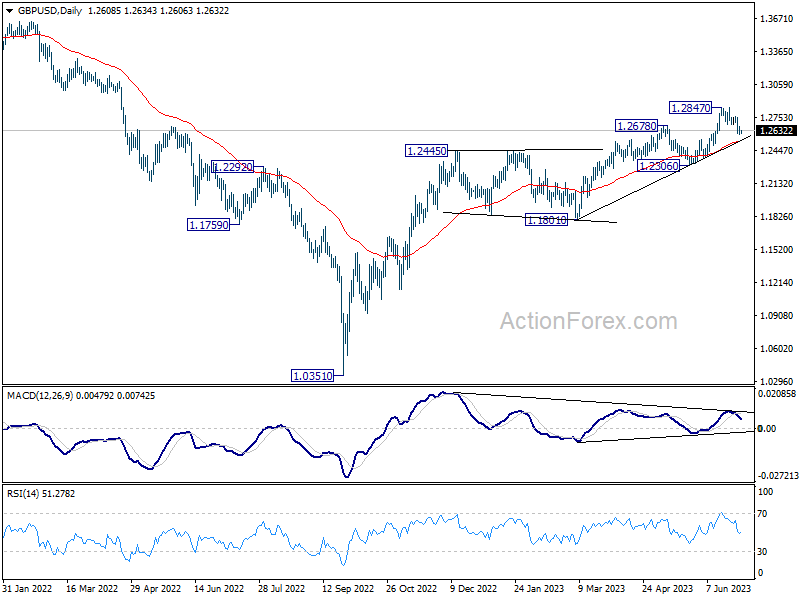
Intraday bias in GBP/USD remains mildly on the downside as fall from 1.2847 short term top is in progress. Considering bearish divergence condition in D MACD, sustained break of 55 D EMA (now at 1.2529) will argue that it's already in correction to larger up trend and target 1.2306 support. On the upside, though, break of 1.2690 minor resistance will bring retest of 1.2847 instead.
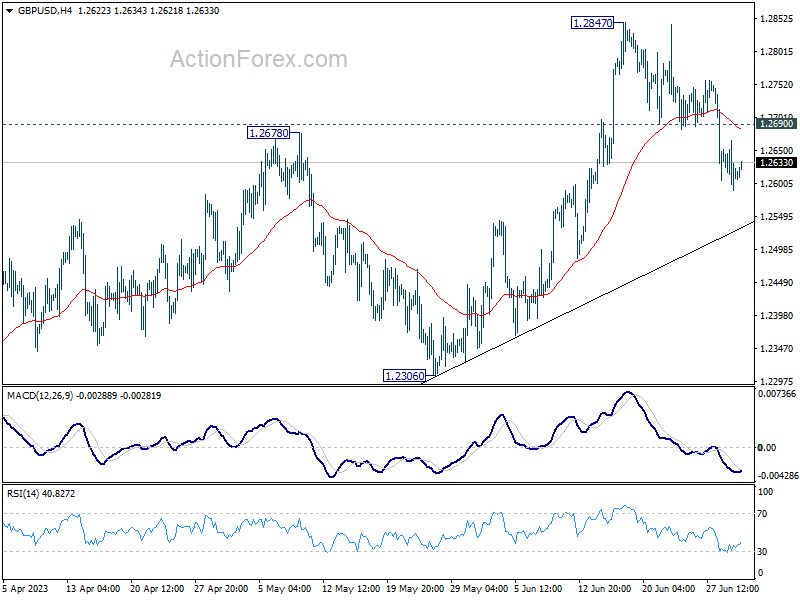
In the bigger picture, the strong support from 55 W EMA (now at 1.2341) is a medium term bullish sign. Outlook will stay bullish as long as 1.2306 support holds. Rise from 1.0351 medium term bottom (2022 low) is expected to extend further to retest 1.4248 key resistance (2021 high).
EUR/USD Daily Outlook
Daily Pivots: (S1) 1.0836; (P) 1.0888; (R1) 1.0917; More...
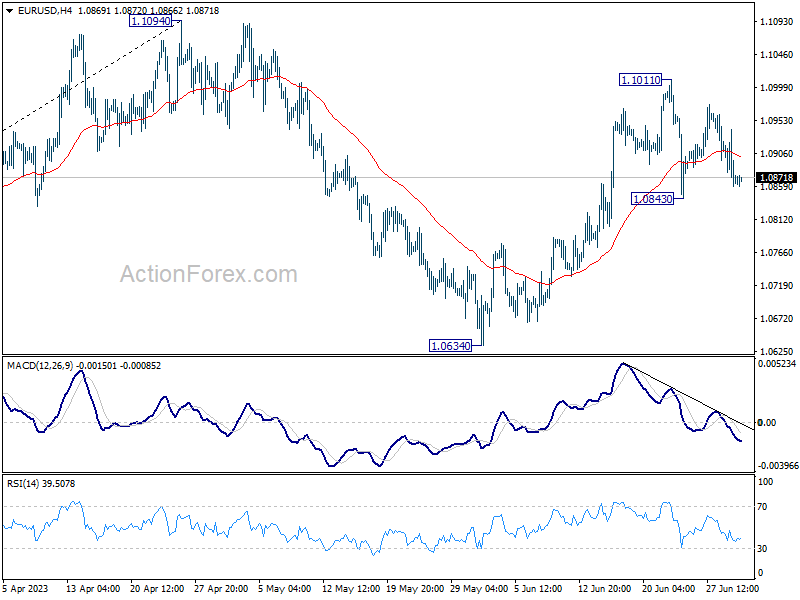
Intraday bias in EUR/USD remains neutral at this point as sideway trading continues. Further rally is mildly in favor with 1.0843 support intact. On the upside, break of 1.1011 will resume the rise from 1.0634 and target 1.1094 resistance. Decisive break there will resume larger up trend from 0.9534. However, break of 1.0843 will turn bias to the downside for 1.0634 support instead.
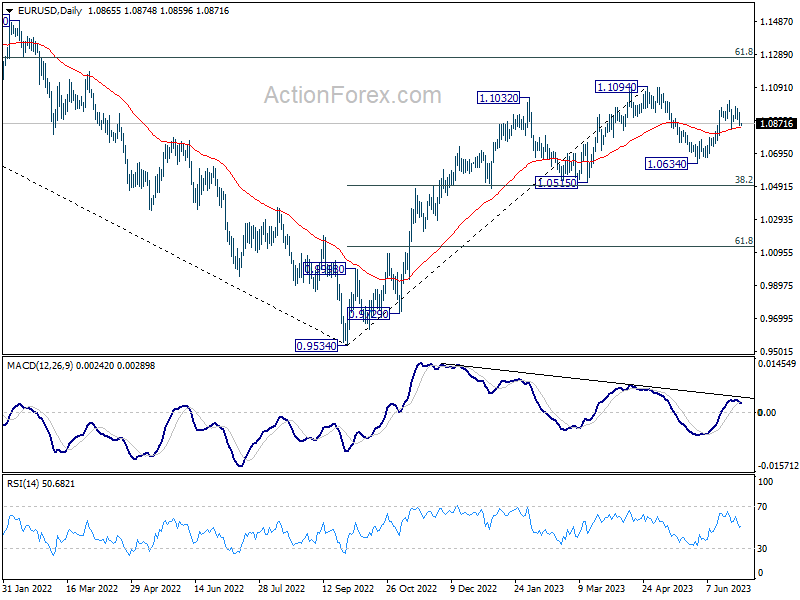
In the bigger picture, as long as 1.0515 support holds, rise from 0.9534 (2022 low) would still extend higher. Sustained break of 61.8% retracement of 1.2348 (2021 high) to 0.9534 at 1.1273 will solidify the case of bullish trend reversal and target 1.2348 resistance next (2021 high).
Euro and Dollar Await Inflation Data as Markets Tread Water
In the run-up to the close of the first half, forex markets appear to be treading water in today's Asian session. Market responses to China's lackluster PMI data have been tepid, while Yen remains largely unfazed by Japan's industrial production figures and Tokyo's CPI. Asian indexes are mixed with mild selloff in Nikkei.
Dollar and Euro are neck-and-neck in the race for this week's top spot, with the final outcome possibly hinging on upcoming Eurozone CPI flash and US PCE inflation data. Commodity currencies, on the other hand, are languishing at the bottom of the chart, with Kiwi underperforming against its Australian and Canadian counterparts. Sterling, Swiss Franc, and Yen are stuck in a mixed performance amidst the fray.
Technically, US 10-year yield's breach of 3.854 short term top overnight is worth a mention. Rise from 3.253 might be finally resuming. A strong close above the resistance today will solidify near term bullishness, and the case that whole correction from 4.333 has completed with three waves down to 3.253. This development could pave the way for further rally in the coming week, especially with a slew of high-impact US data on the horizon, and potentially providing a boost for USD/JPY. The lingering question for USD/JPY is when Japan might decide to step in with intervention again.
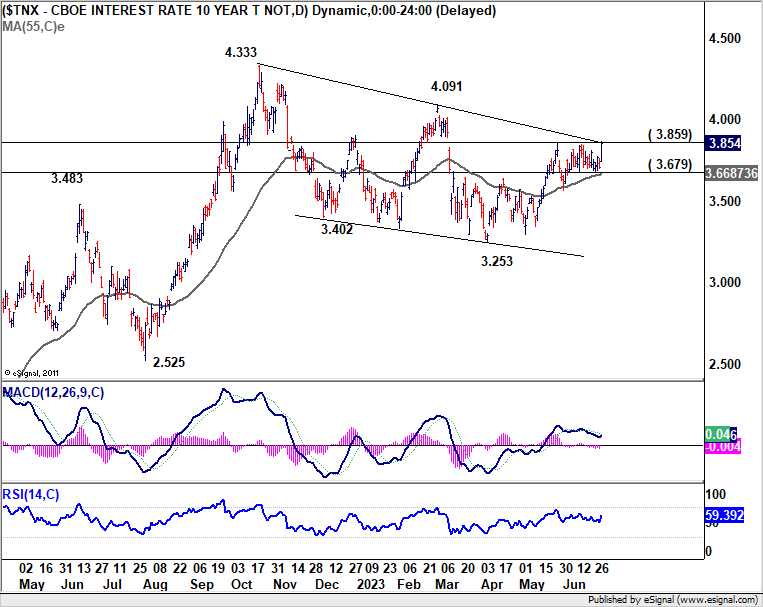
In Asia, at the time of writing, Nikkei is down -0.54%. Hong Kong HSI is up 0.02%. China Shanghai SSE is up 0.78%. Singapore Strait times is up 0.03%. Japan 10-year JGB yield is up 0.0131 at 0.397, getting close to 0.4 handle again. Overnight, DOW rose 0.80%. S&P 500 rose 0.45%. NASDAQ closed flat. 10-year yield rose 0.144 to 3.854.
Japan industrial production down -1.6% mom in May on vehicle sector
Japan's industrial production recorded a sharper decline than anticipated, dropping by 1.6% mom in May. This marked the first contraction in four months, surpassing expectations of -1.0% decrease. According to survey by Ministry of Economy, Trade and Industry, manufacturers forecast industrial output to recover by 5.6% in June, only to fall again by -0.6% in July.
Among the 15 industrial sectors, 12 reported falling output, with only three seeing rise in production. Notably, motor vehicle sector bore the brunt of the decline, experiencing substantial -8.9% slump from the previous month, with passenger cars and auto body parts being the significant contributors.
Also released, the country's unemployment rate remained unchanged at 2.6%, as expected. The number of jobless individuals decreased by -30k from the prior month, standing at 1.77 million. However, the Ministry of Health, Labor and Welfare revealed a slight downturn in the job market, with ratio of job openings to job seekers in May dropping to 1.31, down 0.01 point from April.
Meanwhile, Tokyo CPI edged down to 3.1% yoy in June, from 3.2% in May. Core CPI, which excludes fresh food, held steady at 3.2% yoy. Core-core CPI, excluding both food and energy, saw a mild decrease from 3.9% yoy to 3.8% yoy.
China PMI manufacturing ticked up to 49.0, still in contraction
June saw a modest uptick in China's NBS PMI Manufacturing from 48.8 to 49.0, missing expectation of 49.5. The manufacturing sector remains in contractionary state, albeit with a slight improvement from the previous month.
In some details of PMI Manufacturing, new orders improved slightly, climbing to 48.6 from May's 48.3. However, new export orders saw a five-month low at 46.4, suggesting weakening demand from overseas. Employment fell from 48.4 to 48.2.
In parallel, PMI Non-Manufacturing dropped from 54.5 in May to 53.2 in June, underperforming 53.7 forecast. This decline marks the weakest reading index since December. Employment sub-gauge for non-manufacturing sector fell noticeably, from 48.4 to 46.8.
Additionally, PMI Composite, which combines both manufacturing and service sector activity, declined from 52.9 to 52.3. This lower figure highlights a broader slowdown in China's economic activity beyond manufacturing alone.
Looking ahead
The economic calendar is rather busy today. Eurozone CPI flash is the main highlight in European session while unemployment rate will be released. Other features include UK GDP final, Swiss retail sales and KOF economic barometer, France consumer spending and Germany unemployment.
Later in the day, focuses will be on Canada GDP and US PCE inflation. Chicago PMI and U of Michigan consumer sentiment final will also be published.
EUR/USD Daily Outlook
Daily Pivots: (S1) 1.0836; (P) 1.0888; (R1) 1.0917; More...
Intraday bias in EUR/USD remains neutral at this point as sideway trading continues. Further rally is mildly in favor with 1.0843 support intact. On the upside, break of 1.1011 will resume the rise from 1.0634 and target 1.1094 resistance. Decisive break there will resume larger up trend from 0.9534. However, break of 1.0843 will turn bias to the downside for 1.0634 support instead.
In the bigger picture, as long as 1.0515 support holds, rise from 0.9534 (2022 low) would still extend higher. Sustained break of 61.8% retracement of 1.2348 (2021 high) to 0.9534 at 1.1273 will solidify the case of bullish trend reversal and target 1.2348 resistance next (2021 high).
Economic Indicators Update
| GMT | Ccy | Events | Actual | Forecast | Previous | Revised |
|---|---|---|---|---|---|---|
| 23:30 | JPY | Tokyo CPI Y/Y Jun | 3.10% | 3.80% | 3.20% | |
| 23:30 | JPY | Tokyo CPI ex Fresh Food Y/Y Jun | 3.20% | 3.30% | 3.20% | |
| 23:30 | JPY | Tokyo CPI ex Food Energy Y/Y Jun | 3.80% | 4.40% | 3.90% | |
| 23:30 | JPY | Unemployment Rate May | 2.60% | 2.60% | 2.60% | |
| 23:50 | JPY | Industrial Production M/M May P | -1.60% | -1.00% | 0.70% | |
| 01:30 | CNY | Manufacturing PMI Jun | 49.0 | 49.5 | 48.8 | |
| 01:30 | CNY | Non-Manufacturing PMI Jun | 53.2 | 53.7 | 54.5 | |
| 01:30 | AUD | Private Sector Credit M/M May | 0.40% | 0.40% | 0.60% | |
| 05:00 | JPY | Housing Starts Y/Y May | -2.20% | -11.90% | ||
| 06:00 | EUR | Germany Import Price Index M/M May | -2.00% | -1.70% | ||
| 06:00 | EUR | Germany Retail Sales M/M May | 0.20% | 0.80% | ||
| 06:00 | GBP | GDP Q/Q Q1 F | 0.10% | 0.10% | ||
| 06:00 | GBP | Current Account (GBP) Q1 | -7.7B | -2.5B | ||
| 06:30 | CHF | Real Retail Sales Y/Y May | -2.50% | -3.70% | ||
| 06:45 | EUR | France Consumer Spending M/M May | 0.70% | -1.00% | ||
| 07:00 | CHF | KOF Economic Barometer Jun | 89.2 | 90.2 | ||
| 07:55 | EUR | Germany Unemployment Change May | 15K | 9K | ||
| 07:55 | EUR | Germany Unemployment Rate May | 5.60% | 5.60% | ||
| 08:00 | EUR | Italy Unemployment May | 7.90% | 7.80% | ||
| 09:00 | EUR | Eurozone Unemployment Rate May | 6.50% | 6.50% | ||
| 09:00 | EUR | CPI Y/Y Jun P | 5.60% | 6.10% | ||
| 09:00 | EUR | CPI Core Y/Y Jun P | 5.40% | 5.30% | ||
| 12:30 | CAD | GDP M/M Apr | 0.20% | 0.00% | ||
| 12:30 | USD | Personal Income M/M May | 0.40% | 0.40% | ||
| 12:30 | USD | Personal Spending May | 0.20% | 0.80% | ||
| 12:30 | USD | PCE Price Index M/M May | 0.40% | |||
| 12:30 | USD | PCE Price Index Y/Y May | 4.40% | |||
| 12:30 | USD | Core PCE Price Index M/M May | 0.40% | 0.40% | ||
| 12:30 | USD | Core PCE Price Index Y/Y May | 4.70% | 4.70% | ||
| 13:45 | USD | Chicago PMI Jun | 44.5 | 40.4 | ||
| 14:00 | USD | Michigan Consumer Sentiment Index Jun F | 63.9 | 63.9 |
China PMI manufacturing ticked up to 49.0, still in contraction
June saw a modest uptick in China's NBS PMI Manufacturing from 48.8 to 49.0, missing expectation of 49.5. The manufacturing sector remains in contractionary state, albeit with a slight improvement from the previous month.
In some details of PMI Manufacturing, new orders improved slightly, climbing to 48.6 from May's 48.3. However, new export orders saw a five-month low at 46.4, suggesting weakening demand from overseas. Employment fell from 48.4 to 48.2.
In parallel, PMI Non-Manufacturing dropped from 54.5 in May to 53.2 in June, underperforming 53.7 forecast. This decline marks the weakest reading index since December. Employment sub-gauge for non-manufacturing sector fell noticeably, from 48.4 to 46.8.
Additionally, PMI Composite, which combines both manufacturing and service sector activity, declined from 52.9 to 52.3. This lower figure highlights a broader slowdown in China's economic activity beyond manufacturing alone.
Japan industrial production down -1.6% mom in May on vehicle sector
Japan's industrial production recorded a sharper decline than anticipated, dropping by -1.6% mom in May. This marked the first contraction in four months, surpassing expectations of -1.0% decrease. According to survey by Ministry of Economy, Trade and Industry, manufacturers forecast industrial output to recover by 5.6% in June, only to fall again by -0.6% in July.
Among the 15 industrial sectors, 12 reported falling output, with only three seeing rise in production. Notably, motor vehicle sector bore the brunt of the decline, experiencing substantial -8.9% slump from the previous month, with passenger cars and auto body parts being the significant contributors.
Also released, the country's unemployment rate remained unchanged at 2.6%, as expected. The number of jobless individuals decreased by -30k from the prior month, standing at 1.77 million. However, the Ministry of Health, Labor and Welfare revealed a slight downturn in the job market, with ratio of job openings to job seekers in May dropping to 1.31, down 0.01 point from April.
Meanwhile, Tokyo CPI edged down to 3.1% yoy in June, from 3.2% in May. Core CPI, which excludes fresh food, held steady at 3.2% yoy. Core-core CPI, excluding both food and energy, saw a mild decrease from 3.9% yoy to 3.8% yoy.