

Sample Category Title
EUR/AUD Daily Outlook
Daily Pivots: (S1) 1.6295; (P) 1.6355; (R1) 1.6451; More...
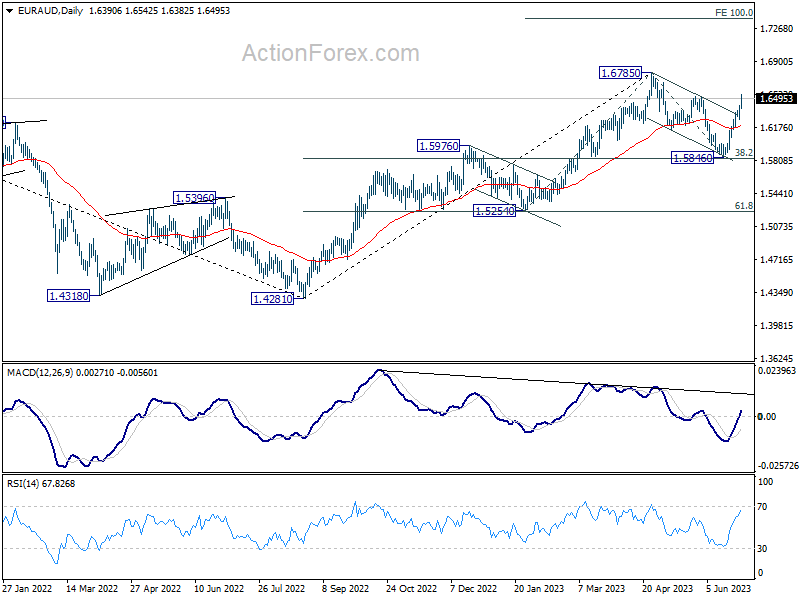
Intraday bias in EUR/AUD remains on the upside as rally from 1.5846 extends. Decisive break of 1.6513 resistance will confirm that whole correction from 1.6785 has completed at 1.5846. Further rally would be seen to retest 1.6785 high next. On the downside, break of 1.6255 minor support will mix up the outlook and turn intraday bias neutral first.
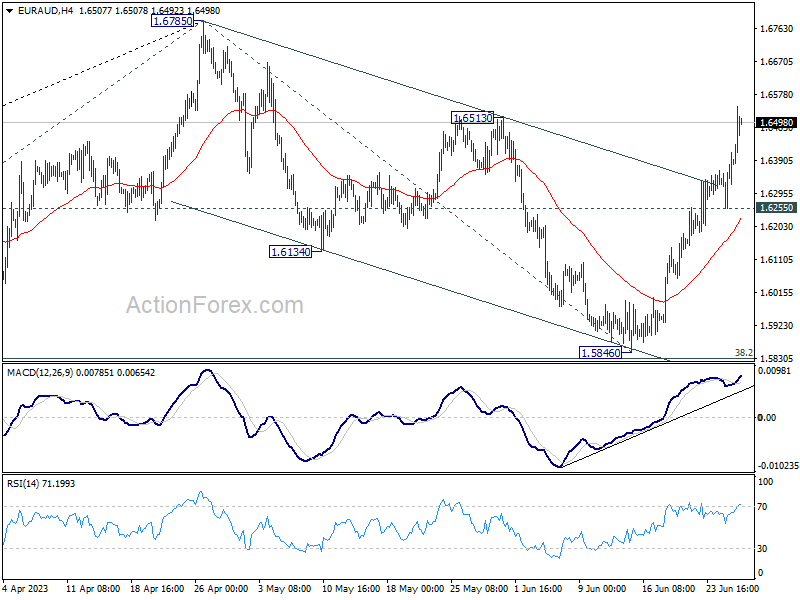
In the bigger picture, with 38.2% retracement of 1.4281 to 1.6785 at 1.5828 intact, rally from 1.4281 is still in progress. Firm break of 1.6785 will confirm rally resumption. Next target is 100% projection of 1.5254 to 1.6785 from 1.5846 at 1.7377. On the other hand, rejection by 1.6785 will extend the corrective pattern with another fall leg. But outlook will stay bullish as long as 1.5828 holds.
EUR/CHF Daily Outlook
Daily Pivots: (S1) 0.9761; (P) 0.9791; (R1) 0.9827; More...
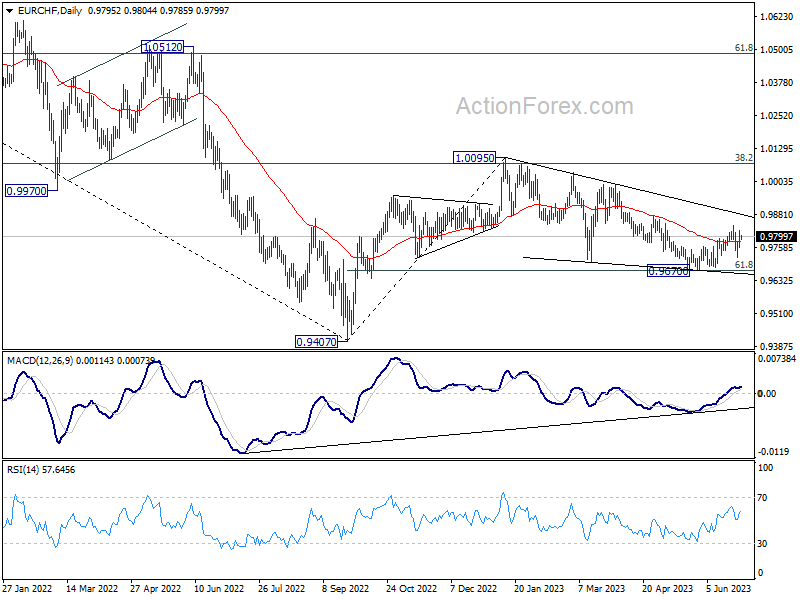
Range trading continues in EUR/CHF and intraday bias remains neutral. Another fall cannot be ruled out, to retest 0.9670 low. Sustained break there will resume the whole fall from 1.0095. Nevertheless, break of 0.9840 will resume the rebound from 0.9670 to 0.9878 resistance.
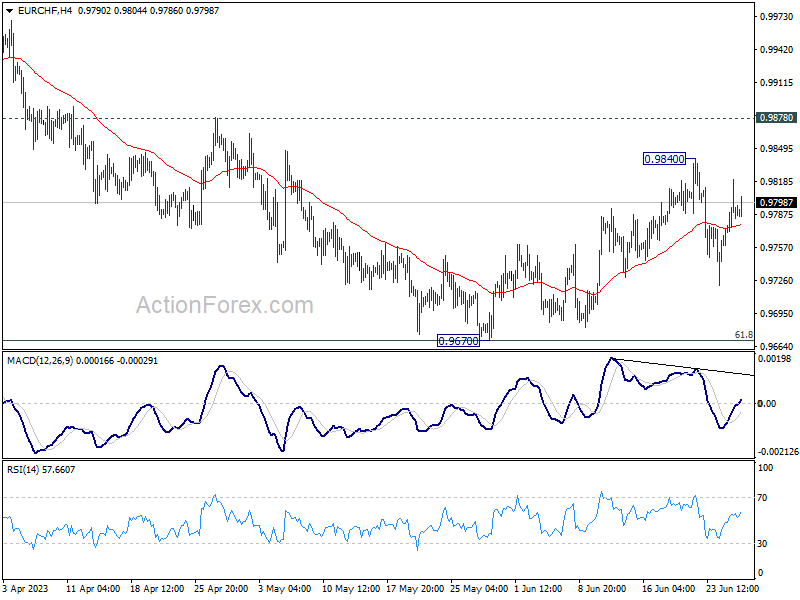
In the bigger picture, medium term outlook is staying bearish as the pair is capped below falling 55 W EMA (now at 0.9918). Down trend form 1.2004 (2018 high) is in favor to extend through 0.9407 at a later stage. Nevertheless, decisive break of 38.2% retracement of 1.1149 to 0.9407 will raise the chance of bullish trend reversal.
NZDUSD Spikes Lower to Extend its Pullback
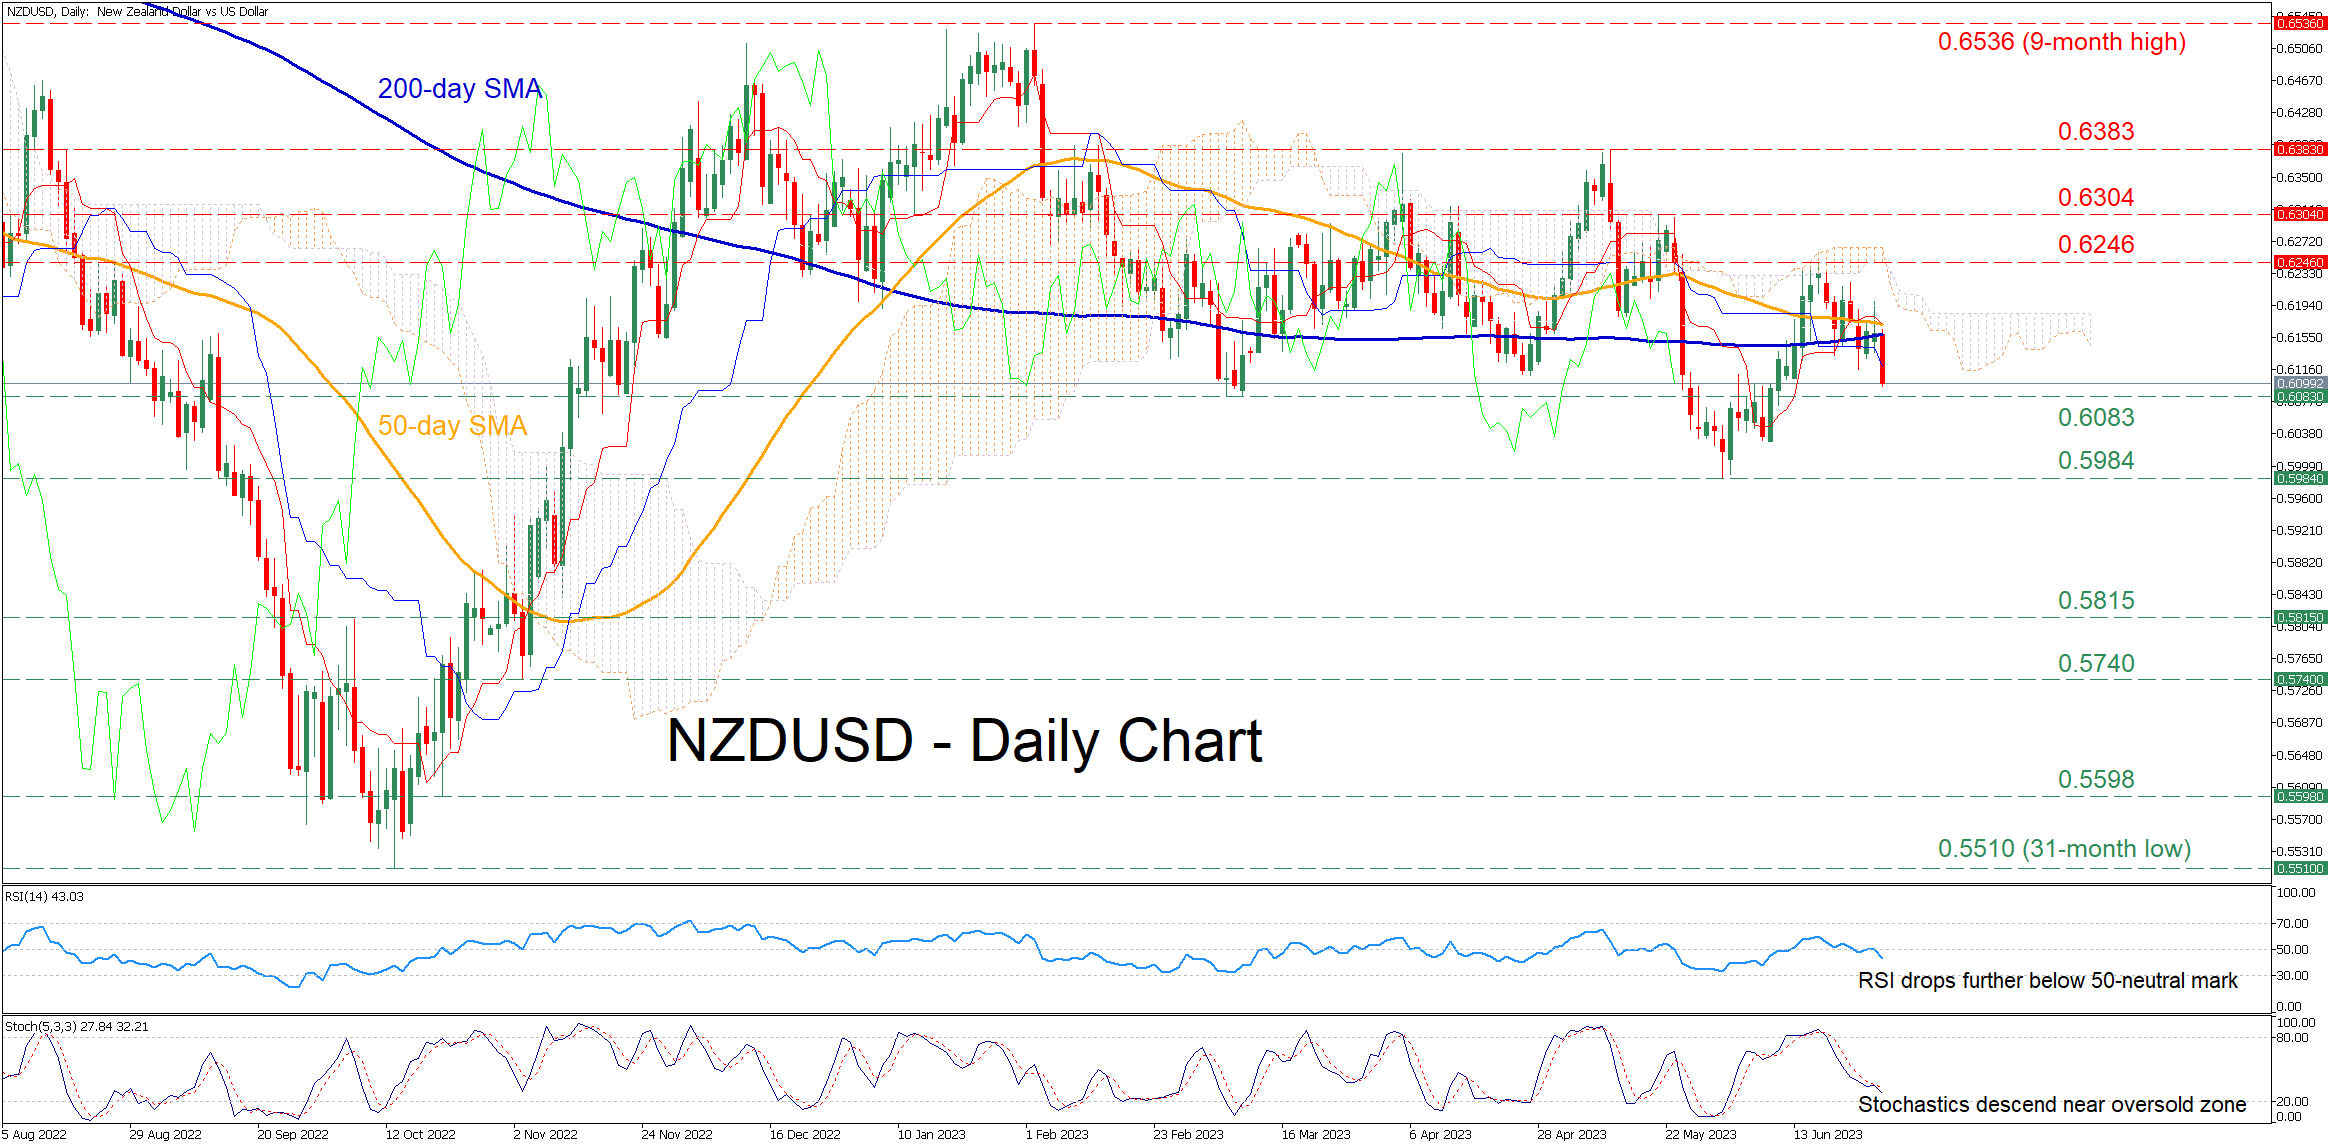
NZDUSD had been steadily regaining ground after finding its feet at the 2023 low of 0.5984 in early June. However, the latest rebound faltered after challenging the upper boundary of the Ichimoku cloud, with the price reversing lower and dropping below both its 50- and 200-day simple moving averages (SMAs)
The momentum indicators currently suggest that the bearish forces are intensifying. Specifically, the RSI is retreating further below its 50-neutral mark, while the stochastic oscillator is sloping downwards near its 20-oversold zone.
If the selling interest intensifies, the pair could descend towards the March bottom of 0.6083. A drop beneath that region could pave the way for the 2023 low of 0.5984. Even lower, the 0.5815 hurdle could provide downside protection.
On the flipside, should the correction cease and the price edge back higher, immediate resistance could be met at the recent rejection region of 0.6246. Conquering this barricade, the bulls might aim for 0.6304 ahead of the four-month peak of 0.6383. Further advances could then cease at the 2023 high of 0.6536.
Overall, NZDUSD has been experiencing a significant pullback in the short term, while its retreat below both the 50- and 200-day SMAs is further darkening the technical outlook. Nevertheless, the decline could accelerate and the pair could revisit its 2023 lows in the case that it crosses below its March bottom.
USDJPY Unlocks New 7-Month High
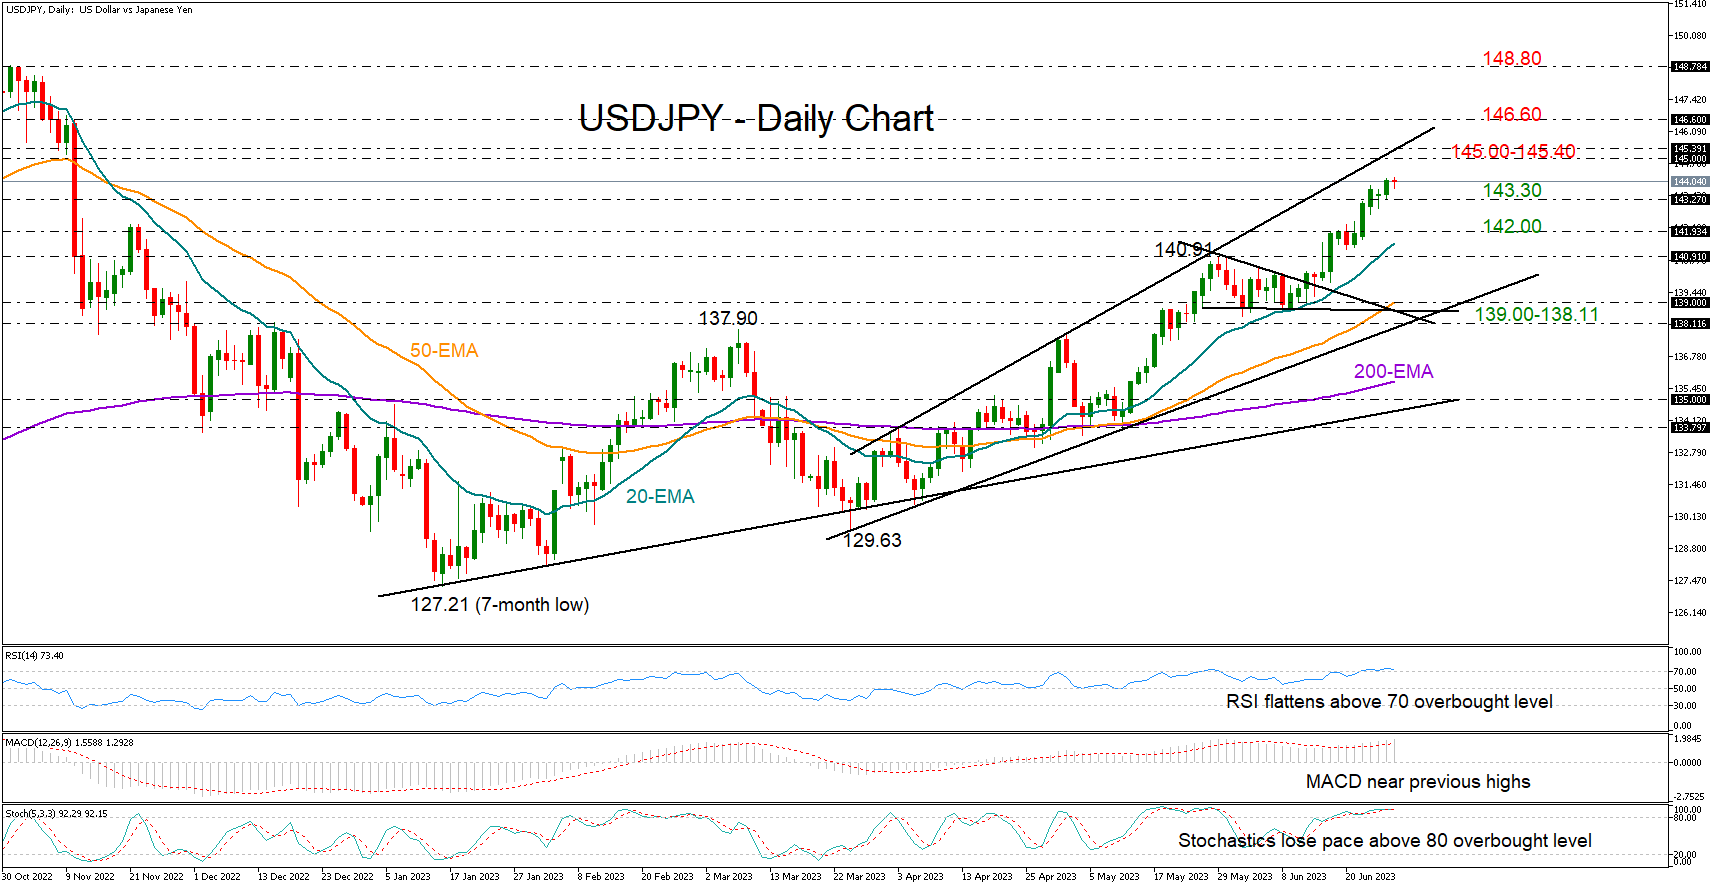
USDJPY continues to build its uptrend comfortably above its exponential moving averages (EMAs), closing on Tuesday near a fresh seven-month high of 144.16.
The next obstacle could be the 145.00-145.40 area, with the RSI and the stochastic oscillator suggesting that some congestion could emerge in this neighborhood as the price seems to be trading within overbought waters. Interestingly, the extension of the March resistance line is positioned in the same territory. Therefore, a decisive step higher is expected to boost buying confidence, likely lifting the price up to the 148.80 barrier, unless the 146.60 barricade blocks the way higher beforehand.
Alternatively, a downside reversal could initially retest the nearby support of 143.30 ahead of the 142.00 constraining zone, where the 20-day EMA is heading. Falling lower, the pair could stall around the previous high of 140.90, a break of which could cause an aggressive decline towards the 139.00-138.11 territory. The 50-day EMA and a couple of key trendlines, including the ascending trendline from March lows, are making this region important to watch.
In brief, USDJPY is strengthening its bullish structure, with the bulls expected to slow the pace in the short-term as the price is approaching a caution zone.
WTI Oil: Bears May Take a Breather for Consolidation after 2.2% Drop
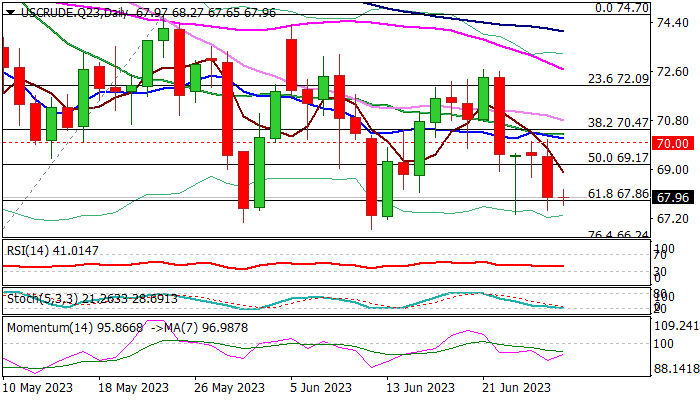
WTI oil edged higher in early Wednesday, following 2.2% drop on Tuesday, positively impacted by stronger than expected draw in US crude inventories (API report) but keeps bearish bias.
Oil prices fell on Tuesday on fresh hawkish signals from central banks, warning that policy tightening cycle is still far from the end.
The WTI contract is holding below $70 level for the fifth consecutive, which weighs on near-term action and adds to negative outlook.
Bears pressure last Friday’s spike low ($67.33) ahead of more significant base at $67.00/$66.80 zone, violation of which would open way for retest of 2023 low at $63.63 (May 4).
Daily chart signals further losses as 14-d momentum is holding in negative territory and moving averages are in full bearish configuration, however stochastic is about to enter oversold territory.
This could increase headwinds the price is facing at $67.96 Fibo support (61.8% of $63.63/$74.70) where attacks repeatedly failed on Fri/Tue).
Consolidation should be narrow and capped under broken Fibo level at $69.17 (50% of $63.63/$74.70) to keep bears in play and guard upper pivot at $70 (psychological / daily Tenkan-sen).
Res: 68.68; 69.17; 70.00; 70.75.
Sup: 67.33; 67.02; 66.80; 66.24.
EUR/USD Daily Outlook
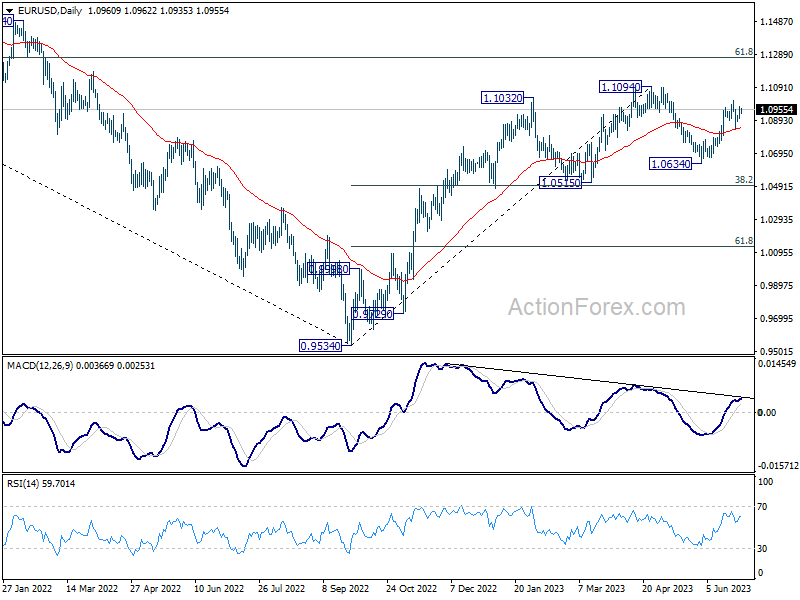
Daily Pivots: (S1) 1.0916; (P) 1.0947; (R1) 1.0991; More...
Intraday bias in EUR/USD remains neutral as it's still bounded in range below 1.1011. Strong support from 55 D EMA (now at 1.0838) retains near term bullishness. Break of 1.1011 will resume the rally from 1.0634 and target 1.1094 resistance. Decisive break there will resume larger up trend from 0.9534.
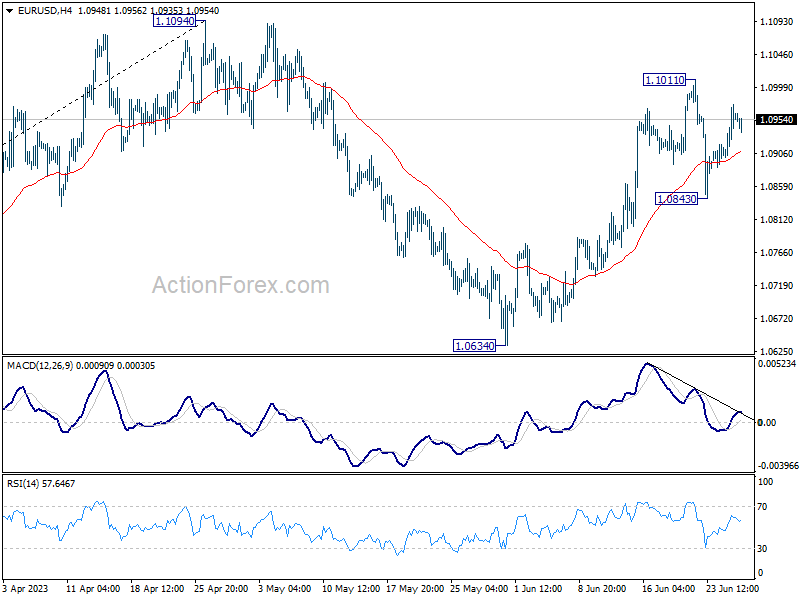
In the bigger picture, as long as 1.0515 support holds, rise from 0.9534 (2022 low) would still extend higher. Sustained break of 61.8% retracement of 1.2348 (2021 high) to 0.9534 at 1.1273 will solidify the case of bullish trend reversal and target 1.2348 resistance next (2021 high).
GBP/USD Daily Outlook
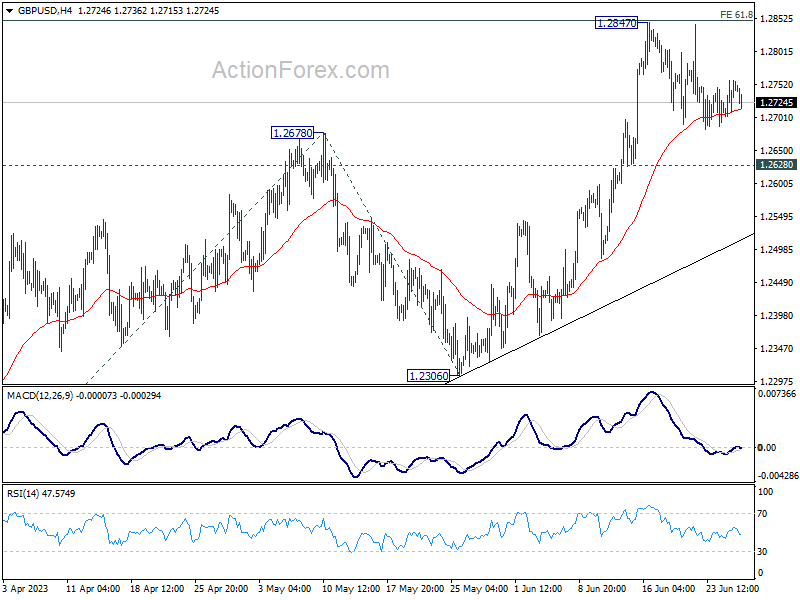
Daily Pivots: (S1) 1.2715; (P) 1.2738; (R1) 1.2771; More...
GBP/USD is still extending the consolidation from 1.2847 and intraday bias remains neutral for the moment. On the upside, firm break of 1.2847 will resume larger up trend and target 100% projection of 1.1801 to 1.2678 from 1.2306 at 1.3183 next. However, firm break of 1.2628 will turn bias to the downside, for deeper fall to 1.2306 support instead.
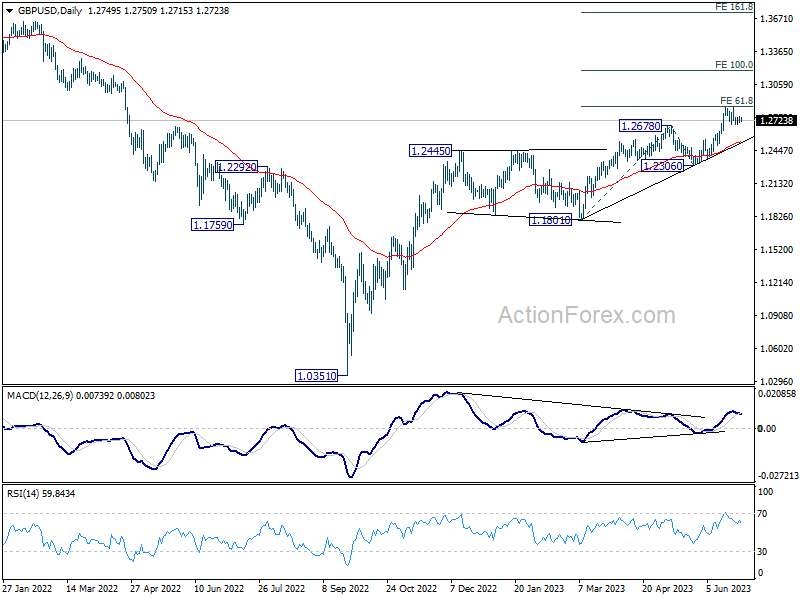
In the bigger picture, the strong support from 55 W EMA (now at 1.2341) is a medium term bullish sign. Outlook will stay bullish as long as 1.2306 support holds. Rise from 1.0351 medium term bottom (2022 low) is expected to extend further to retest 1.4248 key resistance (2021 high).
USD/JPY Daily Outlook
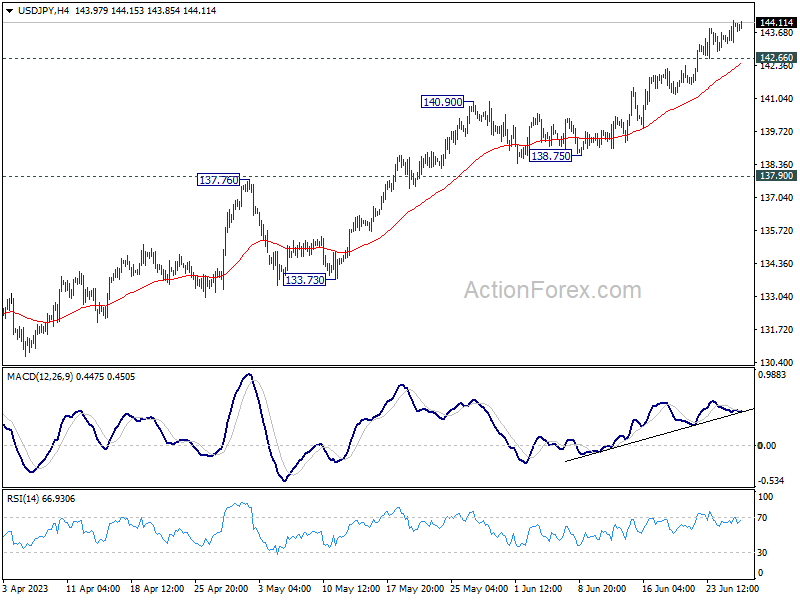
Daily Pivots: (S1) 143.52; (P) 143.84; (R1) 144.40; More...
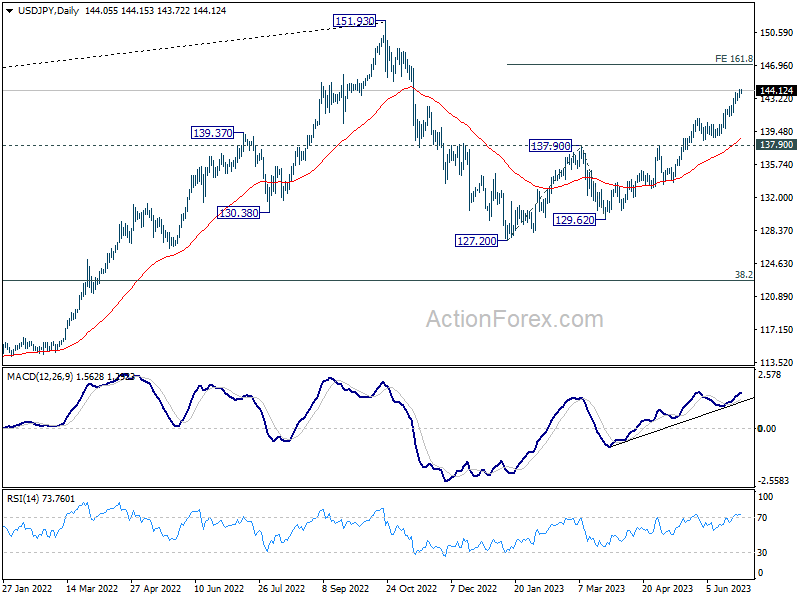
Intraday bias in USD/JPY stays on the upside for the moment. Current rally from 127.20 should target 161.8% projection of 127.20 to 137.90 from 129.62 at 146.93. On the downside, below 142.66 minor support will turn bias neutral again and bring lengthier consolidations first.
In the bigger picture, rise from 127.20 is currently seen as the second leg of the corrective pattern from 151.93 high. Further rally is expected as long as 137.90 resistance turned support holds, to retest 151.93. But strong resistance could be seen there to limit upside. Break of 137.90 will indicate the the third leg has started back towards 127.20.
USD/CAD Daily Outlook
Daily Pivots: (S1) 1.3142; (P) 1.3167; (R1) 1.3217; More....
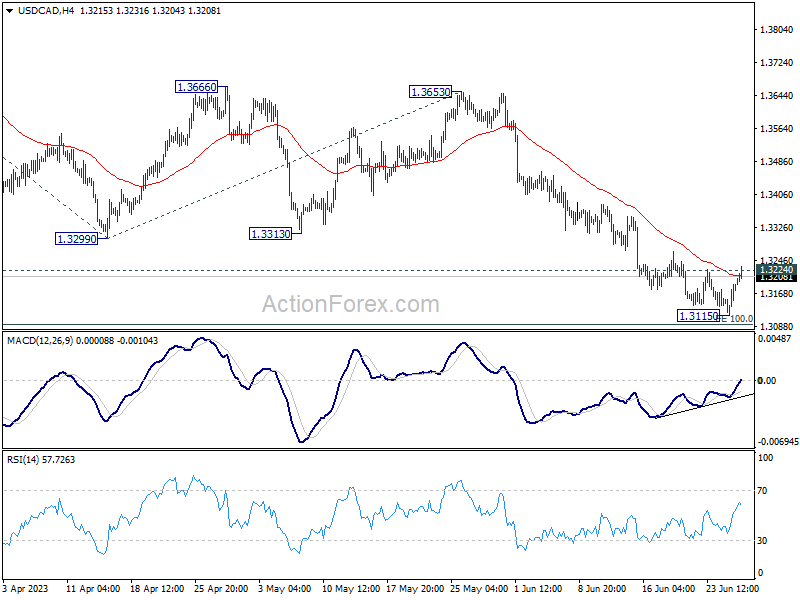
Immediate focus is now on 1.3224 resistance with current recovery. Firm break there should indicate short term bottoming at 1.3115, on bullish convergence condition in 4H MACD. Intraday bias will be back on the upside for stronger rebound for 1.3229 support turned resistance. On the downside, however, sustained break of 100% projection of 1.3860 to 1.3299 from 1.3653 at 1.3092 will extend larger decline to 161.8% projection at 1.2745.
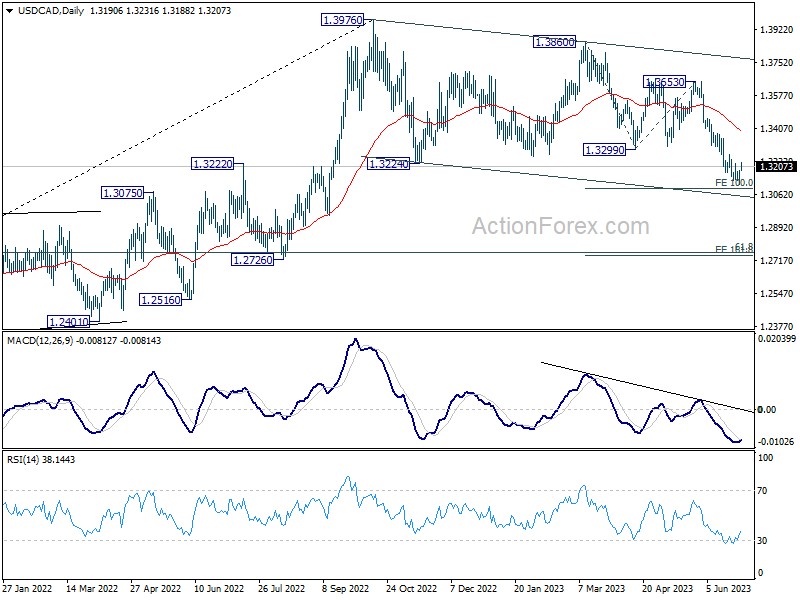
In the bigger picture, price actions from 1.3976 are still viewed as a correction to up trend from 1.2005 (2021 low), but chance of trend reversal is increasing with current decline. In either case, risk will stay on the downside as long as 1.3299 support turned resistance holds, even in case of strong rebound. Next target is 61.8% retracement of 1.2005 to 1.3976 at 1.2758.
EUR/USD Resumes And USD/JPY Could Extend Rally
EUR/USD started a fresh increase above the 1.0890 resistance. USD/JPY is consolidating gains and might rally further above 144.20.
Important Takeaways for EUR/USD and USD/JPY Analysis Today
- The Euro is rising and trading well above the 1.0925 resistance zone.
- There is a key bullish trend line forming with support near 1.0940 on the hourly chart of EUR/USD at FXOpen.
- USD/JPY is trading in a positive zone above the 143.40 and 143.70 levels.
- There is a major bullish trend line forming with support near 143.70 on the hourly chart at FXOpen.
EUR/USD Technical Analysis
On the hourly chart of EUR/USD at FXOpen, the pair started a fresh increase from the 1.0845 zone. The Euro climbed above the 1.0890 resistance zone against the US Dollar.
The pair even settled above the 1.0925 resistance and the 50-hour simple moving average. There was an upside break above the 50% Fib retracement level of the last key decline from the 1.1012 swing high to the 1.0844 low.
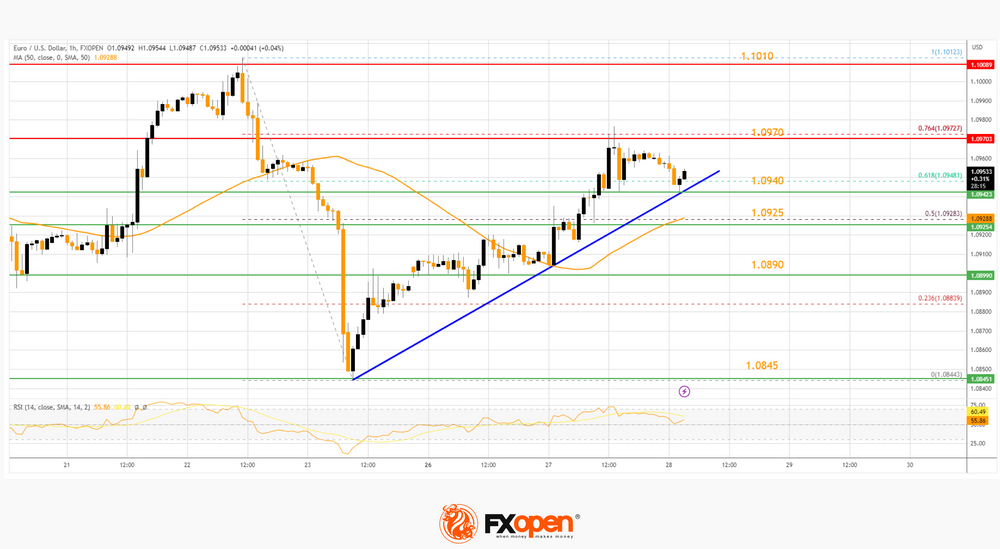
Finally, the bears appeared near the 76.4% Fib retracement level of the last key decline from the 1.1012 swing high to the 1.0844 low at 1.0970.
The pair is now consolidating gains below the 1.0970 resistance. The first major support is near a key bullish trend line at 1.0940.
The next key support is near the 50-hour simple moving average at 1.0925. If there is a downside break below 1.0925, the pair could drop toward the 1.0910 support. The main support on the EUR/USD chart is near 1.0890, below which the pair could start a major decline.
On the upside, the pair is now facing resistance near 1.0970. The next major resistance is near the 1.1010 level. An upside break above 1.1010 could set the pace for another increase. In the stated case, the pair might rise toward 1.1065.
USD/JPY Technical Analysis
On the hourly chart of USD/JPY at FXOpen, the pair started a strong increase from the 141.20 zone. It gained bullish momentum and was able to clear the 142.90 resistance.
The pair even climbed above the 50-hour simple moving average and 143.70. It traded to a new multi-week high at 144.17 and is currently consolidating gains. It is trading near the 23.6% Fib retracement level of the upward move from the 142.93 swing low to the 144.17 high.
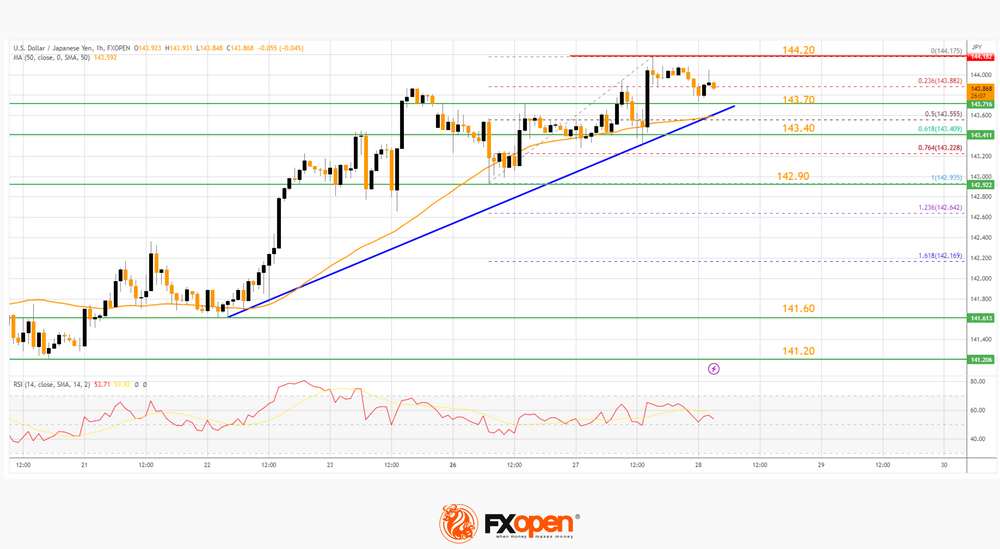
The first major support on the USD/JPY chart is near a major bullish trend line at 143.70. The next major support is near the 61.8% Fib retracement level of the upward move from the 142.93 swing low to the 144.17 high at 143.40.
If there is a close below 143.40, the pair could decline steadily. In the stated case, the pair might drop toward the 142.90 support.
On the upside, the pair is facing resistance near the 144.20 level. The first major resistance is near the 144.50 level. If there is a close above the 144.50 level and RSI moves above 60, the pair could rise toward 145.40. The next major resistance is near 146.20, above which the pair could test 148.00 in the coming days.