Sample Category Title
AUD/USD Daily Report
Daily Pivots: (S1) 0.6663; (P) 0.6692; (R1) 0.6716; More...
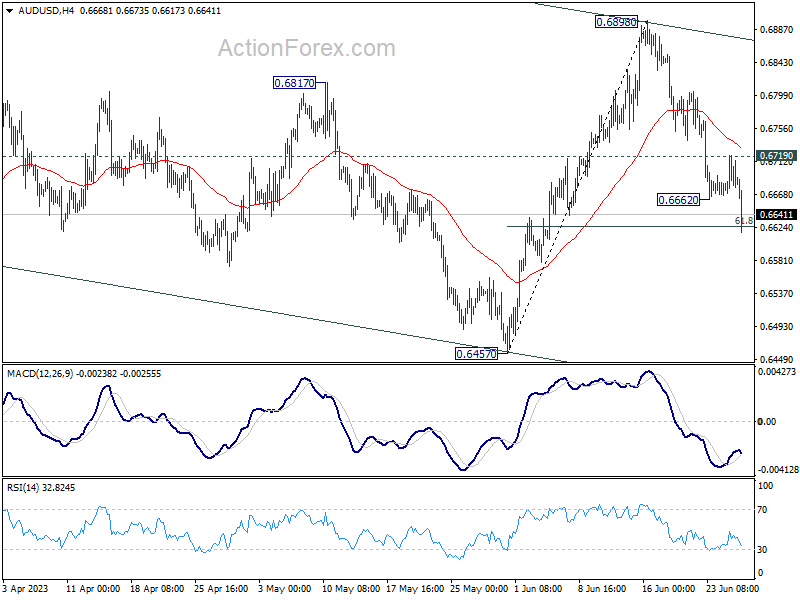
AUD/USD's fall from 0.6898 resumed after brief recovery and intraday bias is back on the downside. Sustained break of 61.8% retracement of 0.6457 to 0.6898 at 0.6625 will path the way back to 0.6457 key support level. On the upside, above 0.6719 resistance will turn intraday bias neutral again first.
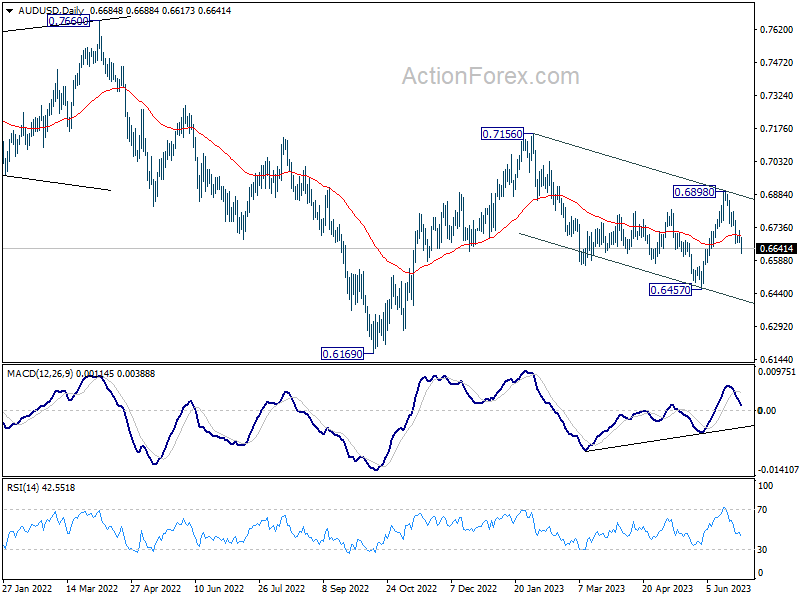
In the bigger picture, outlook is mixed up by the deeper the expected pull back from 0.6898. Still, price actions from 0.7156 are seen as a correction to rebound from 0.6169. Break of 0.6457 will resume the fall towards 0.6169 low. On the upside, though, break of 0.6898 resistance will argue that rise from 0.6169 is ready to resume through 0.7156.
Aussie Tumbles on CPI Data, Markets Eye Comments from Central Bankers
Australian Dollar is experiencing a wild ride this week, tumbling in Asian trading hours due to lower-than-anticipated CPI results. The "encouraging" data has raised speculation about a potential pause in RBA's tightening plans next week. There are also talks that the hike month was the last in the cycle. This decline is also dragging down New Zealand Dollar, which is following suit as one of today's weakest performers.
Japanese Yen, meanwhile, is attempting to recover from its losses, but with limited success. Market chatter suggests that the Japanese government is likely to resort to verbal intervention tactics until 150 level against Dollar is under serious threat, reserving actual market intervention as a last resort. Dollar is faring marginally better, gaining some ground, albeit without much enthusiasm when matched up against European currencies.
Today's economic data release schedule remains light, shifting investor attention towards the upcoming remarks from top officials of Fed, ECB, BoJ and BoE at the ECB Forum, in Sintra, Portugal
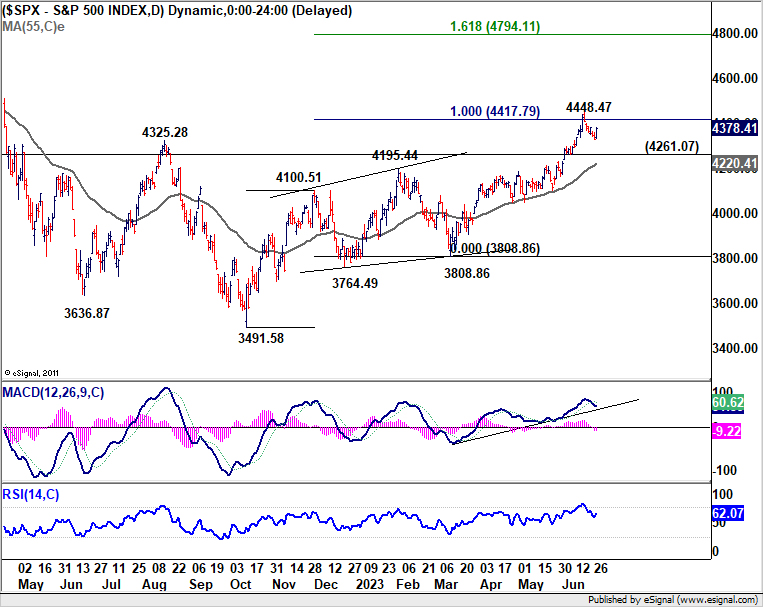
Technically, some attention should be paid on developments in the US stock markets for the rest of the week. Yesterday's strong bounce in S&P 500 affirms the case that fall from 4448.47 is merely a near term pull back. Up trend from 3491.58 is not being threatened with 4261.07 support safe by a big margin. Further rise in S&P 500 will put 4448.47 short term top in focus in the early part of next week, for reacting the heavy weight US data like NFP.
In Asia, at the time of writing, Nikkei is up 1.60%. Hong Kong HSI is down -0.13%. China Shanghai SSE is down -0.52%. Singapore Strait Times is up 0.14%. Japan 10-year JGB yield is up 0.0118 at 0.393. Overnight, DOW rose 0.63%. S&P 500 rose 1.15$. NASDAQ rose 1.65%. 10-year yield rose 0.049 to 3.768.
Australia CPI slowed to 5.6% yoy in May, lowest in more than a year
Australia monthly CPI slowed notably from 6.8% yoy to 5.6% yoy in May, below expectation of 6.1% yoy. That's also the lowest reading in more than a year since April 2022. Excluding volatile items and travel, CPI also ticked down from 6.5% yoy to 6.4% yoy.
The most significant contributors to the annual increase in the monthly CPI indicator in May were Housing (+8.4 per cent), Food and non-alcoholic beverages (+7.9 per cent), and Furniture, household equipment and services (+6.0 per cent). Partly offsetting the rise was a fall in Automotive fuel (-8.0 per cent).
AUD/CAD's fall taking off after CPI from AU and CA
Australian Dollar falls broadly after data showed that CPI slowed much more than expected in May. Some economists are now seeing consumer inflation, at 5.6% and around the very lower end of forecasts, being soft enough to give confidence for RBA to pause again next week. On the other hand, without any downside surprise from Canadian CPI released overnight, BoC is more likely to continue tightening next month than not.
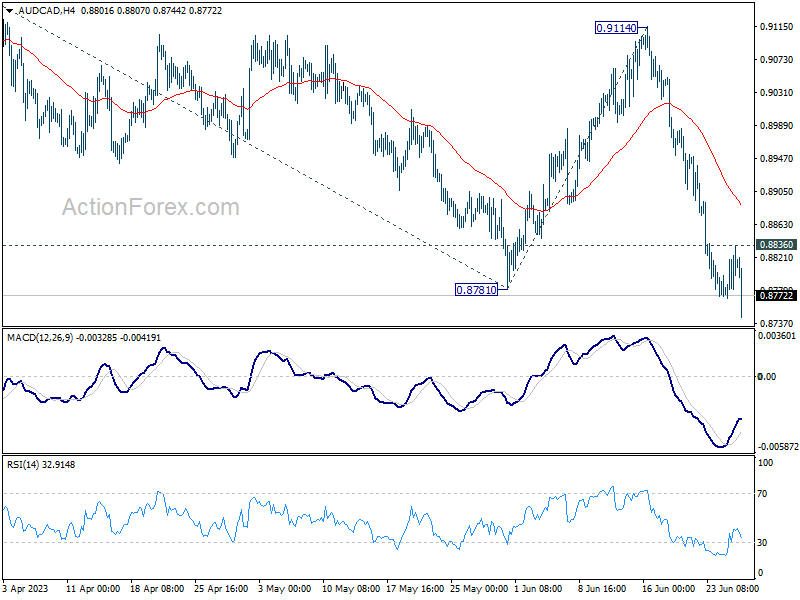
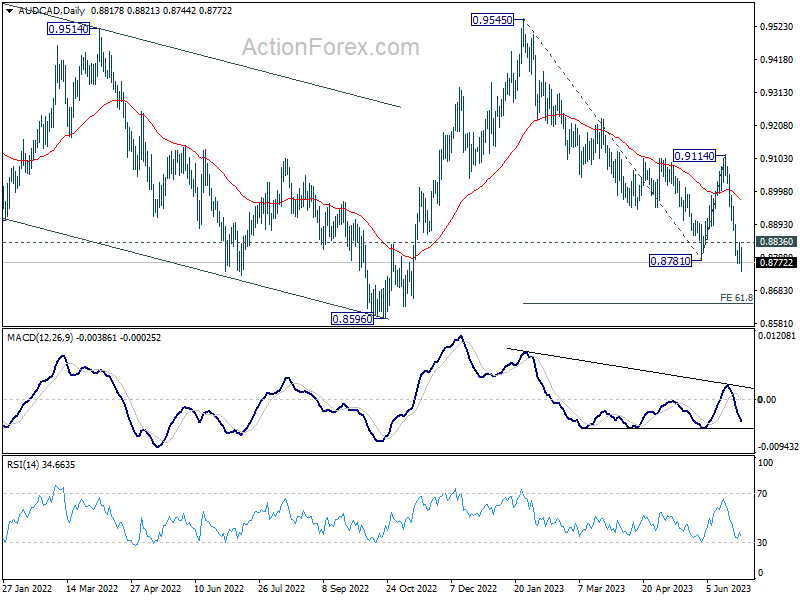
AUD/CAD's decline could finally be taking off with today's selloff. Technically, further fall is expected as long as 0.8836 minor resistance holds. The whole fall from 0.9545 should target 61.8% projection of 0.9545 to 0.8781 from 0.9114 at 0.8642, or further to 0.8596 (2022 low). Nevertheless, break of 0.8836 will argue that the sentiment could have flipped again and mix up the outlook.
Looking ahead
Germany Gfk consumer sentiment, Swiss Credit Suisse economic expectations and Eurozone M3 will be released in European session. US will release goods trade balance later in the day.
AUD/USD Daily Report
Daily Pivots: (S1) 0.6663; (P) 0.6692; (R1) 0.6716; More...
AUD/USD's fall from 0.6898 resumed after brief recovery and intraday bias is back on the downside. Sustained break of 61.8% retracement of 0.6457 to 0.6898 at 0.6625 will path the way back to 0.6457 key support level. On the upside, above 0.6719 resistance will turn intraday bias neutral again first.
In the bigger picture, outlook is mixed up by the deeper the expected pull back from 0.6898. Still, price actions from 0.7156 are seen as a correction to rebound from 0.6169. Break of 0.6457 will resume the fall towards 0.6169 low. On the upside, though, break of 0.6898 resistance will argue that rise from 0.6169 is ready to resume through 0.7156.
Economic Indicators Update
| GMT | Ccy | Events | Actual | Forecast | Previous | Revised |
|---|---|---|---|---|---|---|
| 01:30 | AUD | Monthly CPI Y/Y May | 5.60% | 6.10% | 6.80% | |
| 06:00 | EUR | Germany Gfk Consumer Confidence (Jul) | -23 | -24.2 | ||
| 08:00 | CHF | Credit Suisse Economic Expectations Jun | -32.2 | |||
| 08:00 | EUR | Eurozone M3 Money Supply Y/Y May | 1.50% | 1.90% | ||
| 12:30 | USD | Goods Trade Balance (USD) May P | -92.3B | -96.8B | ||
| 12:30 | USD | Wholesale Inventories May P | 0.10% | -0.10% | ||
| 14:30 | USD | Crude Oil Inventories | -1.4M | -3.8M |
S&P 500 Futures (ES) Looking to Extend Rally Higher
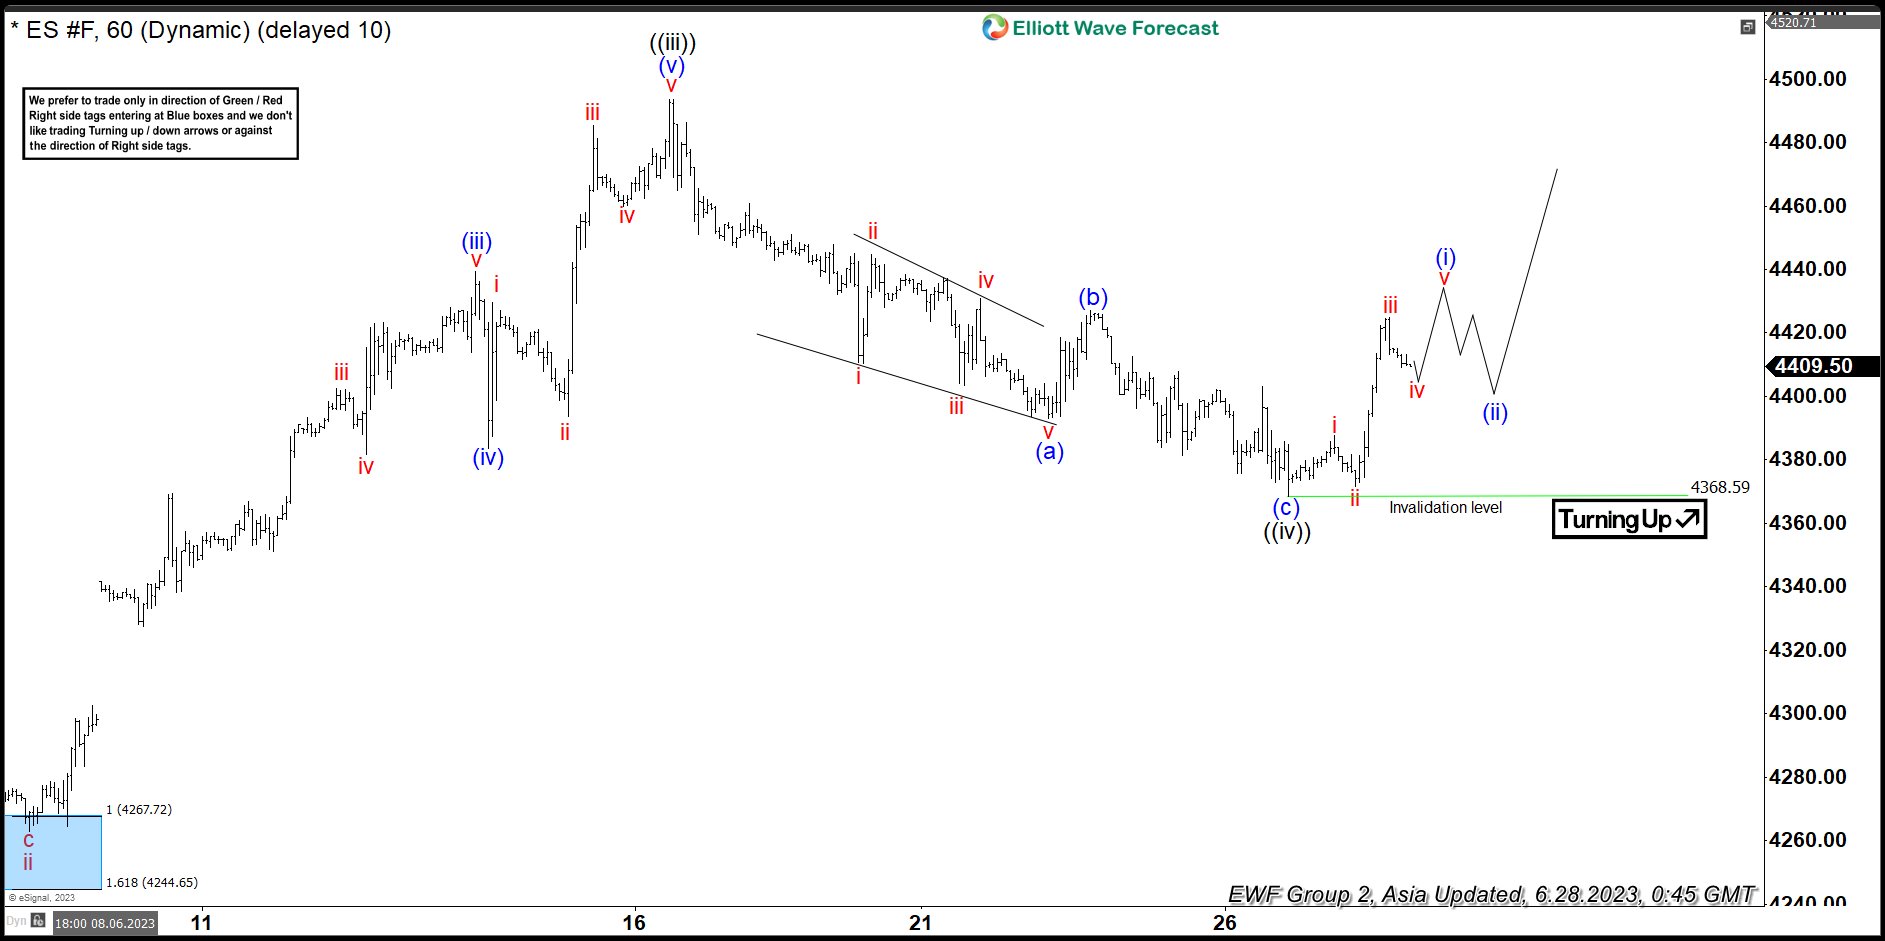
Short term Elliott Wave View in E-mini S&P 500 Futures (ES) suggests the rally from 3.13.2023 low is in progress as a 5 waves impulse Elliott Wave structure. Up from 3.13 low, wave ((i)) ended at 4206.25 and dips in wave ((ii)) ended at 4062.25. The Index extends higher in wave ((iii)) towards 4493.75. Pullback in wave ((iv)) completed at 4368.59 with internal subdivision as a zigzag structure.
Down from wave ((iii)), wave i ended at 4410.5 and wave ii ended at 4444.75. Index then resumes lower in wave iii towards 4403.5, and rally in wave iv ended at 4430.75. The last leg lower wave v ended at 4393 which completed wave (a). Index then rally in wave (b) towards 4427 and wave (c) lower ended at 4368.59 which completed wave ((iv)) in higher degree. Index has turned higher in wave ((v)). Up from wave ((iv)), wave i ended at 4387.75 and pullback in wave ii ended at 4371.50. Index then resumes higher in wave iii towards 4424.75 and dips in wave iv ended at 4407. Near term, as far as pivot at 4368.59 low stays intact, expect Index to extend higher.
S&P 500 Futures (ES) 1 Hour Elliott Wave Chart
ES_F Elliott Wave Video
https://www.youtube.com/watch?v=gE9Mfu7WCKI
AUD/CAD’s fall taking off after CPI from AU and CA
Australian Dollar falls broadly after data showed that CPI slowed much more than expected in May. Some economists are now seeing consumer inflation, at 5.6% and around the very lower end of forecasts, being soft enough to give confidence for RBA to pause again next week. On the other hand, without any downside surprise from Canadian CPI released overnight, BoC is more likely to continue tightening next month than not.
AUD/CAD's decline could finally be taking off with today's selloff. Technically, further fall is expected as long as 0.8836 minor resistance holds. The whole fall from 0.9545 should target 61.8% projection of 0.9545 to 0.8781 from 0.9114 at 0.8642, or further to 0.8596 (2022 low). Nevertheless, break of 0.8836 will argue that the sentiment could have flipped again and mix up the outlook.
Australia CPI slowed to 5.6% yoy in May, lowest in more than a year
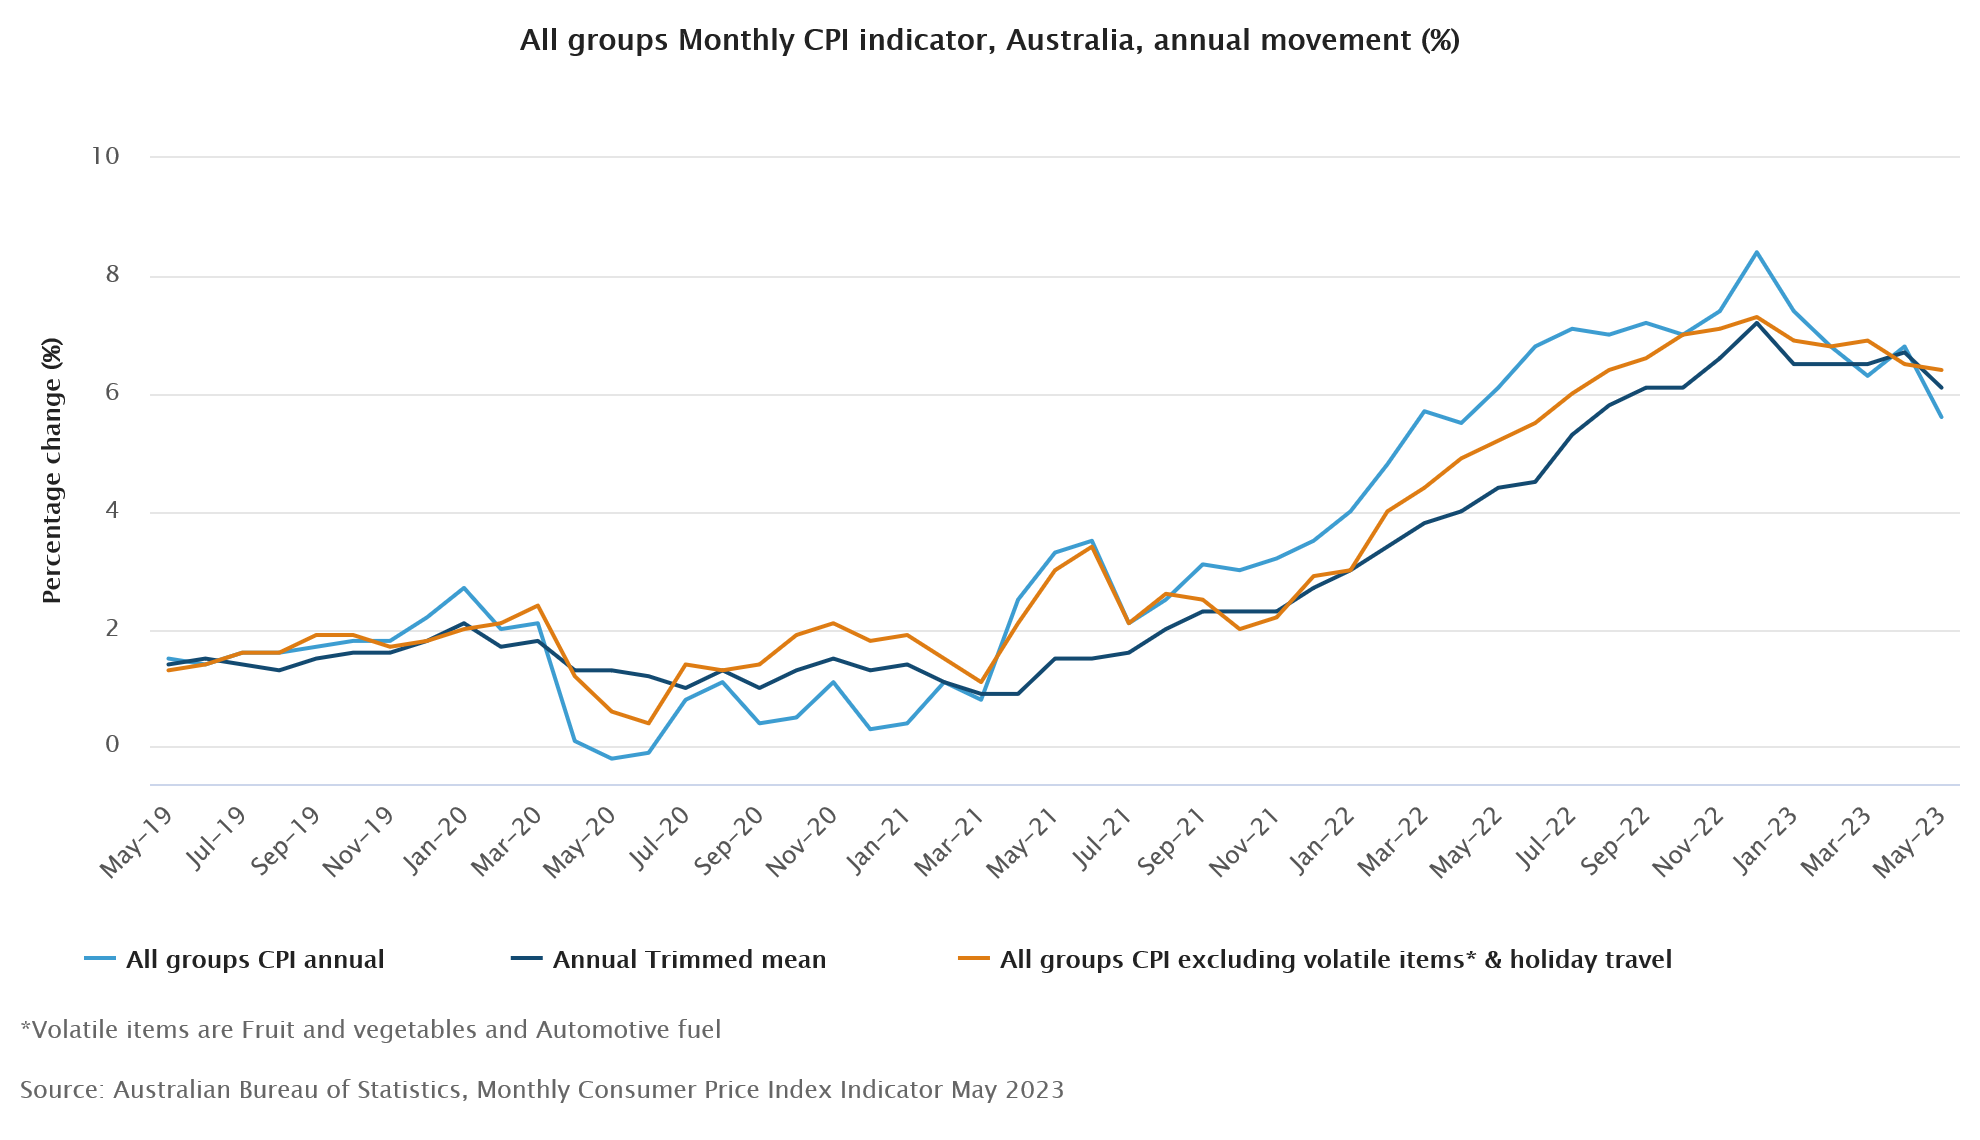
Australia monthly CPI slowed notably from 6.8% yoy to 5.6% yoy in May, below expectation of 6.1% yoy. That's also the lowest reading in more than a year since April 2022. Excluding volatile items and travel, CPI also ticked down from 6.5% yoy to 6.4% yoy.
The most significant contributors to the annual increase in the monthly CPI indicator in May were Housing (+8.4 per cent), Food and non-alcoholic beverages (+7.9 per cent), and Furniture, household equipment and services (+6.0 per cent). Partly offsetting the rise was a fall in Automotive fuel (-8.0 per cent).
Gold Price Could Extend Losses Below $1,900
Key Highlights
- Gold price is struggling to clear the $1,935 resistance.
- A major bearish trend line is forming with resistance near $1,928 on the 4-hour chart.
- EUR/USD is aiming for a fresh high above 1.1010.
- GBP/USD could gain pace if it clears the 1.2800 resistance.
Gold Price Technical Analysis
Gold price remained in a bearish zone below the $1,980 level against the US Dollar. The price traded below the $1,950 support to move into a short-term bearish zone.
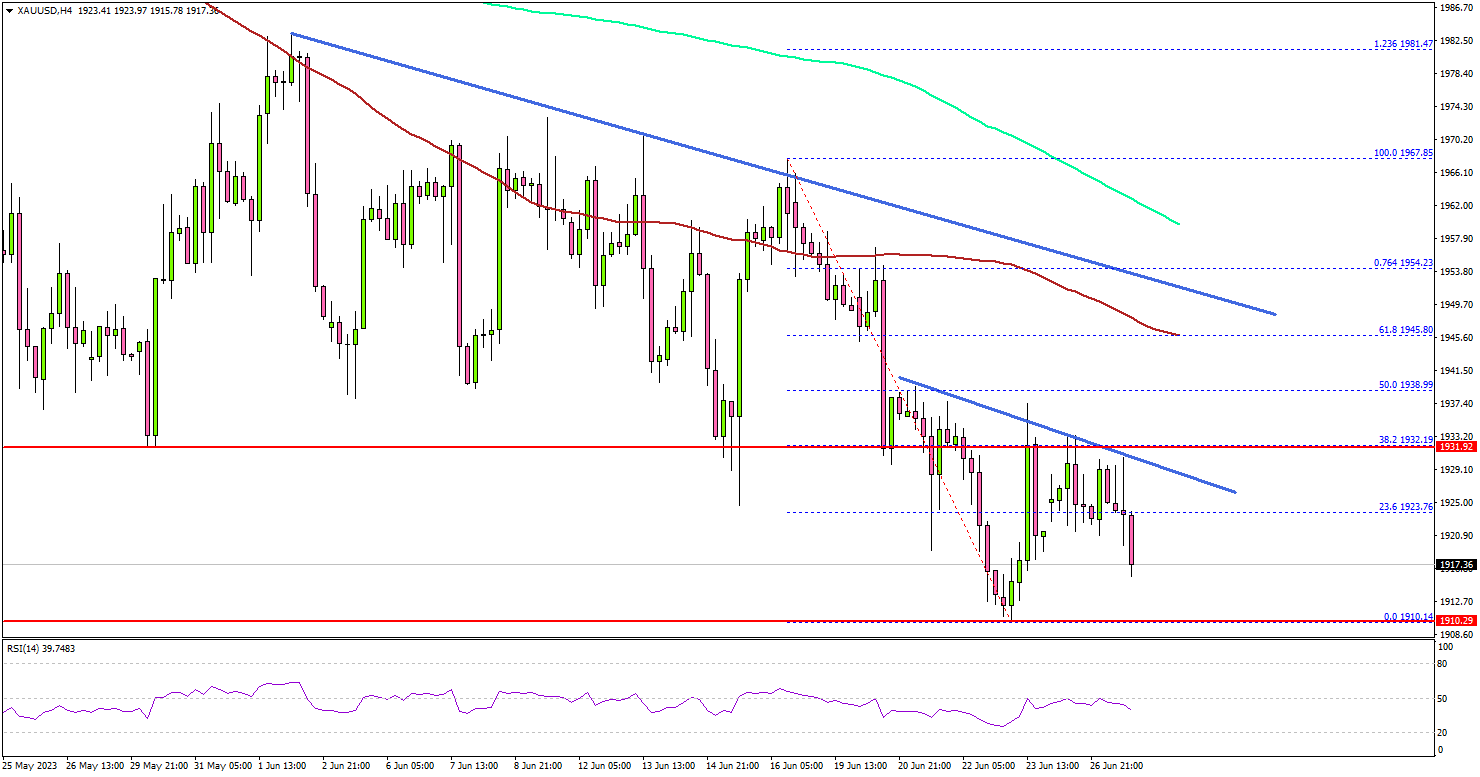
The 4-hour chart of XAU/USD indicates that the price settled below the $1,950 support, the 200 Simple Moving Average (green, 4 hours), and the 100 Simple Moving Average (red, 4 hours).
There was also a close below the $1,935 pivot level. The recent low was formed near $1,910 before there was a decent increase. The price struggled to recover above the $1,932 and $1,935 resistance levels.
There is also a major bearish trend line forming with resistance near $1,928 on the same chart. The next major resistance is near the $1,935 level, above which the price could rise toward $1,945 or the 100 Simple Moving Average (red, 4 hours).
Any more gains might send the price toward the $1,960 resistance level. Initial support is near the $1,910 level. The next major support is near $1,900.
If the bulls fail to protect the $1,900 support, there is a risk of a major decline. In the stated case, the price could decline toward the $1,860 level.
Looking at EUR/USD, the pair is showing positive signs above 1.0880 and might aim for a fresh high above the 1.1010 level.
Economic Releases to Watch Today
- Federal Reserve Chair Jerome Powell Speech.
Technicals and Triggers – USD/JPY
USDJPY
Yen sellers remain in control as traders become skeptical that Japan officials follow through on intervention threats. The yen has steadily weakened this quarter on US economic resilience and as the BOJ vowed to keep rates low for now along with a weak signal for a chance of future hike.
Dollar Technicals
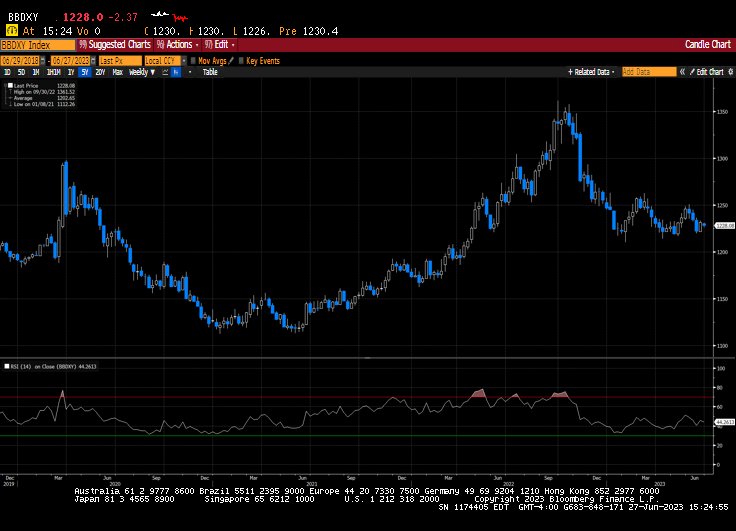
The dollar index could be flashing an oversold signal and that could lead to further bets against the yen and not necessarily with European currencies that might see much more tightening.
Potential Trigger
- On Wednesday, starting around 930am est, BOJ Governor Ueda will speak on an ECB forum panel with BOE Gov Bailey, ECB President Lagarde, and Fed Chair Powell. Yen watchers are awaiting any sign that BOJ is getting ready to tweak its control of the yield curve.
- Quarter-end could also spark a reversal for the steadily weakening yen (132 to 144).
- Traders will also pay close attention to Friday’s US PCE data as softer inflation data could cement the market’s expectation that the Fed will be done after one more hike.
Key Levels
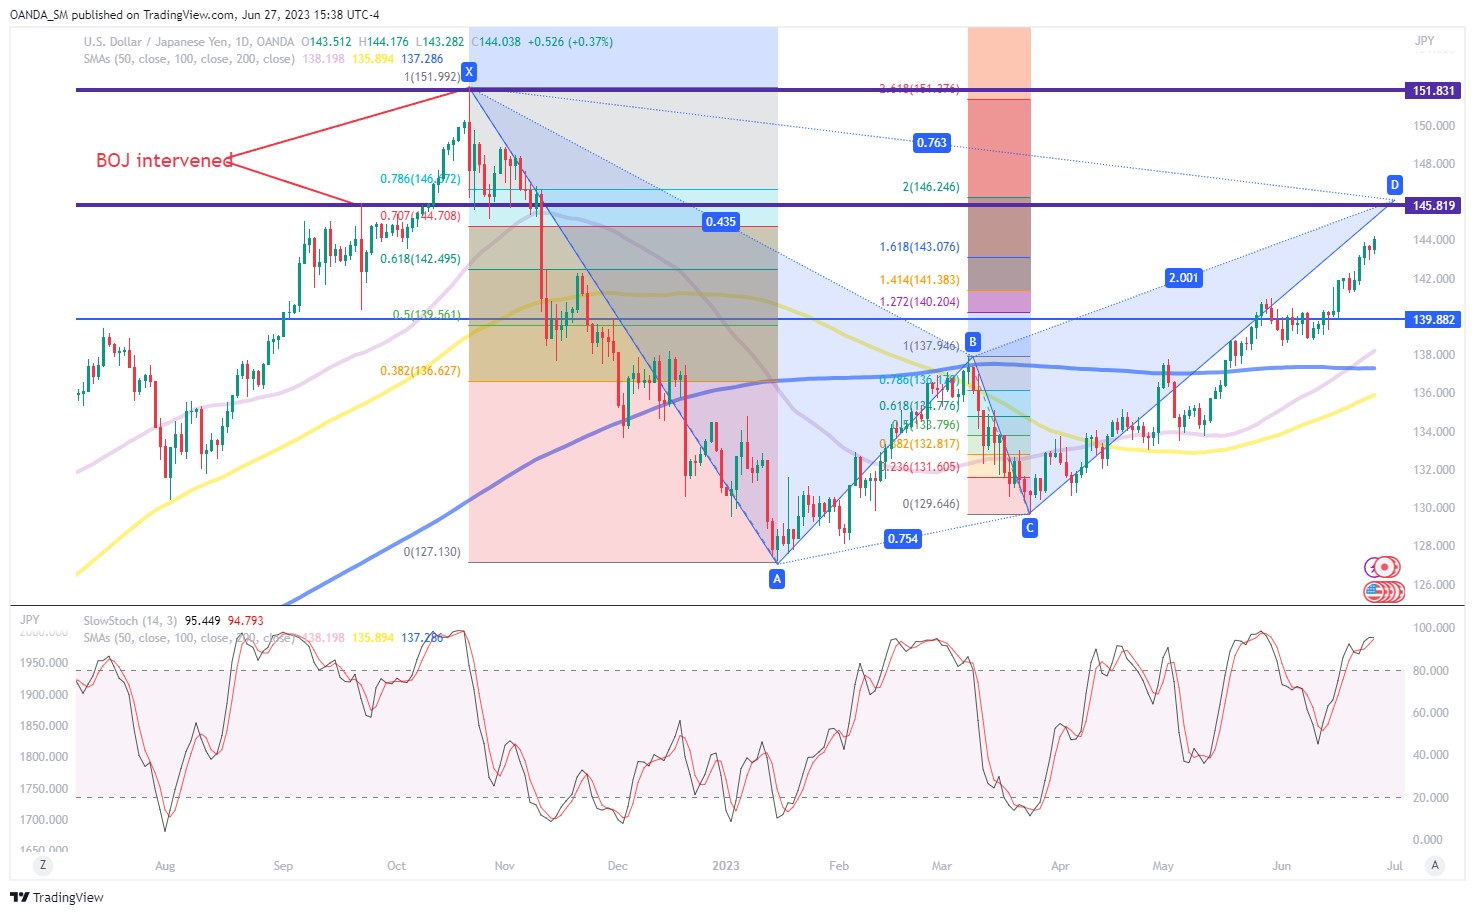
Intraday moves have supported a steadily weakening yen, but it may have a neutral bias until we hear from BOJ Gov Ueda on Wednesday morning. Upside resistance may come from 144.70, which is the 70.7% Fibonacci retracement of the October high to January low move. If a daily close occurs above the 145 level, further bullish momentum could target 146.11. To the downside, 143.10 provides initial support. Any hawkish fireworks from Ueda could support the case for a test of the 142.50 region.
If Ueda stays the course, the yen could continue to weaken. Japan intervened last fall when the yen weakened towards 145 and after prices breached 150. Sustained weakness won’t be tolerated and expectations for action will grow if yen weakens beyond 145. Everyone has their eye on the 150 level, so it will be interesting to see if that makes that barrier to hard to reach.
Yen Hopes for FX Intervention
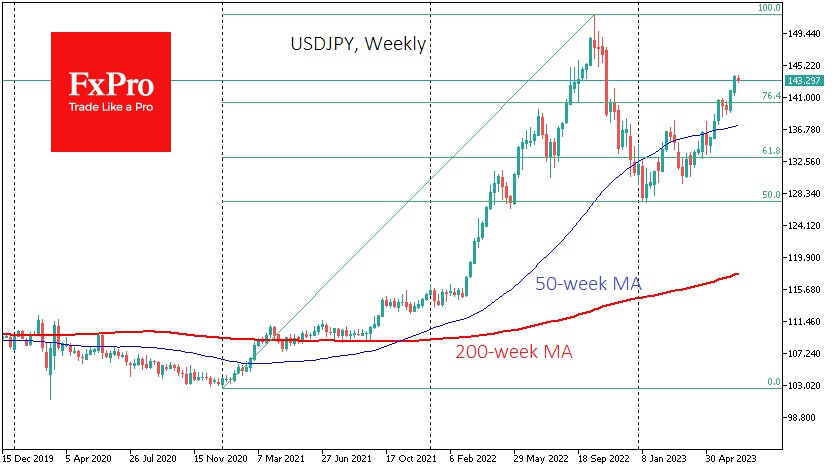
The Yen has been under pressure, losing 3.5% against the Dollar and over 5.6% against the Euro since the beginning of the month. The EURJPY has risen to its highest level since September 2008. The USDJPY is trading above 143.50, where the intervention took it in October and November last year, and close to the 1998 turning point.
The yen’s sharp weakness and proximity to historical highs have traders pricing in the likelihood that the central bank will intervene at the behest of the Ministry of Finance to strengthen the exchange rate. However, the nominal exchange rate means little to the government and the central bank, so the focus is on economic indicators.
The most important of these is the Bank of Japan’s core CPI. Here we see an acceleration to 3.1% y/y from 3.0% the previous month and a low of 2.7% in February. Although the rate of price increases in Japan is significantly lower than in the US and Europe, there are no signs of a peak.
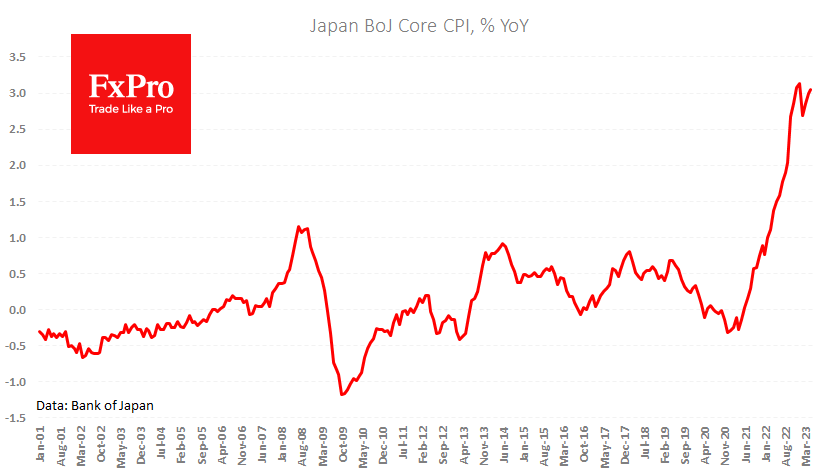
For the economy, this means that inflation expectations are becoming more firmly anchored. On the one hand, higher inflation is in line with central bank targets of previous decades. Hence the relative apathy of the BoJ, which has yet to take the slightest step to tighten policy in the fight against rising prices.
There is a belief that exchange rate depreciation improves export competitiveness. However, this rule only really applies when it is certain that the exchange rate will stay the same.
Therefore, the case for intervention to support the yen is growing, but it isn’t easy to foresee when it will occur. It could be the current USDJPY level of 143, where the pair has been stuck for a third day, or the 150 area, where the USD climbed in October 2022.
EURJPY Wave Analysis
- EURJPY under bullish pressure
- Likely to rise to resistance level 160.00
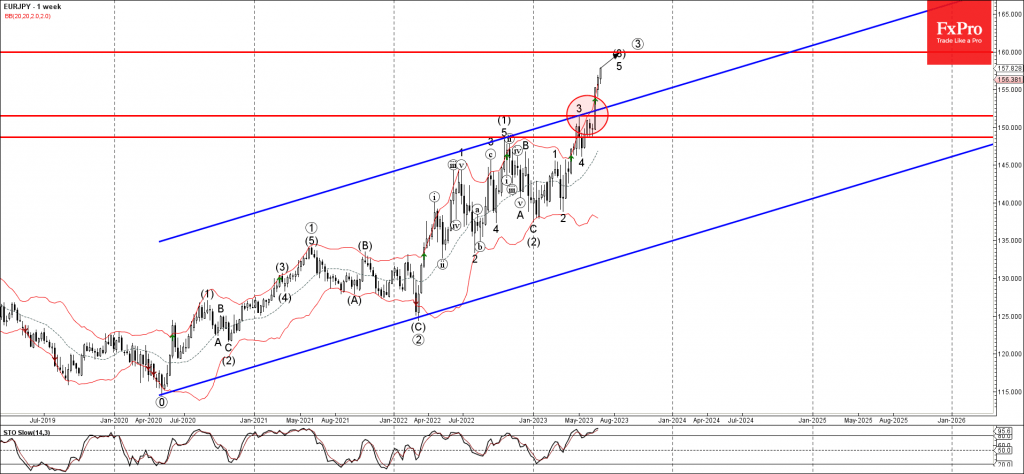
EURJPY under the bullish pressure after the price broke the resistance level 151.50 (which stopped the previous weekly impulse wave 3 in April).
The breakout of the resistance level 151.50 coincided with the breakout of the weekly up channel from 2020, which accelerated the active intermediate impulse wave (3).
Given the clear weekly uptrend, EURJPY can be expected to rise further toward the next resistance level 160.00, forecast price for the completion of the active impulse wave (3).
S&P 500 index Wave Analysis
- S&P 500 reversed from support level 4330.0
- Likely to rise to resistance level 4450.00
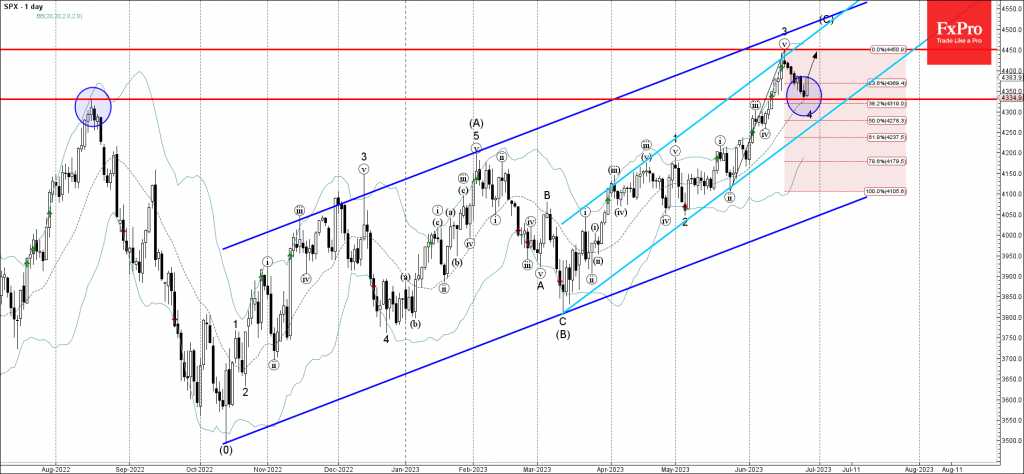
S&P 500 index recently reversed up from the key support level 4330.0 (former multi-month high from August of 2022, acting as the support after it was broken at the start of June) standing near the 38.2% Fibonacci correction of the upward impose from May.
The upward reversal from the support level 4330.00 stopped the previous short-term corrective wave 4.
Given the prevailing uptrend, S&P 500 index can be expected to rise further toward the next resistance level 4450.00 (top of the previous impulse wave 3).