Sample Category Title
USD/JPY Daily Outlook
Daily Pivots: (S1) 143.52; (P) 143.84; (R1) 144.40; More...
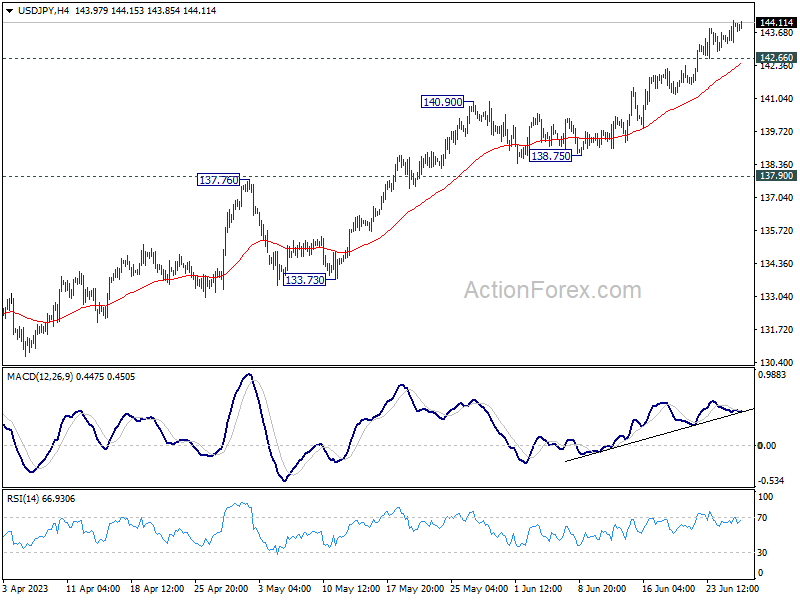
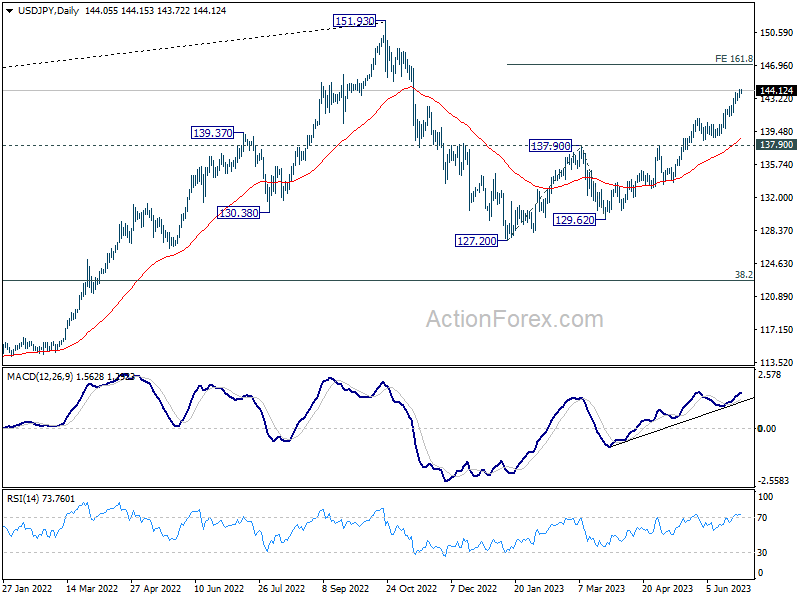
Intraday bias in USD/JPY stays on the upside for the moment. Current rally from 127.20 should target 161.8% projection of 127.20 to 137.90 from 129.62 at 146.93. On the downside, below 142.66 minor support will turn bias neutral again and bring lengthier consolidations first.
In the bigger picture, rise from 127.20 is currently seen as the second leg of the corrective pattern from 151.93 high. Further rally is expected as long as 137.90 resistance turned support holds, to retest 151.93. But strong resistance could be seen there to limit upside. Break of 137.90 will indicate the the third leg has started back towards 127.20.
USD/CAD Daily Outlook
Daily Pivots: (S1) 1.3142; (P) 1.3167; (R1) 1.3217; More....
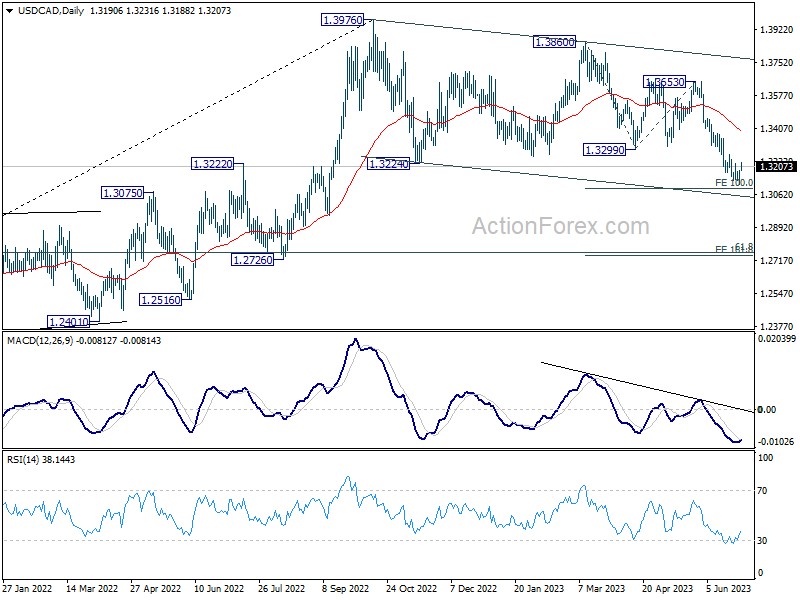
Immediate focus is now on 1.3224 resistance with current recovery. Firm break there should indicate short term bottoming at 1.3115, on bullish convergence condition in 4H MACD. Intraday bias will be back on the upside for stronger rebound for 1.3229 support turned resistance. On the downside, however, sustained break of 100% projection of 1.3860 to 1.3299 from 1.3653 at 1.3092 will extend larger decline to 161.8% projection at 1.2745.
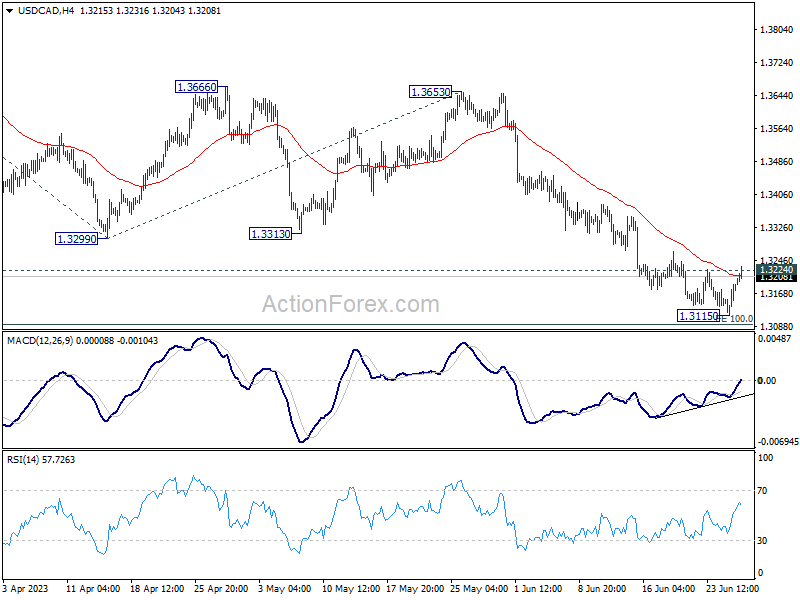
In the bigger picture, price actions from 1.3976 are still viewed as a correction to up trend from 1.2005 (2021 low), but chance of trend reversal is increasing with current decline. In either case, risk will stay on the downside as long as 1.3299 support turned resistance holds, even in case of strong rebound. Next target is 61.8% retracement of 1.2005 to 1.3976 at 1.2758.
EUR/USD Resumes And USD/JPY Could Extend Rally
EUR/USD started a fresh increase above the 1.0890 resistance. USD/JPY is consolidating gains and might rally further above 144.20.
Important Takeaways for EUR/USD and USD/JPY Analysis Today
- The Euro is rising and trading well above the 1.0925 resistance zone.
- There is a key bullish trend line forming with support near 1.0940 on the hourly chart of EUR/USD at FXOpen.
- USD/JPY is trading in a positive zone above the 143.40 and 143.70 levels.
- There is a major bullish trend line forming with support near 143.70 on the hourly chart at FXOpen.
EUR/USD Technical Analysis
On the hourly chart of EUR/USD at FXOpen, the pair started a fresh increase from the 1.0845 zone. The Euro climbed above the 1.0890 resistance zone against the US Dollar.
The pair even settled above the 1.0925 resistance and the 50-hour simple moving average. There was an upside break above the 50% Fib retracement level of the last key decline from the 1.1012 swing high to the 1.0844 low.
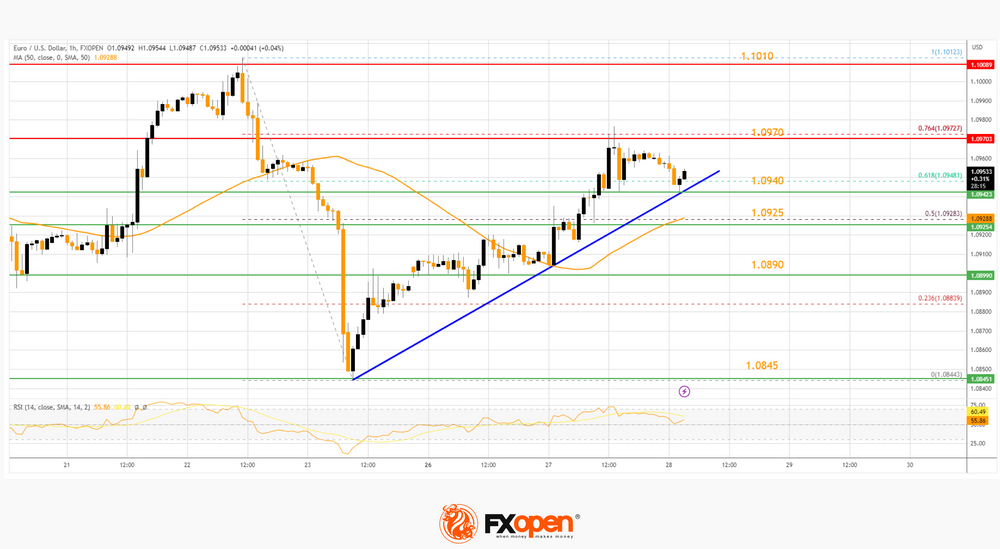
Finally, the bears appeared near the 76.4% Fib retracement level of the last key decline from the 1.1012 swing high to the 1.0844 low at 1.0970.
The pair is now consolidating gains below the 1.0970 resistance. The first major support is near a key bullish trend line at 1.0940.
The next key support is near the 50-hour simple moving average at 1.0925. If there is a downside break below 1.0925, the pair could drop toward the 1.0910 support. The main support on the EUR/USD chart is near 1.0890, below which the pair could start a major decline.
On the upside, the pair is now facing resistance near 1.0970. The next major resistance is near the 1.1010 level. An upside break above 1.1010 could set the pace for another increase. In the stated case, the pair might rise toward 1.1065.
USD/JPY Technical Analysis
On the hourly chart of USD/JPY at FXOpen, the pair started a strong increase from the 141.20 zone. It gained bullish momentum and was able to clear the 142.90 resistance.
The pair even climbed above the 50-hour simple moving average and 143.70. It traded to a new multi-week high at 144.17 and is currently consolidating gains. It is trading near the 23.6% Fib retracement level of the upward move from the 142.93 swing low to the 144.17 high.
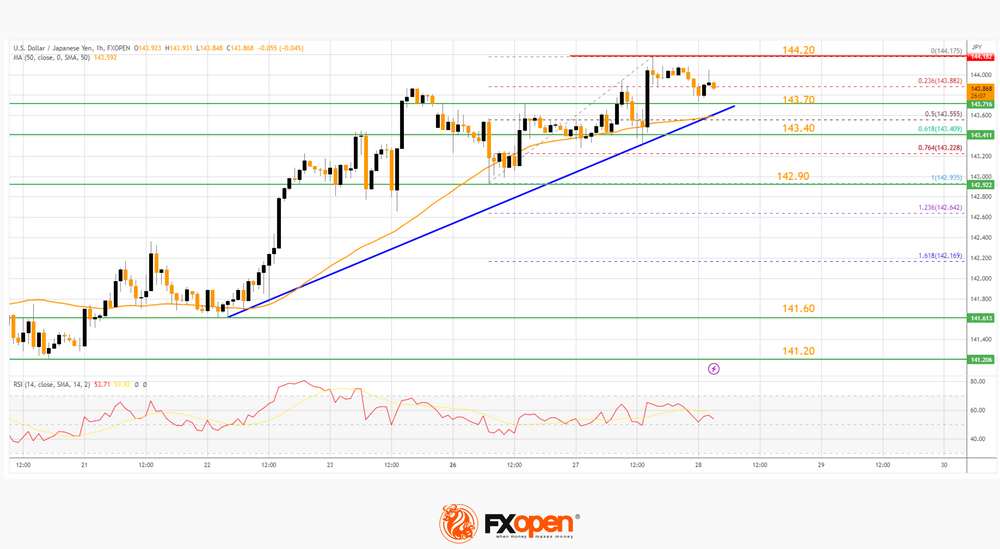
The first major support on the USD/JPY chart is near a major bullish trend line at 143.70. The next major support is near the 61.8% Fib retracement level of the upward move from the 142.93 swing low to the 144.17 high at 143.40.
If there is a close below 143.40, the pair could decline steadily. In the stated case, the pair might drop toward the 142.90 support.
On the upside, the pair is facing resistance near the 144.20 level. The first major resistance is near the 144.50 level. If there is a close above the 144.50 level and RSI moves above 60, the pair could rise toward 145.40. The next major resistance is near 146.20, above which the pair could test 148.00 in the coming days.
China’s Booster from Premier Li Qiang May Not Last
- China’s Premier Li Qiang’s morale booster speech during yesterday’s opening of the World Economic Forum’s 14th Annual Meeting of the New Champions ignited a bullish tone in China’s stock market.
- USD/CHH (offshore yuan) retreated from 7.2500 key intermediate resistance after PBoC’s indirect FX intervention yesterday.
- USD/CNH may strengthen further which may trigger another round of downside pressure in China-related equities.
China’s Premier Li Qiang, also the Head of the State Council that directs economic policies in China used his keynote speech yesterday, 27 June during the opening of the World Economic Forum’s 14th Annual Meeting of the New Champions in Tianjin to smooth out fears of a significant impending economic slowdown in the second half of 2023.
He informed the 1,500 forum attendees that consist of foreign-policy makers and global business leaders that China’s Q2 economic growth will be faster than the 4.5% recorded in Q1 and on track to achieve the annual GDP growth target of around 5% for 2023.
Morale booster on China’s H2 2023 growth trajectory but no details on new fiscal measures
Li Qiang stopped short of revealing any details on the highly anticipated new fiscal stimulus measures that the State Council discussed two weeks ago. But yesterday’s “confident boosting” speech by one of China’s top economic policymakers has triggered a broad-based rally in key China’s proxies benchmark stock indices that snapped five consecutive days of losses.
The Hang Seng China Enterprises Index ended yesterday’s session, 27 June with a gain of +2.08%, the Hang Seng Index added +1.88% and the Hang Seng TECH Index which comprises China’s mega-cap technology stocks outperformed with a rally of +2.57% and close back above its 50 and 200-day moving averages. The A-shares CSI 300 had a smaller gain of +0.94%.
Watch out for further Yuan’s weakness
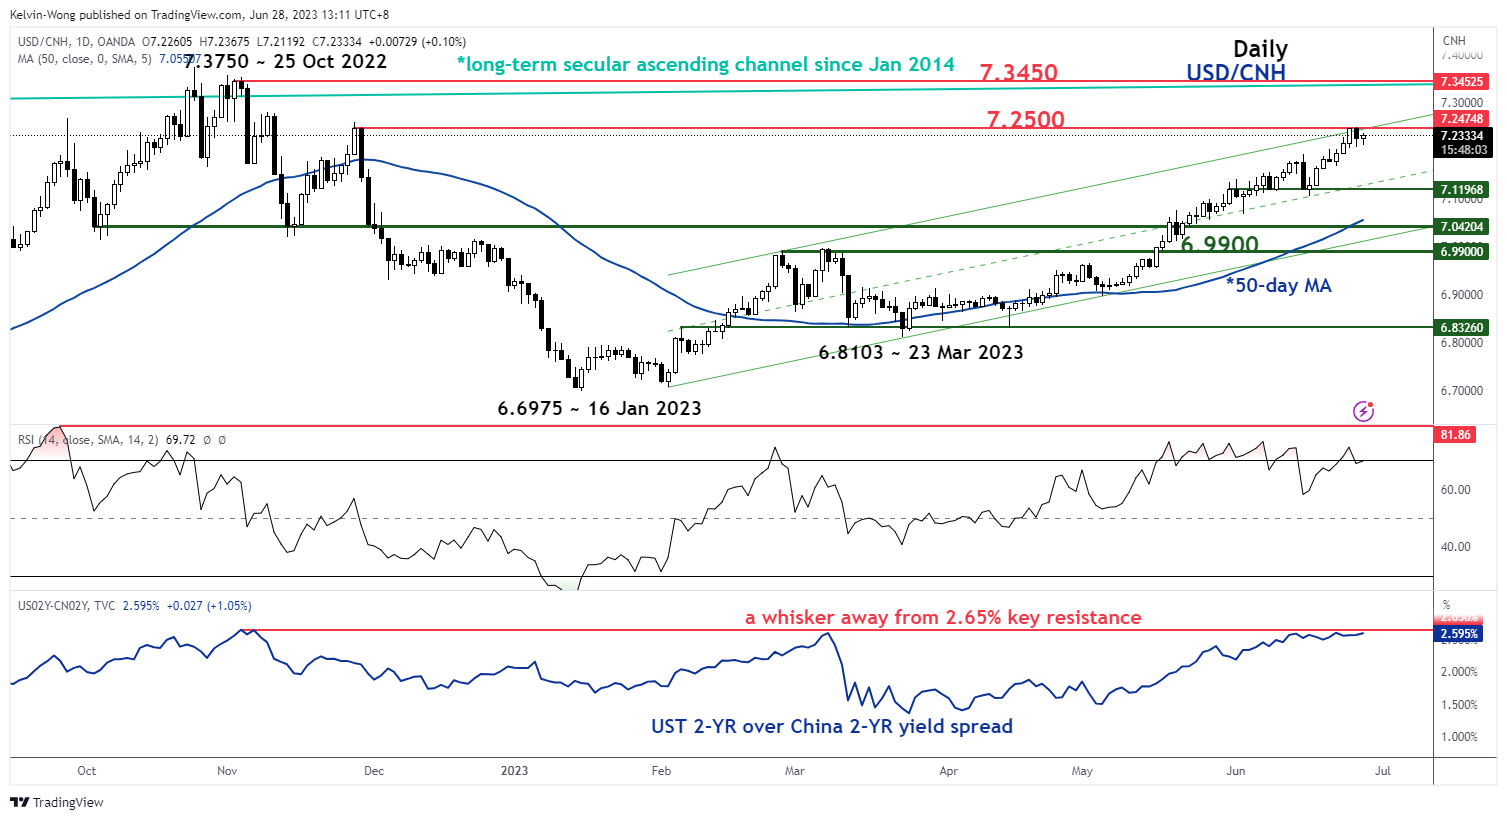
Fig 1: USD/CNH medium-term trend as of 28 Jun 2023 (Source: TradingView, click to enlarge chart)
The offshore yuan has weakened considerably in the past four weeks where the USD/CNH staged a rally of +5% from its 4 May 2023 low to 27 June 2023 high of 7.2495 and such yuan weakness could spur capital outflows amid a weak internal demand environment that triggers a negative feedback loop back into the China’s stock market.
Given the recent hawkish rhetoric from the US central bank, Fed’s to keep interest rates higher for a longer period in the US has caused the 2-year sovereign bond yields between the US and China to widen further that put further downside pressure on the yuan which prompted China central bank, PBoC to step in yesterday by setting its opening daily reference rate higher than expected on the onshore yuan against the US dollar that led to a daily loss of -0.3% in the USD/CNH by the end of yesterday US session.
However, such indirect intervention by PBoC has been fruitless so far as the offshore USD/CNH has resumed its upside momentum today with an intraday gain of +0.13% at this time of the writing, and printed an intraday high of 7.2367, just a whisker away from its key immediate resistance of 7.2500.
Today’s current downbeat tone seen in the offshore yuan has been magnified by yesterday’s better-than-expected US economic data; Conference Board’s consumer confidence for June, and durable goods for May that increased the odds of the Fed’s upcoming two expected hikes on the Fed funds rate before 2023 ends which in turn may widen the differential of US-China’s 2-year sovereign bond yield spread further.
Failure to keep the 7.2500 resistance in check on the offshore USD/CNH may see another bout of yuan’s weakness towards the next resistance at 7.3450 (the major 25 Oct 2022 swing high area & the upper boundary of the long-term secular ascending channel in place since January 2014).
Yuan has moved in lockstep with China and Asia ex-Japan equities since October 2022
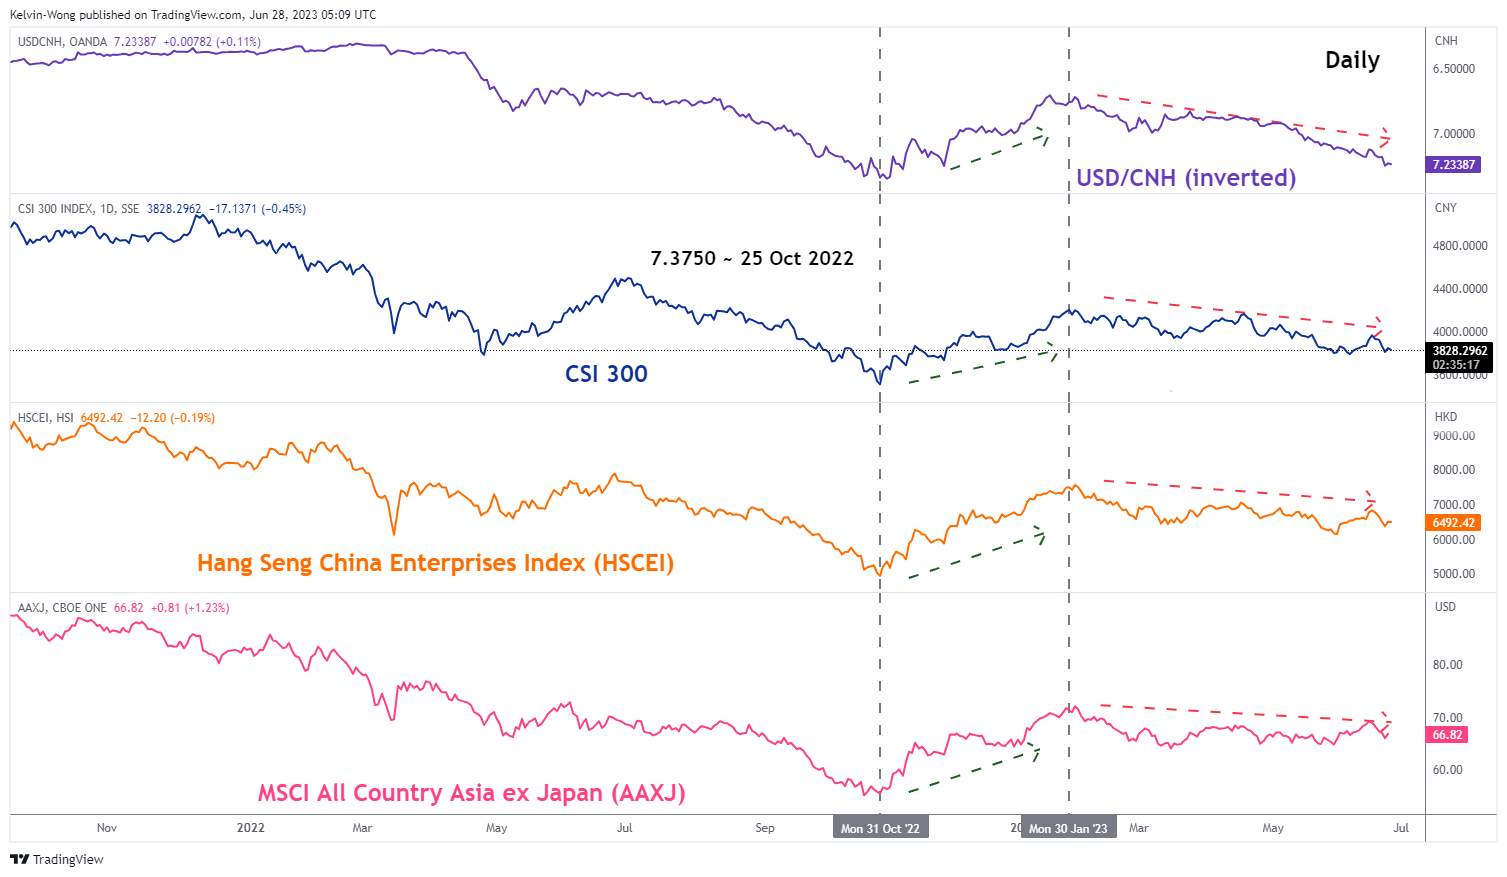
Fig 2: Yuan correlation with CSI, HSCEI & MSCI All Country Asia ex Japan as of 28 Jun 2023 (Source: TradingView, click to enlarge chart)
Since October 2022, the movement of USD/CNH (inverted) has had a strong direct correlation with China benchmark stock indices (CSI 300 & Hang Seng China Enterprise Index) as well as the Asia ex-Japan stock markets.
Hence, without any clear indication of the scope and implementation timing of the new fiscal stimulus measures from the State Council and clearance above the 7.2500 key intermediate resistance on the USD/CNH may dampen the short-term bullish mood and trigger another bout of downside pressure in China and Asian ex Japan equities in general.
Near-Term Recession Fears are Clearly Overdone
Markets
US eco data turned out to be the intraday game-changer, achieving what rather hawkish ECB comments at the central bank’s annual forum in Sintra failed to do. They beat consensus from start to finish. May durable goods orders rose by 1.7% M/M including solid orders for core goods (0.7% M/M). Capital goods shipments, proxy for investment in GDP, followed consensus at 0.2% M/M. Two house price metrics, including the S&P CoreLogic one, showed an accelerating dynamic. New homes sales surged by an annualised 763k in May (vs 675k expected) resulting in a 12.2% M/M increase. It's the third monthly increase and the biggest number in over a year. Finally, consumer confidence spiked from 102.5 to 109.7 (best since January 2022 and vs 104 expected). Details showed improvements in both the current situation and the future expectations index. Consumers showed more optimistic on growth but anticipate less income in coming months and scaled back spending on big-ticket items. So near-term recession fears are clearly overdone, but a slowdown is still in the making. This creates space for the Fed to implement its June plans to hike at least once and likely twice. US Treasuries sold off, underperforming German Bunds. US yields added up to around 8 bps at the front end of with the curve turning more inverse. German yields followed the US move with yields increasing by 6.7 bps (2-yr) to 1.8 bps (30-yr). (US) stock markets embraced the better eco figures, ending 0.63% (Dow) to 1.65% (Nasdaq) higher. European indices closed 0.5% in the green. Risk sentiment beat relative yield dynamics as main driver in the EUR/USD cross rate with the pair closing at 1.0962 from an open at 1.0906. EUR/GBP copied the move, closing just below the 0.86 big figure. EUR/JPY outperformed, setting a new cycle high at 157.94 (vs open at 156.51).
ECB chief economist Lane this morning kept close to the official policy line: July rate hike very likely, September move too soon to tell and way too early to start discounting rate cuts. Bloomberg runs a story based on sources close to the matter, suggesting that some hawkish ECB officials want to speed up the reduction of its asset portfolio. Two options floated are outright sales from the portfolio and phasing out the reinvestment policy for the Pandemic Emergency Purchase Programme. Today’s eco calendar is light but the Sintra panel discussion with ECB Lagarde, Fed Powell, BoE Bailey and BoJ Ueda makes up for that. We expect a hawkish bias to keep core bonds under pressure.
News and views
Australian inflation dropped substantially more than expected in May, from 6.8% Y/Y to 5.6% Y/Y (vs 6.1% Y/Y consensus). The figure was the slowest since April 2022. The Australian Bureau of Statistics said that prices kept rising for most goods and services, but increases where smaller than in recent months. From a monetary policy point of view the report provided a mixed picture. The decline was mainly driven by auto fuel prices (-6.7% M/M and -8% Y/Y) while core inflation eased only modestly to 6.4% Y/Y in May from 6.5% in April. On a monthly basis, CPI declined 0.4%, after a 0.8% rise in April. At its early June meeting, the Reserve bank of Australia raised its policy rate for a second consecutive meeting after holding a pause in April. At that time it signaled that some further tightening might be needed to be evaluated by incoming data. Today’s data give some comfort, but only a slight decline in the core measure and a very strong May labour market report keep the option for an additional hike next week wide open. The Australian 2-y bond yield this morning declined 5 bps to 4.05%. The Aussie dollar in a first reaction declined from AUD/USD 0.668 to 0.662, but currently again trades near 0.664.
The Chinese yuan stays in the defensive this morning with the USD/CNY cross rate (7.2275) holding near the weakest level against the dollar since November last year. The further (modest) decline of the yuan follows data this morning showing that industrial profits in the country remain under pressure declining 12.6% Y/Y and 18.8 YTD Y/Y, indicating a sluggish demand and ongoing price pressures for goods delivered by Chinese firms. Earlier this week, the PBOC tried to slow the decline of the currency by setting a stronger daily fix for the currency. Today, the PBOC set the daily fixing again more in line with estimates which suggests that it still accepts a modest further decline of the currency if the pace isn’t too aggressive.
Hawkish Vibes from Sintra
Market movers today
Today is the last day of the ECB Forum on Central Banking in Sintra. A policy panel is scheduled with the heads of ECB, Fed, BoJ and BoE. We also have speeches from ECB's de Guindos and Lane scheduled.
We get the first indication of where euro inflation is headed in June with flash figures out of Italy, one of the countries where inflation remains very high with 8.0% in May.
In Sweden, May household lending data is due, and in Norway, May retail sales will be released. See more below.
The Danske Morning Mail will be on summer break from 3 July to 4 August.
The 60 second overview
ECB speak: Yesterday, at the Sintra central banking forum, ECB President Lagarde confirmed that a 25bp hike in July is a done deal unless there is a material change to the outlook. She also said it is likely the ECB will not be able to declare the end of its hiking cycle anytime soon. Governing Council member Wunsch elaborated the ECB reaction function by saying that core inflation, over the next three readings, should give a clear reading it is heading down - and if not, more hikes will be necessary. This morning, GC member Lane added that rates must stay restrictive to reach 2% inflation and that it is not reasonable to price in rapid rate cuts.
Russia update: Yesterday, Russian security service FSB announced it has officially dropped charges against Wagner fighters. Wagner leader Prigozhin's plane left Russia for Belarus yesterday and President Lukashenko confirmed his arrival. The implications from relocating Wagner fighters to Belarus are still unclear but e.g. neighbouring Poland has expressed their concern over the matter. There are still many unknowns regarding the whole saga. In a report published yesterday, Institute for the Study of War (ISW) concludes that Putin is afraid that killing Prigozhin would make him a martyr, and instead is aiming at ruining his reputation. The New York Times has reported that Russian General Sergei Surovikin, who acted as the Commander for Russian troops in Ukraine until January, had known about Prigozhin's mutiny in advance. However, on Saturday Surovikin made a public appeal to Prigozhin for him to stop his attempt.
Equities: Global equities were higher yesterday driven by a change in the US risk assessment. A strong and broad-based set of macro data released in the afternoon in Europe made investors lower the risk of near-term recession and lift soft-landing expectations. Market closed near best level and VIX came back below 14. The risk-on tone resulted in a cyclical growth rotation with health care and energy being left behind. In US Dow +0.6%, S&P 500 +1.2%, Nasdaq +1.7% and Russell 2000 +1.5%. Asian markets are mixed this morning with Japan catching up to the US session while more tech-heavy markets are lower on stories about more restrictions coming in the US on chip export. Same picture in western futures with European higher while US ones are lower led by the Nasdaq future.
FI: Tuesday's session was relatively calm despite the hawkish tones expressed by Lagarde in her introductory speech at the Sintra conference. German yields range traded during most of the session, but ended up rising about 4-5bp in the last hours of the European window. Similarly, US yields was little changed during most of the day, but ended the day up 7-8bp on the back of a heavy flow of surprisingly strong US data points being released in the afternoon (Conference Board consumer confidence). Markets are still pricing in a 70% probability of a rake hike of 25bp at the FOMC meeting in July. We still expect status quo. Intra euro-area spreads tightening marginally.
FX: The EUR rise yesterday likely owed to positive risk sentiment and a drop in energy prices rather than hawkish comments from ECB President Lagarde at the ECB Forum. JPY and NOK continue to struggle.
Credit: While the summer break is approaching, issuance continued yesterday in the EUR credit market, with French electricity operator RTE and Dutch telecom KPN both placing new bonds. In the financials segment, Bank of Ireland stood out by attracting a solid EUR1.5bn order book for its EUR750m 8NC7 green HoldCo. In contrast, Portuguese cooperative Credito Agricola was forced to downsize its 4NC3 social senior preferred bond by EUR100m to EUR200m as demand proved insufficient, suggesting that investors remain picky in terms of which names they buy despite the high yield on offer of 8.50%. CDS indices were broadly tighter, with iTraxx Main closing at 78bp (1bp tighter) and Xover at 417bp (7bp tighter).
Nordic macro
May household lending in Sweden is released this morning at 08.00 CET. Over the past six months or so it has come to a virtual standstill. A surprise would be to see it jump higher.
Norwegian retail sales have been trending down for almost two years now, driven by a shift towards consumption of services and the decline in households' purchasing power. After the sharp fall in April, we expect retail sales to be more or less flat in May.
Strong Data and Soft Inflation Boost Appetite
US stocks shrugged off the early week pessimism on the back as of a set of strong economic data released yesterday.
The durable goods orders rose – along with strong jobs data, this is a sign that the US businesses are not in cash-saving mode, Richmond manufacturing index fell less than expected, house prices recovered and house sales beat expectations – in line with the rest of the strong data from US housing market over the past few weeks. US consumer confidence jumped more than expected in June, to the highest level since the beginning of last year.
We would’ve normally expected sentiment to be dampened by strong data because of more hawkish Federal Reserve (Fed) expectations, but the S&P500 jumped more than 1%, Nasdaq rallied almost 2%, while the Russell 2000 advanced around 1.5%.
Easing inflation is maybe why stock investors are happy with strong data
The Australian inflation fell to a 13-month low, and the Canadian inflation fell more than expected, in a sign that the central bank efforts to pull prices lower is paying off. The AUDUSD was sharply sold below its 50-DMA which stands near the 0.6680 level, while the USDCAD rebounded off a fresh low since September on the back of soft inflation and a 2% fall in crude oil prices.
Across the Atlantic Ocean, some encouraging news came in regarding inflation, as well. The British shop prices dipped to 8.4% this month, down from 9% recorded in May. That was the sharpest decline in prices since the end of 2021 – when prices took a lift, and it was not thanks to the Bank if England (BoE) hikes, but it was because Tesco, Sainsbury’s, Asda and Morrisons were asked to ‘behave’ in their pricing to prevent them from passing the higher costs, and higher wages on to their clients more than necessary. So, it is possible that Jeremy Hunt rolling up his sleeves would be more effective to bring inflation down than any BoE hike at this stage.
The good news for the Brits is that, Rishi Sunak and Jeremy Hunt have all the motivation in the world to bring inflation down if they don’t want to be minced at next year’s election. The bad news is that, if they don’t achieve fast results, they will still be minced because the BoE will continue hiking rates and that will leave millions of households facing an enormous rise in their housing costs.
And the Bank for International Settlements, known as the central bank of the central banks, warned that the final stretch of the monetary tightening will likely be the toughest, with some ‘surprises’ on the way. Another banking crisis, real estate chaos, a financial crisis? We will see. Today, the Fed will reveal the result of its stress test for the banks. If they see no issue, they will keep pushing, until something breaks.
XAU/USD Grinds Support
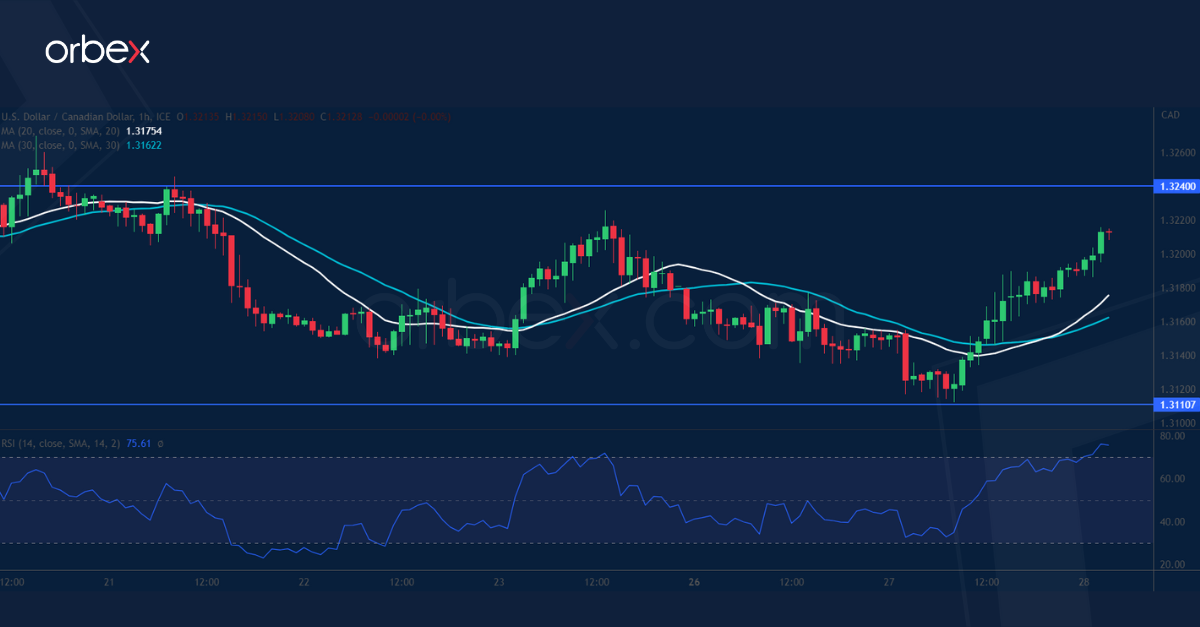
USD/CAD attempts to bounce
The Canadian dollar softened after May’s CPI came out of expectations. The pair remains under pressure with a series of lower lows demonstrating a growing downward pressure after it fell through 1.3250, with a bearish MA cross on the daily chart likely to attract bearish followers. The buy side is trying to get back into the game from 1.3110 and a close above 1.3170 is an encouraging sign. But they still need to clear the supply area of 1.3240 from a previously faded bounce to turn the situation around.
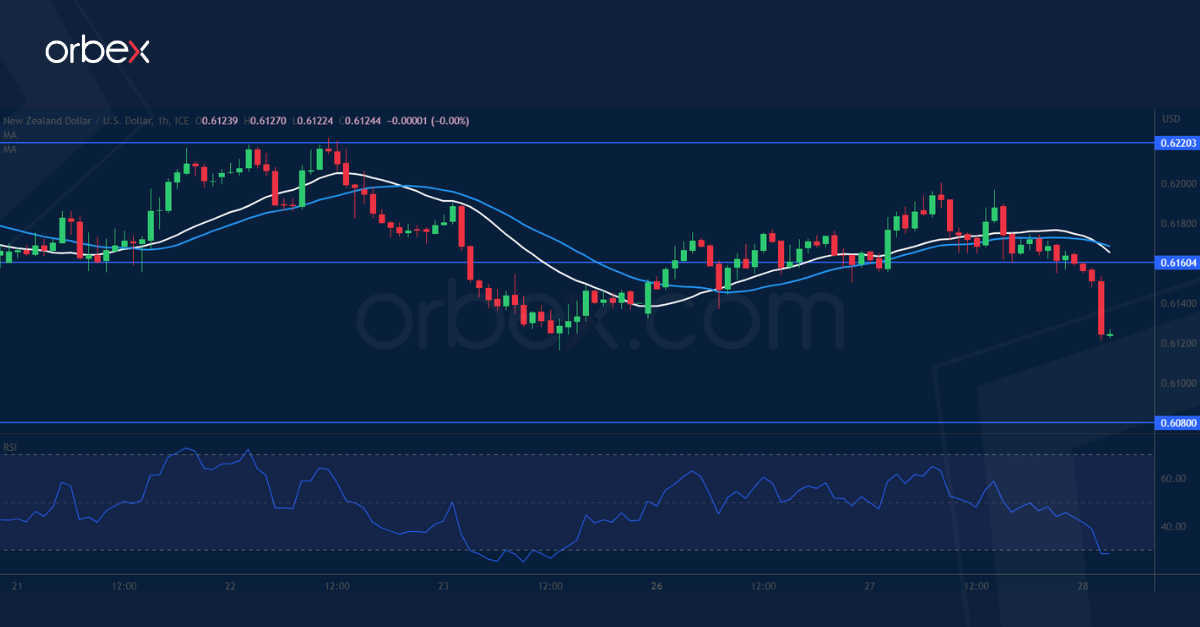
NZD/USD breaks lower
The New Zealand dollar tumbled as traders bet on lower inflation in the region after a falling Australian CPI. The price has been drifting lower after coming across 0.6250 from the start of a sell-off in late May. This means that the sell side is pushing for a deeper correction in the medium-term. 0.6120 over the 30-day SMA has offered some support but its breach would trigger a new round of liquidation and make 0.6080 the next target. 0.6160 is a fresh resistance as an oversold RSI may cause a limited rebound.
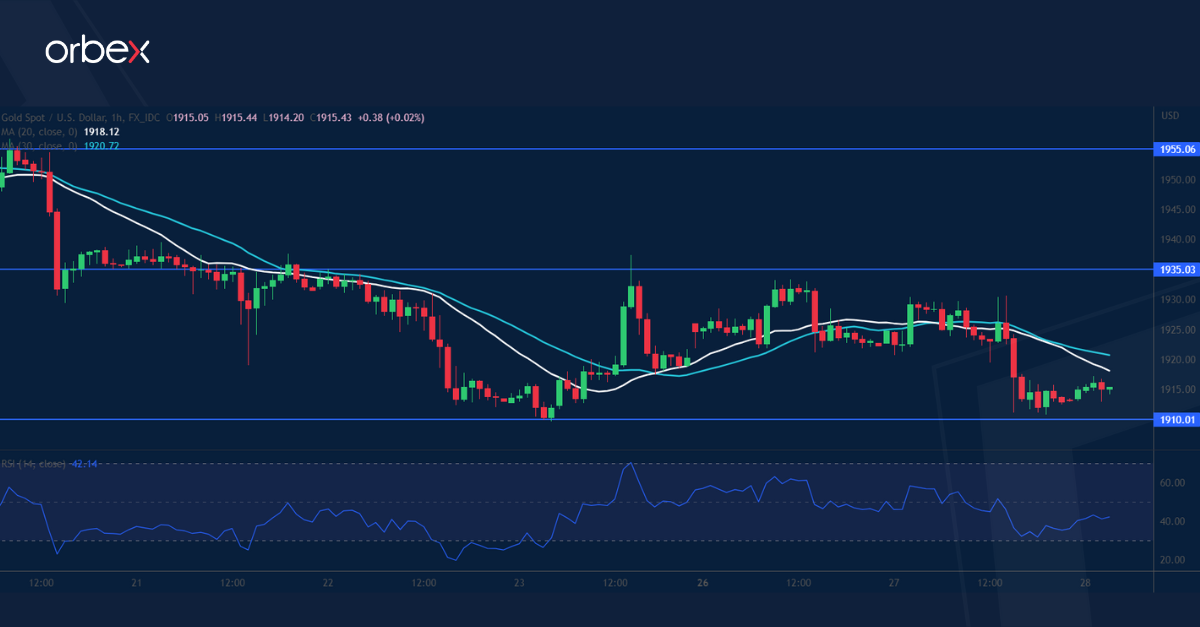
XAU/USD grinds support
Gold slipped after US consumer confidence and home sales showed resilience in June. The price is still licking wounds after failing to hold above 1930 with a timid bounce to 1935 capped by stiff selling. A bearish MA cross on the daily chart and dynamic resistance from the 20 and 30-day SMA may attract more sellers. Only a break above 1966, the top range of a previous consolidation, might put the precious metal back on track. Otherwise, a fall below the fresh support of 1910 would open the door to 1850.
Technical Outlook and Review
DXY:
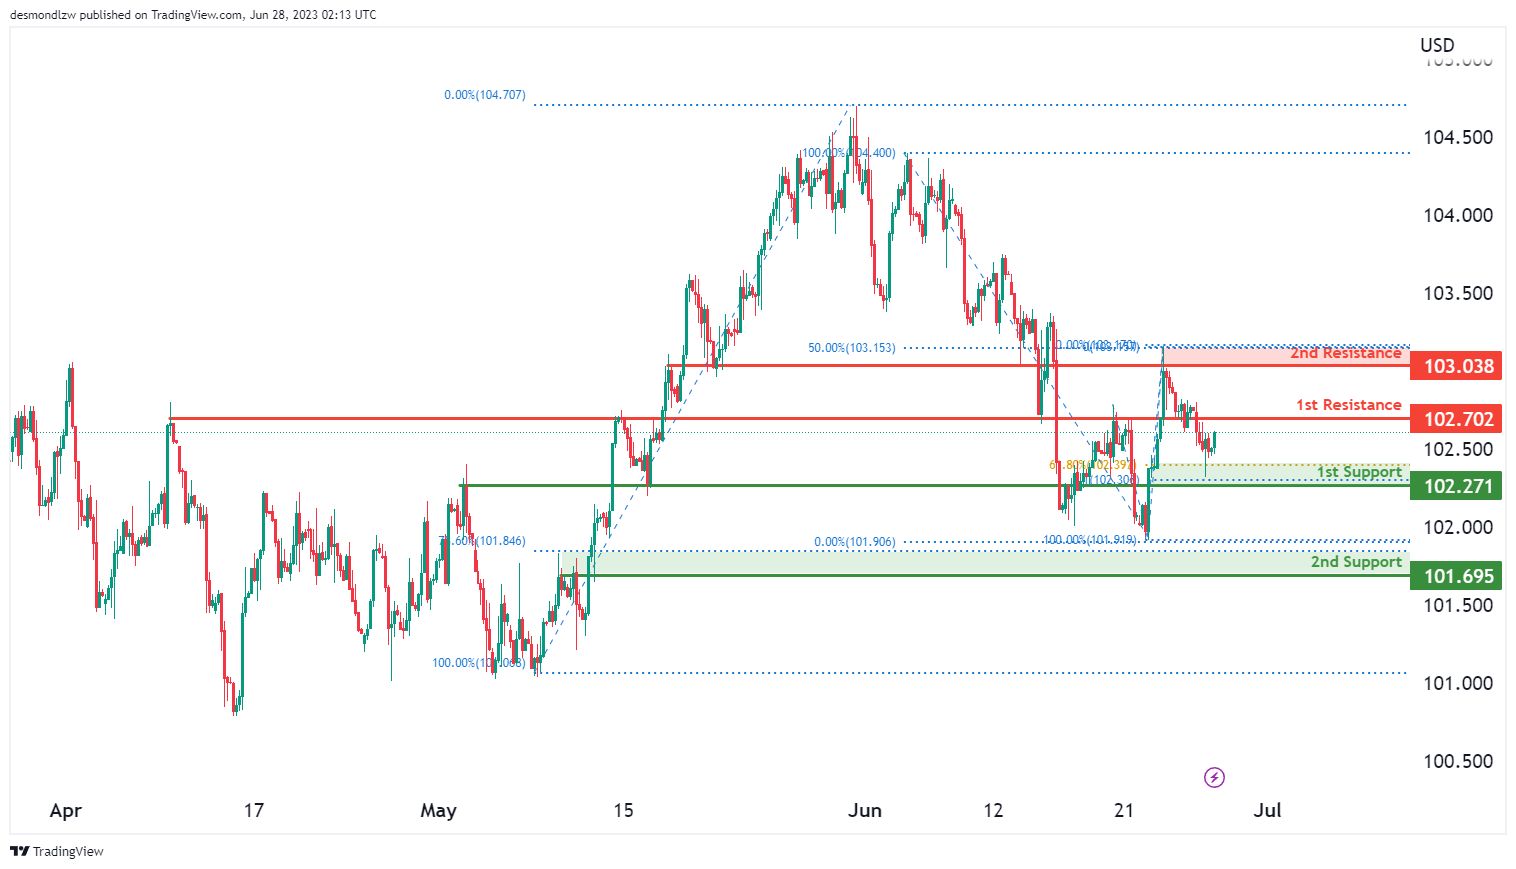
The DXY (US Dollar Index) chart currently exhibits a neutral momentum, suggesting a lack of clear direction. There is a possibility for the price to fluctuate between the 1st support level at 102.27, which is an overlap support and coincides with the 61.80% Fibonacci Retracement and 100% Fibonacci Projection, indicating Fibonacci confluence, and the 1st resistance level at 102.70, which represents an overlap resistance. Additional levels to consider are the 2nd support at 101.69, an overlap support corresponding to the 78.60% Fibonacci Retracement, and the 2nd resistance at 103.05, an overlap resistance aligning with the 50% Fibonacci Retracement.
EUR/USD:
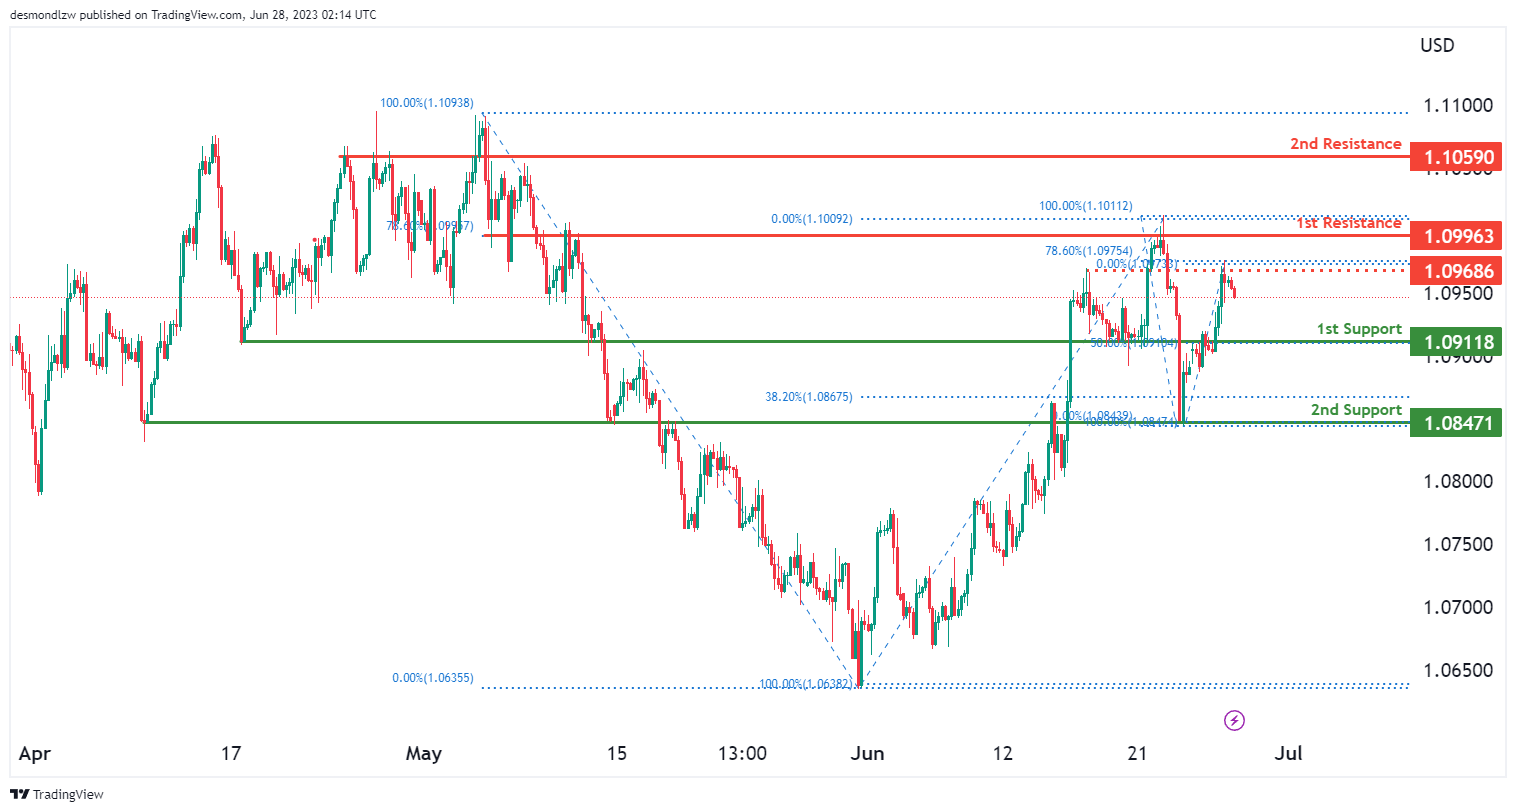
The EUR/USD chart currently shows a bearish momentum, indicating a downward bias in the market. There is a possibility for the price to continue its bearish movement towards the 1st support level at 1.0911, which is considered a pullback support and coincides with the 50% Fibonacci Retracement.
Additional support is found at the 2nd support level at 1.0847, identified as an overlap support. On the upside, the 1st resistance level at 1.0996 acts as an overlap resistance, potentially impeding upward price advancement. Furthermore, the 2nd resistance level at 1.1059 represents another overlap resistance.
It is also worth noting that an intermediate resistance level at 1.0911, coinciding with the 78.60% Fibonacci Retracement, may act as a pullback resistance, adding further significance to this level.
GBP/USD:
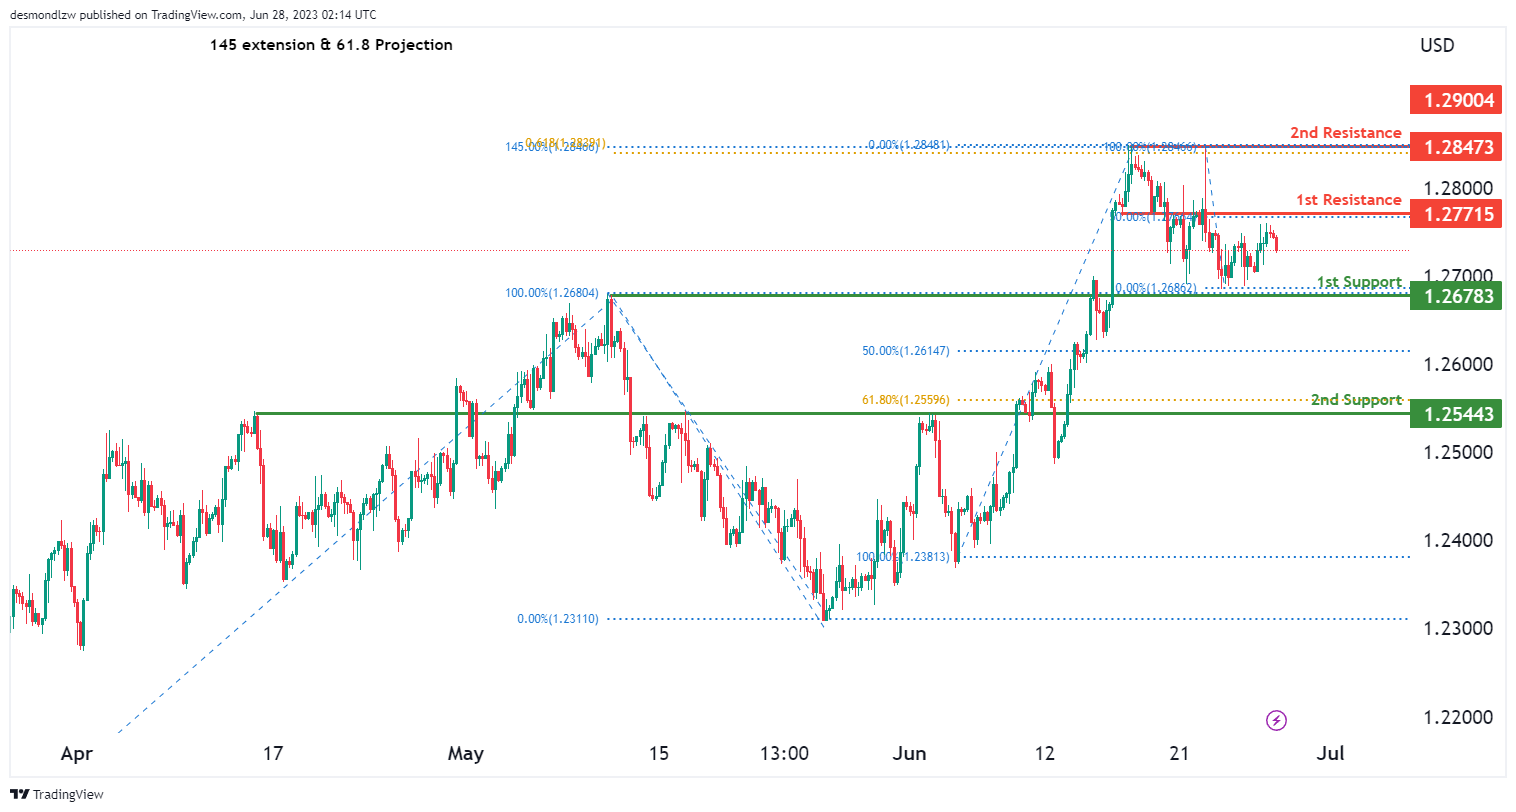
The GBP/USD chart currently indicates a bearish momentum, suggesting a downward trend in the market. There is a potential for the price to continue its bearish movement towards the 1st support level at 1.2678, which is identified as an overlap support.
Additional support is found at the 2nd support level at 1.2544, characterized as a pullback support and coinciding with the 61.80% Fibonacci Retracement.
On the upside, the 1st resistance level at 1.2771 acts as an overlap resistance, potentially impeding upward price advancement. Furthermore, the 2nd resistance level at 1.2847 represents a swing high resistance, indicating the presence of the 61.80% Fibonacci Projection and the 145.00% Fibonacci Retracement, which suggests Fibonacci confluence.
USD/CHF:
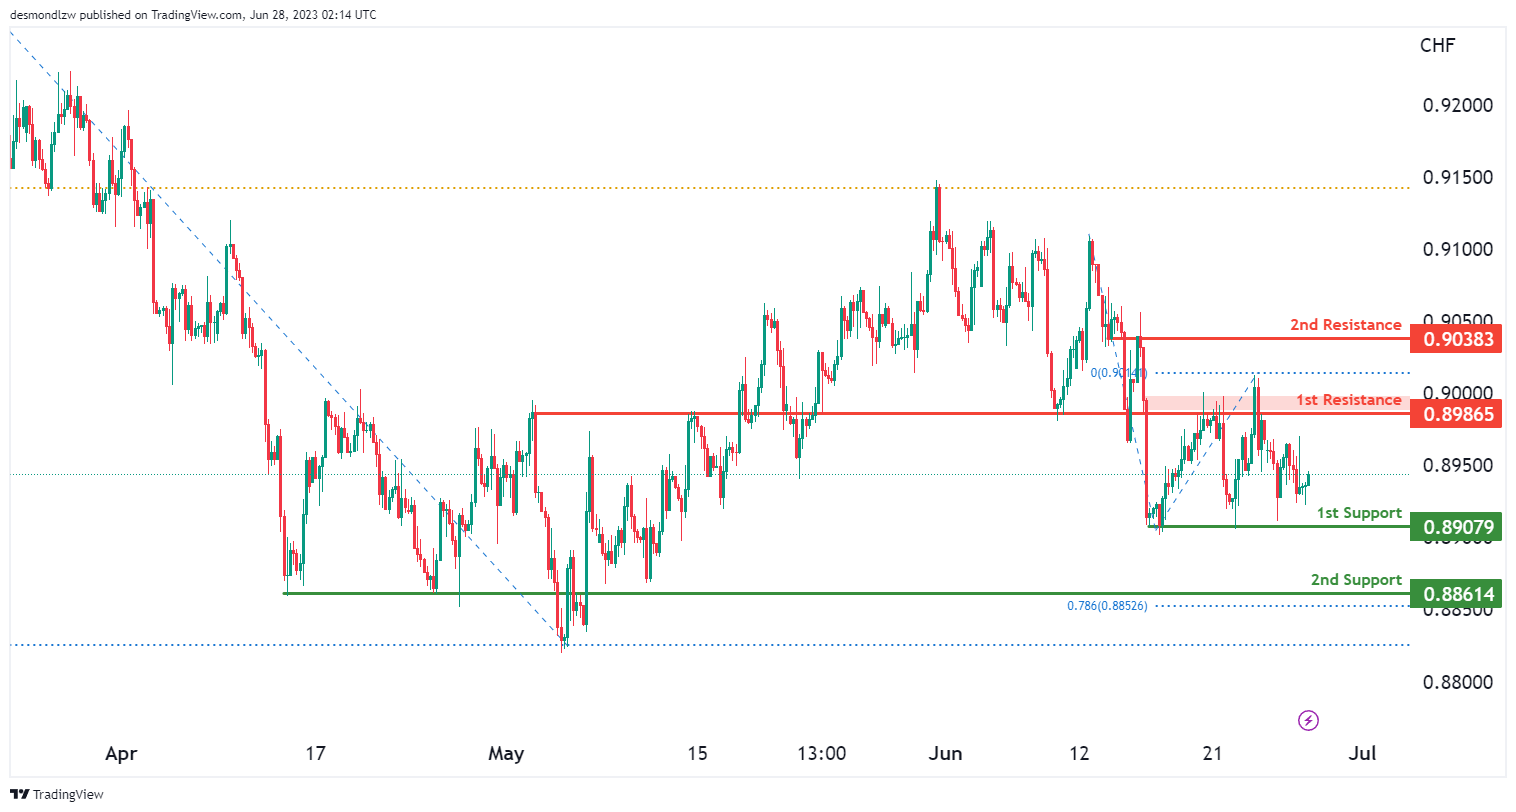
The USD/CHF chart currently demonstrates a neutral momentum, indicating a lack of clear direction in the market. There is a potential for the price to fluctuate between the 1st support level at 0.8907, identified as an overlap support, and the 1st resistance level at 0.8986, characterized as an overlap resistance.
Additional support is found at the 2nd support level at 0.8861, which coincides with the 78.60% Fibonacci Projection. Similarly, the 2nd resistance level at 0.9038 is considered an overlap resistance, further reinforcing its significance.
Given the neutral momentum, it is important to closely monitor these support and resistance levels for potential trading opportunities or a breakout that may provide clearer direction for the USD/CHF pair.
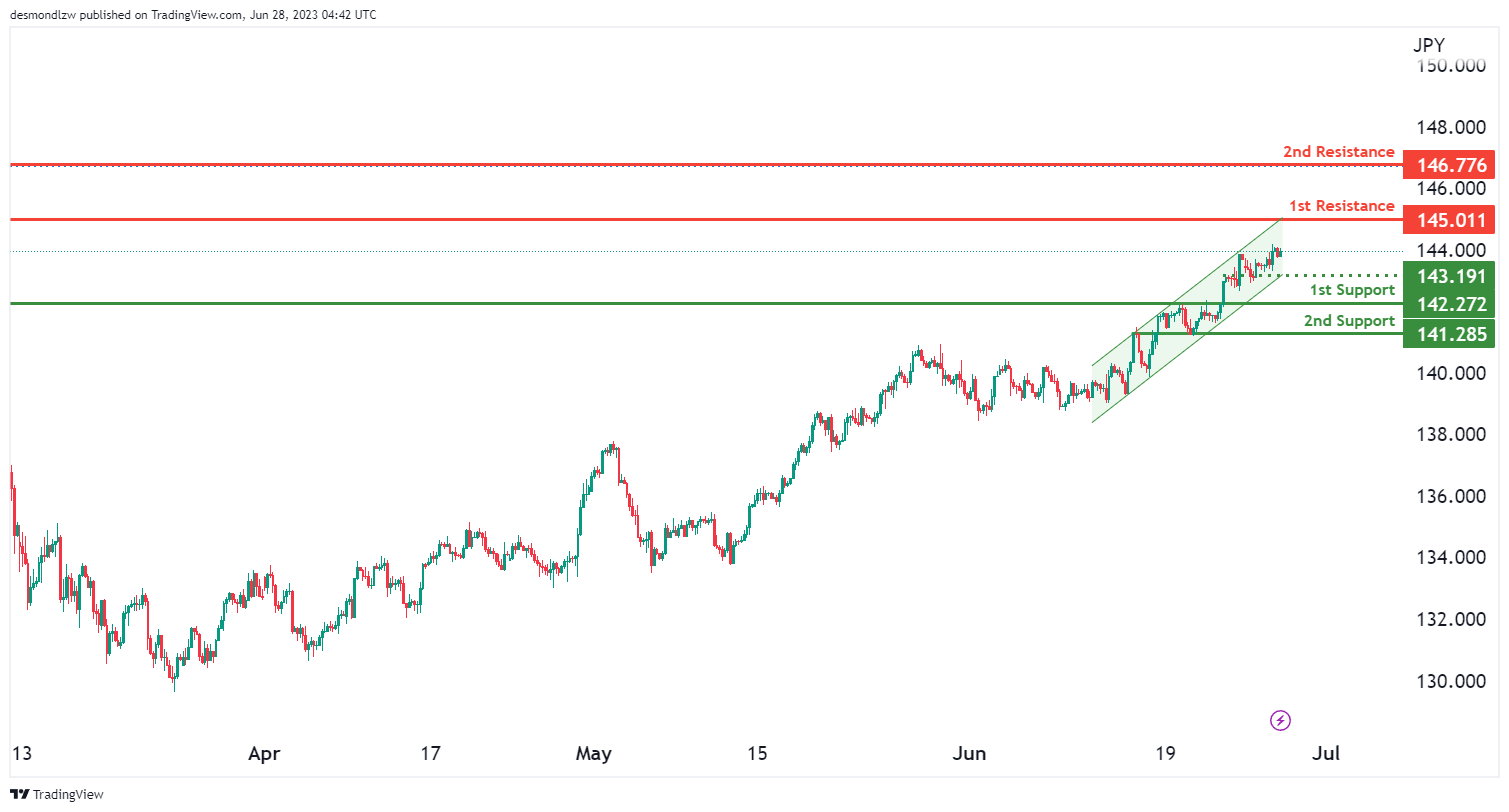
USD/JPY:
The USD/JPY chart currently exhibits a bullish momentum, characterized by the price movement within a bullish ascending channel, suggesting a potential for further upward movement.
There is a possibility of a bullish continuation towards the 1st resistance level at 145.01. This resistance level is considered a pullback resistance, potentially impeding upward price advancement. Additionally, the 2nd resistance level at 146.77 acts as another pullback resistance and coincides with the 78.60% Fibonacci Retracement.
On the downside, the 1st support level at 142.27 is identified as a pullback support, providing potential strength to the support zone. Furthermore, the 2nd support level at 141.28 is an overlap support and also aligns with the 78.60% Fibonacci Projection. An intermediate support level at 143.19 adds further significance as an overlap support.
USD/CAD:
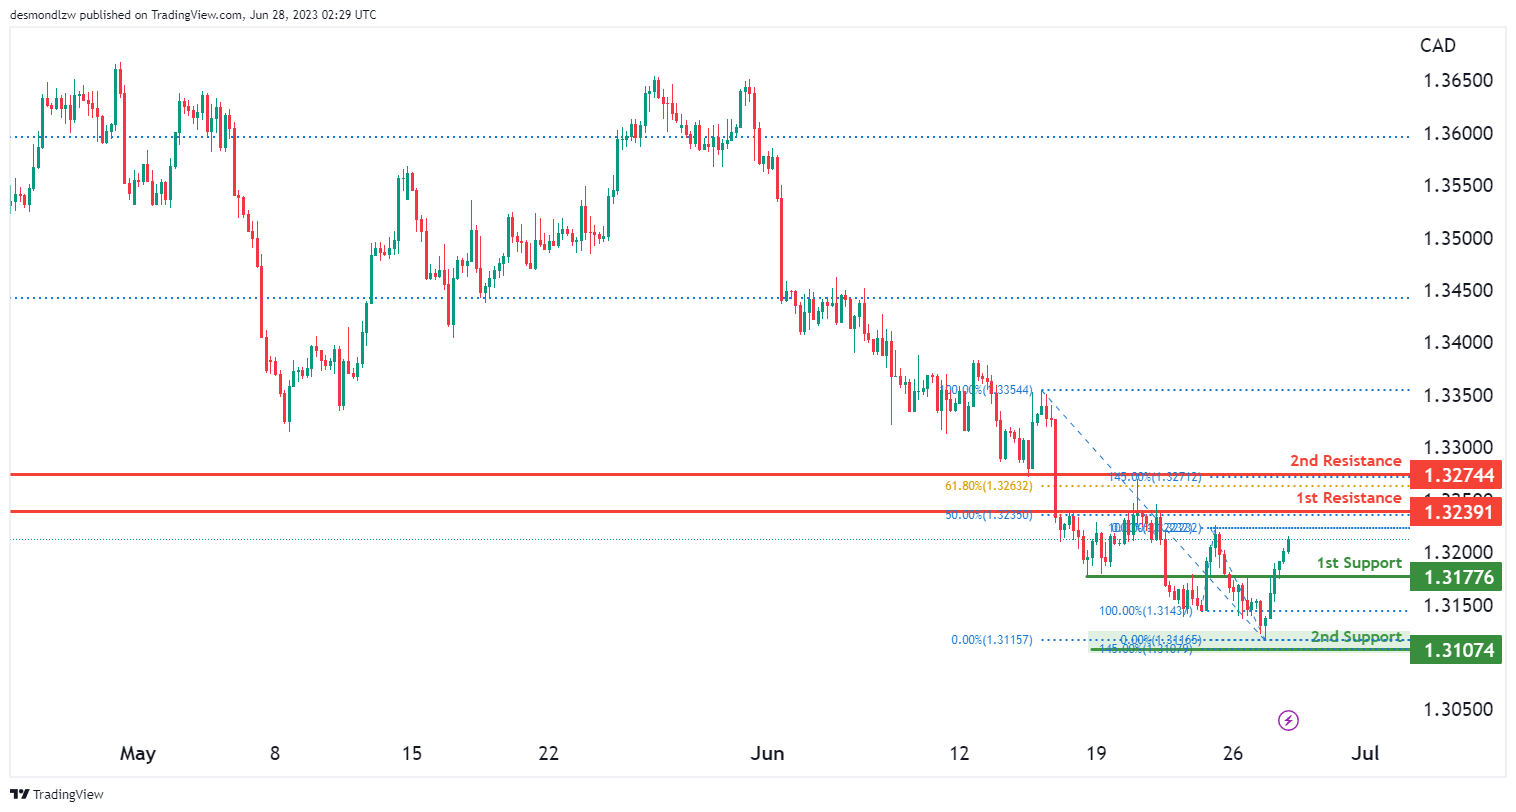
The USD/CAD chart currently demonstrates a bullish momentum, indicating a potential for further upward movement.
There is a possibility of a bullish continuation towards the 1st resistance level at 1.3239. This resistance level is identified as an overlap resistance and is further reinforced by the presence of the 50% Fibonacci Retracement.
On the downside, the 1st support level at 1.3177 serves as a pullback support, potentially providing strength to the support zone. Additionally, the 2nd support level at 1.3107 is an overlap support and aligns with the 145.00% Fibonacci Retracement, adding further significance.
Furthermore, the 2nd resistance level at 1.3274 acts as an overlap resistance and coincides with the 61.80% Fibonacci Retracement and the 145.00% Fibonacci Extension, indicating Fibonacci confluence.
AUD/USD:
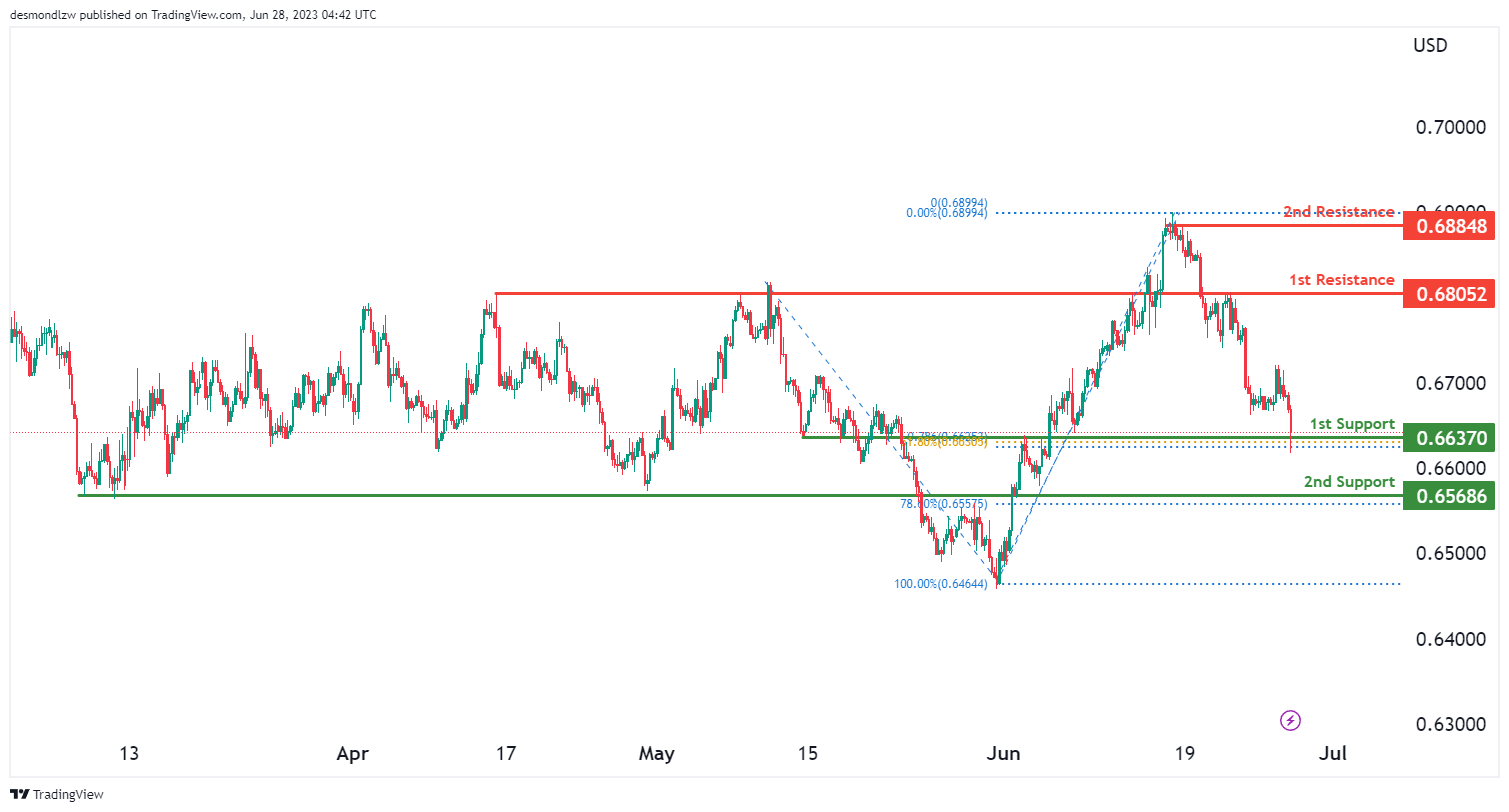
The AUD/USD chart currently exhibits a bullish momentum, indicating a potential for further upward movement.
There is a possibility of a bullish bounce off the 1st support level at 0.6637, which is identified as an overlap support. This support level is further strengthened by the presence of the 61.80% Fibonacci Retracement and the 78.60% Fibonacci Projection, indicating Fibonacci confluence.
Additionally, the 2nd support level at 0.6568 acts as a pullback support, adding further significance to the support zone.
On the upside, the 1st resistance level at 0.6805 represents an overlap resistance. Furthermore, the 2nd resistance level at 0.6884 is identified as a swing high resistance.
NZD/USD
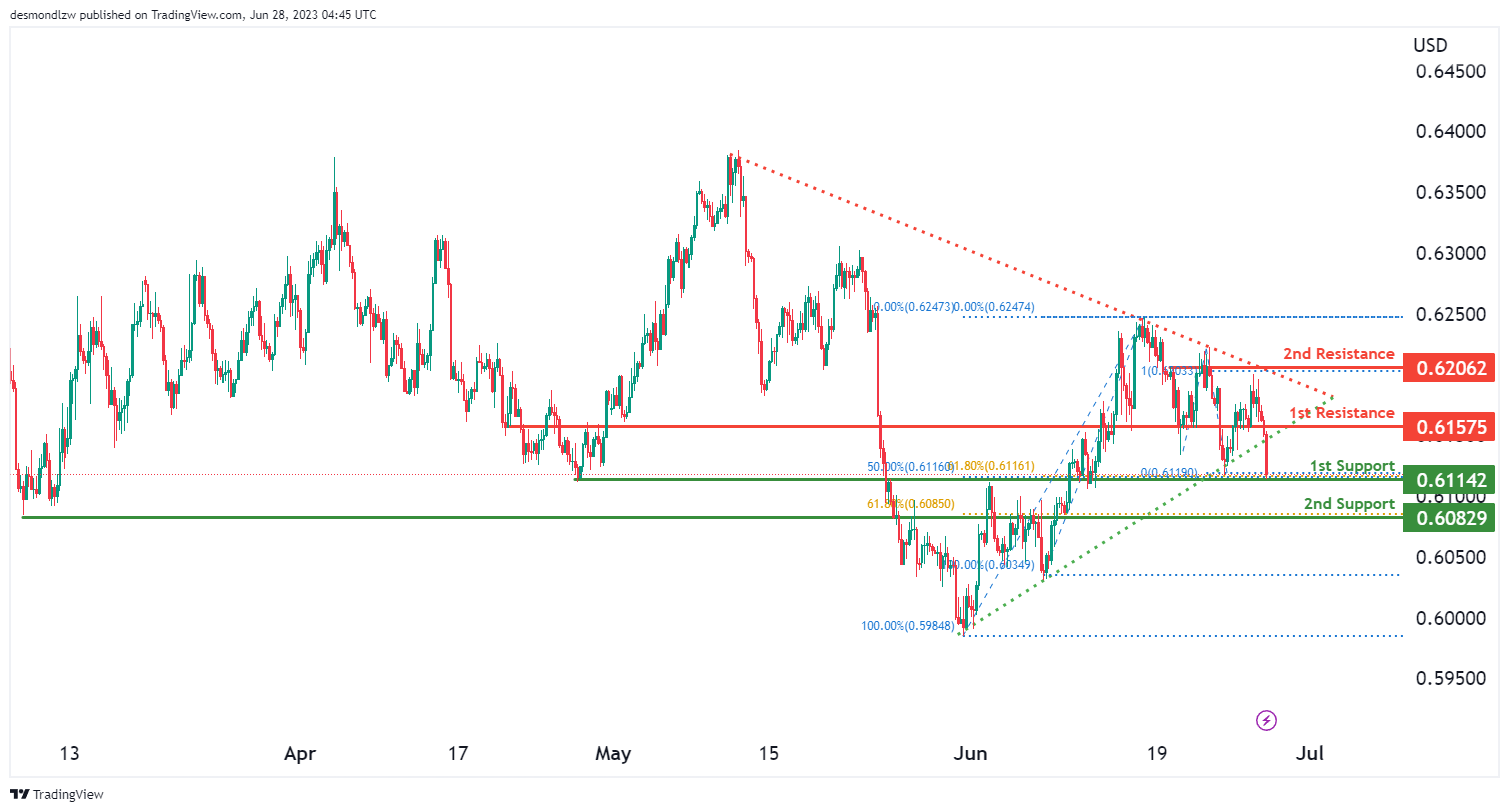
The NZD/USD chart currently shows a bearish momentum, indicating a downward bias in the market. There is a potential for the price to temporarily rise towards the 1st resistance level at 0.6157 before reversing and moving towards the 1st support level at 0.6114.
The 1st support level at 0.6114 is considered an overlap support, with additional strength provided by the presence of the 50% and 61.80% Fibonacci Retracement levels, indicating Fibonacci confluence. Furthermore, the 2nd support level at 0.6082 acts as a pullback support, further reinforcing its significance.
On the upside, the 1st resistance level at 0.6157 functions as a pullback resistance. Additionally, the 2nd resistance level at 0.6206 represents a multi-swing high resistance, supported by the presence of the 100% Fibonacci Projection.
It’s important to note that the price has broken down a symmetrical triangle chart pattern, suggesting a bearish breakdown below the lower trendline
DJ30:
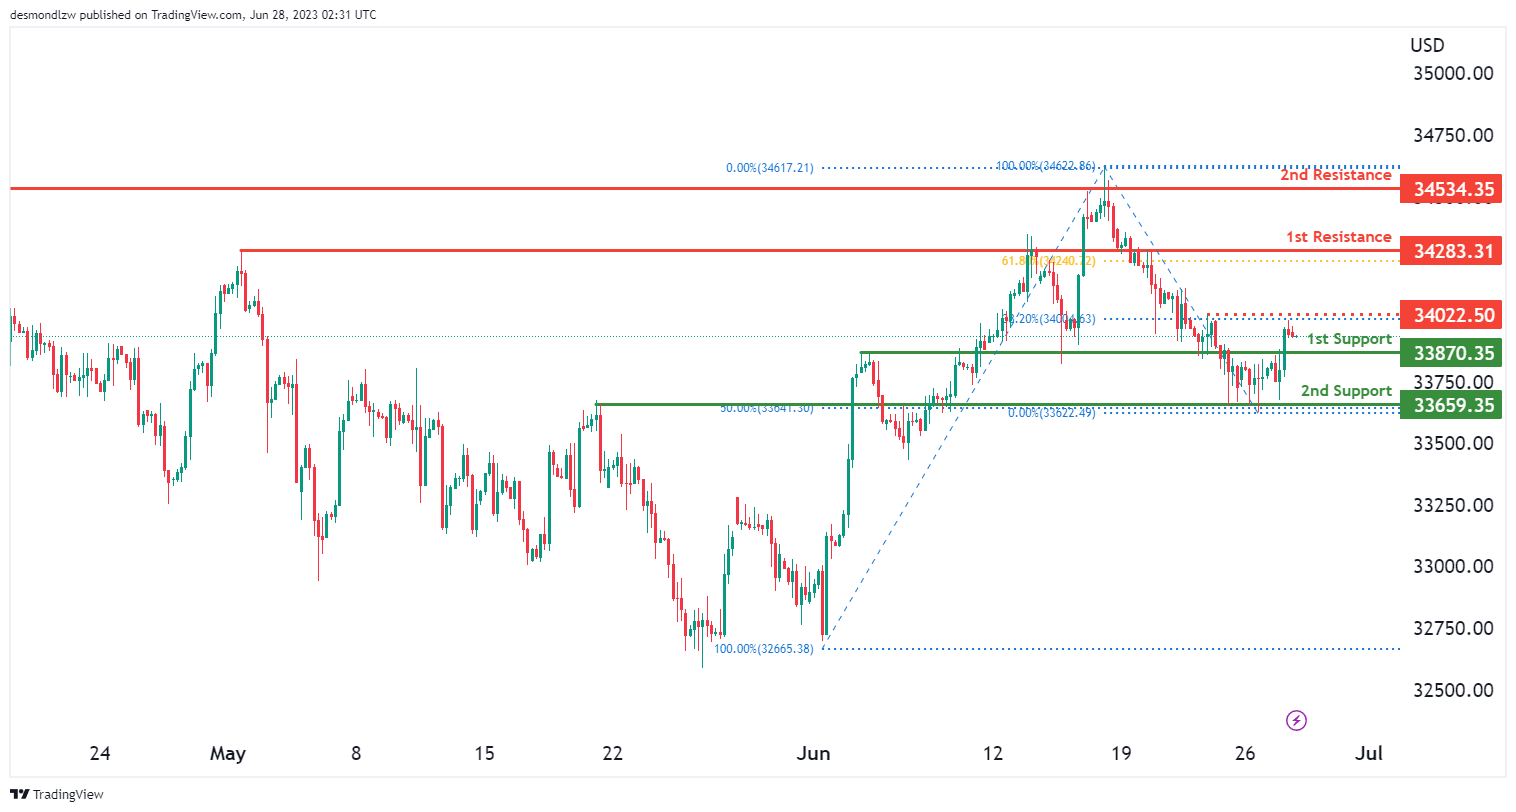
The DJ30 instrument is currently showing a bullish overall momentum. The factors contributing to this momentum are that the price could potentially drop further to 1st support in the short term before making a bounce and rising towards the first resistance.
1st support level is at 33870 and is considered reliable due to its status as an overlap support. There’ s 2nd support level at 33659, which is deemed beneficial as it’s an overlap support and located at the 50% Fibonacci retracement level.
Looking at resistance levels, 1st resistance is situated at 34283, notable for being an overlap resistance and positioned at the 61.80% Fibonacci retracement level. 2nd resistance stands at 34534 and is notable for its swing high resistance characteristic.
GER30:
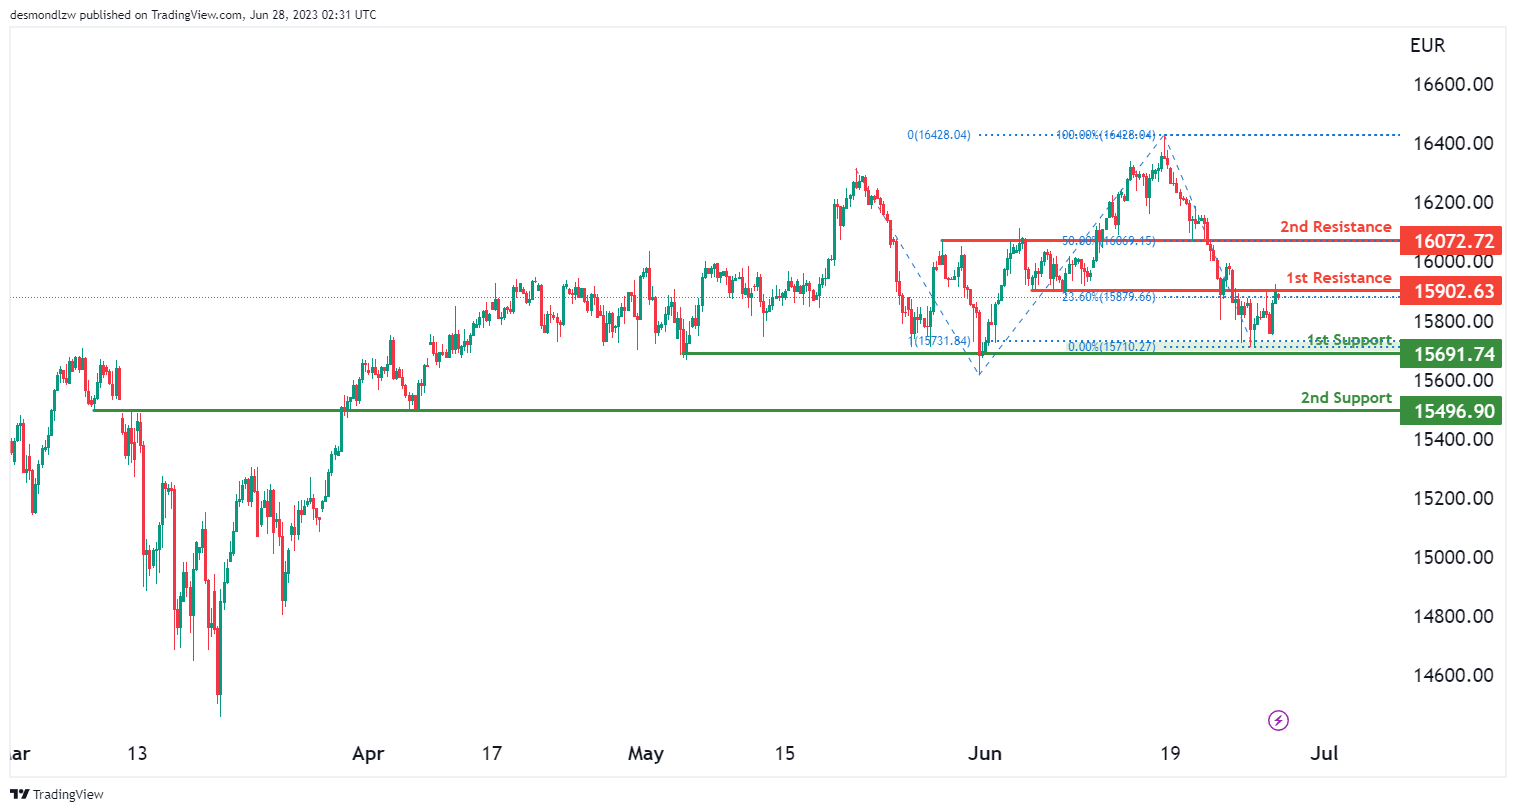
The overall momentum of the chart is strongly bearish with high confidence. It’s predicted that the price could potentially make a bearish reaction off the first resistance and drop down to the first support level.
The first support level is at 15691.7 and is seen as advantageous due to its status as a multi-swing low support. The second support level is found at 15496.9, and it’s considered beneficial because of its quality as an overlap support.
When it comes to resistance levels, the first resistance is located at 15902.6, notable for being an overlap resistance and for its location at the 23.60% Fibonacci retracement level. The second resistance level stands at 16072.7 and is seen as strong due to its status as an overlap resistance and its position at the 50% Fibonacci retracement level.
US500
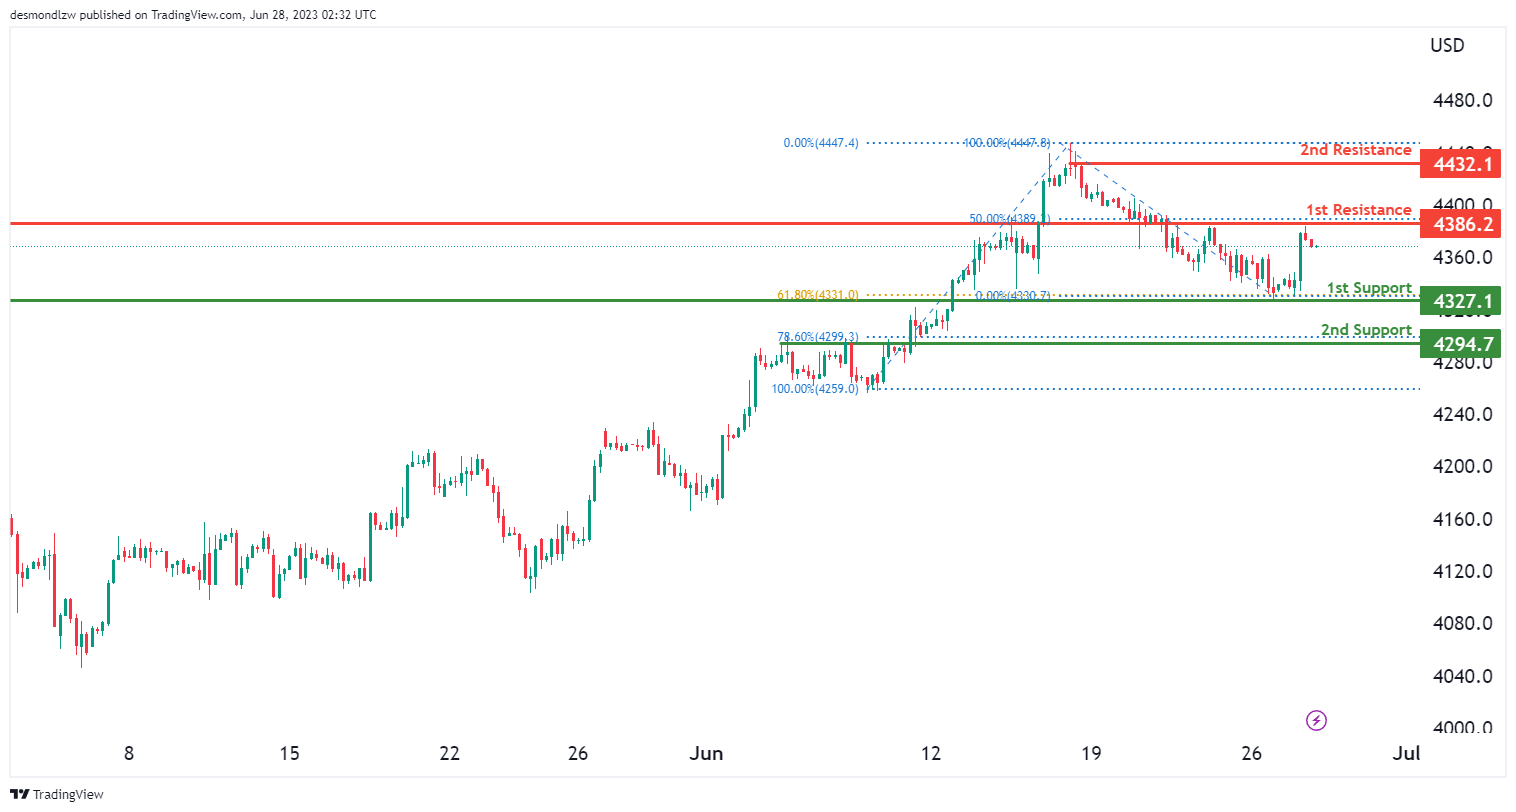
The overall momentum of the chart is weakly bearish with low confidence. It’s anticipated that the price could potentially make a bearish continuation towards the first support level.
The first support is located at 4327.1, and is seen as beneficial due to its status as a pullback support and its position at the 61.80% Fibonacci retracement level. The second support level is found at 4294.7, regarded as advantageous because of its quality as an overlap support and its position at the 78.60% Fibonacci retracement level.
In terms of resistance levels, the first resistance stands at 4386.2 and is notable for being an overlap resistance and located at the 50% Fibonacci retracement level. The second resistance level is at 4432.1, recognized for its swing high resistance characteristic.
BTC/USD:
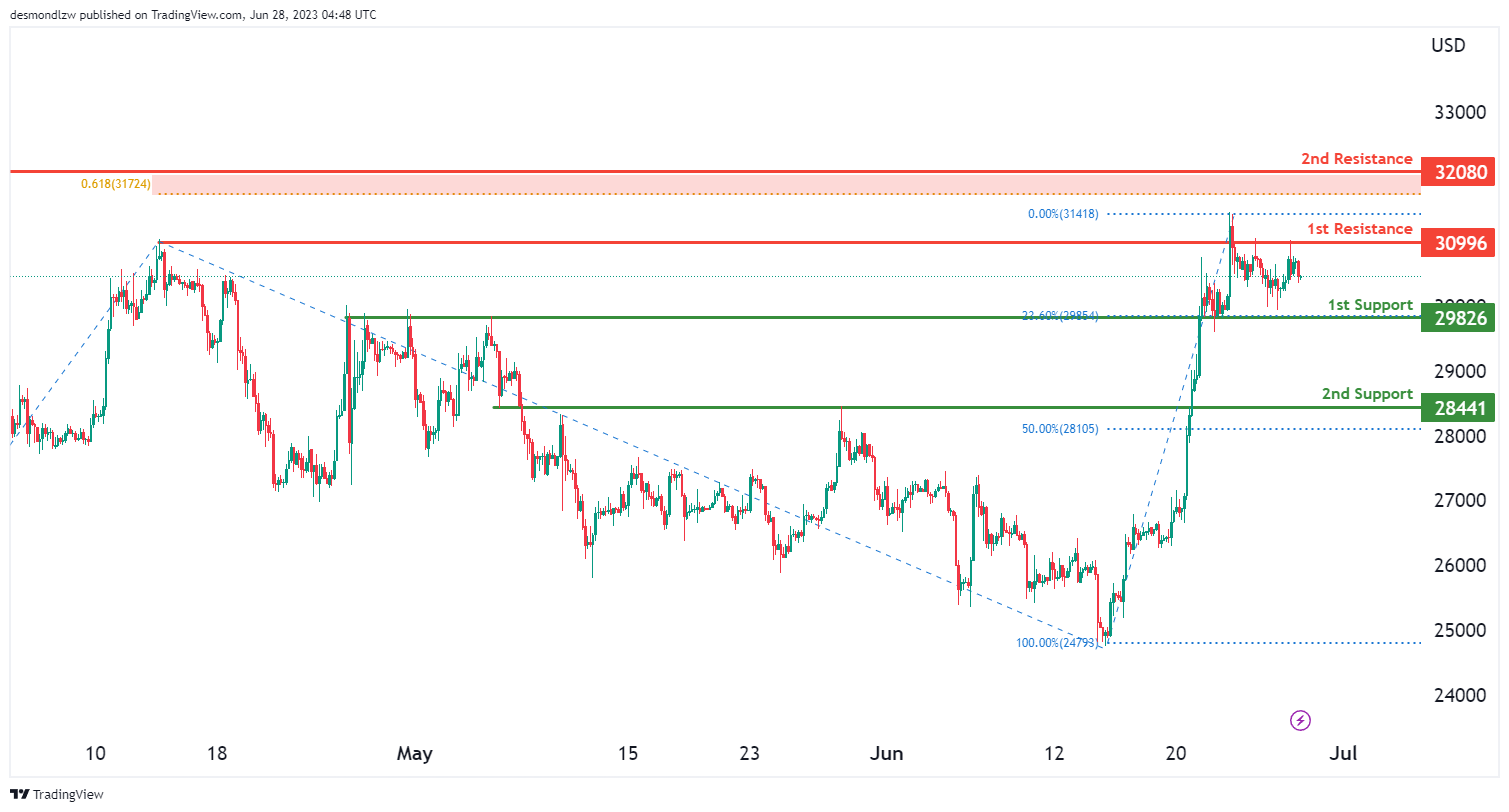
The BTC/USD instrument is currently exhibiting a Neutral overall momentum. The price could potentially fluctuate between the first resistance and first support level.
The first support is at 29826 and is considered advantageous due to its quality as a pullback support and being at the 23.6% Fibonacci retracement level. There’s a second support level at 28441, which is beneficial because it provides an overlap support and is positioned near the 61.80% Fibonacci retracement level.
Looking at resistance levels, the first resistance is situated at 30996, notable for being an overlap resistance. The second resistance is at 32080 and is considered favorable due to its status as a swing high resistance and 0.618% Fibonacci projection.
ETH/USD:
The ETH/USD instrument is currently showing a neutral overall momentum. The price could potentially fluctuate between the first resistance and first support level.
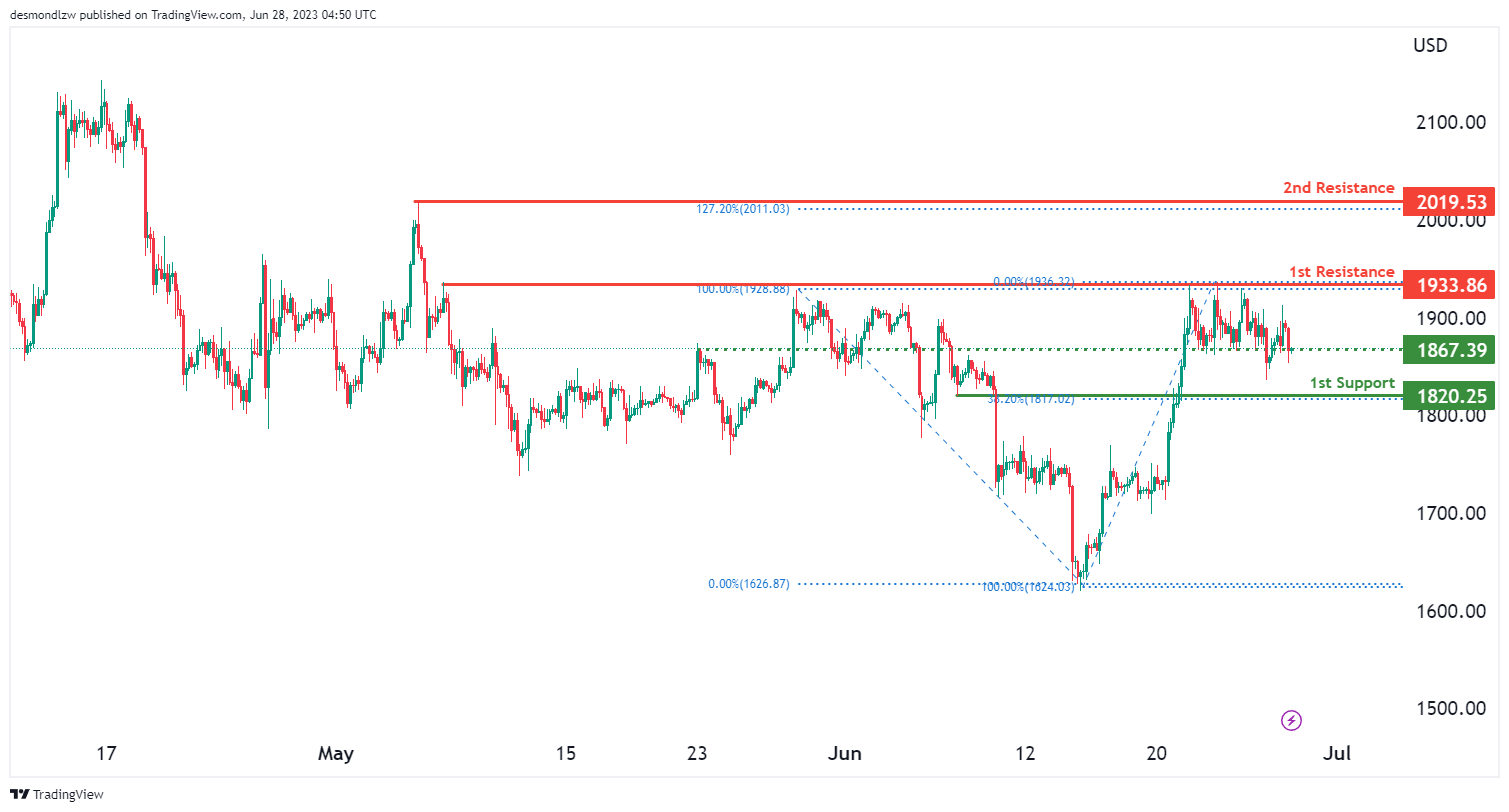
The first support level is at 1820.2 and is considered strong due to its status as an overlap support and its location at the 38.20% Fibonacci retracement level.
An intermediate support level is found at 1867.3, appreciated for its quality as an overlap support.
Regarding resistance levels, the first resistance stands at 1933.8 and is notable for being an overlap resistance. The second resistance is at 2019.5, recognized for its swing high resistance characteristic and position at the 127.20% Fibonacci extension level.
WTI/USD:
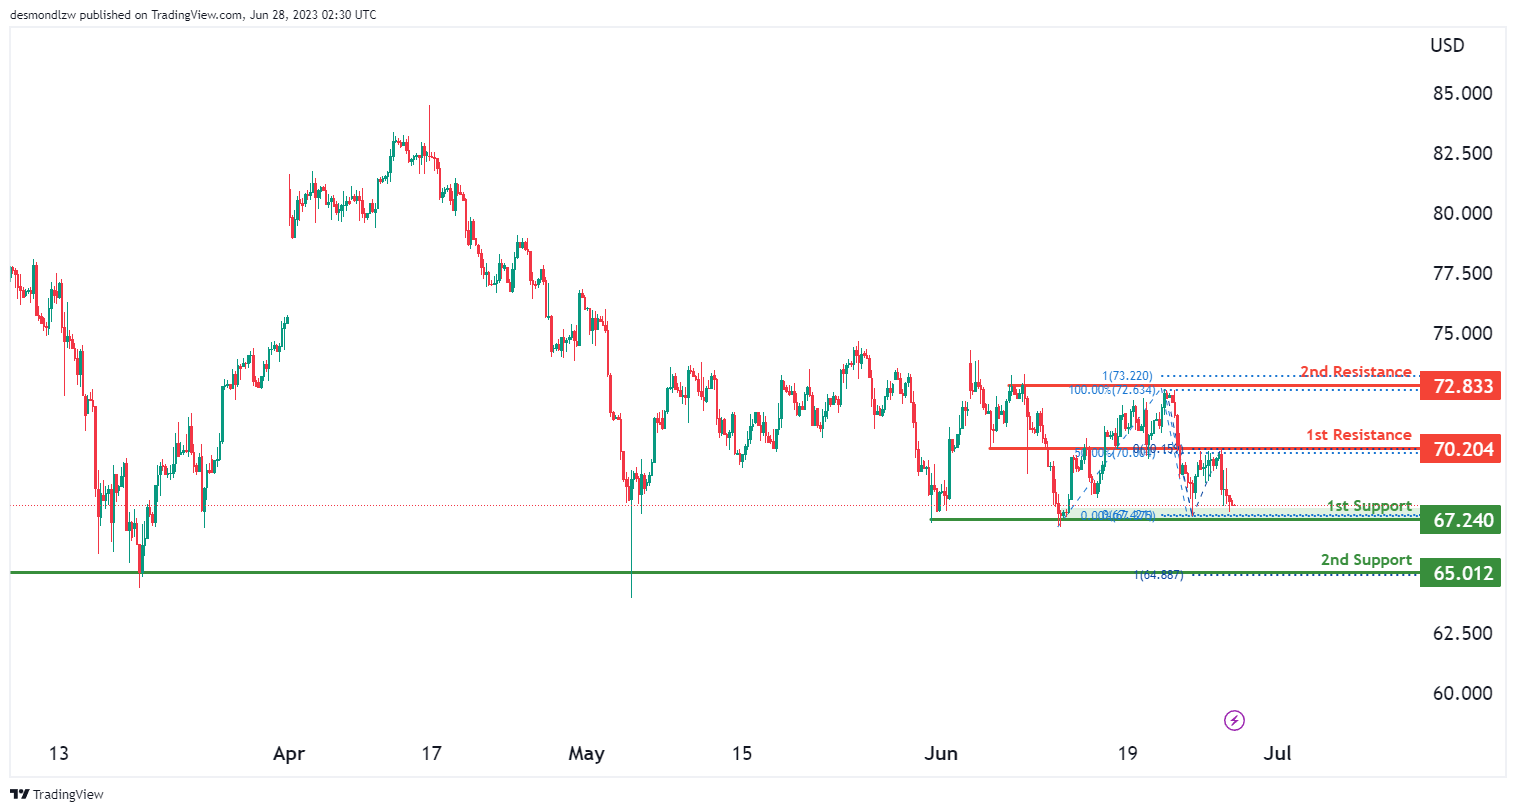
The WTI (West Texas Intermediate) chart indicates a bullish momentum, suggesting a positive outlook for the market. There is a potential for the price to experience a bullish bounce off the 1st support level at 67.2400 and move towards the 1st resistance level at 70.2000.
The 1st support level at 67.2400 is considered a significant area of multi-swing low support, highlighting its potential for providing a supportive base. Similarly, the 2nd support level at 65.0100 also acts as a multi-swing low support, adding to its importance.
On the upside, the 1st resistance level at 70.2000 represents an overlap resistance, potentially impeding further upward price movement. Additionally, the 2nd resistance level at 72.8300 is classified as a multi-swing high resistance, further emphasizing its significance. It is worth noting that the 50% Fibonacci Retracement level coincides with the 1st resistance, indicating Fibonacci confluence.
XAU/USD (GOLD):
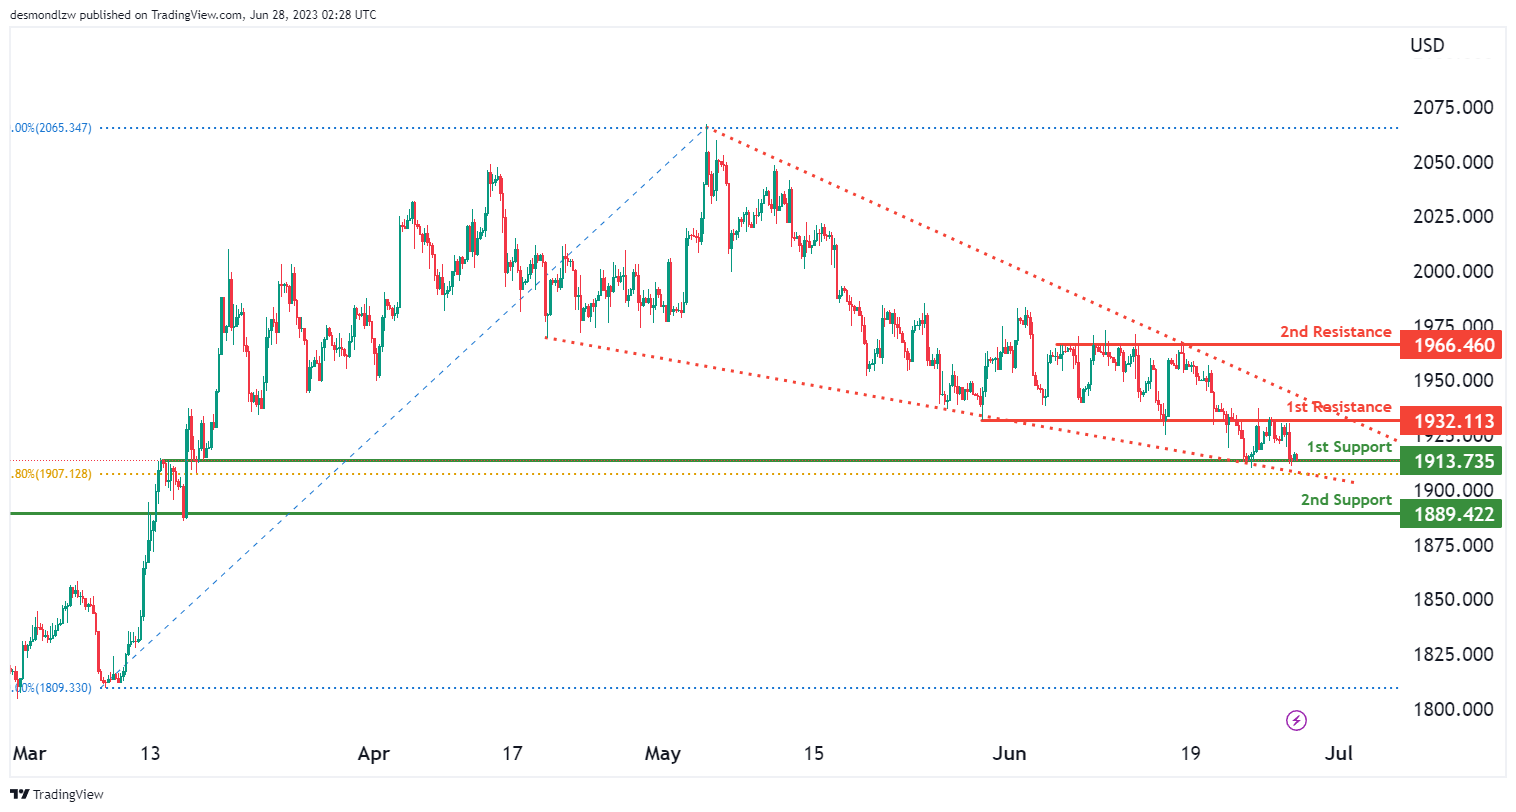
The XAU/USD (Gold/US Dollar) chart displays a bullish momentum, indicating a positive outlook for the market. Factors contributing to this momentum include the potential for a bullish bounce off the 1st support level and a move towards the 1st resistance level.
The 1st support level at 1913.73 is identified as an overlap support, suggesting its significance in providing potential price stability. Additionally, the 61.80% Fibonacci Retracement level adds further confirmation to its importance.
The 2nd support level at 1889.42 also acts as an overlap support, contributing to its potential role in providing support to the price.
On the upside, the 1st resistance level at 1932.11 represents an overlap resistance, potentially impeding further upward price movement. Traders should closely monitor this level for potential price reactions.
Furthermore, the 2nd resistance level at 1966.46 is classified as a multi-swing high resistance, further emphasizing its significance in hindering price advancement.
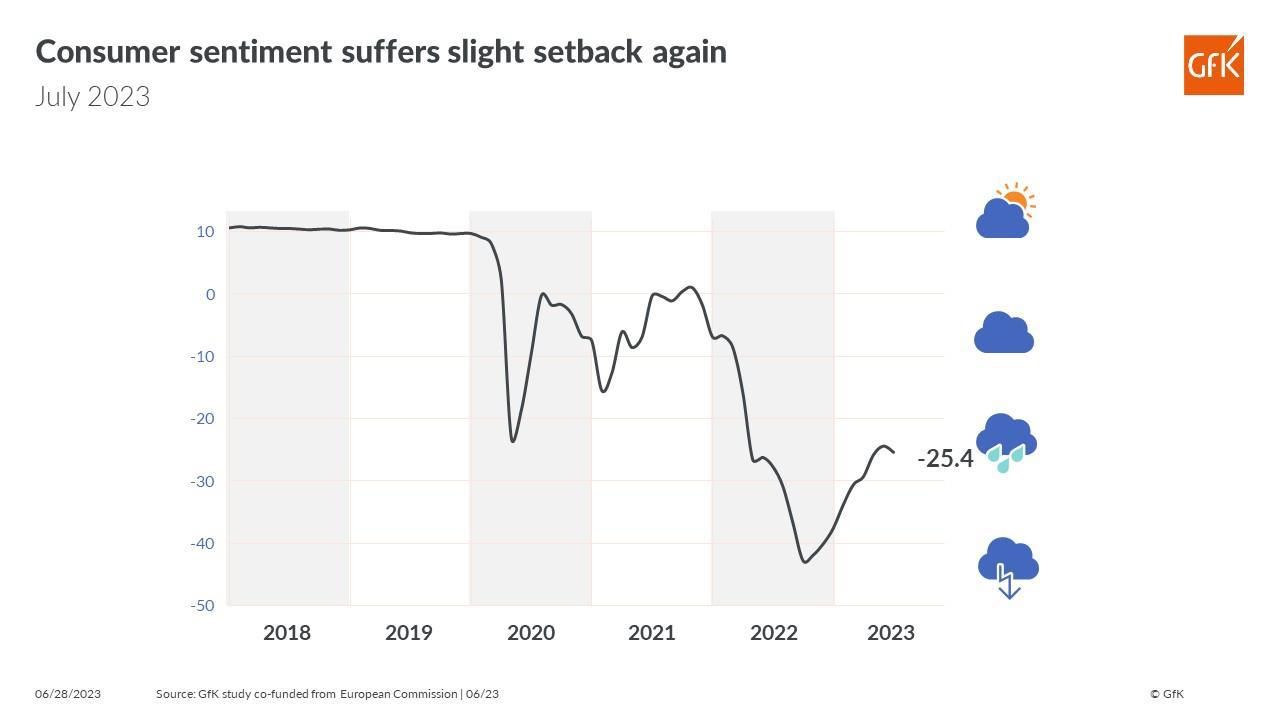
Germany Gfk consumer sentiment fell to -25.4, first setback after eight increases
German Gfk Consumer Sentiment for July fell from -24.4 to -25.4, below expectation of 23.0. In June, economic expectations fell from 12.3 to 3.7. Income expectations fell from -8.2 to -10.6. Propensity to buy improved from -16.1 to -14.6.
"The current development in consumer sentiment indicates that consumers are once again more uncertain. This is reflected in the fact that the propensity to save increased again this month," explains Rolf Bürkl, GfK consumer expert.
"After eight consecutive increases, the consumer sentiment must suffer a first setback. Continued high inflation rates, currently at around six percent, are noticeably eroding the purchasing power of households and preventing private consumption from making a positive contribution."