Sample Category Title
Is Gold Set to Rally Yet?
Don't give up on gold just yet! Despite some challenging times, the World Gold Council believes gold should remain a key asset in your strategic arsenal. Even as the Federal Reserve takes a breather from its aggressive monetary policy stance, it's still maintaining a hawkish stance. In fact, they're signaling the possibility of two more rate hikes this year. Joseph Cavatoni, the head market strategist for the Americas at the World Gold Council, emphasized the importance of this hawkish bias. So, please keep your eyes on gold as it navigates these near-term headwinds. It's always good to have a shiny backup plan in the ever-evolving world of forex trading!
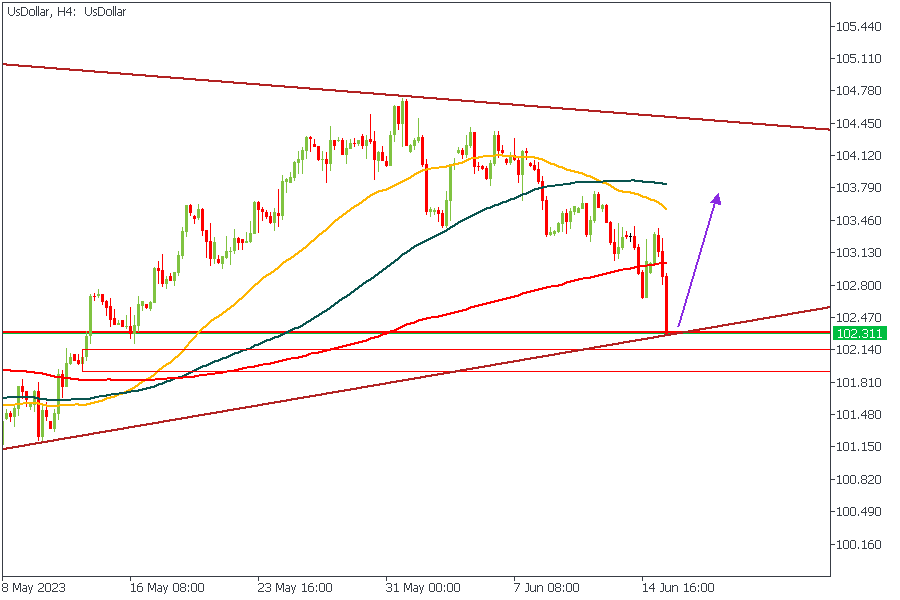
US DOLLAR - 4Hour Timeframe
The FOMC’s recent decision to pause the interest rate led to a continued bearish outcome on the US Dollar. Price action on the US Dollar is, however, at this time approaching another key price action area. The price action heading into the demand zone seems solid, so we must exercise caution before deciding. Nonetheless, the confirmations for a bullish reversal include the following:
- Trendline support
- Drop base rally demand zone
- Pivot zone on the Daily timeframe
Analyst’s Expectations:
- Direction: Bullish
- Target: 102.937
- Invalidation: 101.604
XAUUSD - 4Hour Timeframe
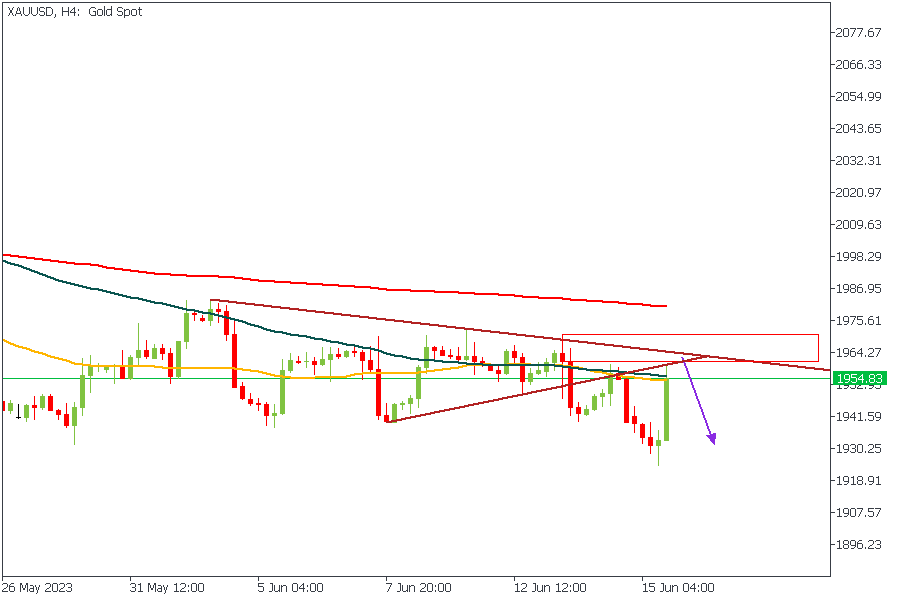
XAUUSD is at a confluence zone between two resistance trendlines. Usually, this is a typical confirmation of strong resistance pressure on the price action. However, we have additional confirmations from the 50 and 100 moving averages in this case. Another crucial factor to consider is the descending array of the moving averages - a typical bearish trend indicator. Based on these and the supply zone, I would look forward to opportunities for a clear sell entry heading into the new week.
Analyst’s Expectations:
- Direction: Bearish
- Target: 1937.66
- Invalidation: 1973.38
P.S.: The probability of this analysis playing out relies heavily on the observed price action from the US Dollar in the 4-Hour timeframe, following the sentiments above. If the US Dollar breaks below the highlighted demand zone, Gold will soar even higher. Do your due diligence to observe the charts properly for a reliable entry confirmation based on your preferred trading strategy.
CONCLUSION
The trading of CFDs comes at a risk. Thus, to succeed, you have to manage risks properly. To avoid costly mistakes while you look to trade these opportunities, be sure to do your due diligence and manage your risk appropriately.
USDCAD Faces New Bearish Risks
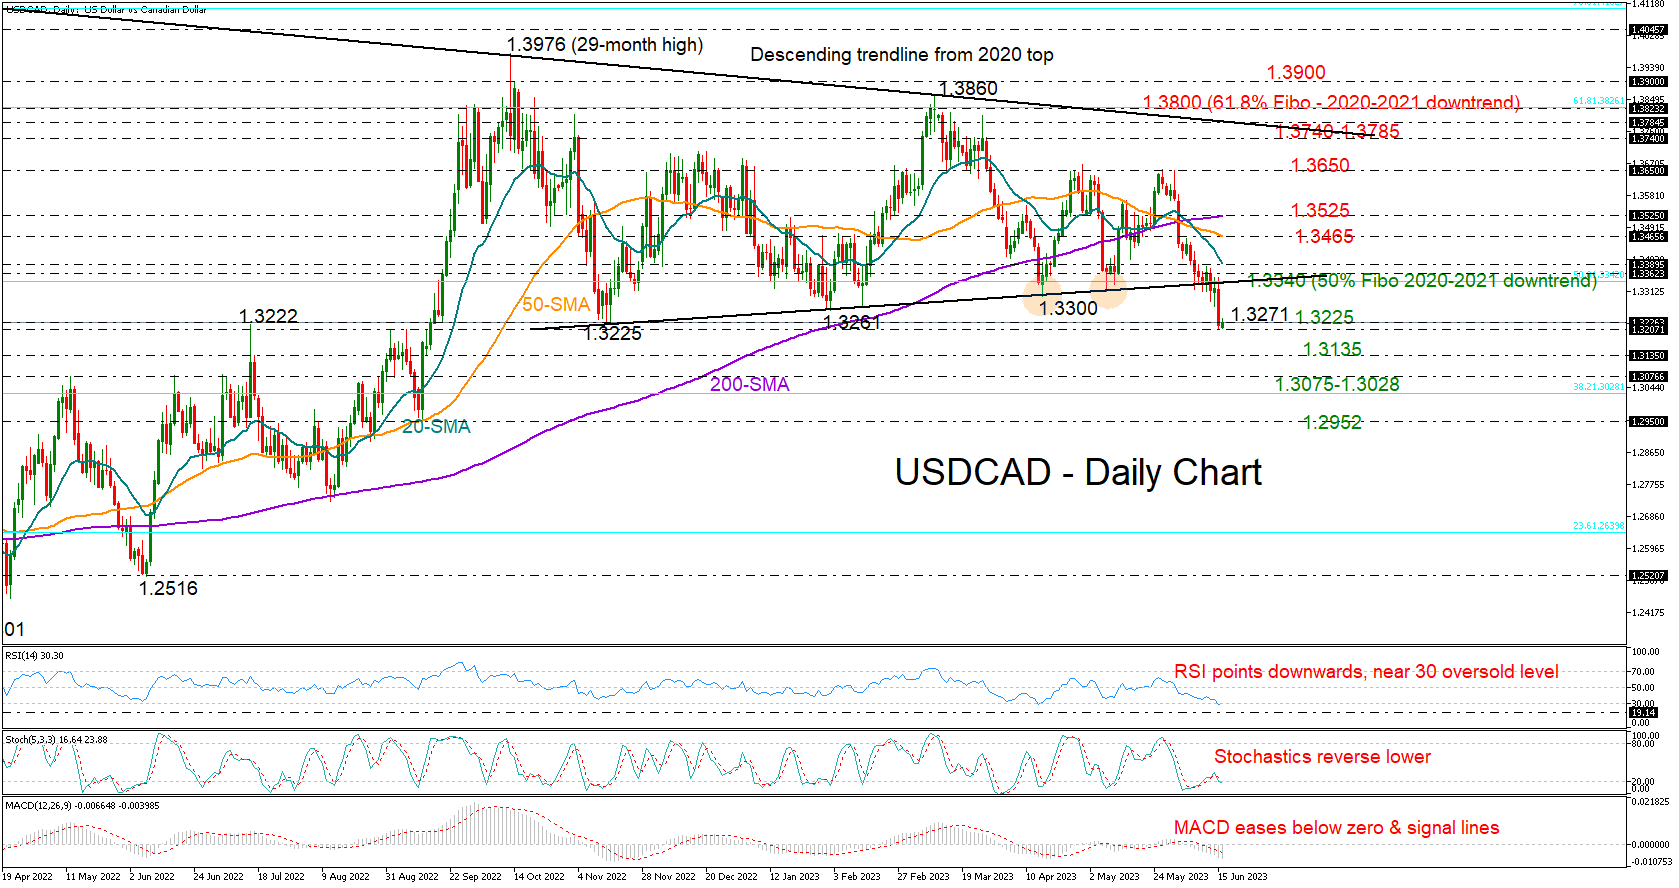
USDCAD corrected sharply lower to a nine-month low of 1.3200 on Thursday, following the close below the support trendline, which had been buffering downside movements since November.
The pair is in the third week of declines and could keep going down despite today's lack of selling pressure. The RSI and stochastic oscillator are close to oversold levels, suggesting a sideways move or upside reversal, but they are not changing direction to the upside yet. The falling MACD is also reflecting dampened market sentiment.
It’s also worthy to note that the 50- and 200-day simple moving averages (SMAs) have posted a death cross for the first time since August 2020. The 20-day SMA has crossed below the longer-term SMAs too, flagging a potential deterioration in the market trend.
Therefore, if the 1.3200 base proves fragile, the bearish wave could stretch towards the 1.3135 barrier and then revisit the 1.3075-1.3028 zone where the 38.2% Fibonacci retracement level of the 1.4667-1.2007 downleg is placed. The 1.2952 low from mid-September could be the next target.
In the case the price edges above the July-November constraining zone of 1.3225, the bulls may revisit the almost flat broken trendline and the 23.6% Fibonacci mark of 1.3340. A decisive close above that border is required to generate fresh buying interest. If efforts prove successful, with the price also piercing through the 20-day SMA, the next resistance could occur somewhere between the 50- and 200-day SMAs at 1.3465 and 1.3525 respectively. Another victory for the bulls here could clear the way towards the tough resistance of 1.3650.
Summing up, a new bearish threat could emerge in USDCAD, but traders need to wait for a confirmation signal below the 1.3200 psychological mark.
AUDJPY Reaches New 2023 High in Exponential Move Since Early June
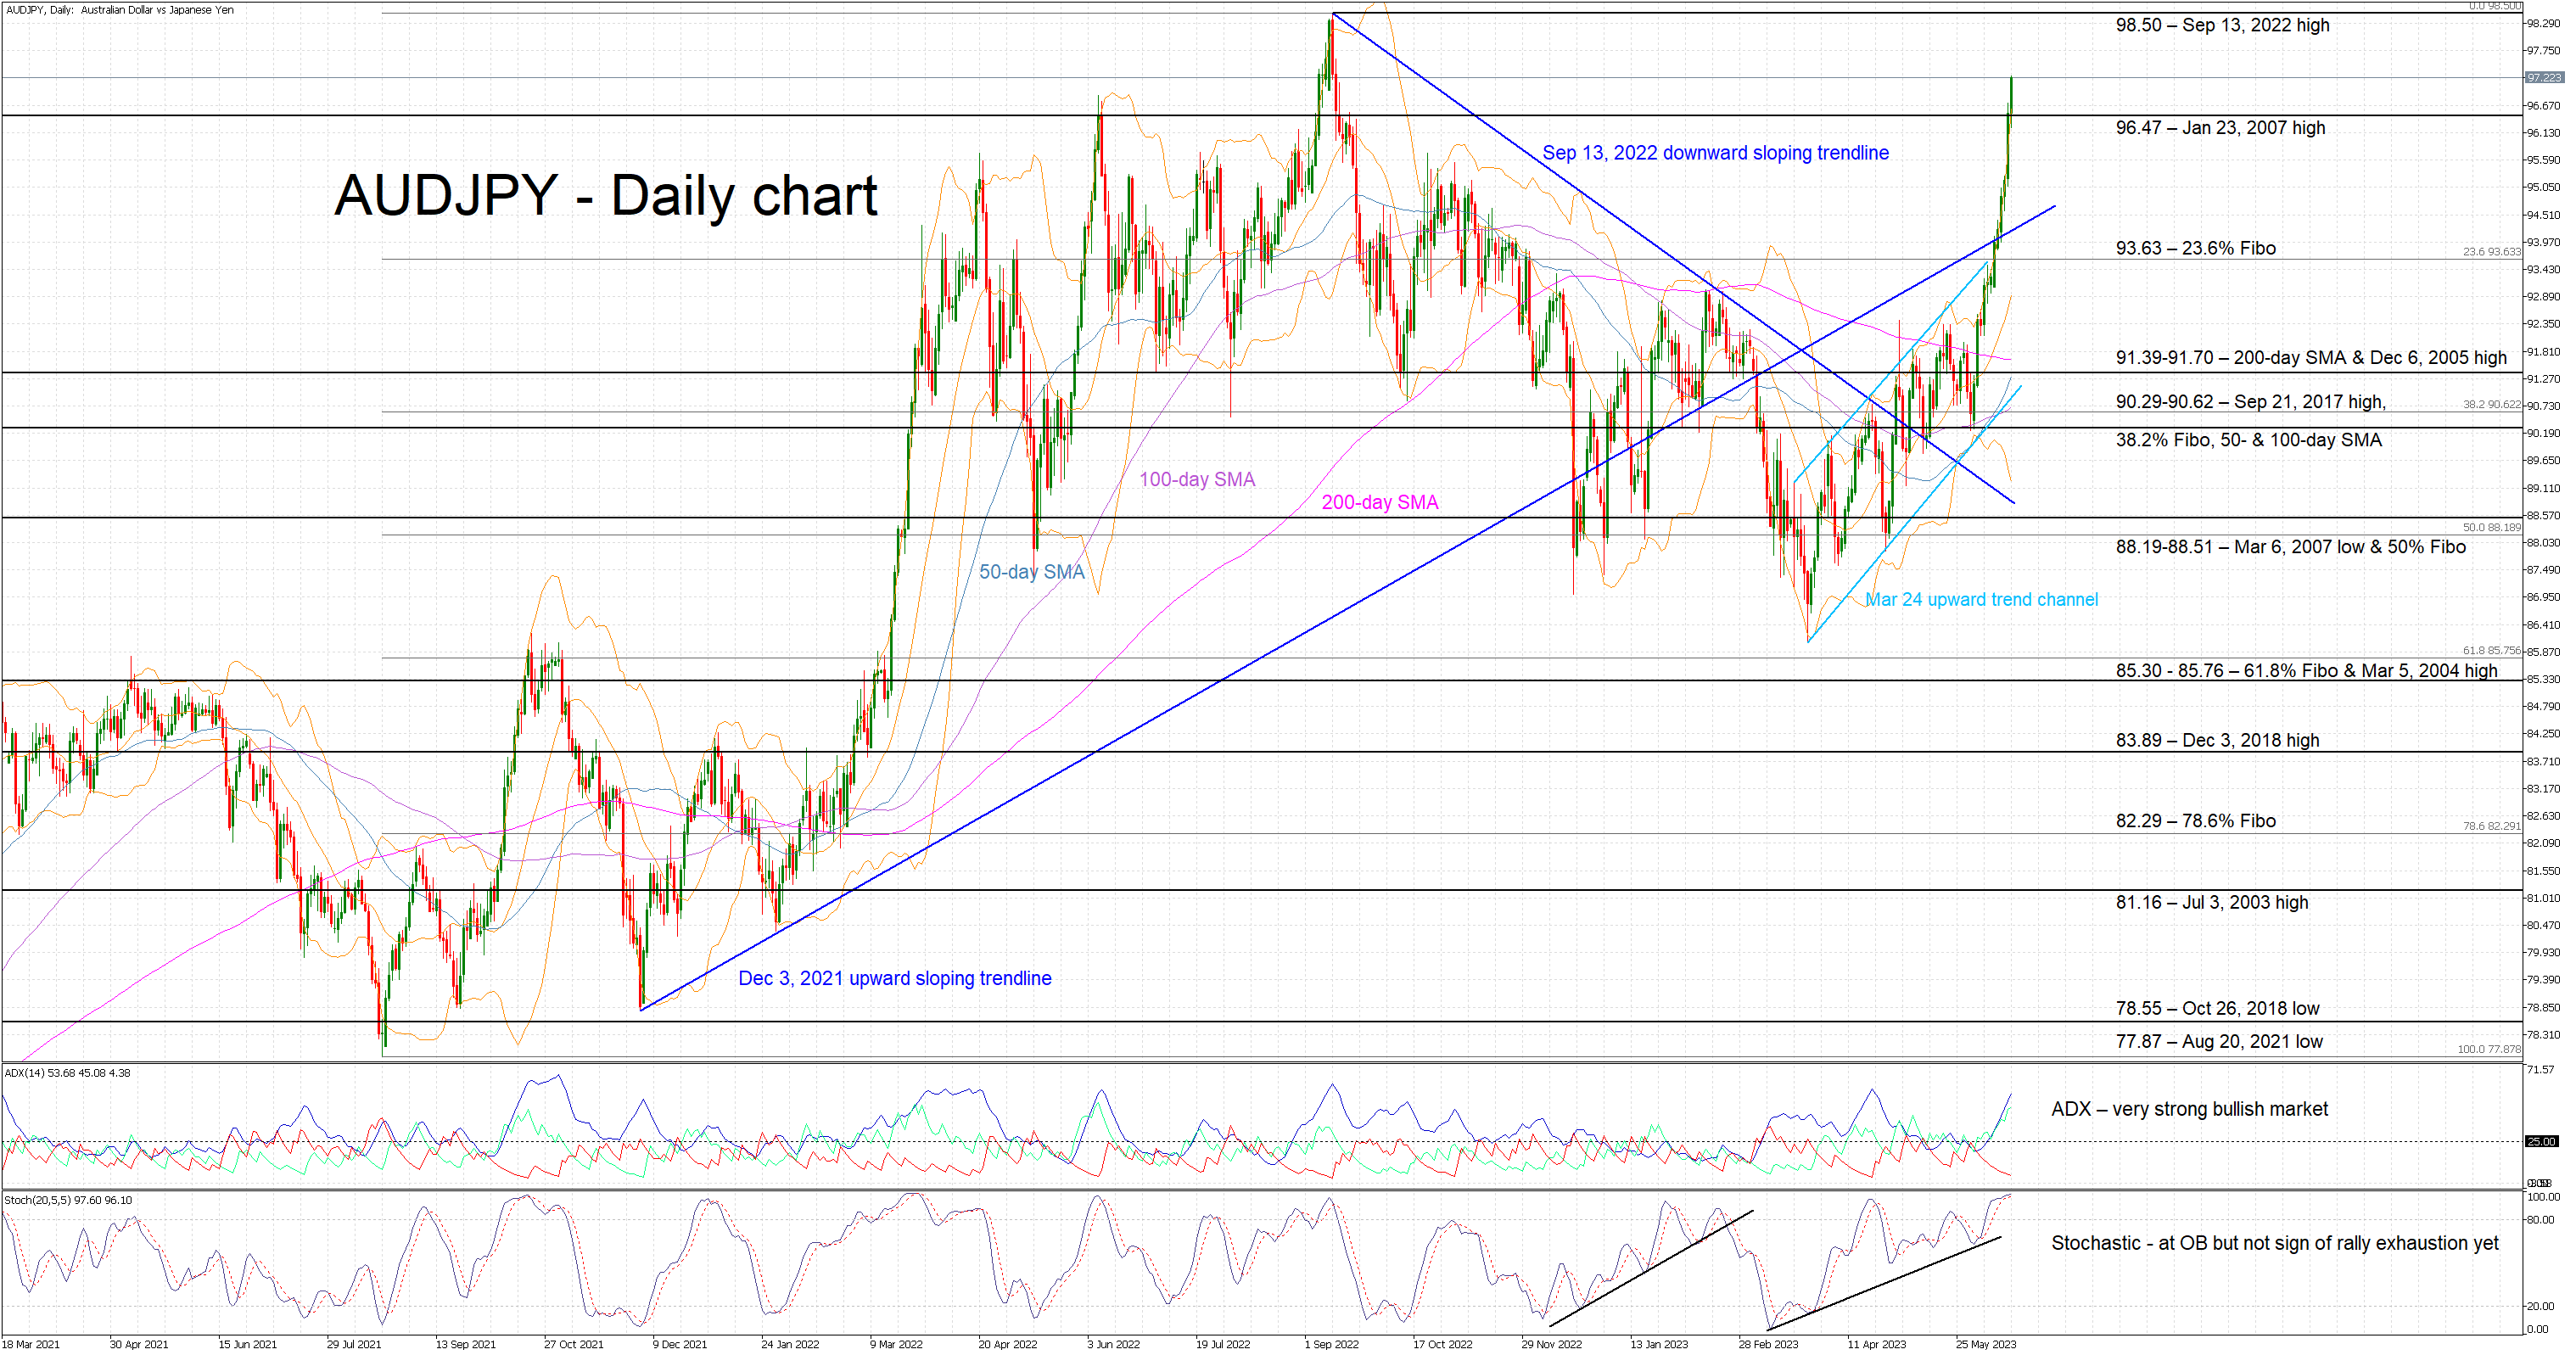
AUDJPY has been recording an exponential move since early June, registering nine consecutive green candlesticks. This is an undeniable confirmation of the underlying strength of the current upleg that pushed this pair to the highest level since September 14, 2022. AUDJPY is now hovering just above the 96.47 level with the bears trying to find an appropriate area to set up their defence.
In the meantime, the Average Directional Movement Index (ADX) has risen to the highest level since mid-April, signaling an aggressive trending market. Any signs of stabilization at this high level could be seen as an indication of rally exhaustion. Similarly, the stochastic oscillator is scraping the top of its overbought (OB) territory, supporting the higher high seen in AUDJPY.
If the bulls remain confident, they would try to keep this pair above the January 23, 2007 high of 96.47. If successful, they could then plot their path towards the September 13, 2022 high of 98.50 and register a new 2023 high.
On the other hand, the bears are desperately looking to put a stop to the current upleg and are expecting the first red candlestick. They would love a push below the 96.47 level and then gradually reduce their losses by engineering a correction towards the 23.6% Fibonacci retracement of the August 20, 2021 – September 13, 2022 downtrend at 93.63.
To sum up, AUDJPY bulls continue to control the market with the technical picture on their side. The first red candlestick could reinvigorate the bears as they attempt to limit their losses.
EUR/USD Analysis: +1.4% in 2 Days
The current high growth rate, which was last seen in November 2022, was the result of decisions by central banks:
→ on Wednesday, the US Federal Reserve kept the interest rate at 5.25%;
→ and on Thursday, the ECB raised the rate from 3.75% to 4%. Eurozone inflation will remain "too high for too long," Lagarde said. The possibility of a rate hike in July is "very likely".
If the Fed started to apply the tightening policy earlier and came to a pause in a series of rate hikes faster, in turn the ECB is taking similar actions, but with some lag in time.
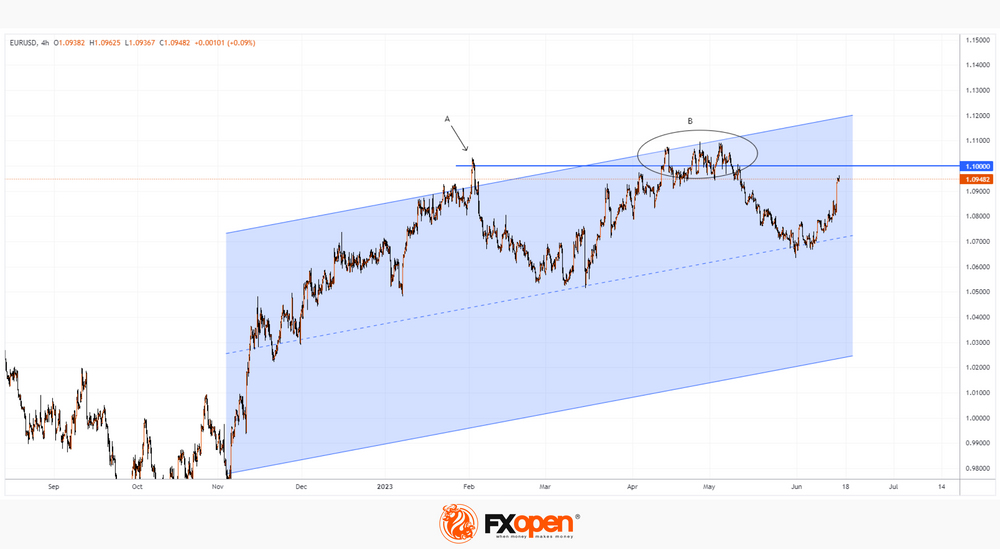
On Friday morning, the EUR/USD rate reached 1.096. The EUR/USD chart shows that:
→ price dynamics continues to develop an upward channel (shown in blue);
→ the EUR/USD rate is approaching the psychological mark of 1.1. If in February the bulls suffered a quick setback (A), and in April-May they managed to linger (B) around this mark, then the continuation of the current momentum can lead to a successful bullish breakout and fixing the rate above 1.1.
AUD/USD and NZD/USD Regain Strength
AUD/USD is gaining pace and might climb further higher above 0.6900. NZD/USD is also showing positive signs above the 0.6200 resistance zone.
Important Takeaways for AUD USD and NZD USD Analysis Today
- The Aussie Dollar started a fresh increase above the 0.6780 and 0.6830 levels against the US Dollar.
- There is a key bullish trend line forming with support near 0.6830 on the hourly chart of AUD/USD at FXOpen.
- NZD/USD is gaining bullish momentum above the 0.6200 support.
- There is a major bullish trend line forming with support near 0.6200 on the hourly chart of NZD/USD at FXOpen.
AUD/USD Technical Analysis
On the hourly chart of AUD/USD at FXOpen, the pair started a fresh increase from the 0.6740 support. The Aussie Dollar was able to clear the 0.6780 resistance to start a steady uptrend against the US Dollar.
There was a close above the 0.6830 resistance and the 50-hour simple moving average. Finally, the pair tested the 0.6890 zone. A high is formed near 0.6892 and the pair is now consolidating gains. The AUD USD chart indicates that the pair is now facing resistance near 0.6892.
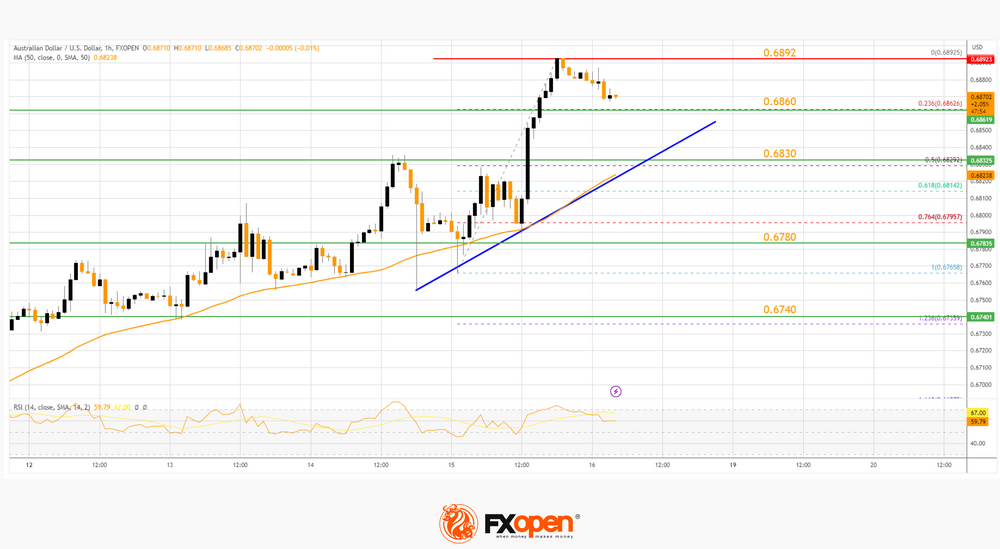
The first major resistance might be 0.6900. An upside break above the 0.6900 resistance might send the pair further higher. The next major resistance is near the 0.6950 level. Any more gains could open the doors for a move toward the 0.7000 resistance zone.
On the downside, initial support is near the 23.6% Fib retracement level of the upward move from the 0.6765 swing low to the 0.6892 high at 0.6860.
The next support could be a major bullish trend line at 0.6830 and the 50-hour simple moving average. It is close to the 50% Fib retracement level of the upward move from the 0.6765 swing low to the 0.6892 high.
If there is a downside break below the 0.6830 support, the pair could extend its decline toward the 0.6780 level. Any more losses might signal a move toward 0.6740.
NZD/USD Technical Analysis
On the hourly chart of AUD/USD on FXOpen, the pair formed a base above the 0.6100 level. The New Zealand Dollar started a steady increase above the 0.6150 resistance against the US Dollar.
The pair settled above 0.6200 and the 50-hour simple moving average. It tested the 0.6245 zone and is currently consolidating gains above the 23.6% Fib retracement level of the recent increase from the 0.6153 swing low to the 0.6246 high.
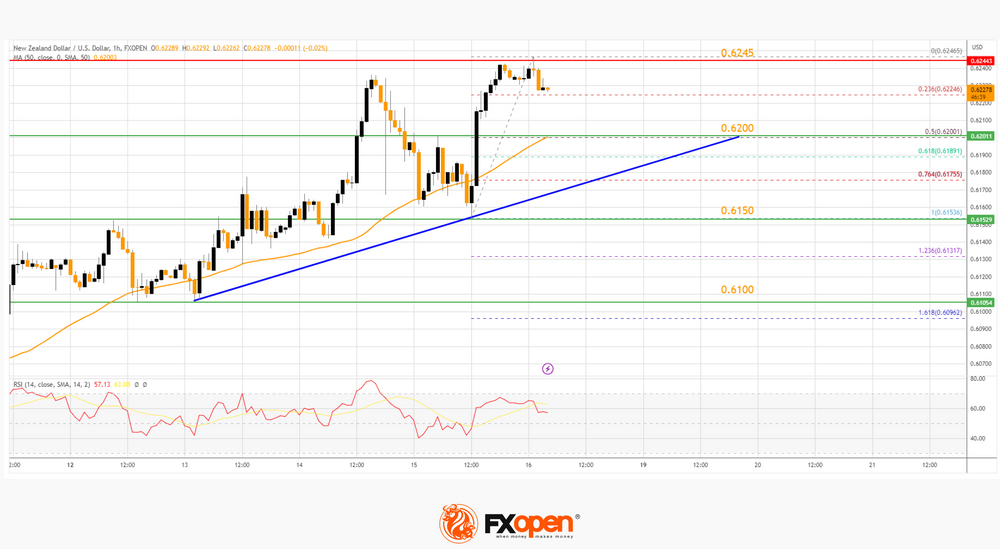
The NZD USD chart suggests that the RSI is declining and the pair might correct lower. On the downside, there is key support forming near a bullish trend line at 0.6200 and the 50-hour simple moving average.
The trend line is near the 50% Fib retracement level of the recent increase from the 0.6153 swing low to the 0.6246 high. The next major support is near 0.6150.
If there is a downside break below the 0.6150 support, the pair might slide toward the 0.6100 support. Any more losses could send NZD/USD toward 0.6050.
On the upside, the pair might struggle near 0.6245. The next major resistance is near the 0.6260 level. A clear move above the 0.6260 level might even push the pair toward the 0.6300 level. Any more gains might open the doors for a move toward the 0.6350 resistance zone in the coming days.
EUR/USD Technical Analysis
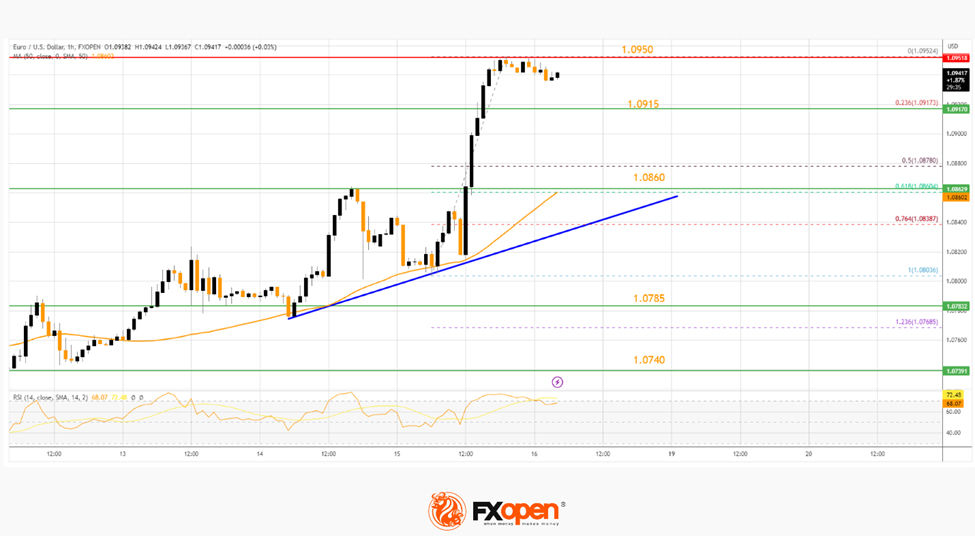
On the hourly chart of EUR/USD at FXOpen, the pair started a strong increase from the 1.0785 level. The Euro was able to clear the 1.0860 resistance against the US Dollar.
The bulls were able to push the pair above the 50-hour simple moving average and 1.0900. It is now consolidating gains below the 1.0950 resistance zone. The next major resistance is near the 1.0965 zone.
A break above the 1.0965 resistance zone could send EUR/USD toward the 1.1000 zone. A close above the 1.1000 level might send the pair further higher toward the 1.1050 resistance.
Conversely, the pair might start a downside correction toward 1.0915. The next major support is near a connecting bullish trend line at 1.0860, below which EUR/USD could test the 1.0785 support. Any more losses could send the pair to 1.0740.
USD/CAD Daily Outlook
Daily Pivots: (S1) 1.3169; (P) 1.3262; (R1) 1.3314; More....
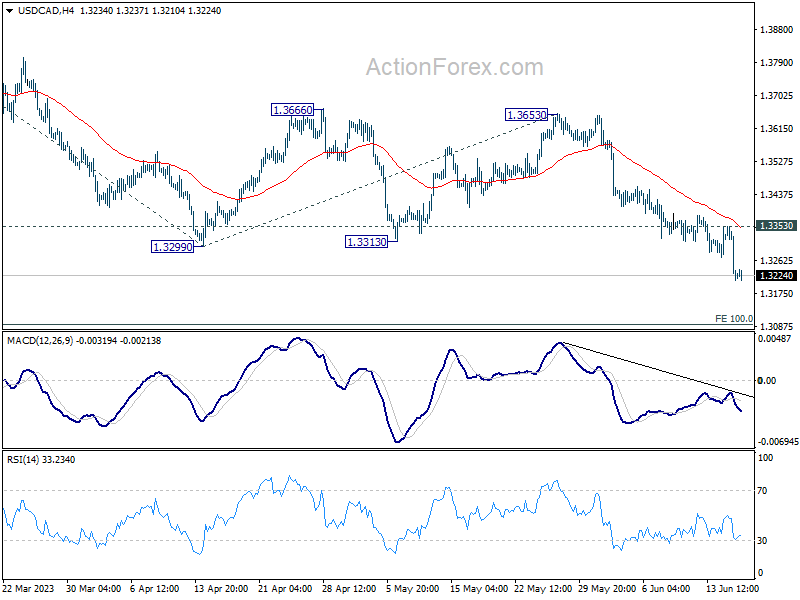
USD/CAD's decline extends further and the development suggests that it's in a deeper corrective decline. Intraday bias stays on the downside for 100% projection of 1.3860 to 1.3299 from 1.3653 at 1.3092 next. On the upside, above 1.3353 minor resistance will turn intraday bias neutral and bring consolidations first, before staging another fall.
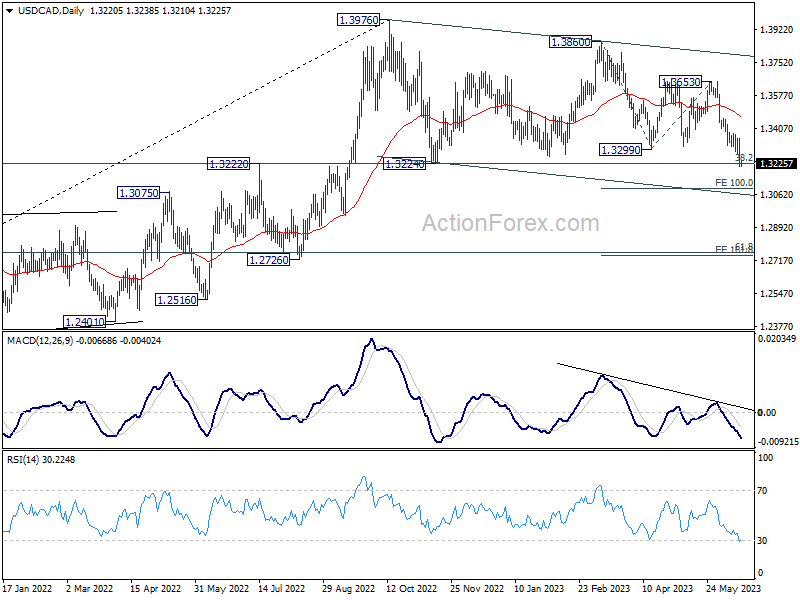
In the bigger picture, price actions from 1.3976 are still viewed as a correction to up trend from 1.2005 (2021 low), but chance of trend reversal is increasing with current decline. But in either case, sustained trading below 38.2% retracement of 1.2005 to 1.3976 at 1.3233 will pave the way to 61.8% retracement at 1.2758. Risk will stay on the downside as long as 1.3653 resistance holds, even in case of strong rebound.
AUD/USD Daily Report
Daily Pivots: (S1) 0.6802; (P) 0.6848; (R1) 0.6928; More...
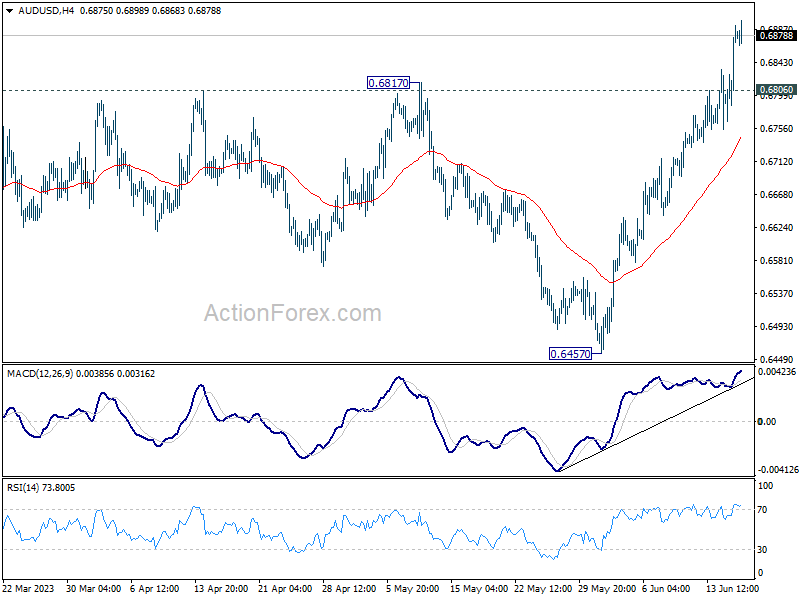
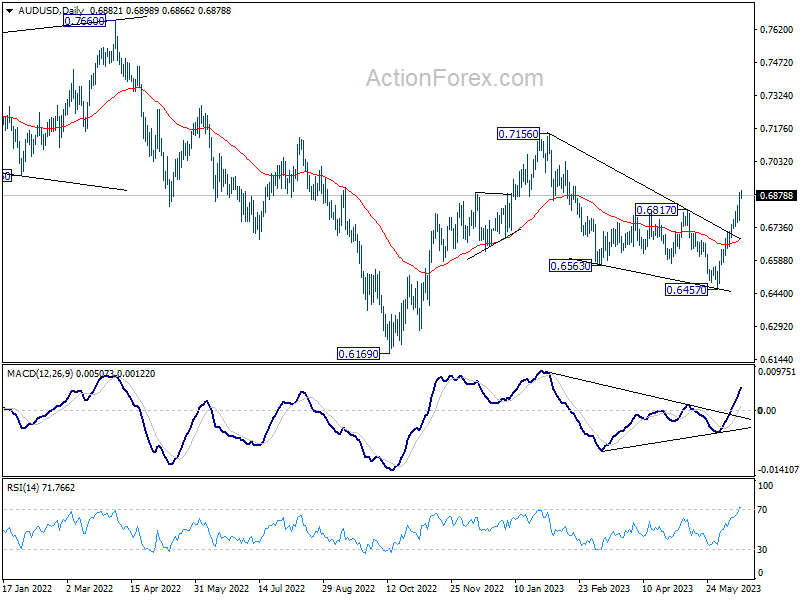
AUD/USD's rally accelerates to as high as 0.6898 so far today. The strong break of 0.6817 resistance should confirm that corrective fall from 0.7156 has completed with three waves down to 0.6457. Intraday bias remains on the upside for retesting 0.7156 high next. On the downside, below 0.6806 minor support will turn intraday bias neutral and bring consolidations first, before staging another rally.
In the bigger picture,decline from 0.7156 could have completed in a three wave corrective structure at 0.6457. The development argues that rise from 0.6169 (2022 low) is still in progress. Firm break of 0.7156 will also add to the case that whole down trend from 0.8006 (2021 high) has finished and turn medium term outlook bullish. For now this will be the favored case as long as 0.6457 support holds, even in case of deep pull back.
EUR/USD Daily Outlook
Daily Pivots: (S1) 1.0849; (P) 1.0901; (R1) 1.0998; More...
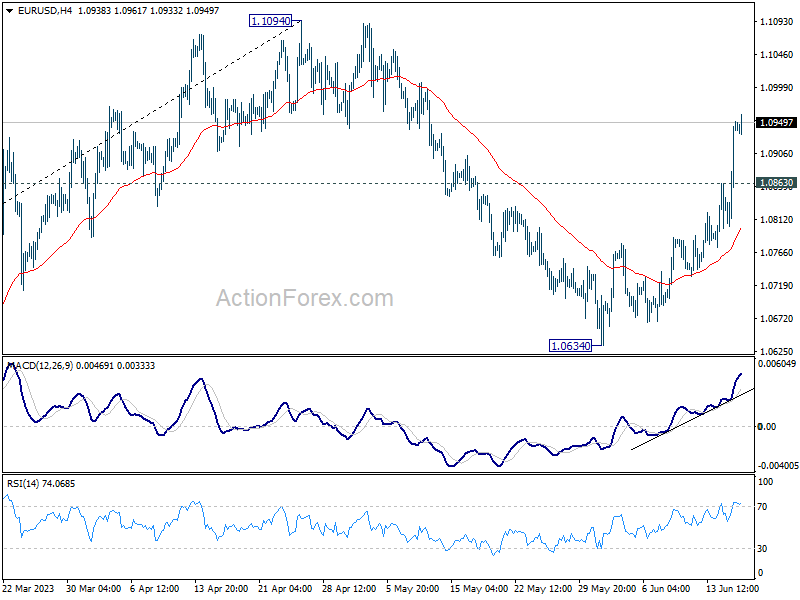
Intraday bias in EUR/USD remains on the upside at this point. Rise from 1.0634 is in progress to retest 1.1094 high. Decisive break there will confirm resumption of whole up trend from 0.9534. On the downside, below 1.0863 minor support will turn intraday bias neutral first.
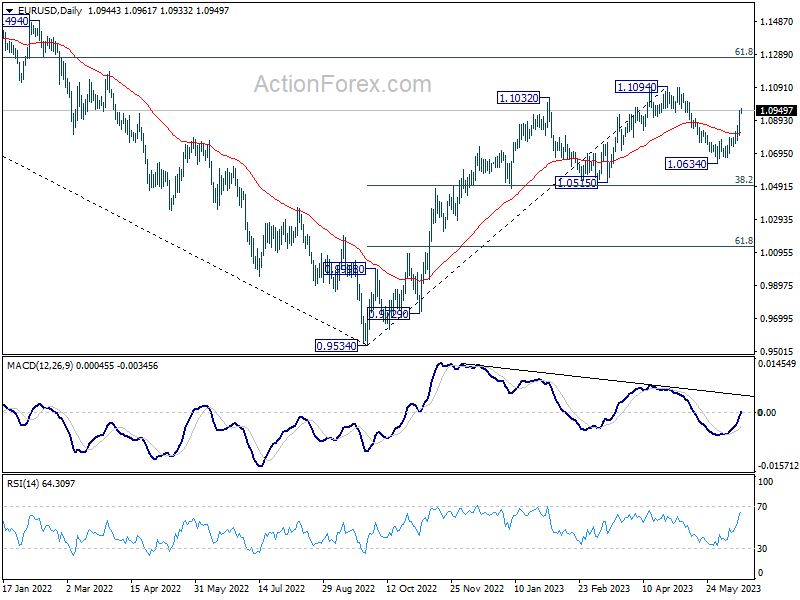
In the bigger picture, as long as 1.0515 support holds, rise from 0.9534 (2022 low) would still extend higher. Sustained break of 61.8% retracement of 1.2348 (2021 high) to 0.9534 at 1.1273 will solidify the case of bullish trend reversal and target 1.2348 resistance next (2021 high).
GBP/USD Daily Outlook
Daily Pivots: (S1) 1.2681; (P) 1.2734; (R1) 1.2837; More...
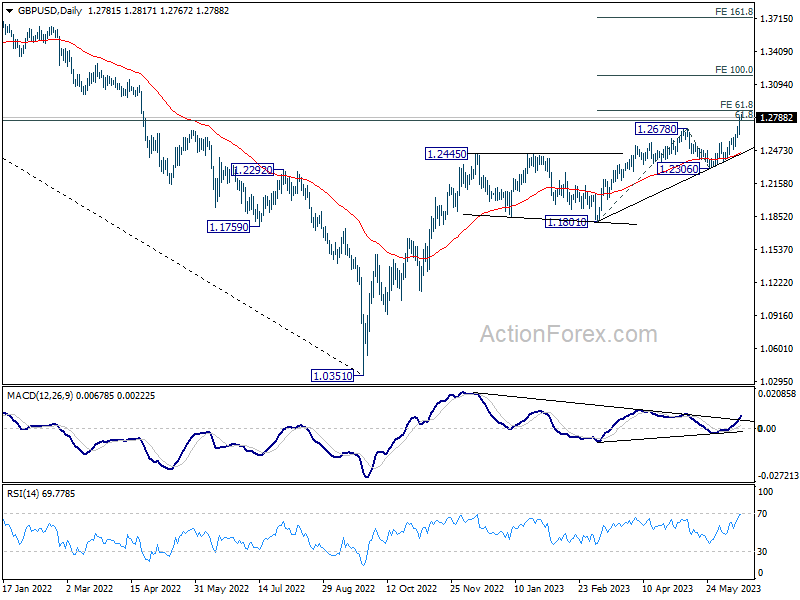
GBP/USD's accelerates to as high as 1.2817 so far today. Intraday bias stays on the upside for 61.8% projection of 1.1801 to 1.2678 from 1.2306 at 1.2848. Decisive break there will target 100% projection at 1.3183 next. On the downside, below 1.2697 minor support will turn intraday bias neutral and bring consolidations first, before staging another rally.
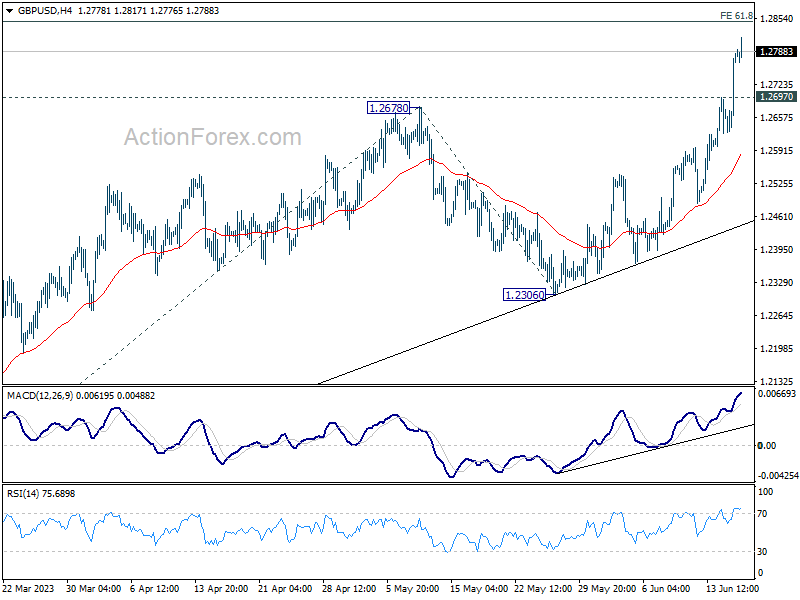
In the bigger picture, as long as 1.2306 support holds, rise from 1.0351 medium term bottom (2022 low) is expected to extend further. Sustained break of 61.8% retracement of 1.4248 (2021 high) to 1.0351 at 1.2759 will add to the case of long term bullish trend reversal. Next medium term target will then be 1.4248 key resistance.