

Sample Category Title
Gold Technical: Potential Breakdown to Resume Short-Term Downtrend
Gold Technical: Potential Breakdown to Resume Short-Term Downtrend
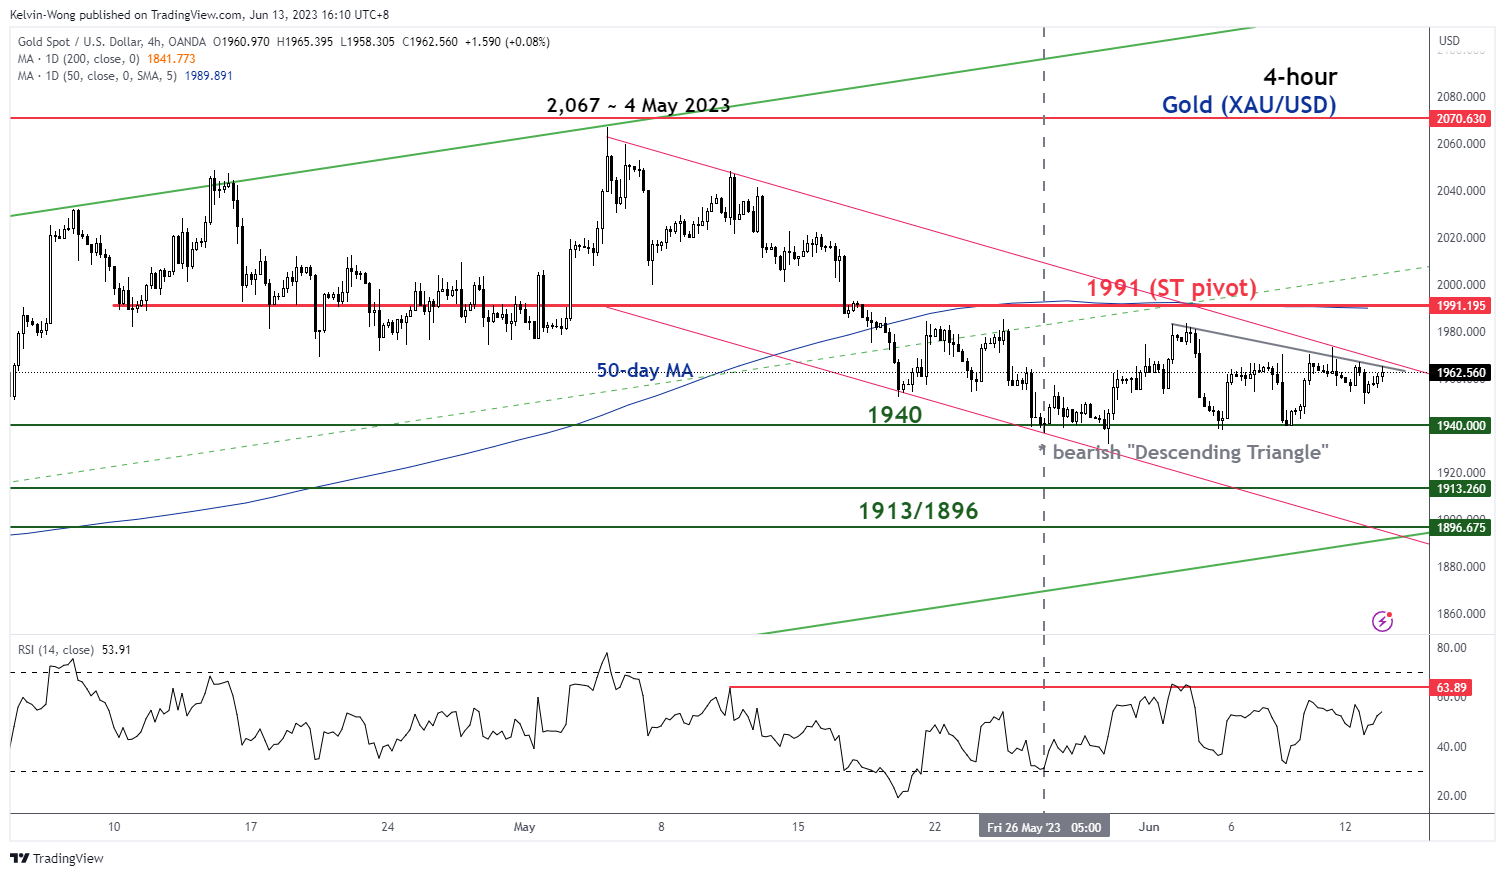
- In the past 3 weeks, Gold (XAU/USD) has been evolving with a minor “Descending Triangle” with its range support at US$1,940.
- Price actions have failed to surpass the 50-day moving average now acting as a resistance at US$1,991.
- Short-term downtrend phase from the 4 May 2023 high remains intact.
Fig 1: Gold (XAU/USD) major trend as of 13 Jun 2023 (Source: TradingView, click to enlarge chart)
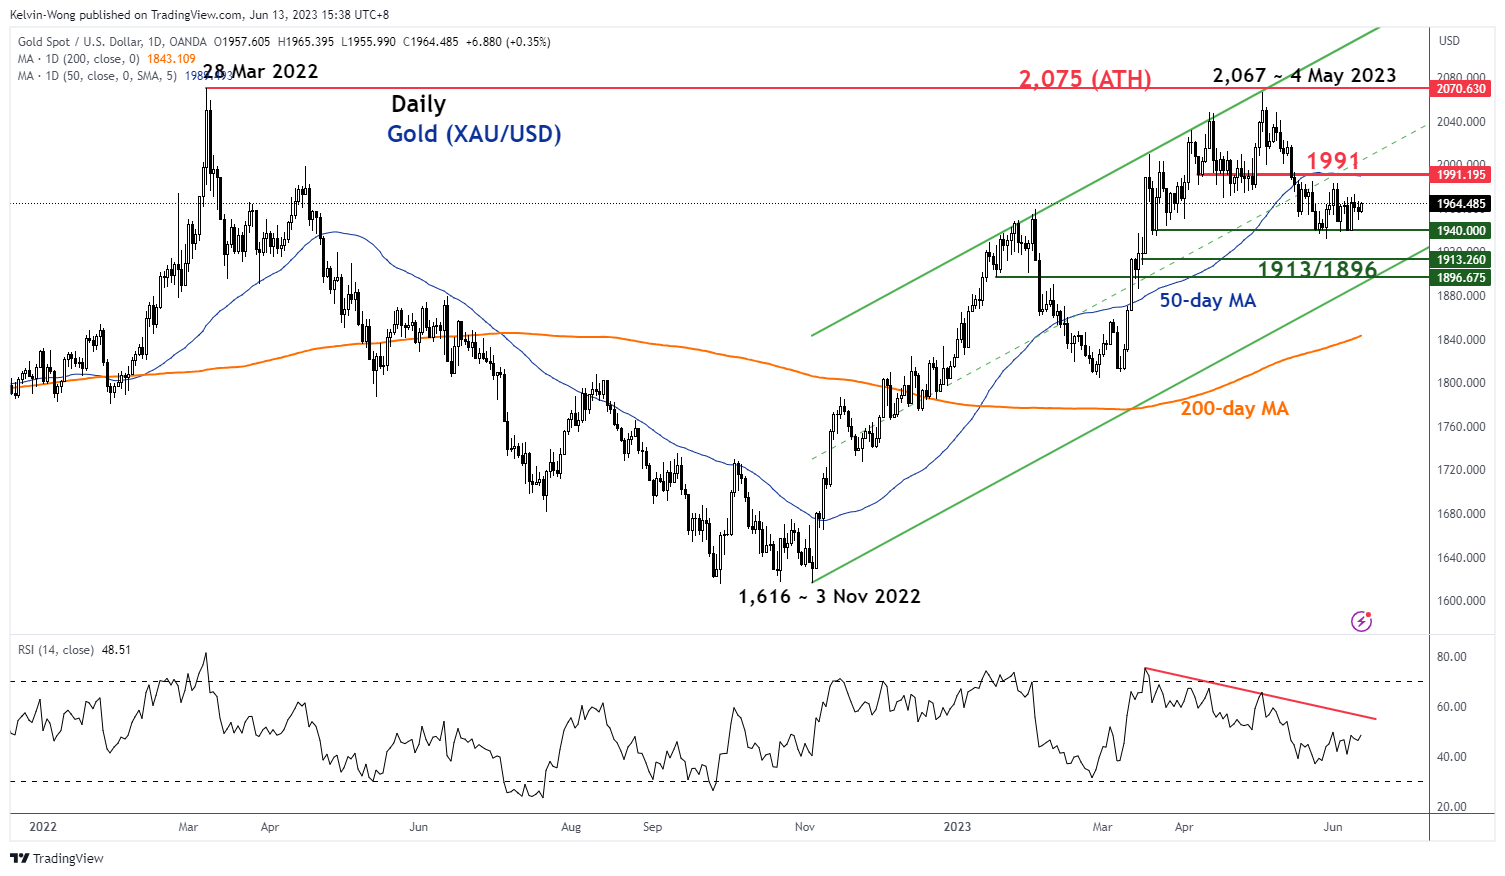
Fig 2: Gold (XAU/USD) short-term trend as of 13 Jun 2023 (Source: TradingView, click to enlarge chart)
This is a follow-up to our previous analysis, “Gold Technical – a potential short-term downtrend in play” published on 22 May 2023.
The price actions of Gold (XAU/USD) have declined by -2.2% since 22 May and hit the support of US$1,940 on 26 May.
Sideways within a bearish “Descending Triangle” range configuration in the past 3 weeks
Since the test on its US$1,940 support on 26 May 2023, Gold (XAU/USD) has traded sideways and retested US$1,940 on three occasions within the past 3 weeks. The price reactions that bounced off the US$1,940 support have been lacklustre as they formed “lower highs” which gave rise to the formation of a bearish “Descending Triangle” range configuration (refer to the 4-hour).
Minor short-term downtrend phase from the 4 May 2023 high remains intact
Since its 4 May 2023 high of US$2,067 (also its current 52-week high), Gold (XAU/USD) has been evolving within a short-term downtrend phase within a major uptrend phase in place since 3 November 2022 low of US$1,616 (see daily chart)
US$1,991 remains the key short-term pivotal resistance to maintain the short-term bearish tone and a break below the minor “Descending Triangle” range support of US$1,940 exposes the medium-term support zone of US$1,913/1,896 (also the lower boundary of the major ascending channel from 3 November 2022 low).
However, a clearance above US$1,991 sees the next resistance coming in at US$2,067/2,075.
Aussie Edges Higher Despite Lukewarm Confidence Data, US Inflation Next
- Australian consumer confidence holds steady, business confidence falls
- US inflation expected to ease
- Inflation release could be a game-changer for Fed decision on Wednesday
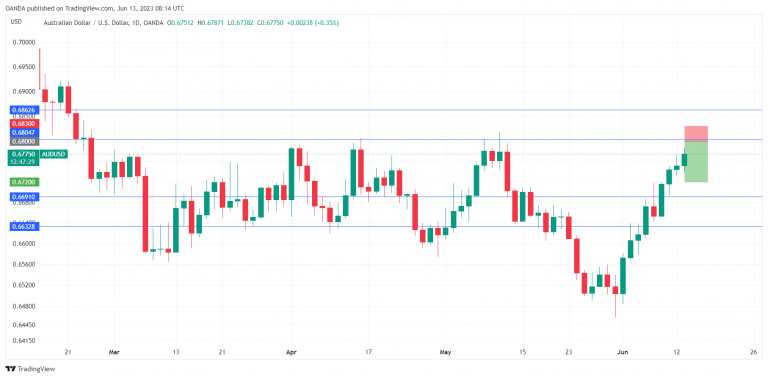
The Australian dollar remains on a roll and is trading at 0.6775, up 0.35% on the day. The Aussie has been a tear in June, surging 4.15% against the US dollar.
Australia released lukewarm confidence data today, but that didn’t put a crimp in the Australian dollar’s upswing, which has continued for a fourth straight day. Westpac Consumer Confidence posted a small 0.2% gain in June, after a 7.9% plunge in May. The index remains at weak levels as consumers have been hammered by the cost-of-living crisis and high interest rates.
The NAB Business Confidence Index slipped into negative territory in May with a reading of -4. This was below the April reading and consensus of zero. Business conditions also weakened in May. The business sector is concerned that the RBA’s aggressive rate policy may not achieve a soft landing and economic conditions will deteriorate.
All eyes on US inflation
After a light data calendar on Monday, the week gets busy with the US inflation report today and the FOMC rate decision on Wednesday.
US inflation has been heading lower, and the trend is expected to continue in the May report. Headline CPI is projected to fall from 4.9% to 4.1% and core CPI is expected to ease from 5.5% to 5.3%. The Fed’s tightening policy has succeeded in pushing inflation lower, but the question is whether the Fed feels that inflation is dropping fast enough.
Market rate pricing has been swinging wildly for weeks, as expectations of a pause in rates switched to a hike and back to a pause. Currently, the markets have priced in a pause at 75%, with an outside chance of a rate hike. Today’s inflation release could be a game-changer if it is hotter than expected, as that could convince the Fed to increase rates on Wednesday. If the Fed decides to stay on the sidelines, we could end up with a “hawkish skip” in which the Fed takes a breather but signals that more rate hikes are coming in the second half of the year.
AUD/USD Technical
- AUD /USD is putting pressure on resistance at 0.6804. Next, there is resistance at 0.6863
- 0.6691 and 0.6632 are providing support
NZD/USD: Intermediate Impulse (C) May Soon Complete Global Correction
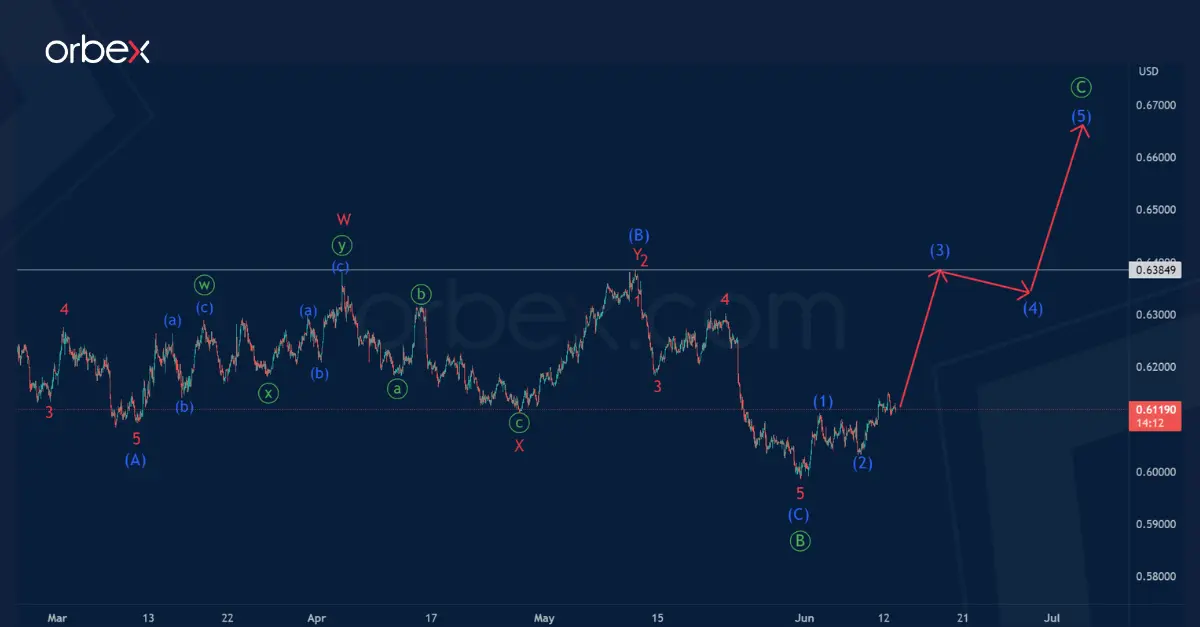
The NZDUSD pair is presumably building a correction pattern. We can see a zigzag consisting of three primary waves Ⓐ-Ⓑ-Ⓒ.
The bearish correction Ⓑ is currently under development, its structure is similar to the standard zigzag (A)-(B)-(C). The impulse (A) and correction (B) can be considered completed, it is a minor double zigzag W-X-Y.
The pair moves down in an intermediate impulse (C) consisting of sub-waves 1-2-3-4-5, approximately to 0.591. At that level, primary correction Ⓑ will be at 61.8% of actionary wave Ⓐ.
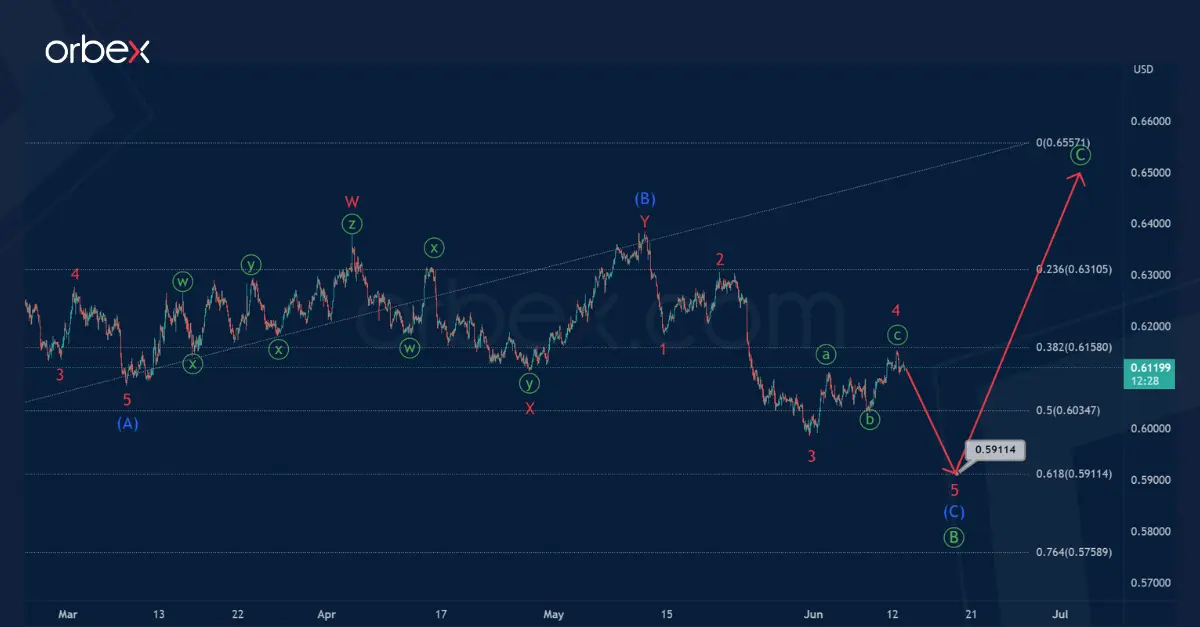
Let's assume a variant where the primary correction Ⓑ is fully formed. It is a standard intermediate zigzag (A)-(B)-(C).
Thus, in the last section of the chart, we can observe the beginning of the development of the primary wave Ⓒ. If this scenario is confirmed, we will see the development of a bullish trend.
The first target where the bulls can go is a maximum of 0.638, where the minor sub-waves W and Y were completed.
EUR/USD: Bulls Crack Key Barrier, Awaiting US Inflation Data for Fresh Signals
The Euro advanced nearly 0.5% in early Tuesday, driven by weaker dollar ahead of release of US May inflation data.
Fresh risk appetite on expectations that inflation will cool further in May and add to Fed’s plans to stay on hold in June policy meeting which starts today, as markets are currently pricing over 80% chance that the Fed will keep interest rates unchanged.
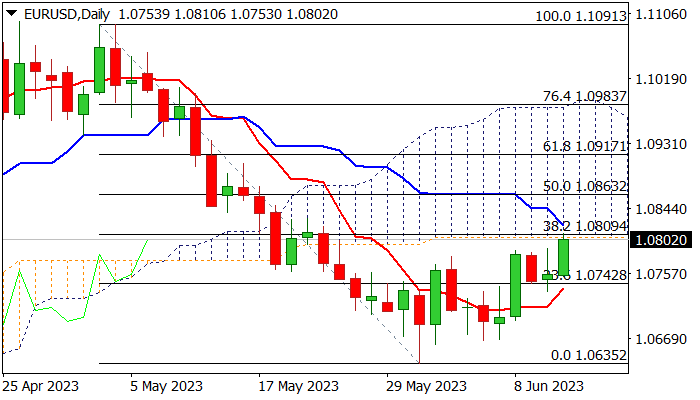
The Euro is expected to benefit from such scenario and extend recovery from 1.0635 (May 31 low).
Conversely, higher than expected US inflation in May would sour risk sentiment on negative signals to the Fed.
Fresh rally on Tuesday cracked key resistances at 1.0805/10 zone (base of thick daily cloud / Fibo 38.2% of 1.1091/1.0635 / 100DMA) but facing strong headwinds and is likely to stay around these levels and await fresh direction signals from US CPI data.
Firm break of 1.0805/10 zone would generate strong bullish signal for extension towards Fibo barriers at 1.0863 and 1.0917 (50% and 61.8% retracement respectively).
On the other hand, failure to break higher would generate initial signal of recovery stall and shift near-term risk to the downside, with dip below 10DMA (1.0734) to confirm upside rejection.
Res: 1.0810; 1.0863; 1.0917; 1.0980.
Sup: 1.0787; 1.0748; 1.0734; 1.0700.
Germany ZEW economic sentiment rose to -8.5, but current situation tumbles very sharply
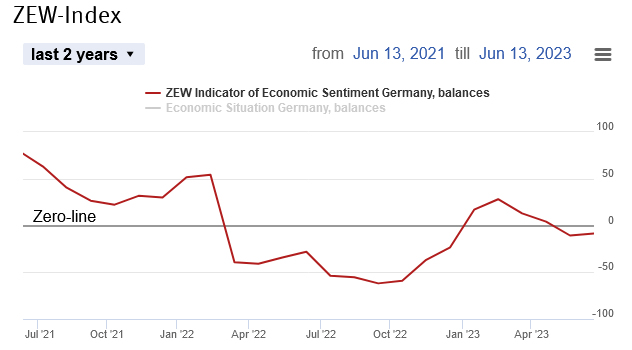
Germany ZEW Economic Sentiment rose slightly from -10.7 to -8.5 in May, above expectation of -14.7. Current Situation index, however, fell "very sharply" from -34.8 to -56.5, much worse than expectation of -40.
"The ZEW Indicator of Economic Sentiment shows a slight improvement, but it remains in negative territory. This means that experts do not anticipate an improvement in the economic situation during the second half of the year. Particularly, sectors focused on exports are likely to perform poorly due to a weak global economy. However, the current recession is generally not considered particularly alarming," comments ZEW President Achim Wambach.
Eurozone ZEW Economic Sentiment dropped from -9.4 to -10.0, above expectation of -13.1. Current Situation index dropped from -14.4 to -41.9.
Eurozone balance for short-term interest rates stands at 72.3, indicating anticipated rate hikes. On the other hand, balance for short-term interest rates for the US stands at 16.6, indicating no change in interest rates.
EURJPY Tests Restrictive Trendline Near 15-Year Peaks
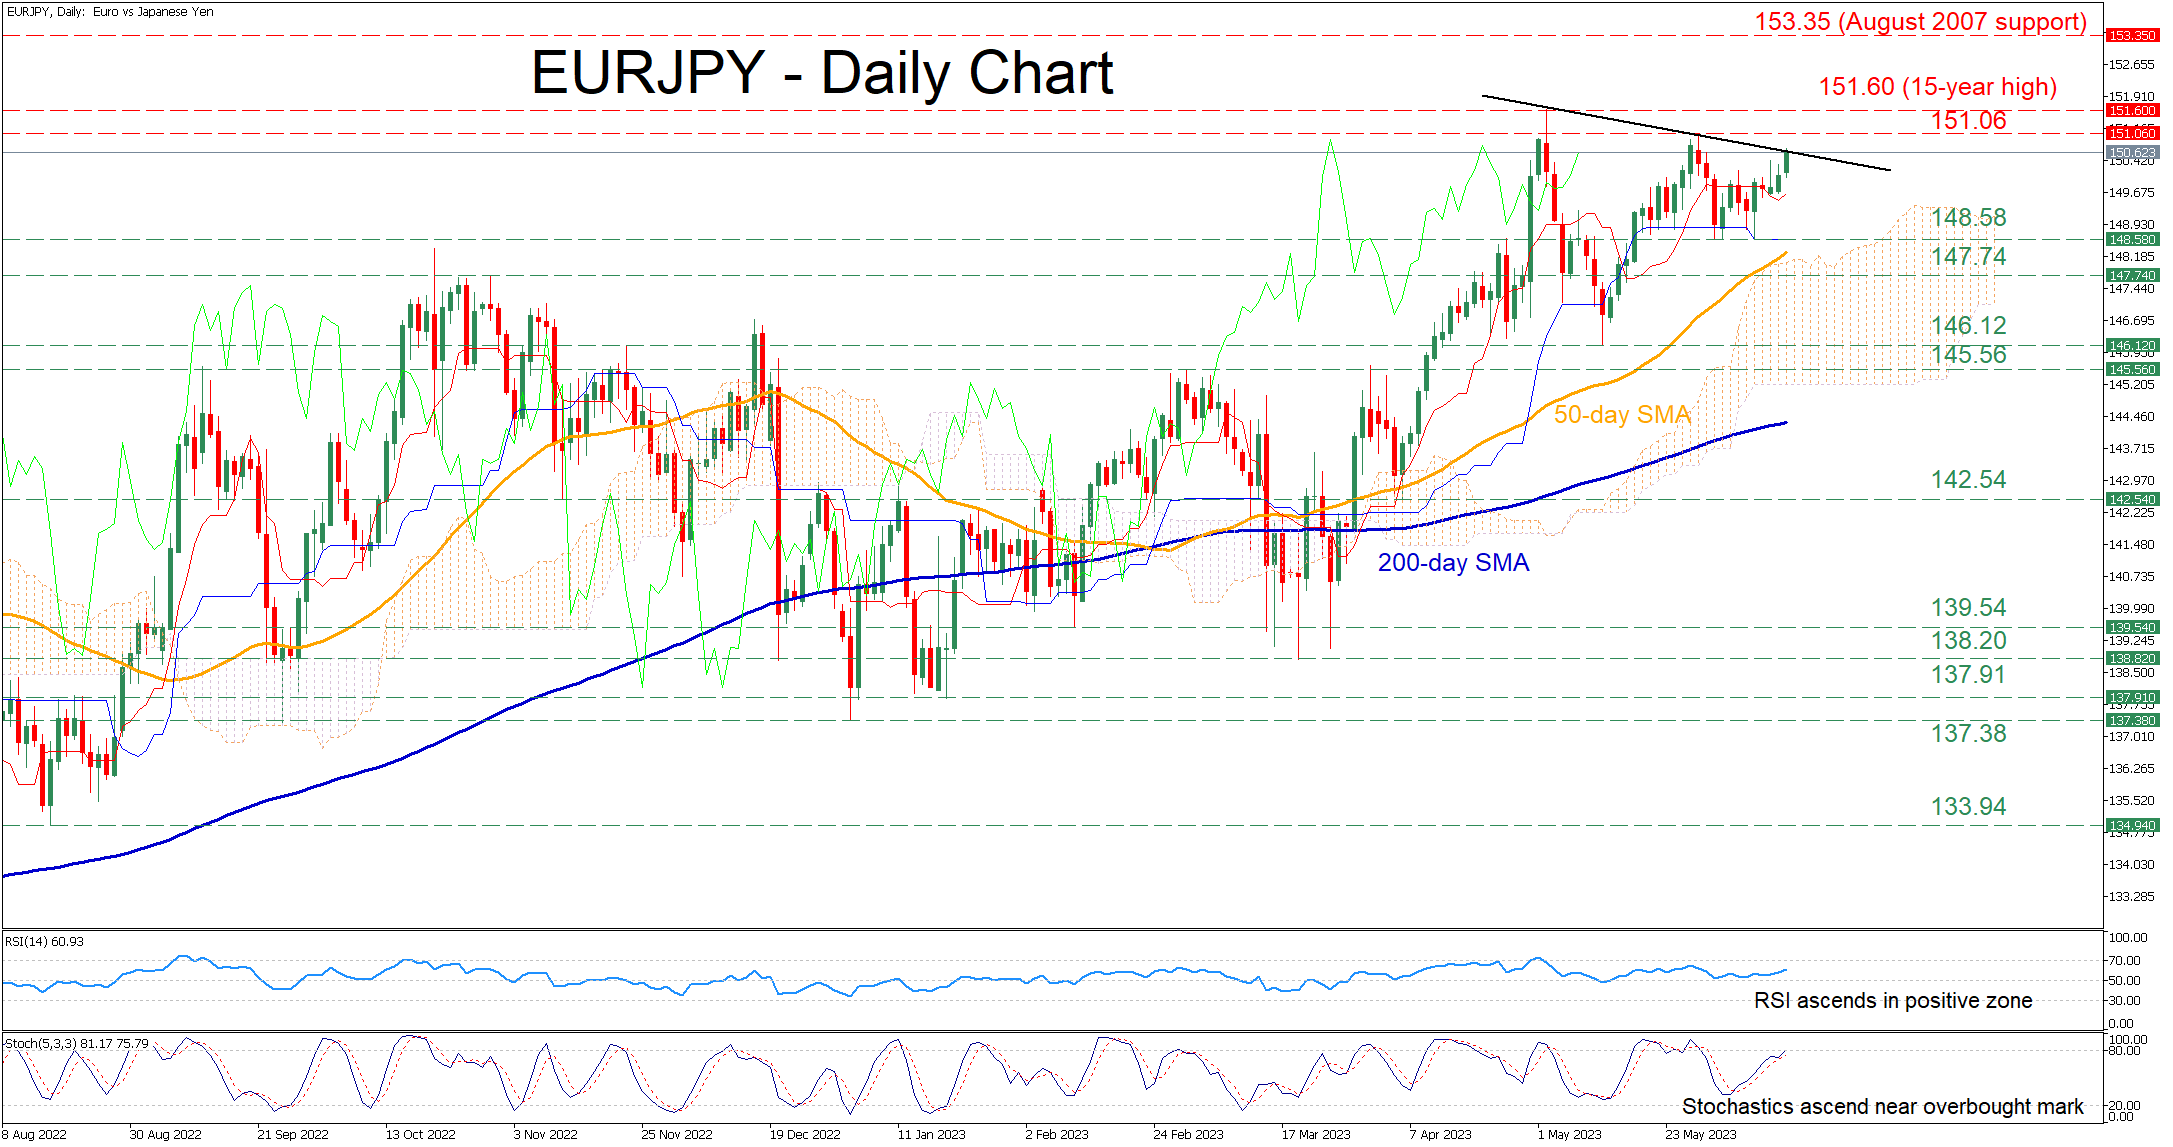
EURJPY had been in a strong uptrend, which ceased at a fresh 15-year high of 151.60 in early May before the pair corrected lower. Although it quickly found its feet and attempted a rebound, the price failed to revisit its recent multi-year peak, potentially forming a structure of lower highs but also higher lows.
The momentum indicators currently suggest that bullish forces are strengthening. Specifically, the RSI is ascending above its 50-neutral mark, while the stochastic oscillator is approaching its 80-overbought zone.
Should the price jump above the restrictive trendline taken from the pair’s recent highs, immediate resistance could be found at 151.06. A violation of that territory could set the stage for the 15-year high of 151.60. Piercing through that wall, the pair might ascend to form fresh multi-year highs, where the August 2007 support of 153.35 may cap the upside.
Alternatively, if the price bounces off the trendline and reverses lower, the recent support of 148.58 could act as the first line of defense. Trespassing that area, the October resistance of 146.74 might serve as support in the future. Should that barricade fail, the May low of 146.12 could prove to be a tough one for the bears to overcome.
Overall, EURJPY’s latest advance is currently in a critical stage as a failure to cross above the restrictive trendline could lead to a significant pullback. Nevertheless, a break above that crucial zone could open the door for the pair to test its recent multi-year highs.
GBPUSD Gets Trendline Rejection, But Bulls Still in Play
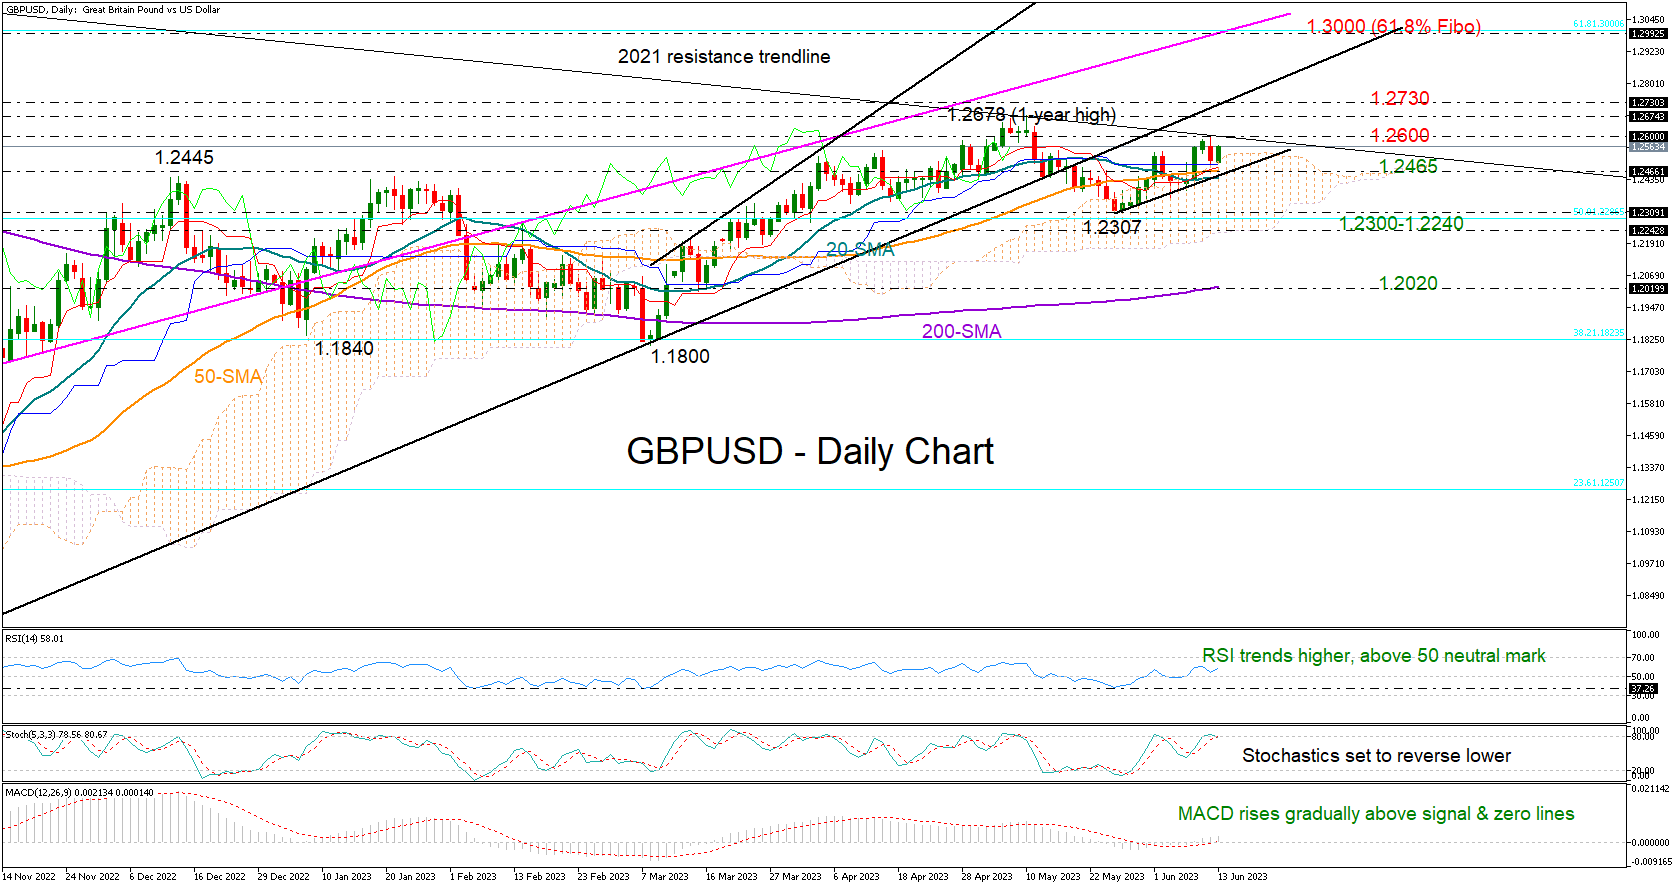
GBPUSD turned red on Monday after marking a one-month high of 1.2598 near the long-term resistance trendline, which has been capping bullish actions since the June 2021 high.
The pair switched back to recovery mode early on Tuesday, with the technical indicators reflecting appetite for a bullish breakout. The RSI is trending higher and is above its 50 neutral mark, while the MACD is gradually strengthening within the positive region and above its red signal line. The fact that the price has avoided a drop inside the Ichimoku cloud is also making additional gains possible.
Yet, only a clear extension above the resistance trendline and the 1.2600 round level could activate fresh buying orders. If that proves to be the case, the bulls may drive the pair straight up to May's high of 1.2678 and then towards the broken support trendline from the September 2022 low at 1.2730. A continuation higher could pick up pace towards the 1.3000 zone, where the 61.8% Fibonacci retracement of the 1.4248-1.0324 downtrend is placed.
Alternatively, the pair could seek support somewhere between its 20- and 50-day simple moving averages (SMAs) at 1.2465. Failure to rebound there may press the price into the 1.2300-1.2240 territory, where May’s bearish wave bottomed out. The 50% Fibonacci mark and the cloud’s lower boundary are also positioned in the same region. Therefore, a decisive close lower could spark a notable decline towards the 200-day SMA at 1.2020.
All in all, GBPUSD seems to have some extra bullish power in the tank despite a discouraging start to the week. An advance above 1.2600 could extend the uptrend to new highs.
Nasdaq 100 Technical: Squeezed Up Ahead of CPI and FOMC
Nasdaq 100 Technical: Squeezed Up Ahead of CPI and FOMC
- The mega-cap tech Nasdaq 100 resumed its daily outperformance over the S&P 500, DJIA, and Russell 2000.
- It closed at a 15-month high.
- 14,540 is the key short-term support to watch.
Fig 1: US Nas 100 medium-term trend as of 13 Jun 2023 (Source: TradingView, click to enlarge chart)
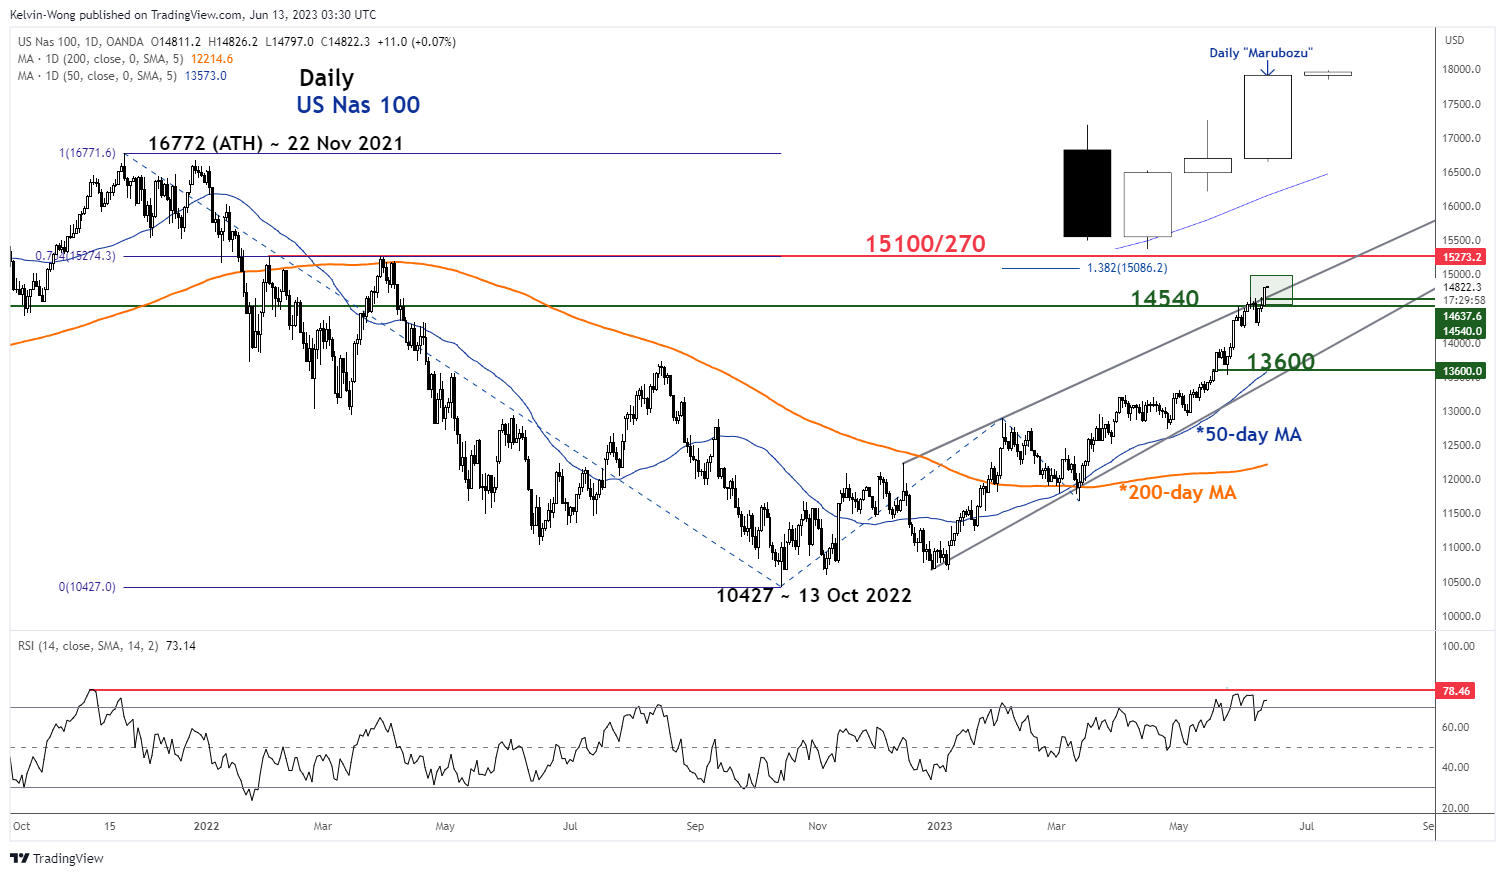
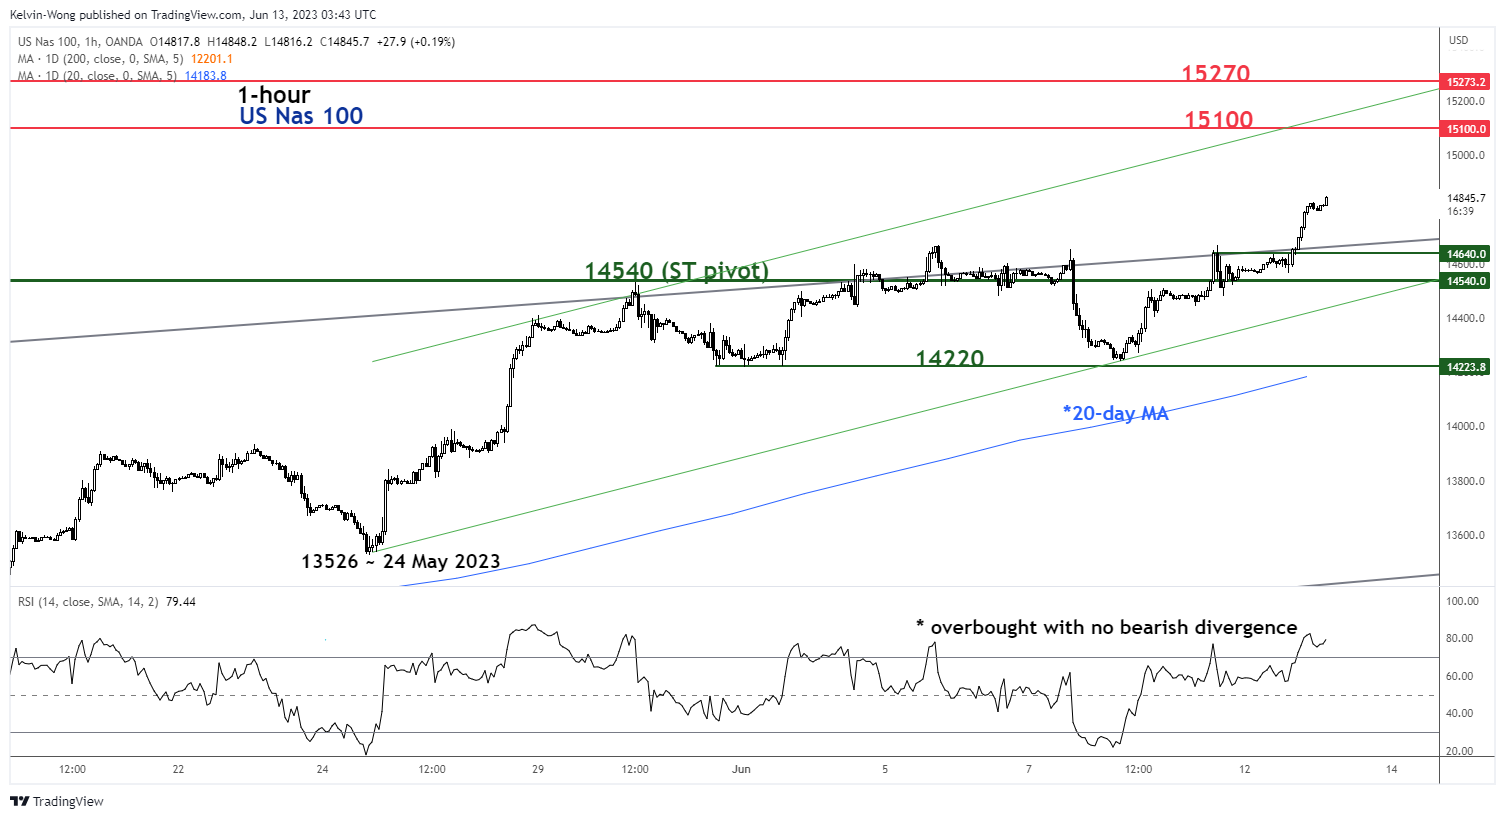
Fig 2: US Nas 100 short-term trend as of 13 Jun 2023 (Source: TradingView, click to enlarge chart)
Once again, the bullish tone of the Nasdaq 100 which is heavily concentrated in the mega-cap technology-related stocks such as Microsoft, Apple, Amazon, and NVIDIA resumed its outperformance yesterday, 12 June with a daily gain of +1.76% over the rest of the US benchmark indices; S&P 500 (+0.93%), Dow Jones Industrial Average (+0.56%), and Russell 2000 (+0.40%).
From a technical analysis perspective, momentum remains positive at least in the short-term.
Squeezed up and ended yesterday’s session with a daily bullish “Marubozu”
Price actions of the US Nas 100 (a proxy for the Nasdaq 100 futures) have managed to stage a breakout above the upper boundary of an impending “Ascending Wedge” that now turns into a near-term pull-back support at 14,540. Ended yesterday’s session, (12 June) with a daily bullish “Marubozu” candlestick pattern which suggests that the bullish camp controlled the price of the Index from the opening to the close of the day.
Short-term momentum remains positive
In the shorter-term horizon, as depicted on the 1-hour chart, the price actions of the Index have evolved within a minor ascending channel since the 24 May 2023 low of 13,526. In addition, the 1-hour RSI oscillator has just inched up into its overbought zone (above 70%) yesterday but without any bearish divergence signal yet. These observations suggest that short-term upside momentum remains intact.
14,540 key short-term pivotal support to maintain the bullish tone with next intermediate resistances coming in at 15,100 and 15,270; defined by a confluence of elements (the medium swing high areas of 2 February/29 March 2022, the upper boundary of the minor ascending channel & a Fibonacci retracement/extension cluster).
On the flip side, failure to hold above 14,540 exposes the next support at 14,220 (also the 20-day moving average).
Copper (HG) Low Likely in Place with 5 Waves Rally
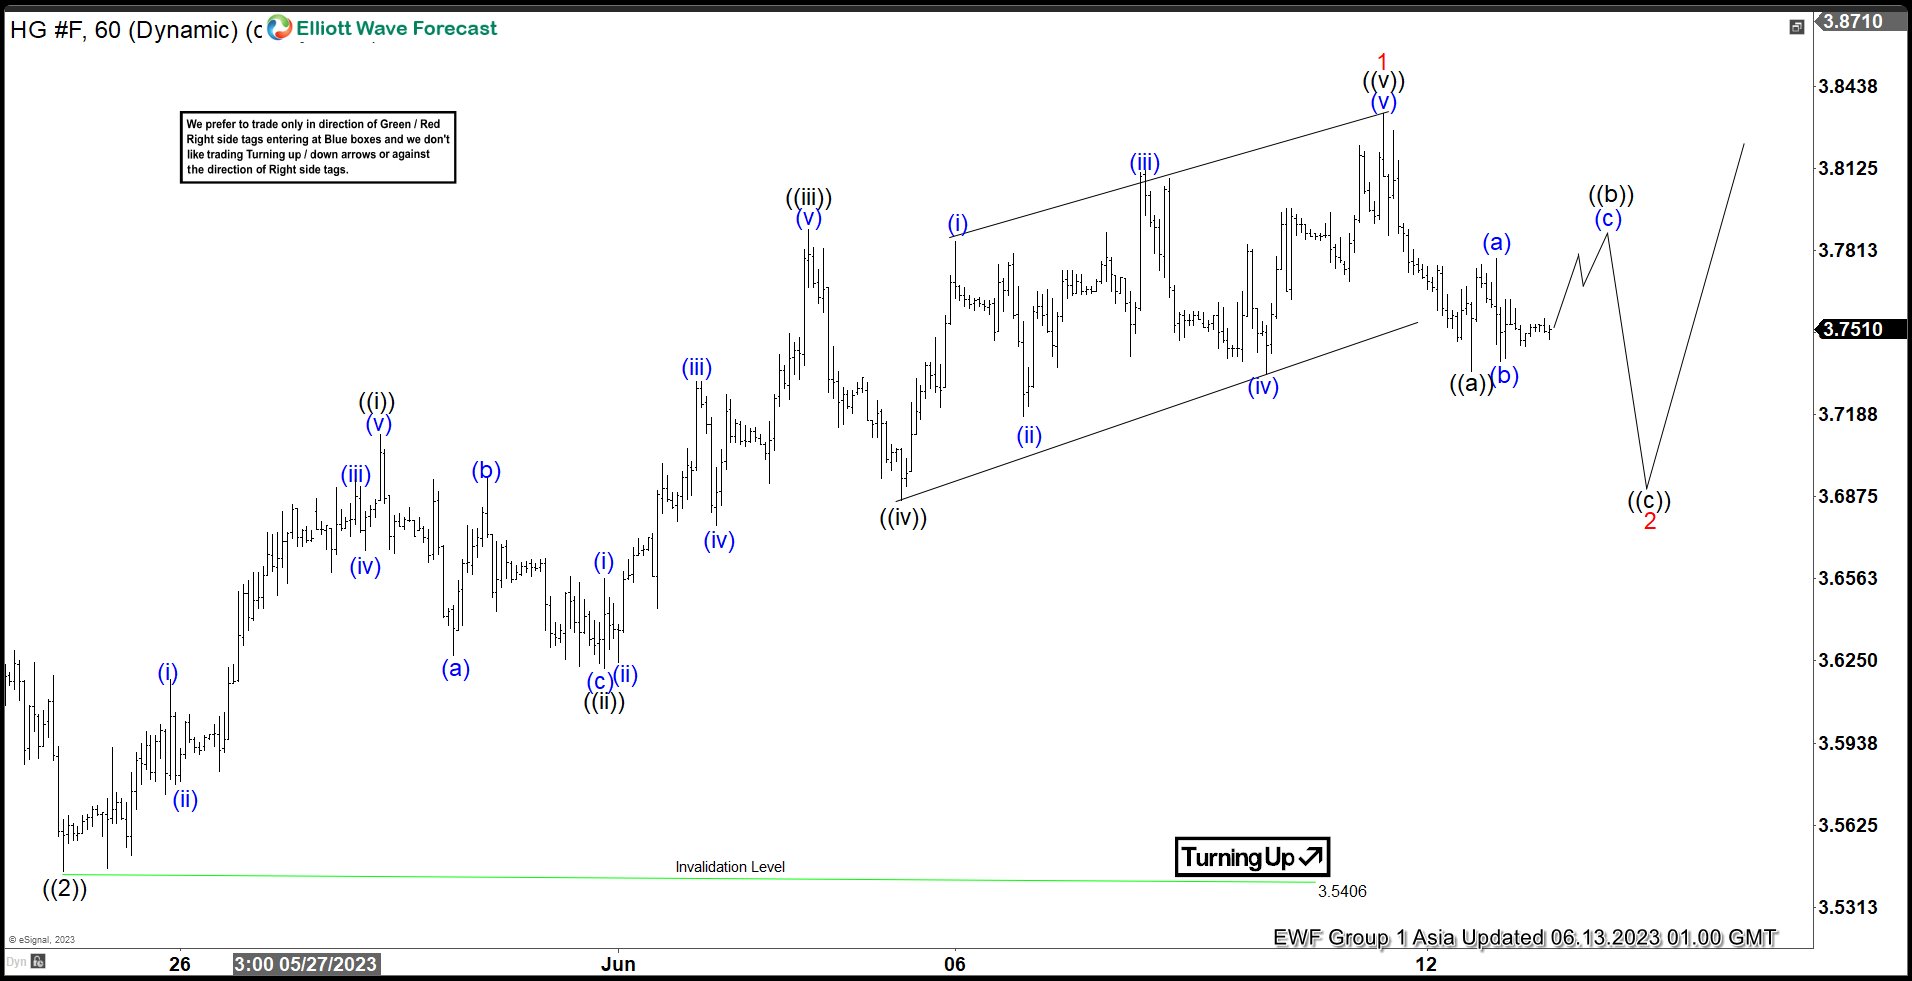
Short Term Elliott Wave in Copper (HG) suggests the metal ended wave ((2)) pullback at 3.54. The metal has turned higher in wave ((3)). Rally from wave ((2)) low is unfolding as a 5 waves impulse Elliott Wave structure. Up from wave ((2)), wave (i) ended at 3.618 and pullback in wave (ii) ended at 3.578. The metal extends higher in wave (iii) towards 3.694 and pullback in wave (iv) ended at 3.667. Copper then extends higher again in wave (v) towards 3.711 which completes wave ((i)).
The metal then corrected in wave ((ii)) towards 3.622 with internal subdivision as a zigzag. Down from wave ((i)), wave (a) ended at 3.627, wave (b) ended at 3.694, and wave (c) lower ended at 3.622. This completed wave ((ii)) in higher degree. The metal then extends higher in wave ((iii)). Up from wave ((ii)), wave (i) ended at 3.656 and pullback in wave (ii) ended at 3.624. The metal rallies higher in wave (iii) towards 3.7315 and pullback in wave (iv) ended at 3.676. The metal extends higher again in wave (v) towards 3.789 which completed wave ((iii)). Pullback in wave ((iv)) ended at 3.686. Wave ((v)) higher unfolded as a diagonal and ended at 3.833. This completed wave 1 in higher degree. Wave 2 pullback is in progress now as a zigzag structure. Down from wave 1, wave ((a)) ended at 3.735. While rally in wave ((b)) fails below 3.833, expect the metal to turn lower in wave ((c)) to complete wave 2. As far as pivot at 3.54 low stays intact, expect pullback to find support in 3, 7, or 11 swing for further upside.
Copper (HG) 1 Hour Elliott Wave Chart
HG Elliott Wave Video
https://www.youtube.com/watch?v=pQSsZc6Dfeg
Markets Rise ahead of US CPI, Fed in Focus
Asian markets traded higher on Tuesday, following the positive cues from Wall Street overnight after the S&P 500 rallied to its highest level in more than a year. Market sentiment has been lifted by hopes around the Federal Reserve pausing its tightening cycle with the People’s Bank of China’s decision to lower short-term lending rates stimulating risk appetite. The next few days promise to be incredibly eventful for global financial markets thanks to a long list of high-risk events ranging from key central bank decisions to top-tier data from major economies.
European futures are pointing to a positive open as focus falls on the pending Euro area and Germany ZEW economic sentiment reports. Looking at currencies, the dollar has edged lower ahead of the key U.S inflation data due later today. In the commodity space, oil prices are trading near their lowest level in almost three months thanks to ongoing concerns around the demand outlook while gold remains on standby.
US CPI and Fed meeting in focus
All eyes will be on the latest US inflation report which is expected to have slowed again in May after slightly easing in April. The headline CPI is forecast to rise 0.1% month-on-month after the 0.4% increase in April while the annual headline is seen cooling to 4.1% from 4.9%. However, focus will be on the core CPI reading which is projected to rise 0.4% in May while the annual reading is seen easing to 5.2% from 5.5% in April. Ultimately, signs of lower inflationary pressures may boost expectations around the Fed’s hiking quest coming to an end. Alternatively, a sticky reading could boost bets around US rates remaining higher for longer.
On Wednesday, the main focus will be the Fed decision which is expected to keep interest rates unchanged. Traders are currently pricing in a 28% probability of a 25bps hike, according to Fed funds futures. However, expectations may be influenced by Tuesday’s inflation data, especially if it prints hotter than expected. The updated dot plots and Fed Chair Jerome Powell’s press conference will be closely watched for fresh clues on the Fed’s next move. A hawkish hold seems to be the widely expected outcome of this meeting. Should the central bank surprise markets with a rate hike, this could boost the dollar and rattle markets.
Currency spotlight – EUR/USD
A major breakout could be on the horizon for EURUSD as the currency pair braces for a week jam-packed with key risk events including the European Central Bank meeting on Thursday. Policymakers are expected to raise interest rates by 25 basis points, bringing the deposit rate to 3.50% from 3.25%. However, the key question is whether the central bank hiking cycle is nearing an end, especially after the eurozone entered into a technical recession at the start of the year. Over the past few weeks, EURUSD has been trapped within a range with support at 1.0686 and resistance at 1.0811. Should the pair break above 1.0811, this may open a path toward 1.0845 and 1.0900. A decline back towards 1.0686 may see prices test 1.0635.
Commodity Spotlight – Gold
Gold edged higher ahead of today’s US inflation report and the Federal Reserve policy decision on Wednesday. The precious metal may display sensitivity to the latest US CPI report and is likely to weaken if the Fed moves ahead with a hawkish pause. A surprise rate hike has the potential to trigger an aggressive selloff towards levels not touched since mid-March at $1900. In the meantime, prices remain trapped within a range with support at $1935 and resistance at $1983.