

Sample Category Title
It’s Fed Day. Updated Dot Plot Will Include a Higher Terminal Rate
Markets
US Treasuries quickly erased their kneejerk upleg following the US inflation numbers. They even went from outperforming Bunds to underperforming them. Yields eventually rose 3.9 to 9.6 bps. The US 2y yield bounced of 4.5% to finish at the highest level since the mid-March turmoil. German yields rallied 1.4-6 bps higher, the front underperforming as the 2y variant is nearing the symbolic 3% barrier again. It tested that level twice recently, back in April and end May. Equities had another good run, unhindered by the core bond yield intraday rebound. The EuroStoxx50 rose 0.7%, Wall Street finished 0.43-0.83% higher. The CPI release left no permanent traces on the USD. The greenback traded volatile but in the end simply held on to the losses incurred prior to the publication. EUR/USD tested the 1.08 big figure but was unable to close above it. The trade-weighted index eased towards 103.338. The constructive risk sentiment and core bond yield advance delivered a double blow to the Japanese yen. USD/JPY topped 140 again while EUR/JPY’s closing level (151.34) was a new 15-year high. Sterling strengthened towards critical EUR/GBP support at 0.8547. The red hot labour market report and its implications for monetary policy (see below) supported the move higher. Industrial production figures this morning were slightly disappointing but the monthly GDP figure and services sector growth were bang in line with expectations. It’s enough for a small sterling push towards the 0.8547 support. Scandinavian currencies were on top of the G10 scoreboard. The Swedish crown surged almost 2% to EUR/SEK 11.53 – though still weak from a historical perspective it does leave the recent post-GFC lows a bit further behind. Swedish May inflation (6.7% CPIF, 8.2% core CPIF) followed the Norwegian example last week by beating consensus that was already revised higher. SEK ekes out further gains.
It’s Fed day. Yesterday’s more or less in-line CPI figures basically cemented the case for a skip in the tightening cycle. That said, we do expect the Fed to add a hawkish flavour because of - amongst others - ongoing economic resilience, especially in the labour market and stalling/insufficient progress in the core disinflationary process. The dot plot serves as the perfect tool for this. The updated version will include a higher terminal rate than the one in March (set back then at the current 5-5.25%). 2024 may also see a higher rate level than expected previously. We don’t expect chair Powell to sound outright hawkish in the press conference afterwards though. He’ll stick to a data-dependent approach instead. With another rate hike almost fully priced in for either July or September, we think the dollar’s room for appreciation against the euro is limited. First EUR/USD support is located at 1.0727/1.0735. The US yield rally may lose some steam but their downside should be protected by the higher-for-longer strategy.
News and views
Bank of England governor Bailey extended yesterday’s UK Gilt sell-off by commenting on hot UK labour market report, including accelerating wages, published in the morning: “We’ve got a very tight labour market. We still think inflation is going to come down, but it’s taking a lot longer than we expected”. Megan Greene, who’ll replace dovish BoE member Tenreyro (recently voted against rate hikes) by the time of the August meeting, added that second-round effects seem to be seeping in. She added: “I think there is some underlying persistence and so getting from 10% to 5% is probably far easier than getting from 5% to 2%. UK gilt yields eventually surged up to 26 bps for the 2y tenor which easily surpassed last year’s peak to close at 4.9%, the highest level since 2008. UK money markets now raised their expectations for the policy rate peak (currently 4.5%) from 5.5% to (at least) 5.75% by the end of the year. Sterling gains remained contained despite the yield advantage, possibly as the implication of very hawkish BoE policy stance could be a recession next year.
Bloomberg yesterday evening reported that the US, according to sources, plans to purchase about 12 million barrels of oil this year as it begins to refill its depleted emergency reserve. This includes 3 million scheduled for delivery in August and 3 million from a solicitation issued on Friday. The acceleration comes as WTI crude prices arrived at the $67-72/b range, mentioned last fall as target zone. The country’s Strategic Petroleum Reserve fell from around 593 million barrels at the start of 2022 to about 372 million at the end of last year. The SPR has a 700 million barrel capacity.
Diverging Policies
US inflation data gave investors a good reason to cheer up yesterday. The headline number fell more than expected to 4%, and core inflation met analysts’ expectations at 5.3%. The biggest takeaway from yesterday’s CPI report was, again, that easing in inflation was mostly driven by cooling energy prices, but shelter costs remained sticky – up by more than 8% on a yearly basis. Yet because these shelter costs represent more than 40% of the core CPI, and private sector data is pointing at cooling housing costs, investors didn’t see the sticky core inflation as a major issue. The producer price inflation data is due today, before the Federal Reserve’s (Fed) policy decision, but the latter will unlikely change expectations for today’s announcement. A softer-than-expected PPI number – due to soft energy and raw material prices, could, on the contrary, further soften the Fed hawks’ hand.
In numbers, the expectation of a no rate hike at today’s decision jumped past 90%, while the expectation of a no rate hike in July meeting rose from below 30% to above 35%. The S&P500 extended its advance to 4375, while Nasdaq 100 rallied past the 14900 level. Small companies followed suit, with Russell 2000 jumping to the highest levels since the mini banking crisis.
Tough accompanying talk?
The Fed’s decision for today is considered as done and dusted with a no rate hike. But the chances are that Fed Chair Jerome Powell will sound sufficiently hawkish to let investors know that the war is not won just yet, because 1. Core inflation remains well above the Fed’s 2% target, 2. US jobs market remains too strong to call victory on inflation, and 3. Equity valuations point at an overly optimistic market, at the current levels, the S&P500 trades at around 18 times its earnings forecast over the next year, and these levels are typically associated with times of healthy economic growth and rising corporate profits. But we are now in a period of looming recession odds, and falling profits.
Ouch, BoE
Yesterday’s jobs data in Britain printed blowout figures for April and May. The employment change rocketed to 250K in April, while the expectation was a fall from 180K to 150K. The unemployment rate unexpectedly dropped to 3.8%, and average earnings excluding bonus rose from 6.8% to 7.2%. Then, the jobless claims fell by more than 13K – while analysts expected a surge of more than 20K – hinting that the British job market will likely print solid figures for May as well.
While these are excellent news for Brits who could at least see their purchasing power partly resist to the terrible cost-of-living crisis – where eggs, milk and bread for example saw their prices rise by a whooping 30-and-something per cent, it makes the end of the BoE tightening look impossible for now.
The market prices in another 125bp hike this year, which will take the British policy rate to 5.75%, and there is around 20% chance for an additional 25bp by February next year.
And all this in a market where mortgage rates rise unbearably, and house prices tumble. The 2-year gilt yield took a lift yesterday and is preparing to flirt with the 5% mark. We are now at levels above the mini-budget crisis of Liz Truss, while the spread with the 10-year yield is widening, suggesting that the UK economy will hardly come out of this unharmed. On top, the FTSE 100 index has fallen well behind the rally recorded by the US and European stocks this month because of falling energy and commodity prices due to a disappointing Chinese growth. The only good news for the Brits is that the pound is being boosted by hawkish BoE expectations. Cable rallied past the 1.26 level and is slowly drilling above a long-term downtrending channel top. The trend and momentum indicators remain tilted to the upside, and the divergence between the Fed – preparing to call the end of its tightening cycle sometime in the coming meetings, and the BoE – which has no choice but to keep raising rates – remains supportive of further gains in Cable. We could see the pair regain the 1.30 level, last seen back in April 2022.
China cuts
The People’s Bank of China (PBoC) lowered its 7-day reverse repurchase rate by 10bp to 1.9% yesterday, a week after asking the state-run banks to lower their deposit rates. These are signals that the PBoC is preparing to lower its one-year loan rate tomorrow to give a jolt to its economy that has been unable to gather a healthy growth momentum after Covid measures were relaxed by the end of last year.
Copper futures jumped above their 200-DMA yesterday, though they remain comfortably within a broad downtrending channel building since the second half of January, while US crude rebounded from a two-week low yesterday but remains comfortably below its 50-DMA.
Final word
Because the rally in tech stocks now looks overstretched and China is getting serious about boosting growth, we will likely start seeing investors take profit on their Long Big Tech positions and return to energy and mining sector to catch the next train which could be the one that leads to profits on an eventual Chinese reopening.
Fed to Pause, Focus on July Meeting
Market movers today
Even though core inflation remained relatively high at 0.4% m/m in May in the data released yesterday, markets now price only a 10% probability that today's rate decision in the US will be another hike - so if there is a hike, it will be a surprise. Attention will likely focus on the outlook for the July meeting, where the market is pricing a hike with 60% probability. A large minority of FOMC members have previously indicated that they expect a July hike, and there is a chance that this will now become a majority.
Euro area industrial production numbers for April should show a rebound after the large drop in March.
Inflation in Sweden should show a decline in May as there are indications of lower airline and food prices, among other things. We expect y/y CPIF inflation to decline from 7.6 in April to 6.3% in May, which would be 0.8 percentage points below the Riksbank's latest forecast - but unlikely to change the rate outlook, as it is still much too high inflation.
Overnight China releases its monthly batch of data among other things covering retail sales, industrial production and housing.
The 60 second overview
Market wrap: Global stocks climbed further yesterday while bond yields moved higher as markets scaled back Fed rate cut expectations in the second half of the year. Oil and metals prices recovered somewhat.
US CPI with soft details: US core CPI for May came out in line with expectations at 0.4% m/m. However, the details were to the soft side as the 'super core', CPI ex. shelter and health care, was up only 0.2% confirming the moderation that started in April. Used car prices pulled up the core index but this is likely to be temporary as wholesale prices have moved lower again in the past months and tend to lead retail prices. The headline inflation came out in line with expectations at 0.1% m/m pulled down by lower energy prices. The annual increase in core inflation is now 5.3%, the lowest rate in 1½ years and trending lower.
German ZEW bounces but is still weak: The ZEW expectations index increased in June from -10.7 to -8.5. It tends to give a good signal of PMI manufacturing so it suggests we may see a slight improvement in the June data after the declines in the past two months. The level of ZEW is still low, though, thus point to weak activity still.
Strong UK labour data: The UK employment report showed wage increases rising further to 6.5% y/y (consensus 6.1%) from 6.1% in April y/y and employment gains still being solid at 250k from Feb-Apr compared to the previous three months. ILO unemployment. The markets now price an additional 135bp of hikes from Bank of England to reach a policy rate of 5.75%.
Equities: Global equities enjoyed yet another day of risk-on, with cyclical stocks leading the outperformance and utilities the only sector lower. Yields and equities were rising in tandem on a day with US CPI release. Go 12 months back and you will see the complete opposite outcome. The move away from inflation fear is continuing and one should expect the bond equity correlation to be negative going forward. In US, Dow +0.4%, S&P 500 +0.7%, Nasdaq +0.8%, and Russell 2000 +1.2%. Asian markets are mixed this morning while Japan continues to shine. European and US futures are surfing around the closing levels from yesterday.
FI: The low US headline CPI led initially to a sharp 10bp drop in front end US rates, which pulled the European peers lower as well. However, as markets digested the numbers, yields reversed and ended 12b higher in the US and 5bp in 2y Germany as Fed rate cut expectations in H2 were scaled back. The sell-off was led by the sub5y of the curve, in a flattening move. The strong UK labour market data sent UK yields markedly higher with limited spill-over to euro government yields.
FX: Yesterday's session saw GBP, SEK and not least NOK trade strongly while the USD weakened slightly on the US CPI print. EUR/USD trades just below the 1.08 mark heading into the Fed and ECB meetings while EUR/SEK trades in the mid 11.50s ahead of Swedish CPI.
Credit: Rather quiet day in the credit market with iTraxx Main 1bp tighter to 77bp while iTraxx Xover tightened 4bp to 406bp
Nordic macro
May inflation data for Sweden is due today at CET 8:00. We anticipate CPIF to decrease to 6.3 % y/y and CPIF excl. Energy to 7.7 % y/y. This is 0.8 and 0.4 percentage points below the Riksbank's forecasts, respectively. These deviations are quite significant, but considering the overall level of inflation, they are unlikely to be enough for the Riksbank to feel comfortable enough to refrain from a 25bp hike at the upcoming June meeting.
Regarding the details, it is worth noting that we expect a decline in food prices as well as transportation services and recreational activities. There are two factors that add some uncertainty to the forecast. Firstly, we have assumed that one-third of the remaining rent increases took place in May. Secondly, the fact that Beyoncé held a concert in Stockholm could have temporarily increased certain subcomponents, which then should see a reversal in the June data.
Technical Outlook and Review
DXY:
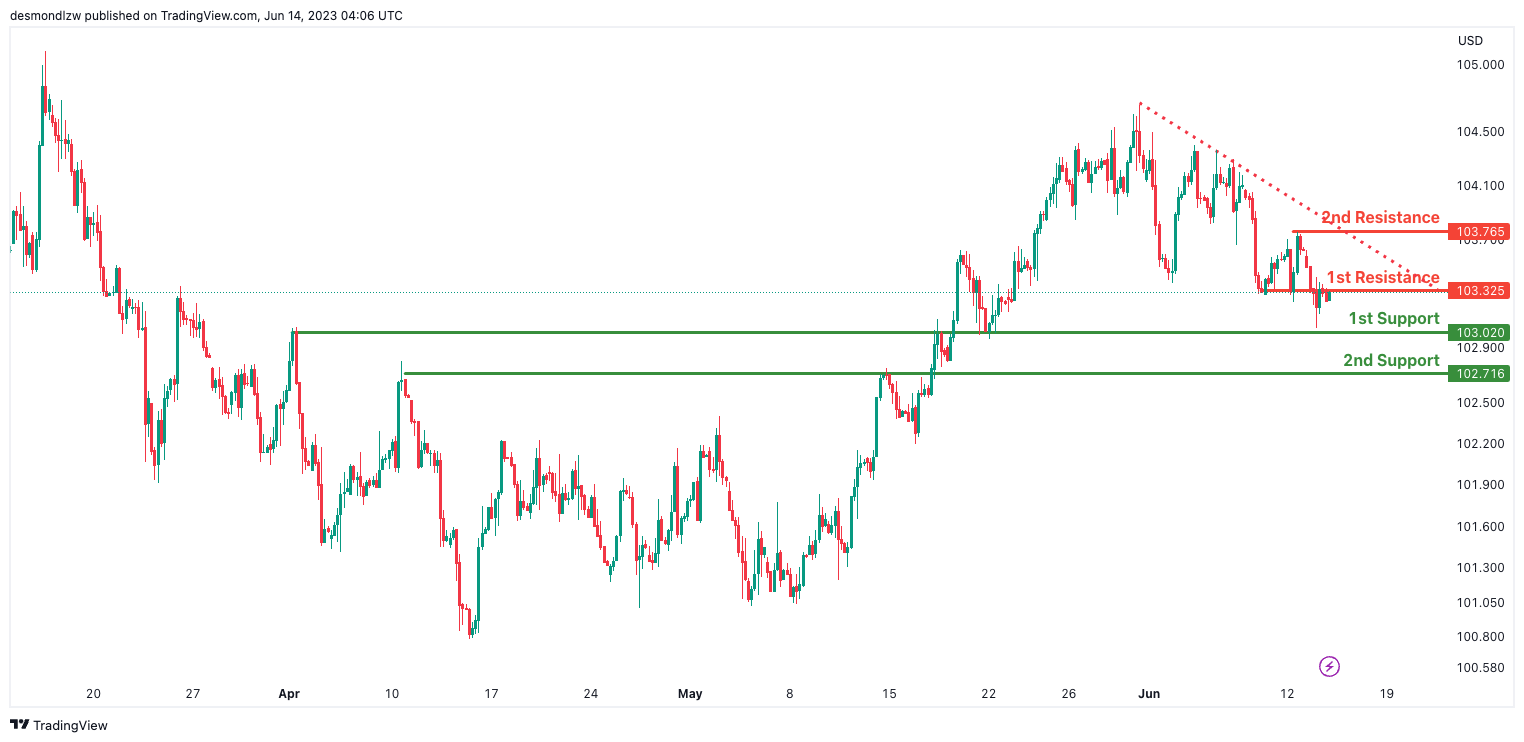
The DXY (US Dollar Index) chart currently shows a bearish momentum, indicating a downward trend in the market.
Factors contributing to this momentum include the price being below a major descending trend line, suggesting the presence of bearish pressure.
There is a potential for a bearish reaction off the first resistance level at 103.32, with a possible drop towards the first support level at 103.02.
The first and second support levels at 103.02 and 102.71, respectively, are identified as overlap supports, indicating their significance as potential areas of buying interest.
On the upside, the first and second resistance levels at 103.32 and 103.76, respectively, act as overlap resistances, potentially limiting upward price movements.
Overall, the chart’s momentum suggests a bearish bias, with potential support and resistance levels to monitor for future price action.
EUR/USD:
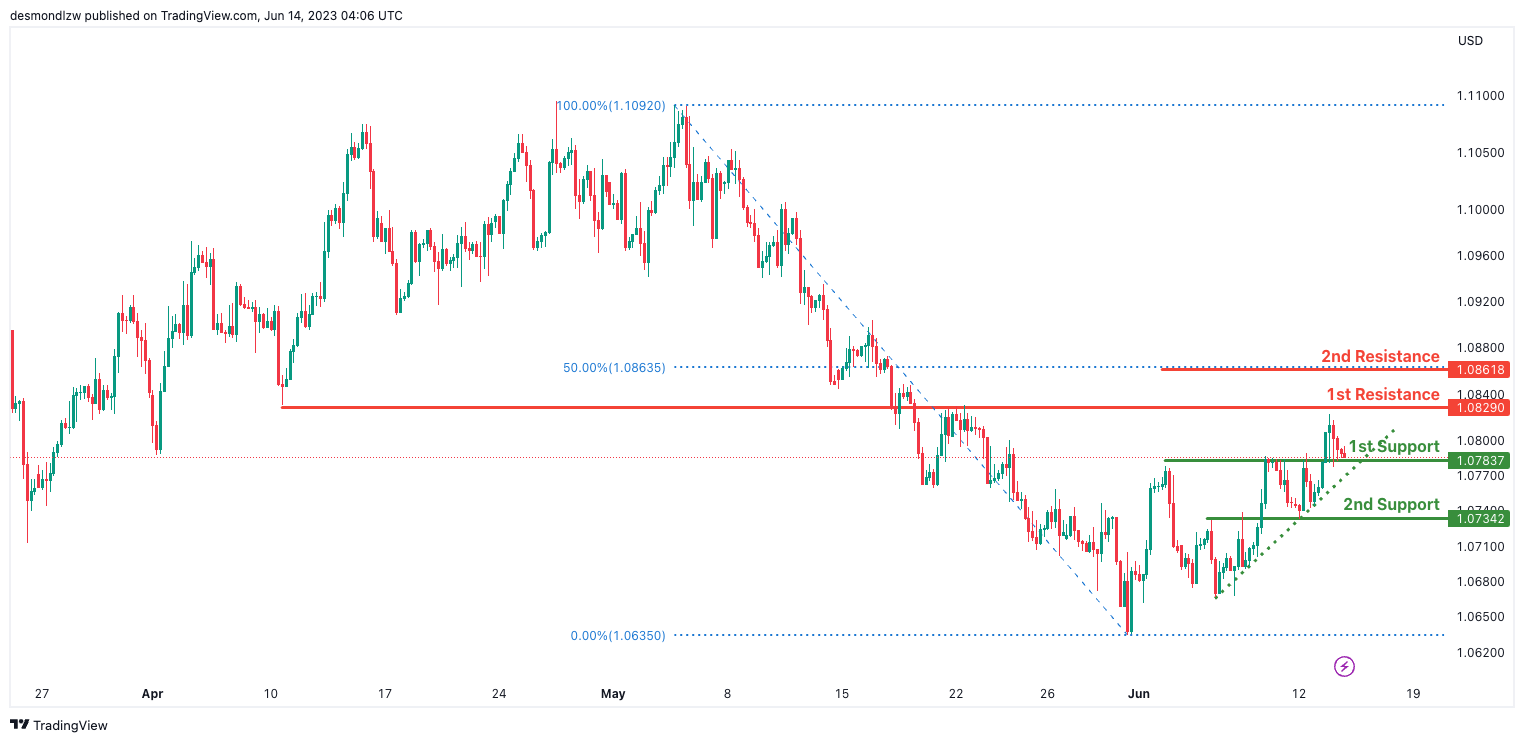
The EUR/USD chart currently demonstrates a bullish momentum, indicating an upward trend in the market.
The momentum is supported by the price being above a major ascending trend line, suggesting the potential for further bullish movement.
There is a possibility of a bullish bounce off the first support level at 1.0783, with potential upward movement towards the first resistance level at 1.0829.
The first and second support levels at 1.0783 and 1.0734, respectively, are identified as overlap supports, indicating their significance as potential levels where buyers may step in.
On the upside, the first resistance level at 1.0829 is an overlap resistance, suggesting a potential barrier to upward price movements.
Additionally, the second resistance level at 1.0861 aligns with the 50% Fibonacci retracement, further reinforcing its importance as a potential resistance level.
GBP/USD:
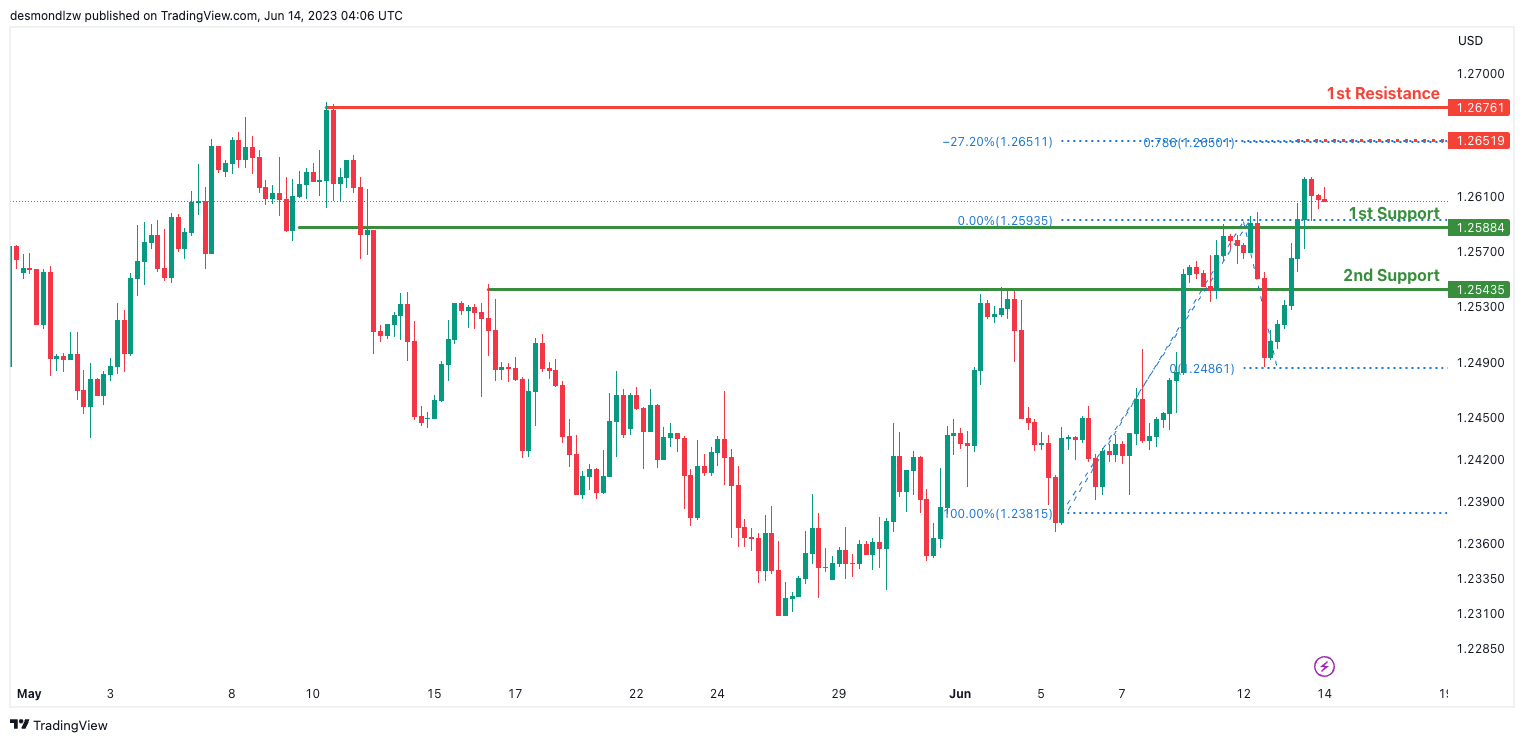
The GBP/USD chart currently exhibits a bullish momentum, indicating an upward trend in the market.
There is a potential for a bullish bounce off the first support level at 1.2588, with the price potentially heading towards the first resistance level at 1.2676.
The first and second support levels at 1.2588 and 1.2543, respectively, are identified as overlap supports, indicating their significance in providing potential buying interest.
On the upside, the first resistance level at 1.2676 is an overlap resistance, potentially acting as a barrier to upward price movements.
Additionally, an intermediate resistance level at 1.2651 shows Fibonacci confluence with a -27% Fibonacci Expansion and the 78.60% Fibonacci Projection, further reinforcing its importance as a potential area of resistance..
USD/CHF:
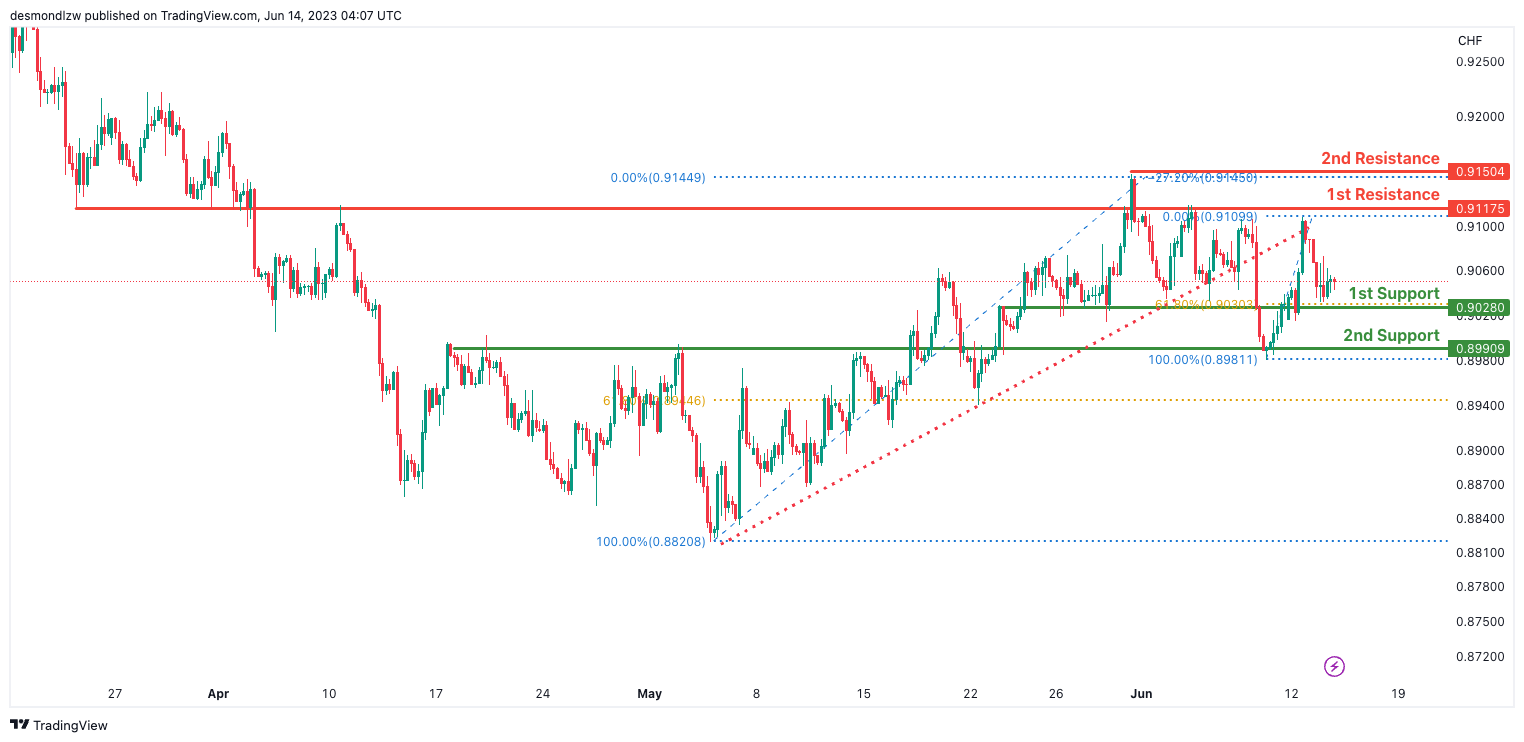
The USD/CHF chart currently demonstrates a bearish momentum, indicating a downward trend in the market.
The price has broken below an ascending support line, triggering a potential bearish move.
There is a possibility of a bearish break off the first support level at 0.9028, with the price potentially dropping towards the second support level at 0.8990.
The first support level at 0.9028 is identified as an overlap support and aligns with the 61.80% Fibonacci retracement, making it a significant level to watch.
On the upside, the first resistance level at 0.9117 serves as an overlap resistance.
Furthermore, an intermediate resistance level at 0.9150 is recognized as a swing high resistance and shows Fibonacci confluence with a -27% Fibonacci Expansion, further reinforcing its significance as a potential area of resistance.
Overall, the chart’s bearish momentum suggests a downward bias, with key support and resistance levels providing potential areas for price movement.
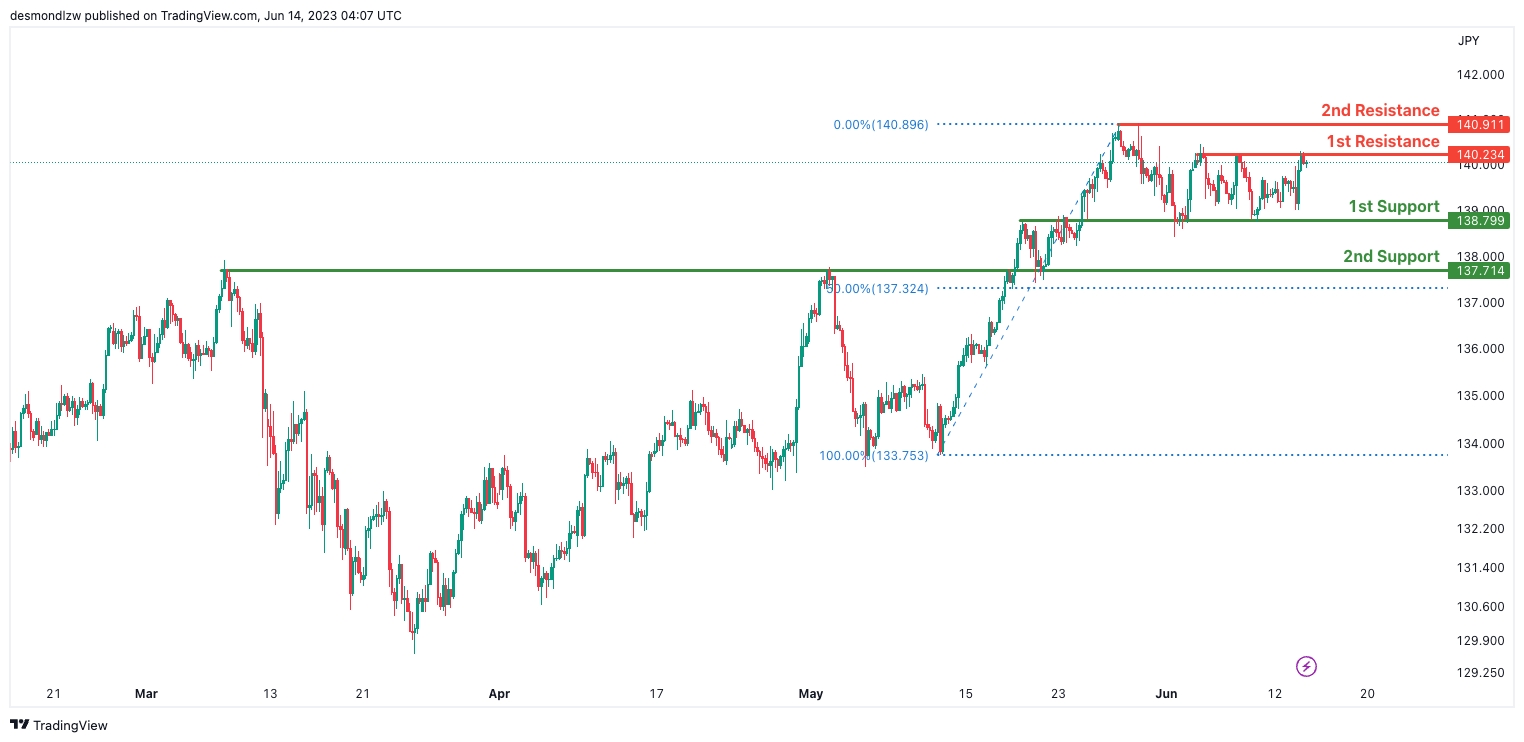
USD/JPY:
The USD/JPY chart currently demonstrates a bearish momentum, indicating a downward trend in the market.
There is a potential for a bearish reaction off the first resistance level at 140.23, with the price potentially dropping towards the first support level at 138.79.
The first support level at 138.79 is identified as an overlap support, while the second support level at 137.71 serves as another overlap support and aligns with the 50% Fibonacci retracement level.
On the upside, the first resistance level at 140.23 represents a multi-swing high resistance.
Additionally, an intermediate resistance level at 140.91 is recognized as a swing high resistance, further contributing to its significance.
Overall, the bearish momentum of the chart suggests a downward bias, with key support and resistance levels providing potential areas for price movement.
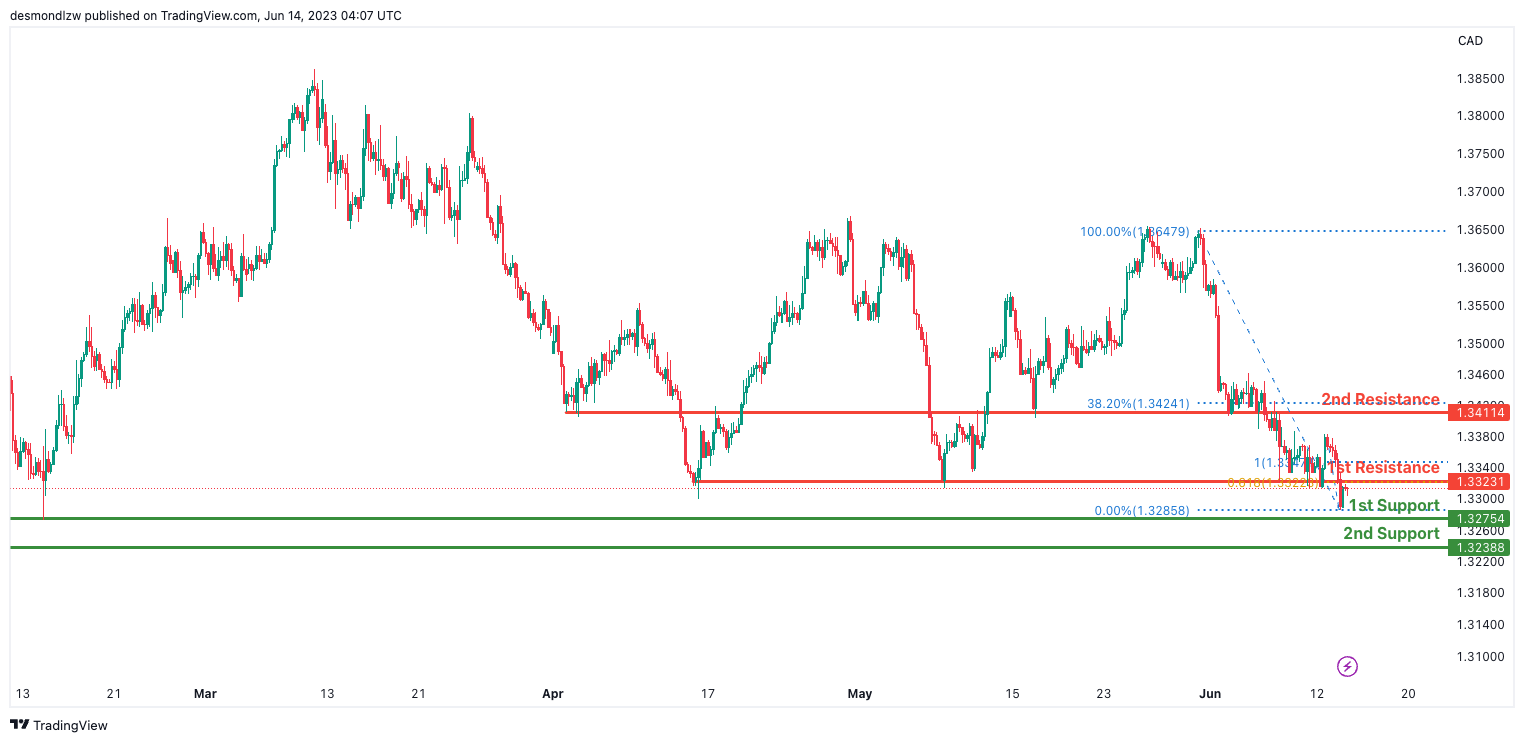
USD/CAD:
The USD/CAD chart currently shows a neutral momentum, indicating a lack of clear direction in the market.
There is a possibility for price to fluctuate between the first resistance level at 1.3323 and the first support level at 1.3275.
The first support level at 1.3275 is identified as an overlap support, while the second support level at 1.3238 serves as another area of overlap support.
On the upside, the first resistance level at 1.3323 represents an overlap resistance, and it is further supported by the 61.80% Fibonacci projection.
Additionally, an intermediate resistance level at 1.3411 is recognized as an overlap resistance, and it coincides with the 38.20% Fibonacci retracement.
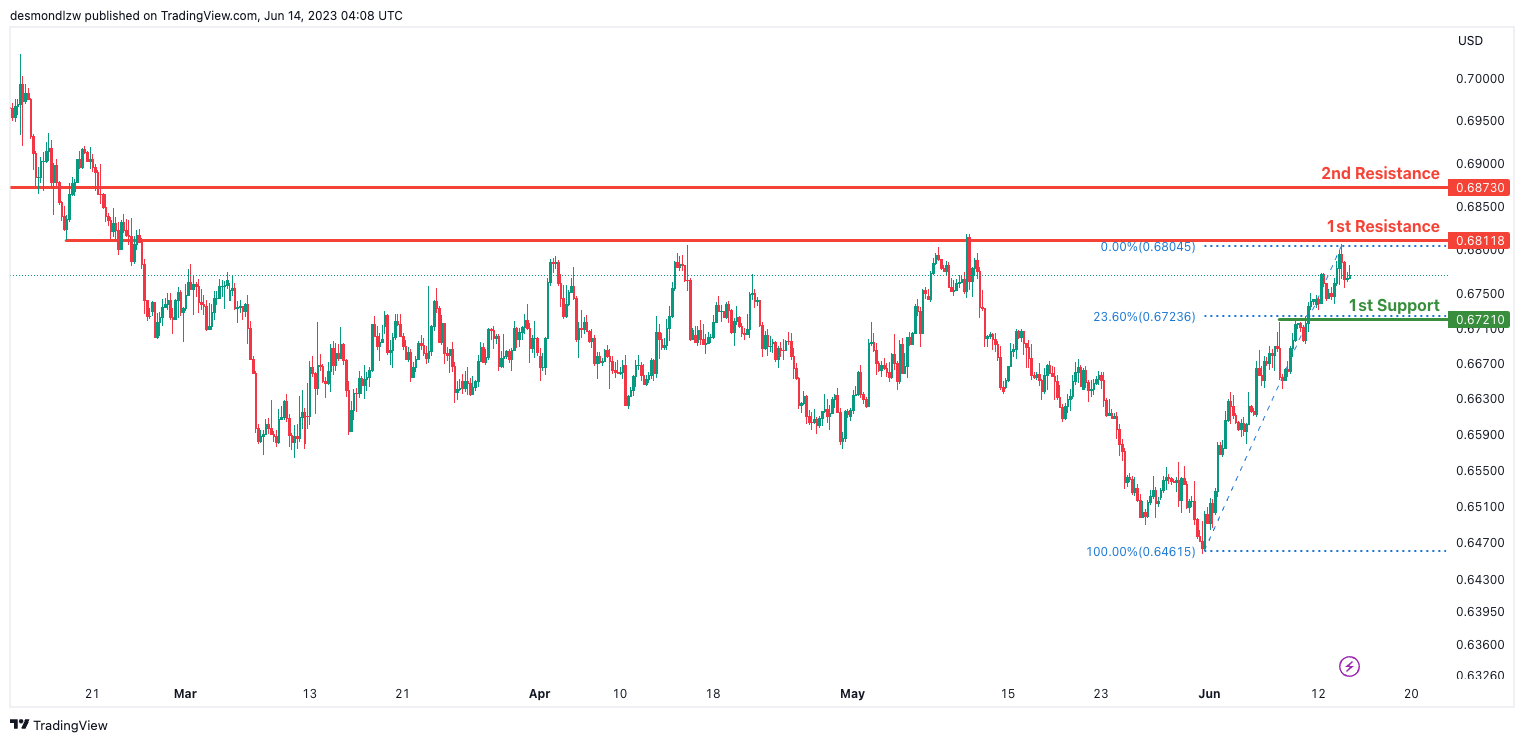
AUD/USD:
The AUD/USD chart currently shows a bearish momentum, indicating a downward trend in the market.
There is a potential for a bearish continuation towards the first support level at 0.6721. This level is identified as an overlap support and is further supported by the 23.60% Fibonacci retracement.
On the upside, the first resistance level at 0.6811 represents an area of overlap resistance.
Additionally, the second resistance level at 0.6870 serves as a pullback resistance.
With the overall bearish momentum, the price is expected to potentially continue its downward movement towards the first support level.
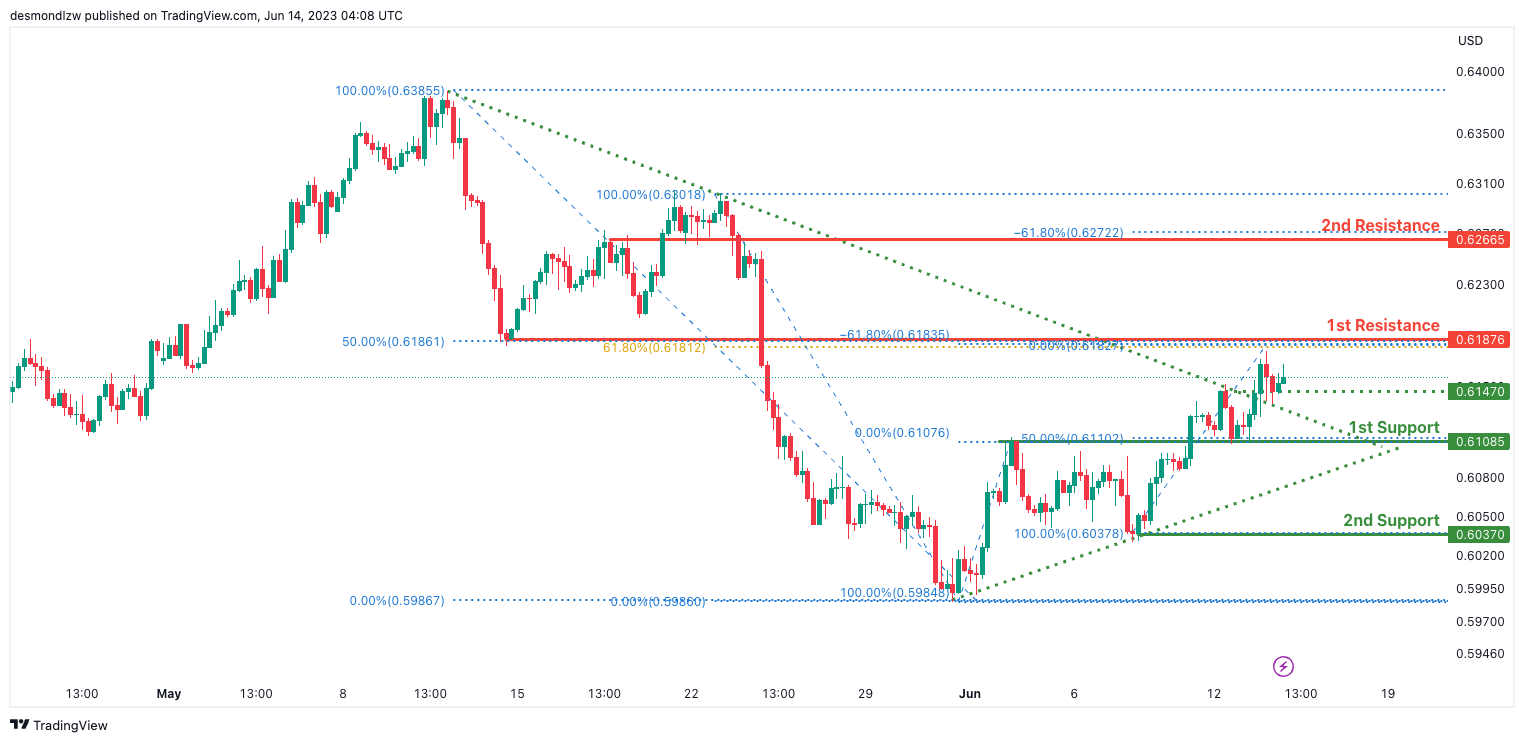
NZD/USD
The NZD/USD chart currently exhibits a bearish momentum, indicating a downward trend in the market.
There is a potential for a bearish reaction off the first resistance level at 0.6187, followed by a drop towards the first support level at 0.6108. The first support level is an area of overlap support, further reinforced by the presence of a 50% Fibonacci retracement.
Additionally, the second support level at 0.6037 is identified as a swing low support.
On the upside, the first resistance level at 0.6187 acts as an area of overlap resistance. It also coincides with a 50% Fibonacci retracement and a 61.80% Fibonacci retracement, representing a Fibonacci confluence.
Furthermore, the second resistance level at 0.6266 serves as a pullback resistance, coupled with a -61.8% Fibonacci expansion.
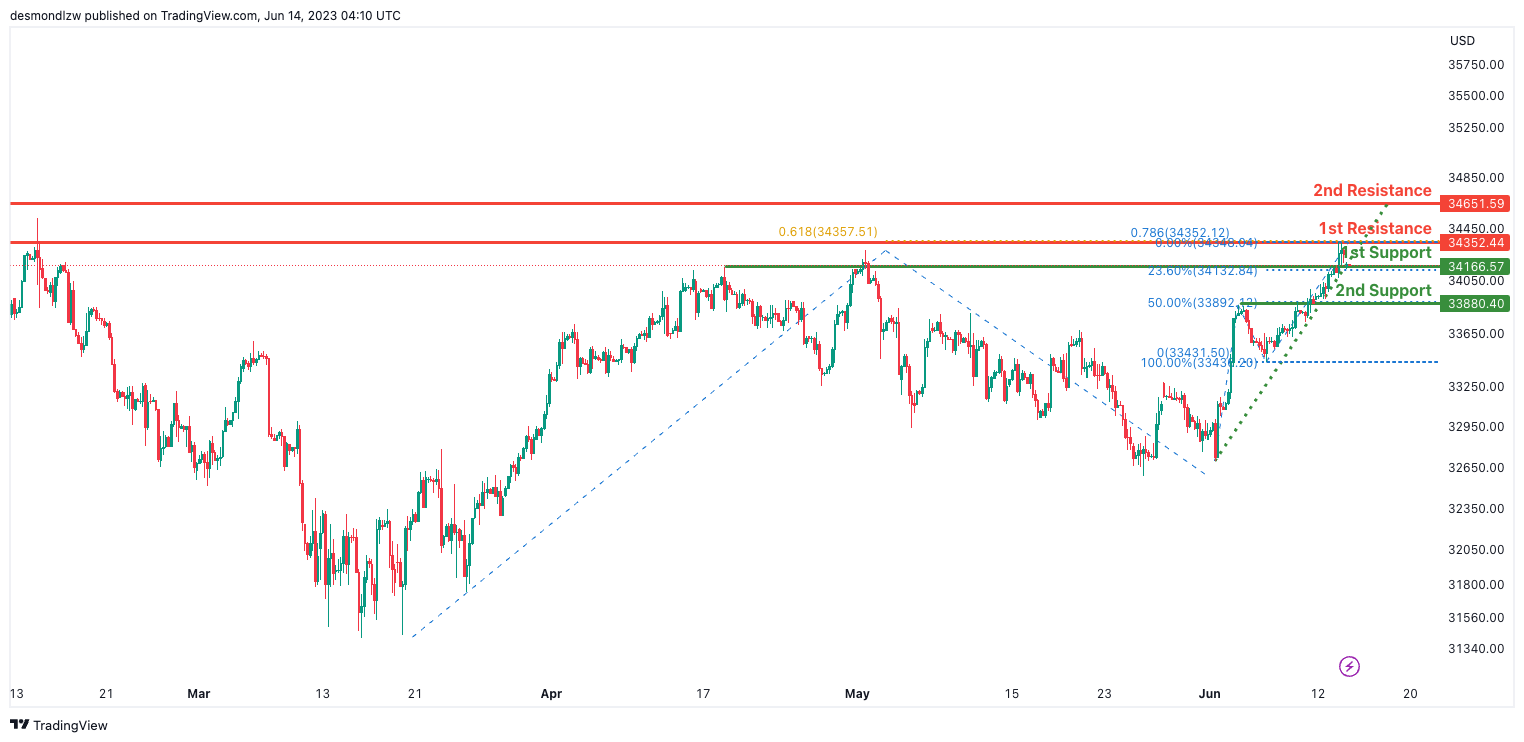
DJ30:
The DJ30 chart currently shows a bullish momentum, indicating an upward trend in the market.
There is a possibility of a short-term drop towards the first support level at 34166.57, which is an area of overlap support and aligns with a 23.60% Fibonacci retracement. From there, the price could bounce and rise towards the first resistance level at 34352.44.
Additionally, the second support level at 33880.40 serves as another area of overlap support, coinciding with a 50% Fibonacci retracement.
On the upside, the first resistance level at 34352.44 is significant as it represents an area of overlap resistance and coincides with a Fibonacci confluence of the 61.80% Fibonacci projection and the 78.60% Fibonacci projection.
Furthermore, the second resistance level at 34651.59 is identified as a swing high resistance.
GER30:
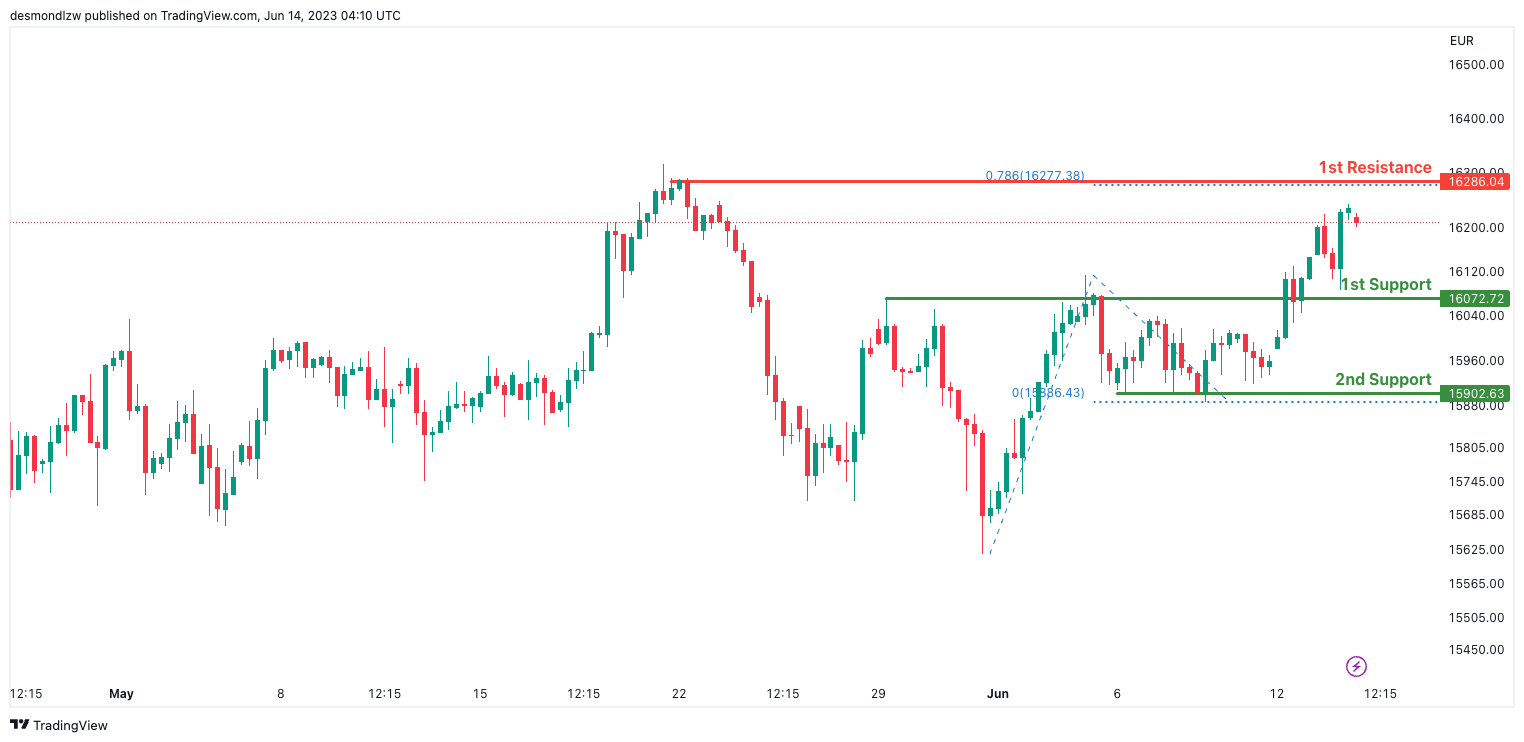
The GER30 chart currently exhibits a bearish momentum, suggesting a downward trend in the market.
There is a potential for a bearish reaction off the first resistance level at 16286.04, which is identified as an area of overlap resistance. In the event of a bearish reaction, the price could drop towards the first support level at 16072.72.
Support levels include the first support at 16072.72, recognized as an overlap support, and the second support at 15902.63, which represents a multi-swing low support.
Furthermore, the first resistance level at 16286.04 is significant as it aligns with a 78.60% Fibonacci retracement level, adding to its importance as a potential area of resistance.
US500
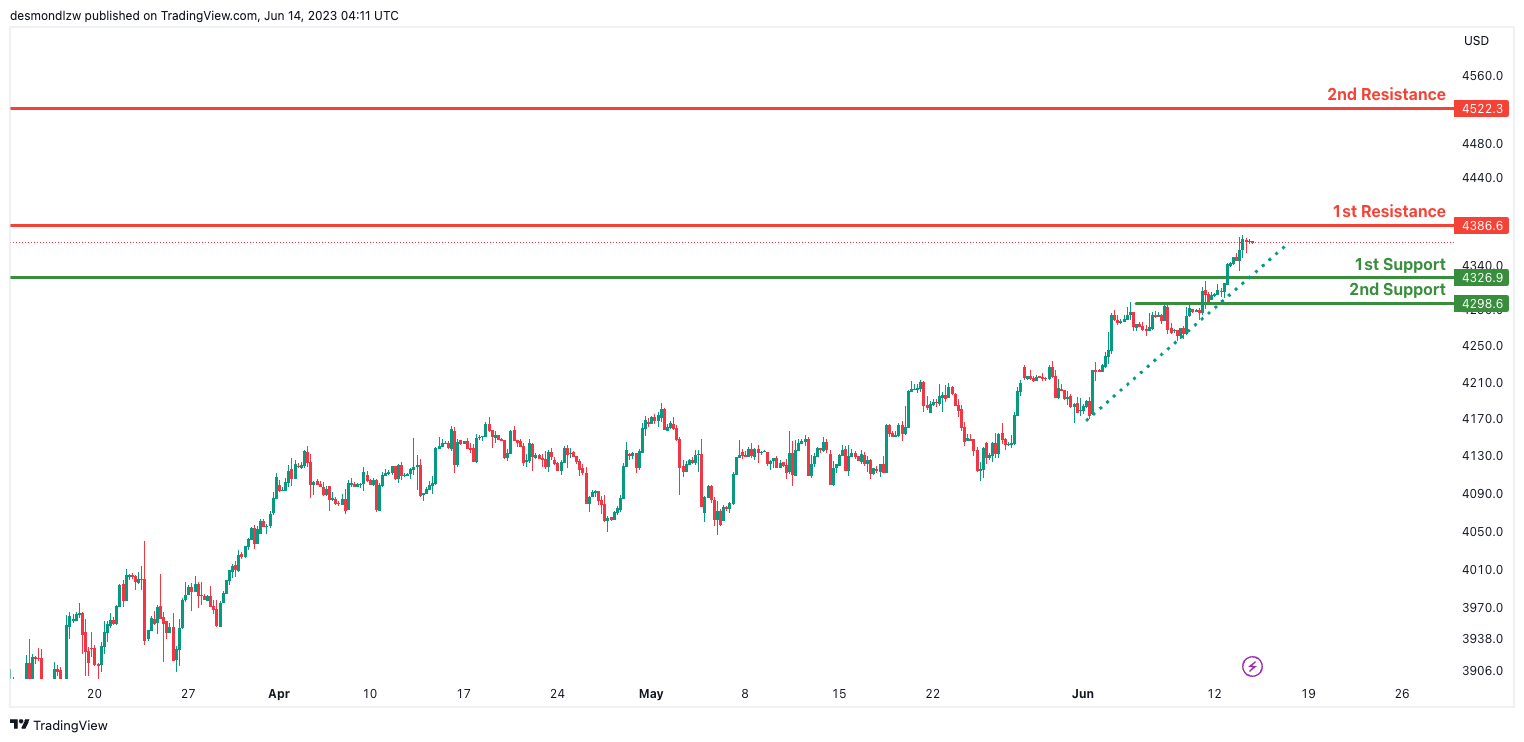
The US500 chart currently shows a bullish momentum, indicating an upward trend in the market.
There is a possibility for a short-term drop towards the first support level at 4326.90, which is identified as an area of overlap support. Following this drop, the price could bounce from the support level and rise towards the first resistance at 4386.60.
Support levels include the first support at 4326.90 and the second support at 4298.60, both serving as areas of overlap support.
Furthermore, the first resistance level at 4386.60 acts as a pullback resistance, potentially impeding further upward movement.
Similarly, the second resistance level at 4522.30 is another area of pullback resistance, adding to its significance.
BTC/USD:
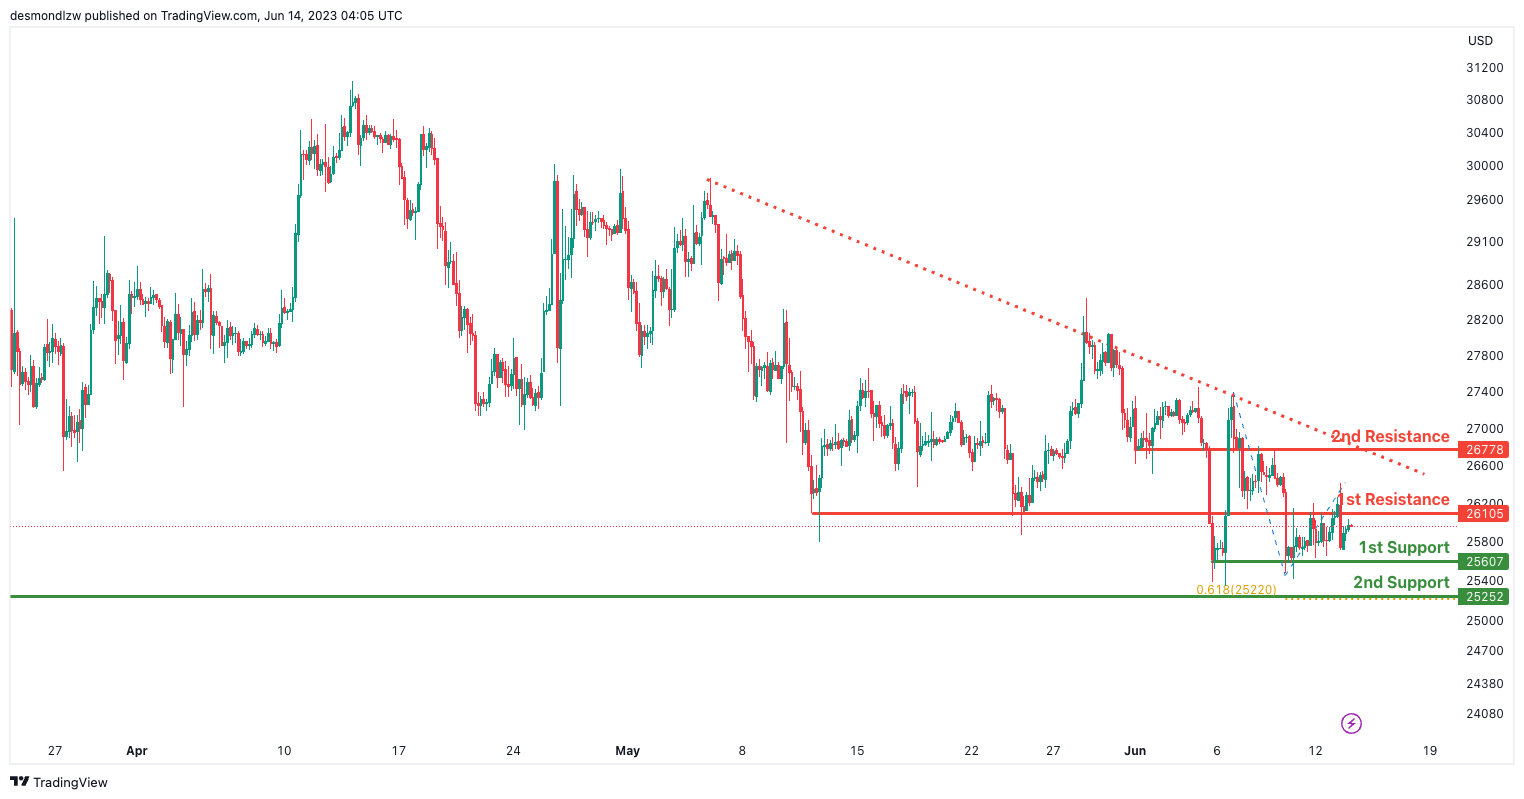
The BTC/USD chart currently exhibits a bearish momentum, indicating a downward trend in the market.
There is a possibility for the price to fluctuate between the first resistance level at 26105 and the first support level at 25607.
Support levels include the first support at 25607, identified as a multi-swing low support, and the second support at 25252, characterized as a swing low support and coinciding with a 61.80% Fibonacci projection.
Furthermore, the first resistance level at 26105 is an area of overlap resistance.
Similarly, the second resistance level at 26778 also represents an area of overlap resistance.
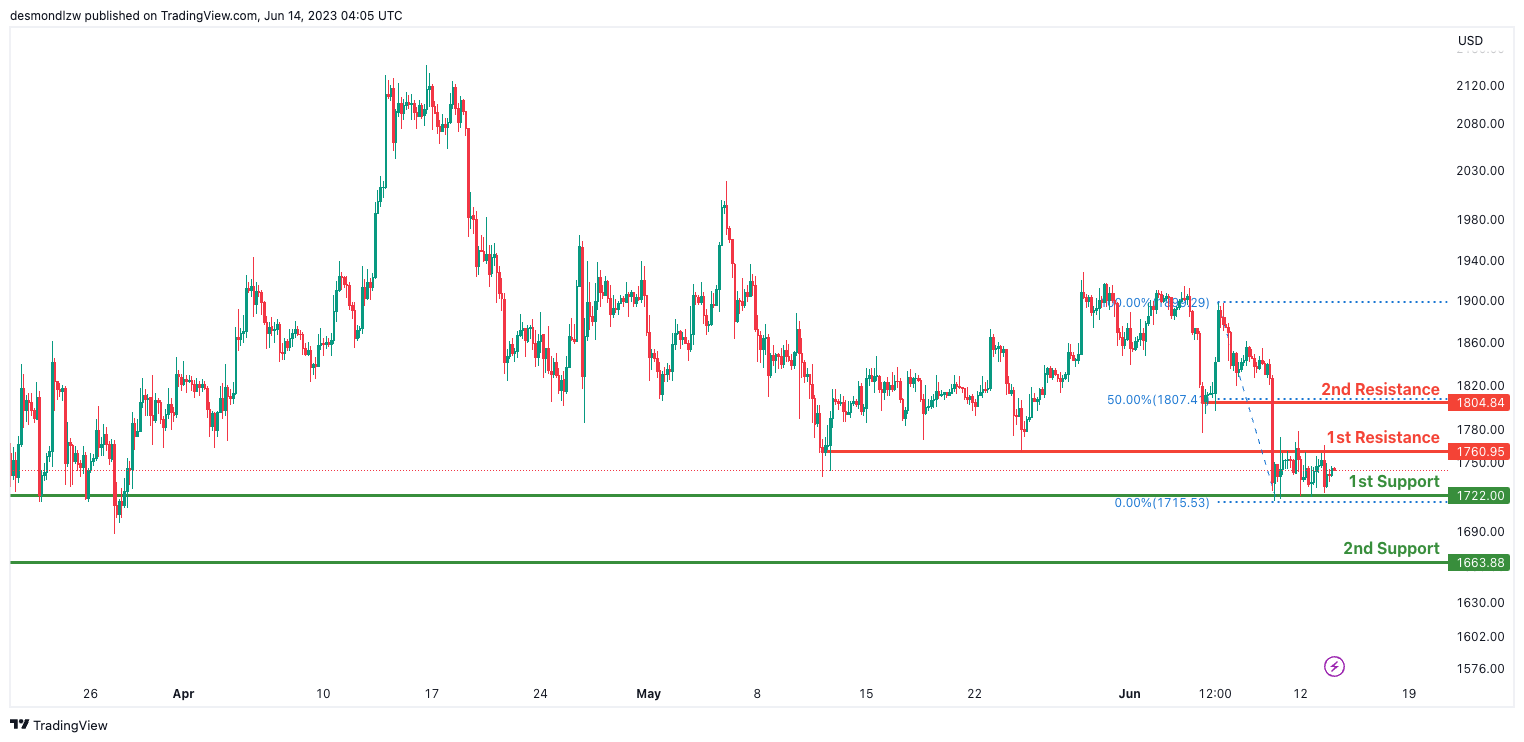
ETH/USD:
The ETH/USD chart currently demonstrates a neutral momentum, indicating a lack of clear direction in the market.
There is a possibility for the price to fluctuate between the first resistance level at 1760.95 and the first support level at 1722.00.
Support levels include the first support at 1722.00, recognized as an overlap support, and the second support at 1663.88, identified as a swing low support.
On the upside, the first resistance level at 1760.95 acts as an area of overlap resistance.
Similarly, the second resistance level at 1804.84 serves as a pullback resistance and coincides with the 50% Fibonacci retracement level.
WTI/USD:
The WTI chart currently shows a bearish momentum, indicating a downward trend in the market.
There is a possibility for the price to react bearishly at the first resistance level at 70.66 and drop towards the first support level at 67.51.
Support levels include the first support at 67.51, recognized as a multi-swing low support, and the second support at 64.78, which is also a multi-swing low support and aligns with the 127.20% Fibonacci Extension level.
On the upside, the first resistance level at 70.66 acts as a pullback resistance and coincides with the 50% Fibonacci Retracement level.
Additionally, the second resistance level at 74.23 is an area of overlap resistance to watch.
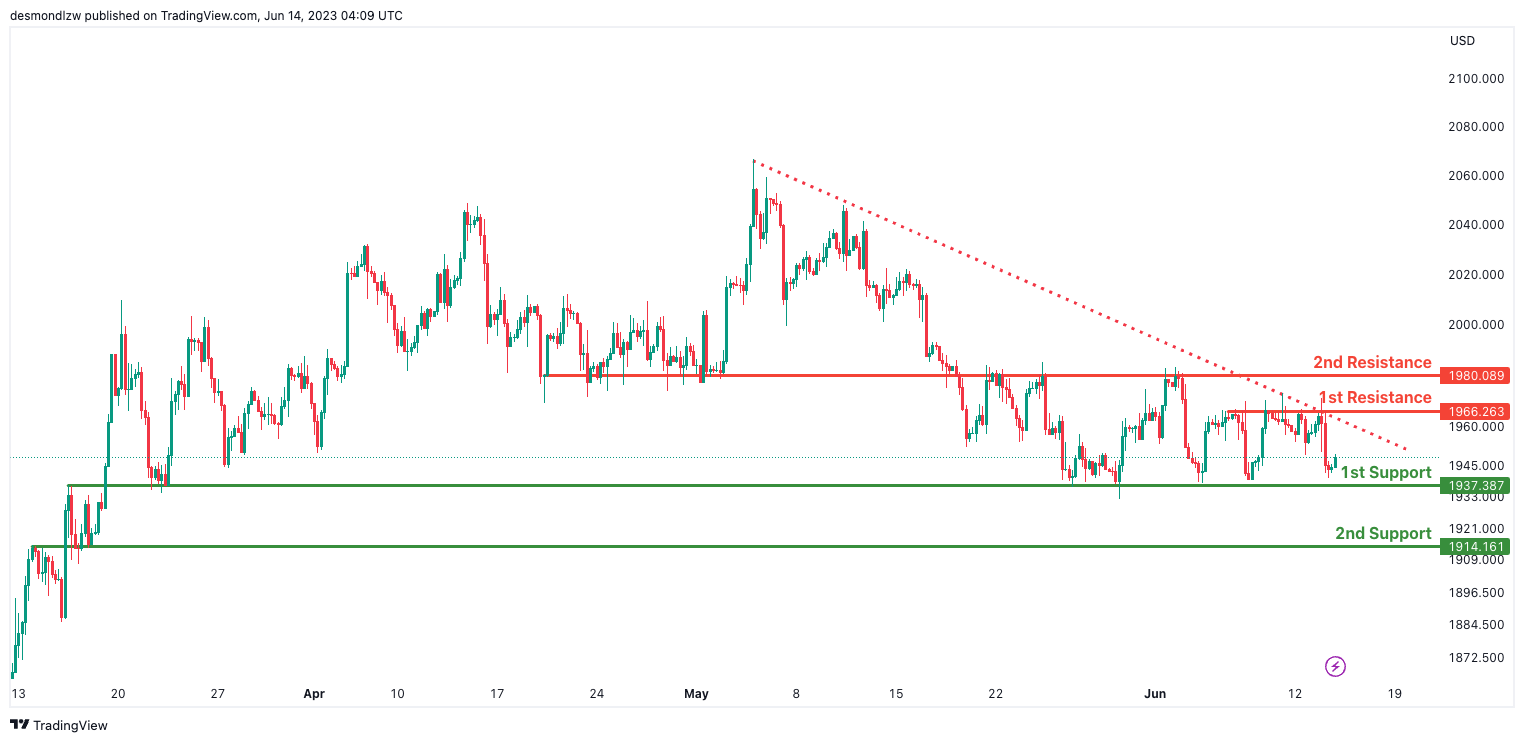
XAU/USD (GOLD):
The XAU/USD chart currently exhibits a bearish momentum, indicating a downward trend in the market.
There is a potential for a bearish reaction at the first resistance level of 1966.26, followed by a drop towards the first support level at 1937.38.
Support levels include the first support at 1937.38 and the second support at 1914.16, both identified as areas of overlap support.
On the upside, the first resistance level at 1966.26 is a multi-swing high resistance, while the second resistance level at 1980.08 is an area of overlap resistance.
UK GDP grew 0.2% mom in Apr led by 0.3% growth in services
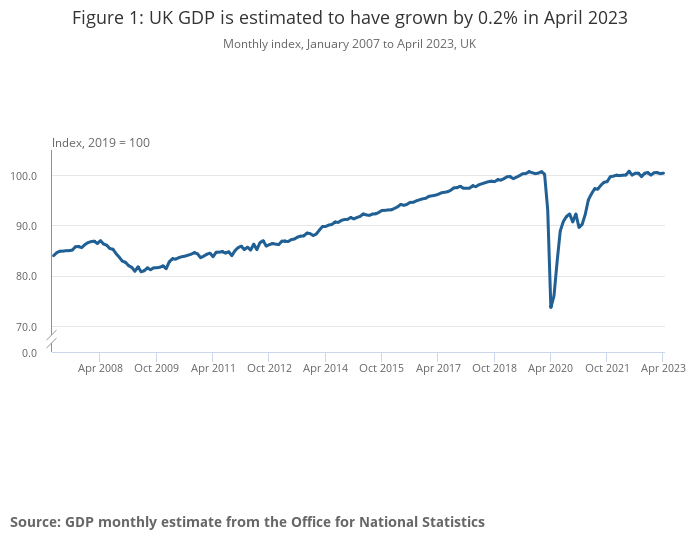
UK GDP grew 0.2% mom in April, matched expectations. Services rose 0.3% mom. Production declined by -0.3% mom. Construction fell -0.6% mom. In the three months to April, GDP grew 0.1%, compared with the three months to January 2023, with falls in 8 of the 14 sub-sectors.
Also released, industrial production fell -0.3% mom, -1.9% yoy in April, versus expectation of -0.1% mom, -2.6% yoy. Manufacturing production declined -0.3% mom, -0.9% yoy, versus expectation of -0.1% mom, -1.8% yoy. Goods trade deficit narrowed from GBP -16.4B to GBP -15.0B, versus expectation of GBP -16.5B.
AUD/USD Daily Report
Daily Pivots: (S1) 0.6734; (P) 0.6771; (R1) 0.6803; More...
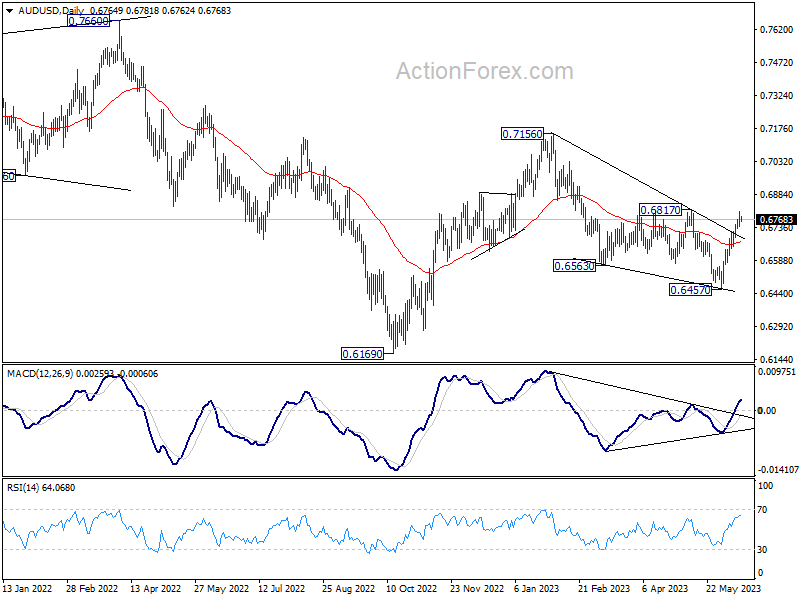
Intraday bias in AUD/USD remains on the upside as rise from 0.6457 is still in progress. Next target is 0.6817 structural resistance. Decisive break there should confirm near term bullish reversal, and pave the way to retest 0.7156 resistance next On the downside though, below 0.6736 minor support will turn intraday bias neutral first.
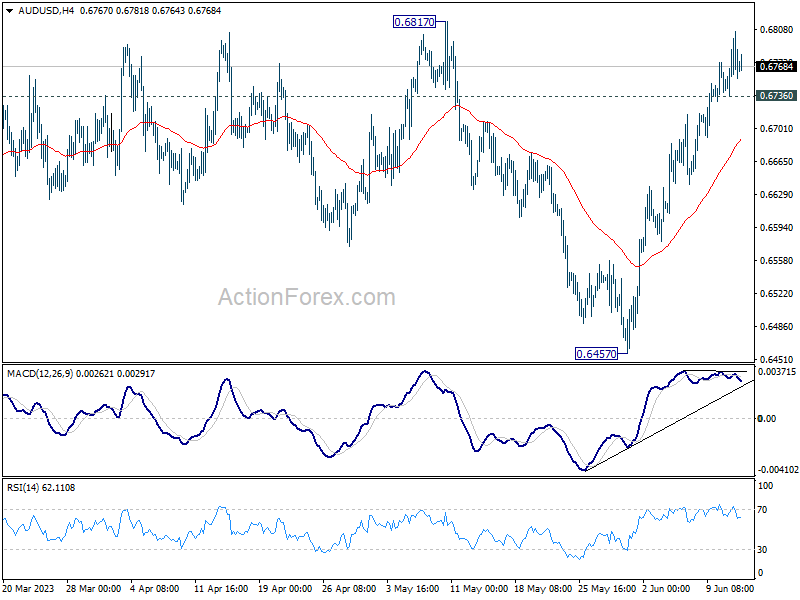
In the bigger picture, as long as 0.6817 resistance holds, the decline from 0.7156, as well as the down trend from 0.8006 (2021) are still in favor to continue through 0.6169 (2022 low) at a later stage. However, firm break of 0.6817 will indicate that fall from 0.7156 has completed in a three-wave corrective structure. Such development will argue that rise from 0.6169 is ready to resume through 0.7156, and add credence to the case that whole down trend from 0.8006 has completed already.
Risk-On Mood Prevails as Fed Decision Looms; EUR/GBP in Spotlight First
The financial markets remain firmly entrenched in a risk-on stance as signs increasingly point towards Fed "skipping" tightening at today's rate decision. As a result, Yen, Swiss Franc, and Dollar are this week's worst performers, exhibiting no clear indications of a resilient bounce. On the other end of the spectrum, Australian and New Zealand Dollar are emerging as the frontrunners, followed by Euro and Sterling.
This current wave of positive sentiment is expected to sustain in the near term. However, market participants should brace for a potential brief pullback once Fed's decision to hold rates steady materializes. Furthermore, the release of new economic projections may incite some market volatility.
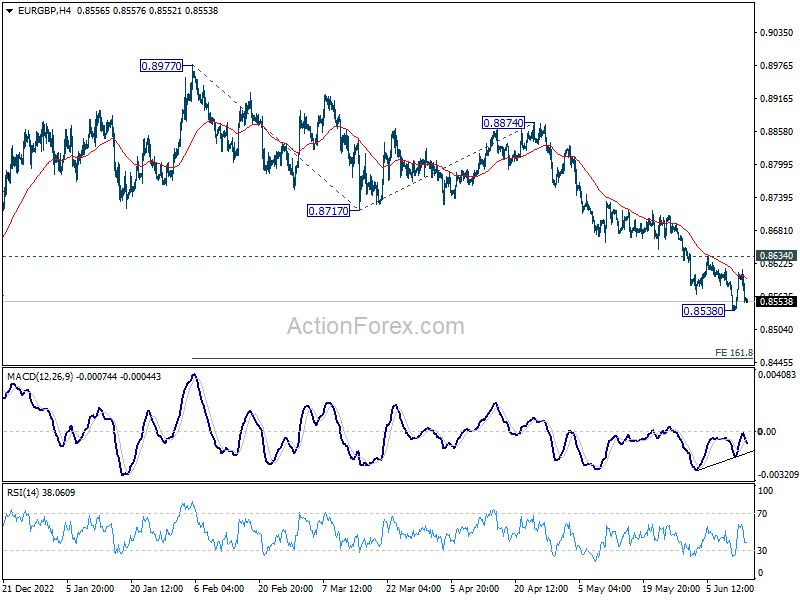
Technically, EUR/GBP is worth some attention in European session today. This week's recovery was rather brief, and capped well below 0.8634 near term resistance. Outlook stays bearish in the cross. Break of 0.8538 will resume the whole decline from 0.8997 to 161.8% projection of 0.8977 to 0.8717 from 0.8874 at 0.8453. Today's UK data might be a trigger for the move.
In Asia, at the time of writing, Nikkei is up 1.18%. Hong Kong HSI is down -0.05%. China Shanghai SSE is up 0.24%. Singapore Strait Times is up 0.70%. Japan 10-year JGB yield is up 0.0118 at 0.433. Overnight, DOW rose 0.43%. S&P 500 rose 0.69%. NASDAQ rose 0.83%. 10-year yield rose 0.074 to 3.839.
FOMC preview: 95% chance of a skip today, 60% chance of another hike in Jul
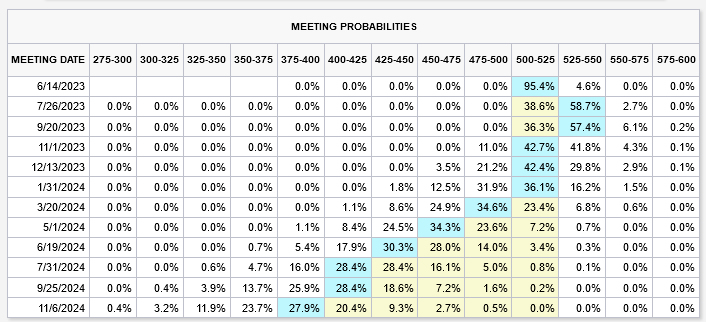
Yesterday's cooling US consumer inflation data in May provided further solid ground for Fed to bypass tightening at today's rate announcement. Fed funds futures now suggest a 95.4% probability of Fed maintaining status quo, holding rates steady at 5.00-5.25%. However, market sentiment leans towards the likelihood of another 25 bps to 5.25-5.50% in July, with over 60% chance.
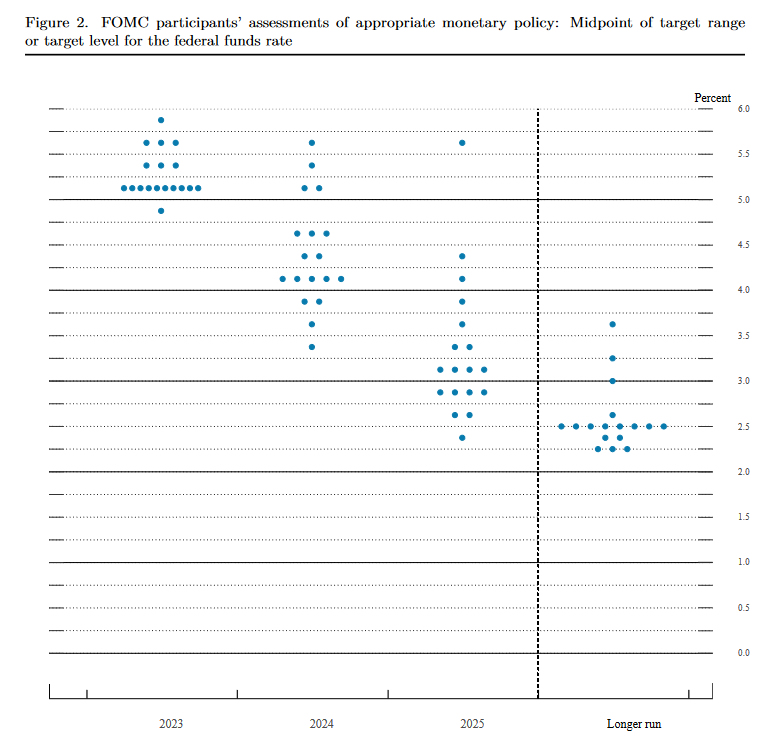
Yet, these market expectations are not set in stone and could see adjustments based on Fed's new economic projections. Rewinding to March, the median interest rate stood at 5.1% for 2023. A perusal of the dot plot reveals that only one policymaker anticipated no additional rate hikes from the current level. In contrast, 10 policymakers forecast one more hike, while seven projected two or more. Changes in this balance could provide insights on whether the interest rate will peak at 5.25-5.50%, as currently predicted by the market.
Furthermore, median interest rate is expected to decline to 4.3% in 2024 and then to 3.1% in 2025. Any deviations from these projections could hint at the duration for which the interest rate will remain at its peak and potentially even suggest a timeline for the initial rate cut.
Some readings on Fed:
- Will Fed Pause After 10 Straight Hikes?
- Fed Preview: On Hold
- June Flashlight for the FOMC Blackout Period
NASDAQ closed at 13-mth high, DOW broke resistance
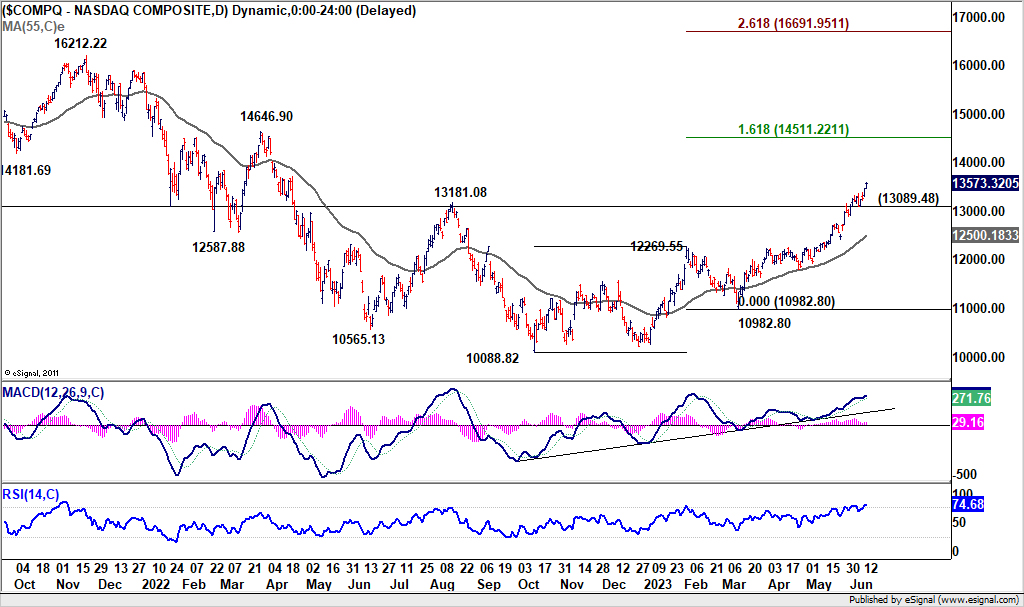
US stocks surged broadly overnight as inflation data solidified a pause at today's FOMC rate decision. NASDAQ extended its near term up trend to close at the highest level in 13 months. For now, near term outlook will stay bullish as long as 13089.48 support holds. Next target is 161.8% projection of 1088.82 to 12269.55 from 10982.80 at 14511.22.
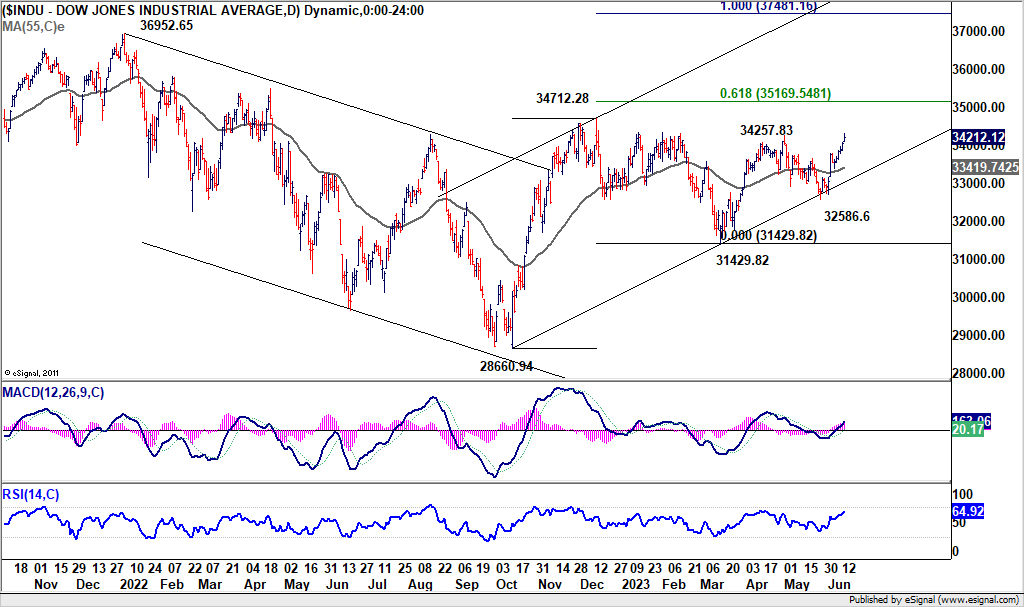
DOW also made notable progress by breaking 34257.83 resistance, even though it could close above the level yet. Near term outlook will stay bullish as long as 55 D EMA (now at 33419.74) holds. Next target is 61.8% projection of 28660.94 to 34712.28 from 314289.82 at 35169.54. Sustained break there could prompt upside acceleration to retest 36952.65 record high.
Looking ahead
UK GDP, production and trade balance are the main feature in European session. Eurozone will also publish industrial production. Later in the day, US PPI will be released before FOMC rate decision and press conference.
AUD/USD Daily Report
Daily Pivots: (S1) 0.6734; (P) 0.6771; (R1) 0.6803; More...
Intraday bias in AUD/USD remains on the upside as rise from 0.6457 is still in progress. Next target is 0.6817 structural resistance. Decisive break there should confirm near term bullish reversal, and pave the way to retest 0.7156 resistance next On the downside though, below 0.6736 minor support will turn intraday bias neutral first.
In the bigger picture, as long as 0.6817 resistance holds, the decline from 0.7156, as well as the down trend from 0.8006 (2021) are still in favor to continue through 0.6169 (2022 low) at a later stage. However, firm break of 0.6817 will indicate that fall from 0.7156 has completed in a three-wave corrective structure. Such development will argue that rise from 0.6169 is ready to resume through 0.7156, and add credence to the case that whole down trend from 0.8006 has completed already.
Economic Indicators Update
| GMT | Ccy | Events | Actual | Forecast | Previous | Revised |
|---|---|---|---|---|---|---|
| 22:45 | NZD | Current Account Q1 | -5.22B | -6.95B | -9.46B | |
| 06:00 | GBP | GDP M/M Apr | 0.20% | -0.30% | ||
| 06:00 | GBP | Industrial Production M/M Apr | -0.10% | 0.70% | ||
| 06:00 | GBP | Industrial Production Y/Y Apr | -2.60% | -2.00% | ||
| 06:00 | GBP | Manufacturing Production M/M Apr | -0.10% | 0.70% | ||
| 06:00 | GBP | Manufacturing Production Y/Y Apr | -1.80% | -1.30% | ||
| 06:00 | GBP | Goods Trade Balance (GBP) Apr | -16.5B | -16.4B | ||
| 09:00 | EUR | Eurozone Industrial Production M/M Apr | 1.20% | -4.10% | ||
| 12:30 | USD | PPI M/M May | 0.20% | 0.20% | ||
| 12:30 | USD | PPI Y/Y May | 1.10% | 2.30% | ||
| 12:30 | USD | PPI Core M/M May | 0.20% | 0.20% | ||
| 12:30 | USD | PPI Core Y/Y May | 0.50% | 3.20% | ||
| 14:30 | USD | Crude Oil Inventories | -1.3M | -0.5M | ||
| 18:00 | USD | Fed Interest Rate Decision | 5.25% | 5.25% | ||
| 18:30 | USD | FOMC Press Conference |
NASDAQ closed at 13-mth high, DOW broke resistance
US stocks surged broadly overnight as inflation data solidified a pause at today's FOMC rate decision. NASDAQ extended its near term up trend to close at the highest level in 13 months. For now, near term outlook will stay bullish as long as 13089.48 support holds. Next target is 161.8% projection of 1088.82 to 12269.55 from 10982.80 at 14511.22.
DOW also made notable progress by breaking 34257.83 resistance, even though it could close above the level yet. Near term outlook will stay bullish as long as 55 D EMA (now at 33419.74) holds. Next target is 61.8% projection of 28660.94 to 34712.28 from 314289.82 at 35169.54. Sustained break there could prompt upside acceleration to retest 36952.65 record high.
FOMC preview: 95% chance of a skip today, 60% chance of another hike in Jul
Yesterday's cooling US consumer inflation data in May provided further solid ground for Fed to bypass tightening at today's rate announcement. Fed funds futures now suggest a 95.4% probability of Fed maintaining status quo, holding rates steady at 5.00-5.25%. However, market sentiment leans towards the likelihood of another 25 bps to 5.25-5.50% in July, with over 60% chance.
Yet, these market expectations are not set in stone and could see adjustments based on Fed's new economic projections. Rewinding to March, the median interest rate stood at 5.1% for 2023. A perusal of the dot plot reveals that only one policymaker anticipated no additional rate hikes from the current level. In contrast, 10 policymakers forecast one more hike, while seven projected two or more. Changes in this balance could provide insights on whether the interest rate will peak at 5.25-5.50%, as currently predicted by the market.
Furthermore, median interest rate is expected to decline to 4.3% in 2024 and then to 3.1% in 2025. Any deviations from these projections could hint at the duration for which the interest rate will remain at its peak and potentially even suggest a timeline for the initial rate cut.
Some readings on Fed:
ECB Policy Meeting: More Rate Hikes to Come
An inflation peak is not enough for central banks to stop raising interest rates. The Reserve Bank of Australia and the Bank of Canada resumed their rate hike strategy unexpectedly last week for the sake of their inflation target, having previously pledged a pause. The European Central bank (ECB) could follow suit on Thursday at 12:15 GMT, but the announcement might not surprise investors, with guidance on future rate increases likely attracting the most attention.
Pause not in sight as inflation remains elevated
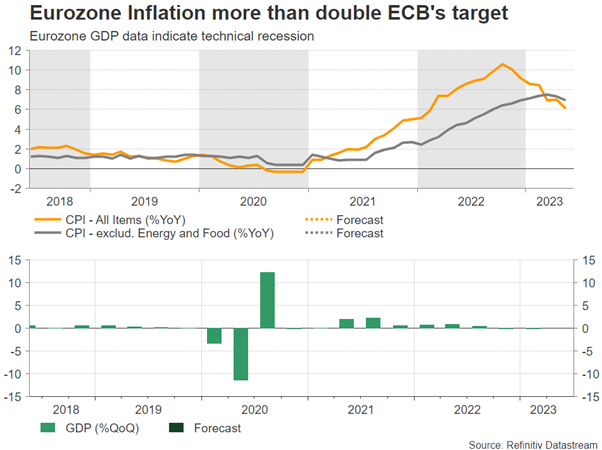
It's hard to argue that the fight against inflation is over. Even though the CPI inflation figures are past their 2022 peaks in developed economies, they are still more than double the central banks’ targets. Many focus on the falling headline CPI, but the core measure, which is a better proxy of the inflation trend, has barely eased from its April peak of 5.7% y/y in the eurozone, flagging a permanent inflation risk that the ECB might struggle to overcome. Notably, the core measure, which excludes food, energy, and tobacco, has barely eased, arriving at 6.9% y/y recently.
Hence, ECB policymakers are reasonably sustaining a hawkish communication, with President Lagarde recently stressing the need to raise rates to levels sufficiently restrictive and keep them at those levels as long as necessary. She also highlighted the impact of some businesses profiting from high inflation by raising prices more than they have to and urged competition authorities to investigate.
Guidance important for euro
Another quarter percentage rate hike to 3.5% is currently looking like a done deal, and there is a negligible group of investors who are even thinking that the rate discussion may expand to a bolder 50bps rate hike. That suggests there is a lot of hawkishness priced in already, which could consequently leave little room for improvement for the euro.
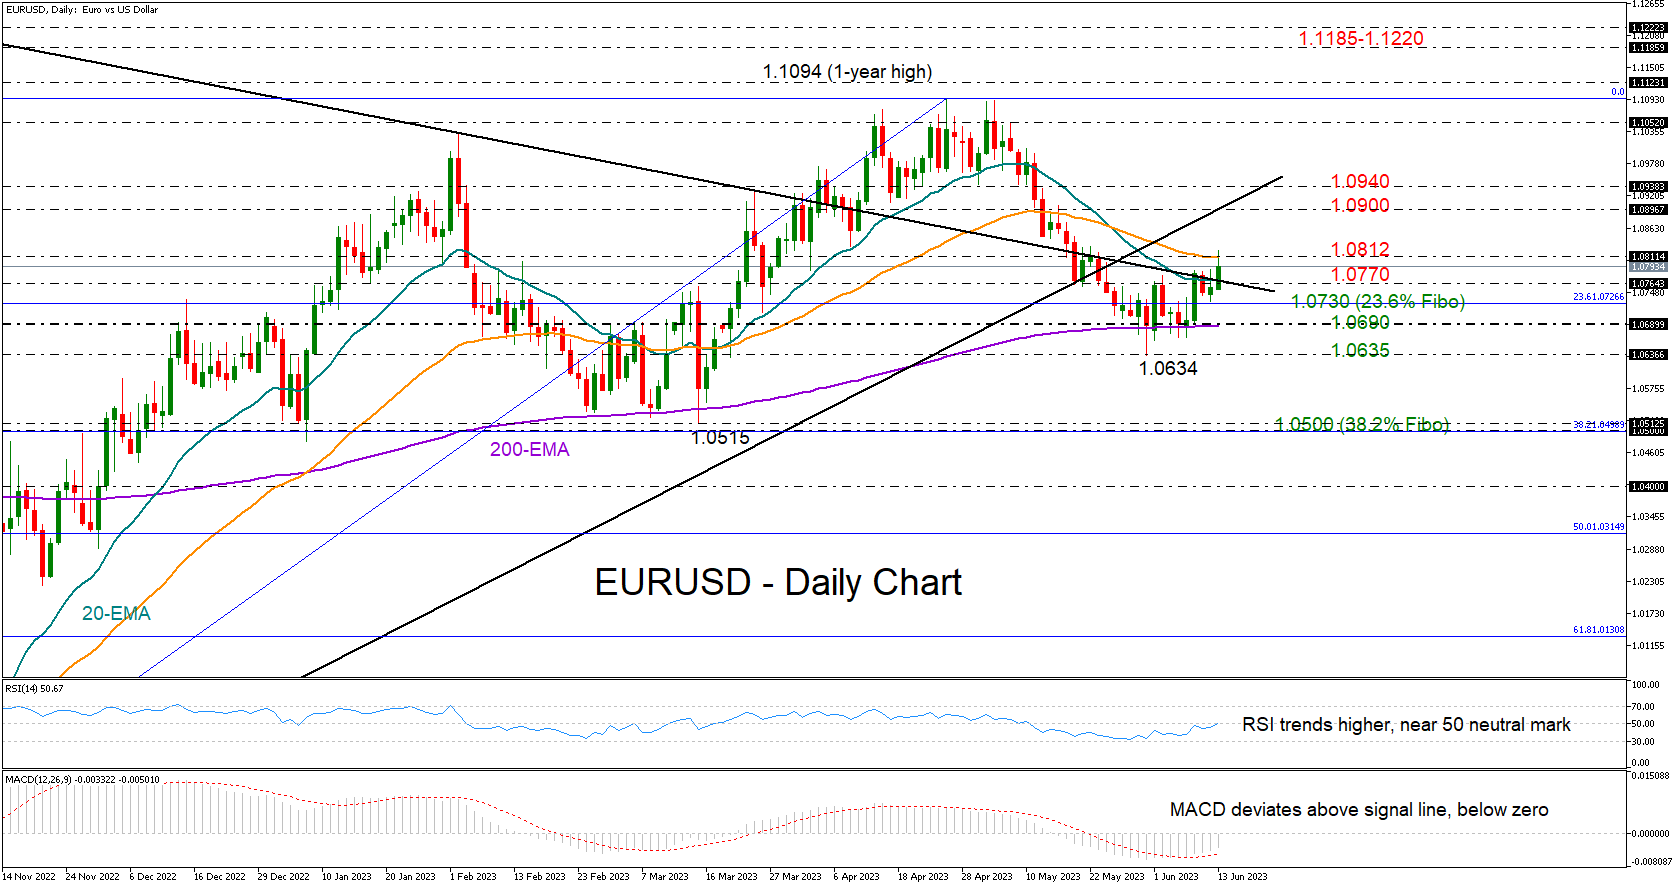
Commentary on future policy actions, however, could still help euro/dollar extend its positive momentum and run towards the 1.0900 territory. Policymakers have clearly restated that the costs of doing too little is still greater than the costs of doing too much. Therefore, the negative GDP growth figures, which put the bloc in a technical recession, may raise some caution within the board but are not expected to prevent additional rate hikes in the coming months.
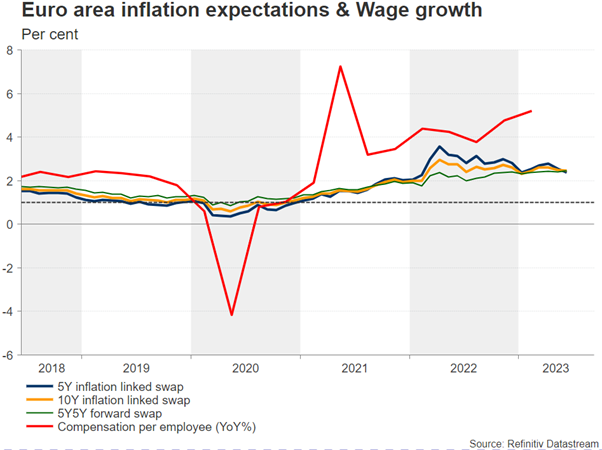
Investors anticipate an equal 25bps rate hike in July with a probability of 62% before a period of steady rates kicks in. Apparently, a repetition of the aggressive rate increases that took place over the past year could find little backing given the worsening economic picture and the falling household inflation expectations. Yet, policymakers may judge that acting now rather than later could be a safer option, especially as long as the labor market remains tight and wage growth trends higher. New economic projections, and specifically updated inflation forecasts, could provide more evidence on the central bank’s thinking.
Should the central bank lower its inflation estimates, signaling that a rate peak is closer than analysts believe, euro/dollar could erase its latest pickup to test its flattening 200-day exponential moving average (EMA) at 1.0690 ahead of May’s low of 1.0635. A decisive close lower could intensify selling pressures towards the 1.0500 floor.
Quantitative tightening
In other interesting topics, balance sheet talks could also come under the limelight. The ECB has been struggling to reduce the size of its huge balance sheet after the pandemic boost, leaving excess liquidity in money markets and making its monetary tightening less effective. It promised to accelerate quantitative tightening by reducing reinvestment from maturing securities at a faster pace of 25 billion euros in July compared to 15 billion euros before. Therefore, any extra details on the matter could make headlines, although that might be a story for the next policy meeting.