Sample Category Title
Dollar Index: Dollar Index Attacks Again Key Supports ahead of Fed’s Verdict
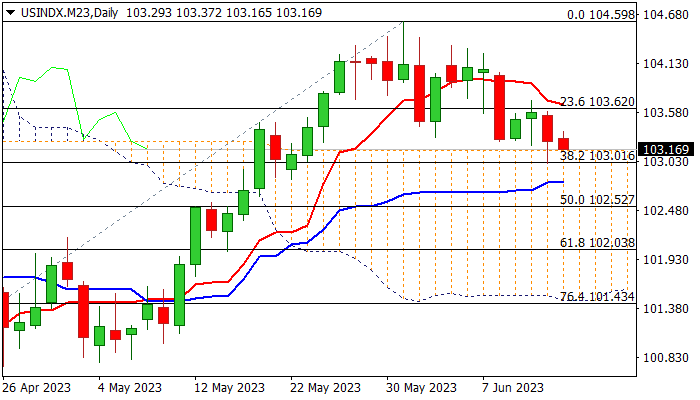
The dollar index is standing at the back foot and consolidating above three-week low in early Wednesday, following Tuesday’s post-US CPI drop and subsequent bounce which kept the price action above key supports at 103.15/01 (top of thick daily cloud/Fibo 38.2% of 100.45/104.59).
Near-term picture remains bearishly aligned, weighed by rising negative momentum and 10/20DMA bear-cross, but the action needs to see clear break of 103.15/01 pivots to signal bearish continuation and open way for deeper drop.
The demand for dollar dropped on softer than expected inflation in May which added to strong expectations that Fed will pause rate hikes this time, though the consumer prices are still twice the Fed target and core inflation at 5.3%, providing a little relief.
Markets see a pause in policy tightening as likely scenario, but even in case of no more hikes in coming months, the borrowing cost is expected to remain high for some time, which would underpin the dollar in the longer run.
Res: 103.67; 104.00; 104.33; 104.58.
Sup: 103.01; 102.83; 102.57; 102.03.
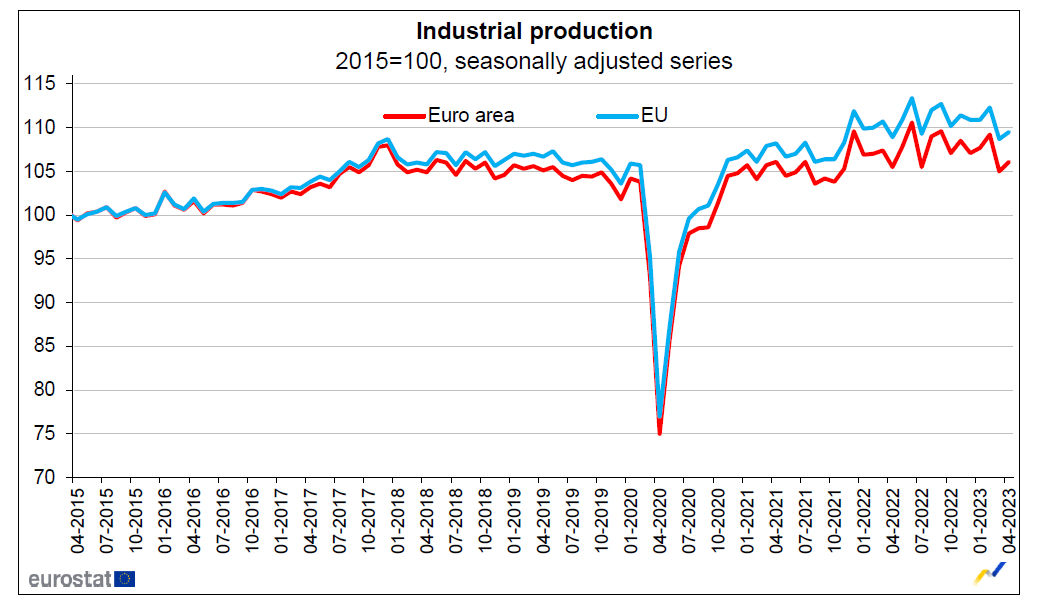
Eurozone industrial production rose 1.0% mom, EU up 0.7% mom
Eurozone industrial production rose 1.0% mom in April, below expectation of 1.2% mom. Production of capital goods grew by 14.7% mom and energy by 1.0% mom, while production of intermediate goods fell by -1.0% mom, durable consumer goods by -2.6% mom and non-durable consumer goods by -3.0% mom.
EU industrial production rose 0.7% mom. Among Member States for which data are available, the highest monthly increases were registered in Ireland (+21.5%), Lithuania (+2.8%) and Sweden (+1.4%). The largest decreases were observed in Slovenia (-7.9%), Portugal (-5.5%) and the Netherlands (-3.5%).
NZDUSD Bulls Hold the Upper Hand after the False Bearish Breakout
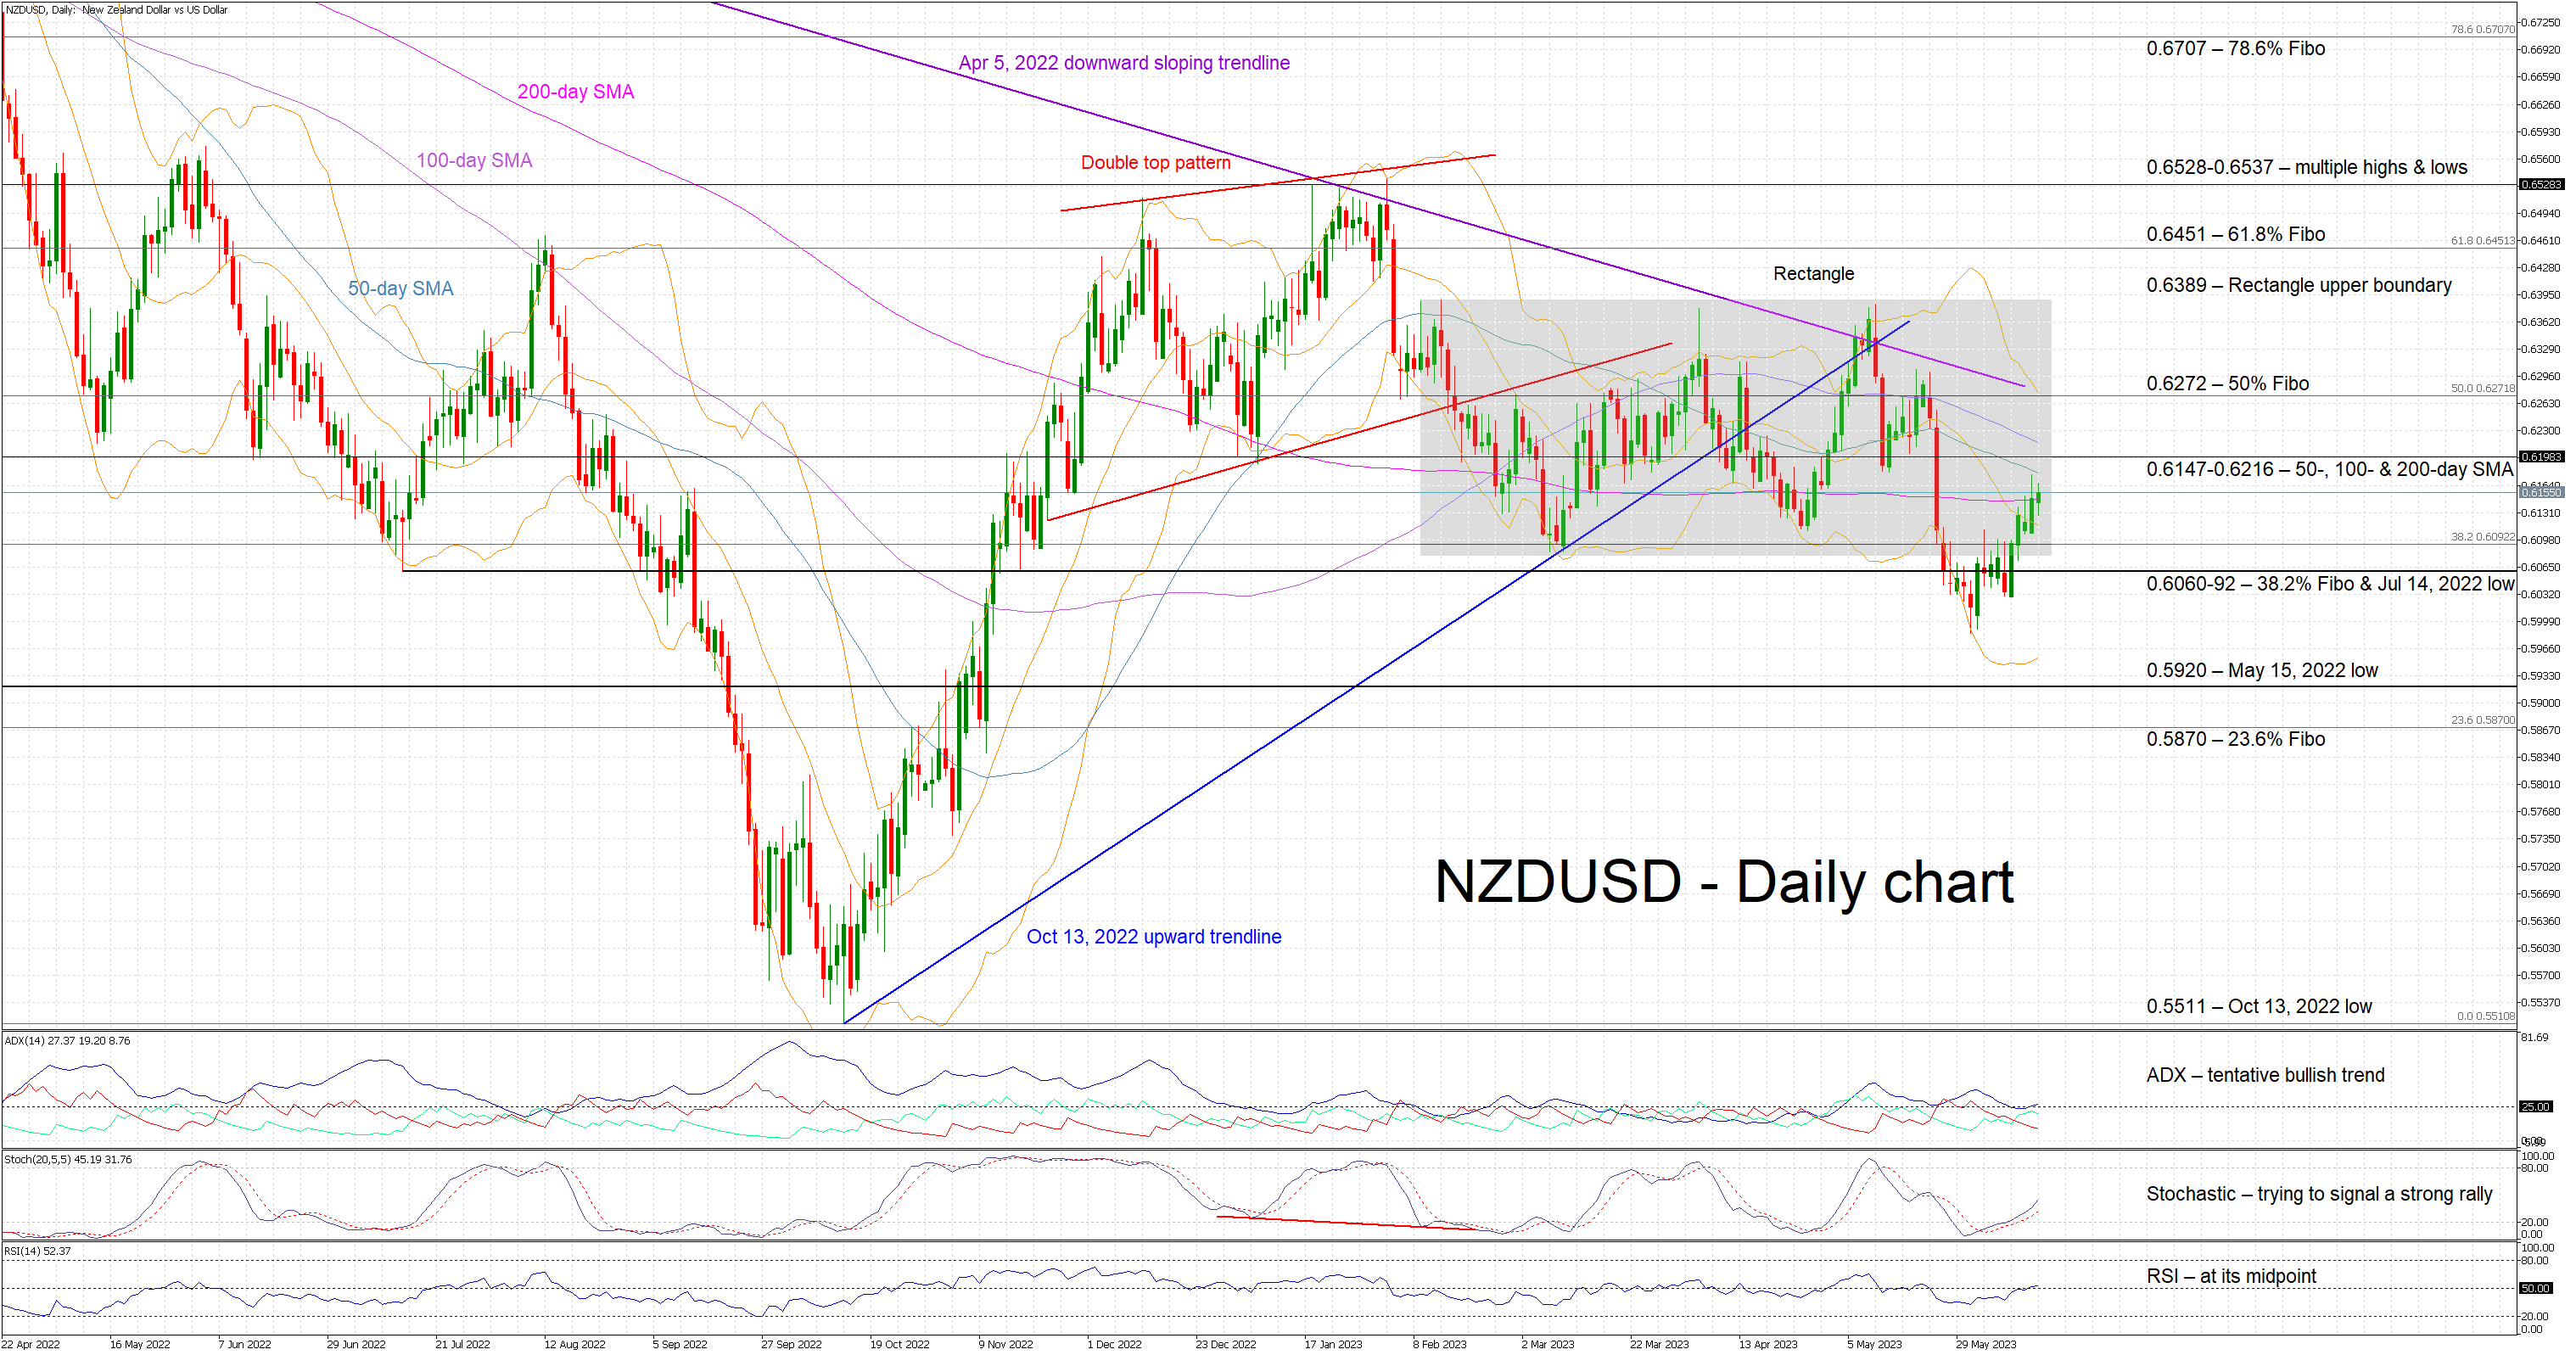
NZDUSD has returned inside the rectangle that has been dictating the price action since February 2023 as the recent bearish breakout proved to be false. This move has clearly dented the NZD bears’ confidence, but they have to react quickly in order to contain the bullish pressure.
NZDUSD is currently hovering around the 200-day simple moving average (SMA) as the momentum indicators are tentatively supporting the current upleg. The Average Directional Movement Index (ADX) is edging higher, signaling a decent bullish trend, and the RSI is hovering just above its 50-midpoint. More interestingly, the stochastic oscillator is edging higher, opening a sizeable gap from its moving average, and hence pointing to the continuation of the current rally.
If the NZD bulls try to further capitalize on the failed bearish breakout, they have to break the busy 0.6147-0.6216 area that is defined by the 50-, 100- and 200-day SMAs. Higher, the 50% Fibonacci retracement of the April 5, 2022 – October 13, 2022 downtrend at 0.6272 could prove tougher to crack than anticipated.
On the other hand, if the NZD bears decide to negate the current bullish move, they have to push the pair below the 200-day SMA. They would then have to recapture the 0.6060-0.6092 range populated by the 38.2% Fibonacci retracement and the July 14, 2022 low respectively. Another bearish breakout looks premature but if the NZD bears appear confident, they would set their eyes on the May 15, 2022 low at 0.5920.
To sum up, NZDUSD bulls have the chance for a strong rally following the false bearish breakout, as the bears look for the appropriate area to set up their defence.
USDJPY in Rangebound ahead of FOMC Rate Decision
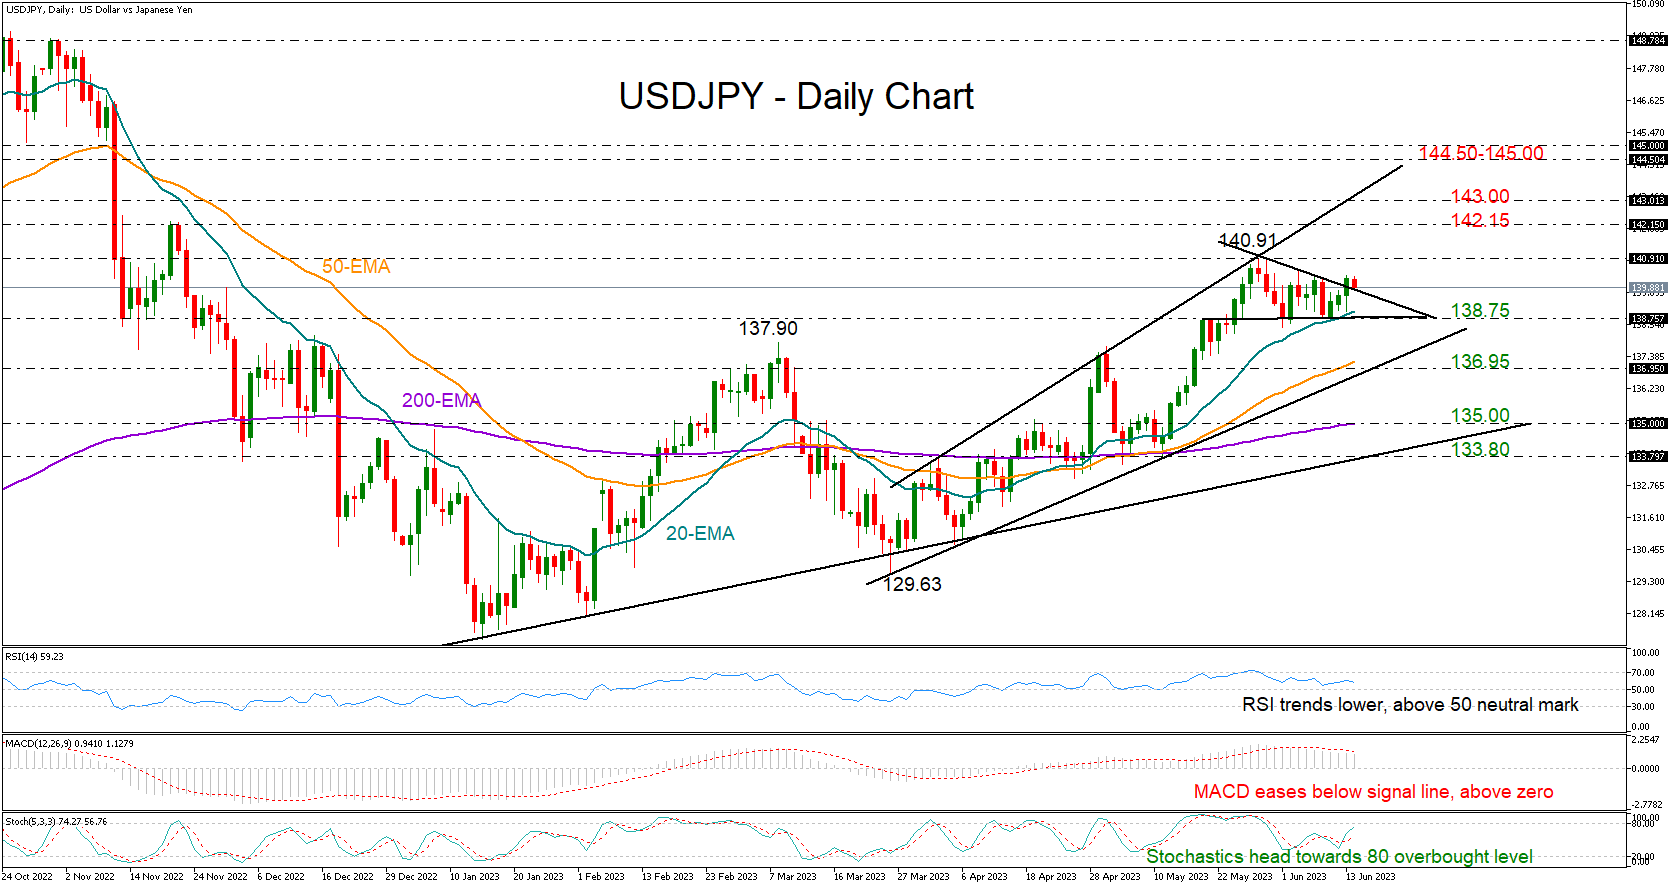
USDJPY was trading muted within a short-term range and marginally above the 140.00 level prior to the FOMC policy announcement.
The pair bounced on the 20-day exponential moving average (EMA) once again on Tuesday, increasing optimism that the bulls could take charge in the short-term. The RSI is still hovering above its 50 neutral mark, reflecting a positive bias. Though, its falling trend is witnessing persisting caution in the market. In other warning signals, the MACD remains below its red signal line, while the stochastic oscillator is not far below its 80 overbought level. The descending triangle in the short-term picture is feeding some skepticism as well, although the price is currently trading slightly above it.
Buyers may wait for a close above May’s peak of 140.90 to drive the price up to the 142.15 resistance taken from November 21. A dynamic bullish correction could reach the resistance line from March at 143.00. Breaking higher, the pair may next visit the 144.50-145.00 region.
On the downside, a forceful move below the 20-day EMA and the 138.75 floor could squeeze the price towards the 50-day EMA and the support trendline at 136.95. Should the bears push lower, the next pivot could take place around the 200-day EMA at 135.00, while the 2023 ascending trendline may also attract special attention at 133.80.
In summary, USDJPY is in a neutral mode in the short-term picture. A step above 140.90 or below 138.75 could provide the next direction in the market.
EUR/USD Turns Green While USD/JPY Faces Hurdle
EUR/USD started a fresh increase above the 1.0740 resistance. USD/JPY is consolidating and facing hurdles near the 140.45 level.
Important Takeaways for EUR/USD and USD/JPY Analysis Today
- The Euro is rising and trading well above the 1.0740 resistance zone.
- There is a key bullish trend line forming with support near 1.0785 on the hourly chart of EUR/USD at FXOpen.
- USD/JPY is trading in a positive zone above the 139.65 and 139.15 levels.
- There was a break above a bearish trend line with resistance near 139.65 on the hourly chart at FXOpen.
EUR/USD Technical Analysis
On the hourly chart of EUR/USD at FXOpen, the pair started a fresh increase from the 1.0670 zone. The Euro climbed above the 1.0710 resistance zone against the US Dollar.
The pair even settled above the 1.0740 resistance and the 50-hour simple moving average. Finally, the bears appeared near the 1.0820 zone. A high is formed near 1.0818 and the pair is now consolidating gains.
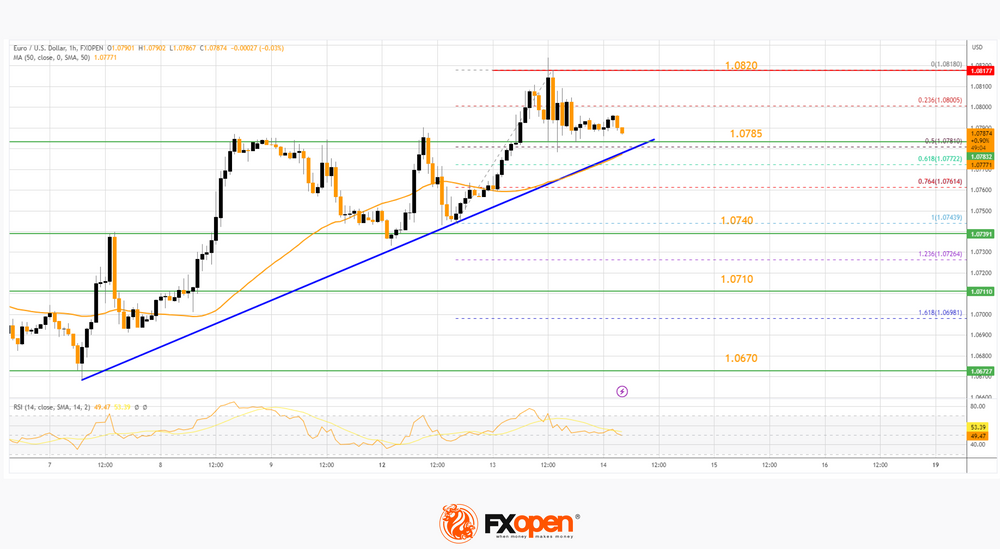
It traded below the 23.6% Fib retracement level of the upward move from the 1.0743 low to the 1.0818 high. The first major support is near a key bullish trend line at 1.0785 and the 50-hour simple moving average.
The trend line is close to the 50% Fib retracement level of the upward move from the 1.0743 low to the 1.0818 high. If there is a downside break below 1.0785, the pair could drop toward the 1.0740 support. The next major support on the EUR/USD chart is near 1.0710, below which the pair could start a major decline.
On the upside, the pair is now facing resistance near 1.0820. The next major resistance is near the 1.0850 level. An upside break above 1.0850 could set the pace for another increase. In the stated case, the pair might visit 1.0920.
USD/JPY Technical Analysis
On the hourly chart of USD/JPY at FXOpen, the pair started a fresh increase from the 139.00 zone. It gained bullish momentum and was able to clear the 139.50 resistance.
There was also a break above a bearish trend line with resistance near 139.65 and the 50-hour simple moving average. However, the bears are active near the 140.25 resistance zone. A high was formed near 140.30 before the pair corrected lower.
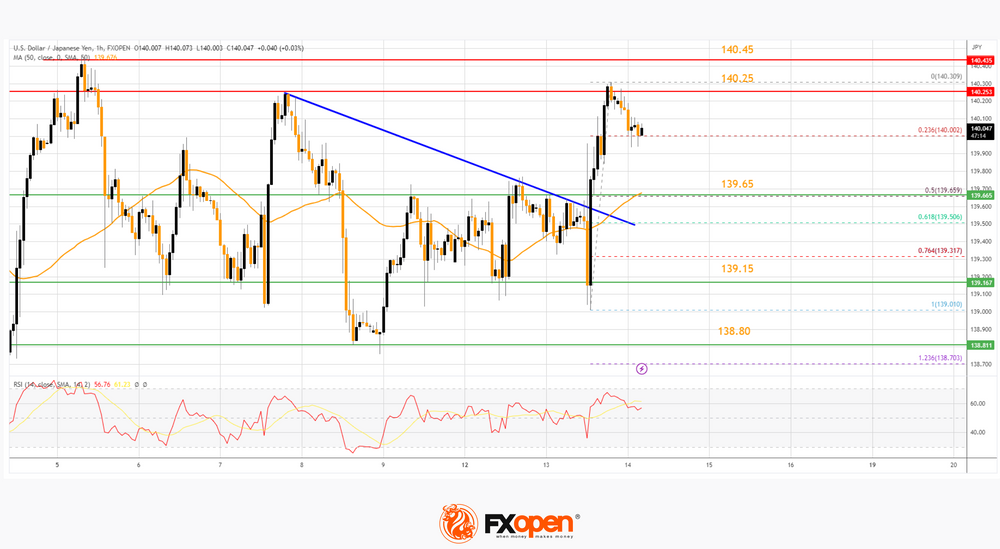
The pair is now trading near the 23.6% Fib retracement level of the upward move from the 139.01 swing low to the 140.30 high.
The first major support on the USD/JPY chart is near the 50-hour simple moving average at 139.65. It is close to the 50% Fib retracement level of the upward move from the 139.01 swing low to the 140.30 high. The next major support is near the 139.15 level, below which the pair could decline steadily. In the stated case, the pair might dive toward the 138.8 support.
On the upside, the pair is facing resistance near the 140.25 level. The first major resistance is near the 140.45 level. If there is a close above the 140.45 level and RSI moves above 65, the pair could rise toward 141.20. The next major resistance is near 141.50, above which the pair could test 142.00.
Fed “Skips”, Stocks Hop?
The Fed is widely expected to hit the pause button today on its rate hike campaign that began over a year ago, before hiking once more in the third quarter. The notion for a Fed “skip” was bolstered by yesterday’s CPI data that point to slowing US inflation. An unexpected rate hike today would shock markets.
US stocks have been soaring amid hopes that peak US rates are close at hand. These expectations have served as an added tailwind to the AI-mania that has propelled tech stocks higher, with Nvidia securing its membership in the trillion-dollar club yesterday while Apple notched a fresh record high earlier this week.
Ultimately, markets will be laser-focused on the Fed’s signals about future policy moves as contained within the FOMC policy statement, dot plot, and Chair Powell’s press conference.
If the Fed suggests that its benchmark rates have to move even higher, beyond the sole remaining 25-bp hike forecast by markets, that should translate into an immediate boost for the US dollar while eroding support for gold. The thought that the Fed still has to work harder to achieve its inflation target may also give equity bulls reason to pause their heady ascent of late.
Should Powell and co. deliver on the market’s existing expectations, or even offer up hints of dovishness, that should allow US stocks to hop higher and add to recent gains.
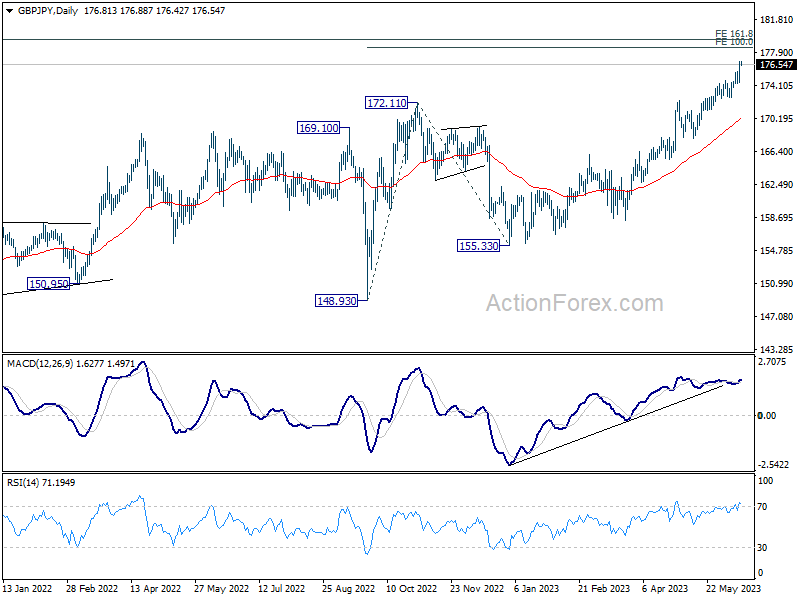
GBP/JPY Daily Outlook
Daily Pivots: (S1) 175.25; (P) 176.05; (R1) 177.65; More...
GBP/JPY's up trend is still in progress. Intraday bias stays on the upside for 100% projection of 148.93 to 172.11 from 155.33 at 178.51 next. Strong resistance could be seen from there to bring pull back, at least on first attempt. On the downside, break of 174.33 minor support will turn intraday bias neutral first.
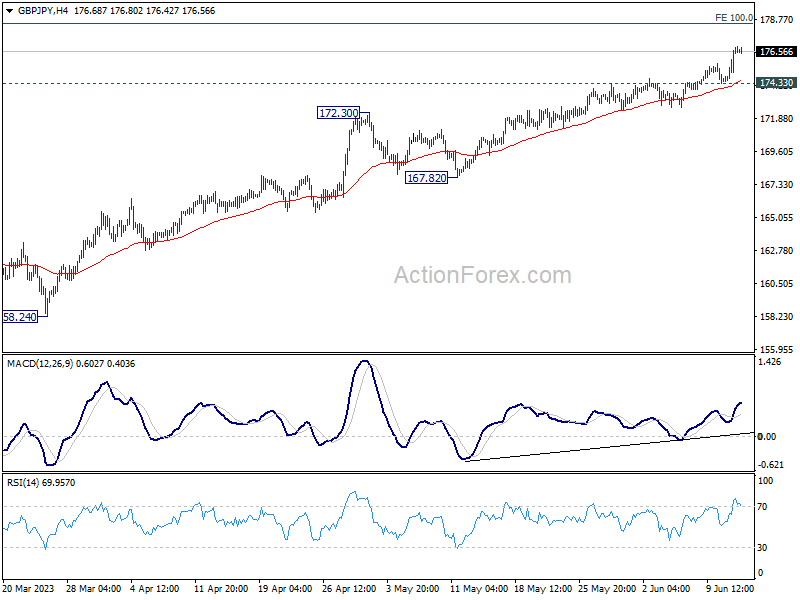
In the bigger picture, up trend from 123.94 (2020 low) is extending. Next target will be 161.8% projection of 122.75 (2016 low) to 156.59 (2018 high) from 123.94 at 178.69. For now, medium term outlook will remain bullish as long as 167.82 support holds, even in case of deep pull back.
EUR/JPY Daily Outlook
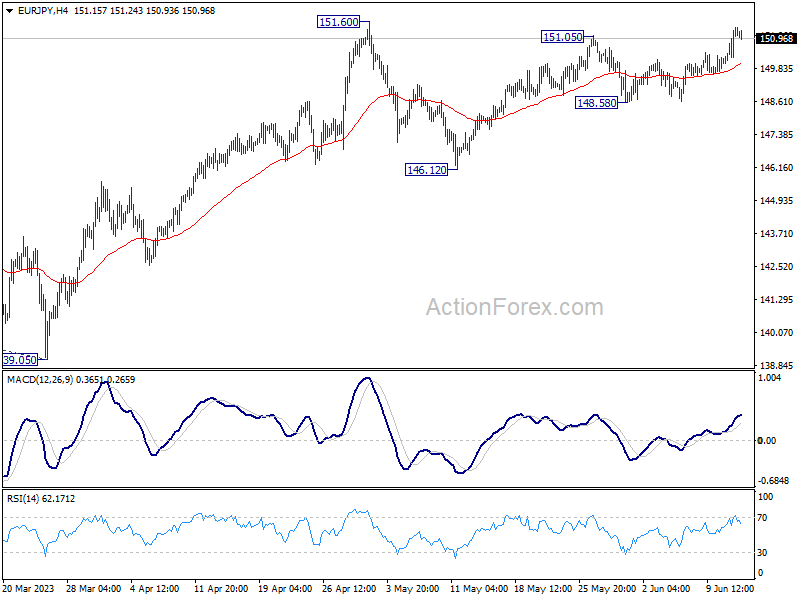
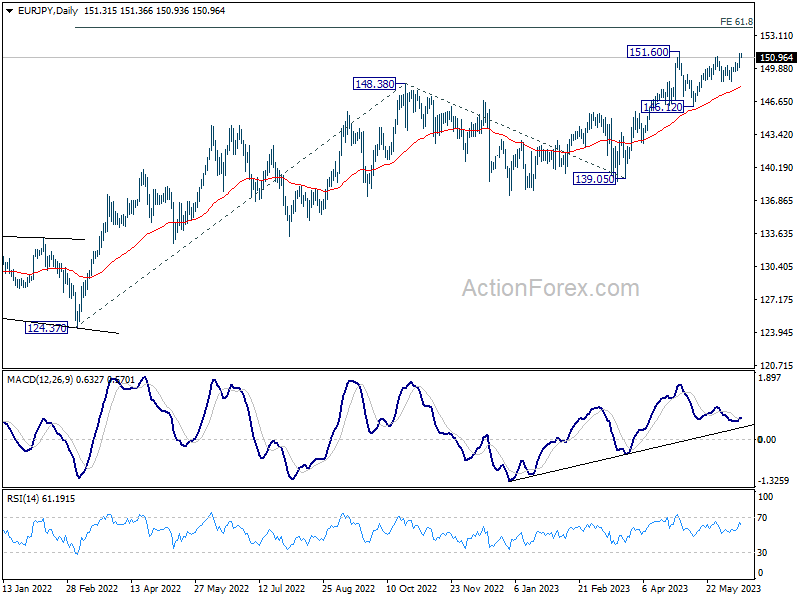
Daily Pivots: (S1) 150.47; (P) 150.92; (R1) 151.81; More....
Intraday bias in EUR/JPY is back on the upside with break of 151.05 resistance. Firm break of 151.60 hill will resume larger up trend and target 153.64 projection level. For now, risk will stay on the upside as long as 148.58 support holds, in case of retreat.
In the bigger picture, rise from 114.42 (2020 low) is in progress. Next target is 61.8% projection of 124.37 to 148.38 from 138.81 at 153.64. Sustained break there will pave the way to 100% projection at 162.82. For now, medium term outlook will remain bullish as long as 139.05 support holds, even in case of deep pull back.
EUR/GBP Daily Outlook
Daily Pivots: (S1) 0.8536; (P) 0.8575; (R1) 0.8596; More...
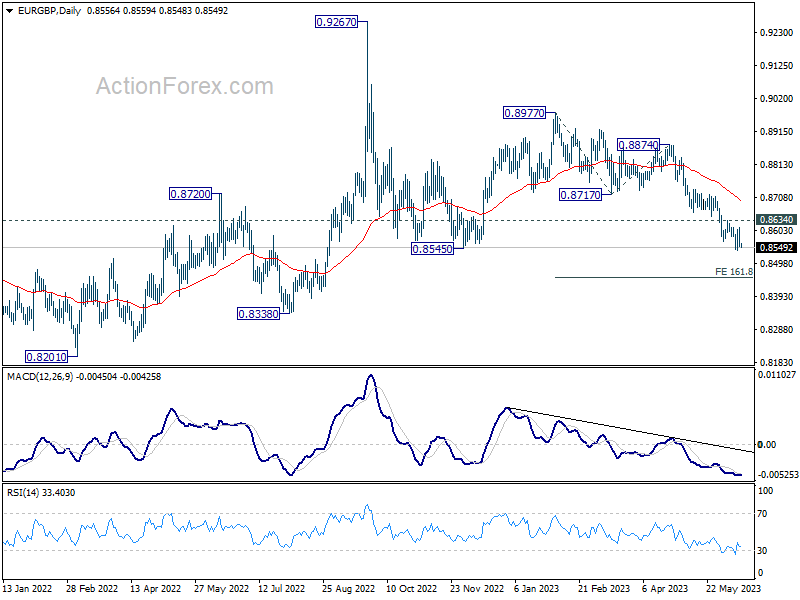
Intraday bias in EUR/GBP remains neutral as consolidation form 0.8538 is extending. Outlook will stay bearish as long as 0.8634 resistance holds. Break of 0.8538 will resume larger decline from 0.8977 to 161.8% projection of 0.8977 to 0.8717 from 0.8874 at 0.8453. However, considering bullish convergence condition in 4H MACD, firm break of 0.8634 will indicate short term bottoming and turn bias to the upside for stronger rebound.
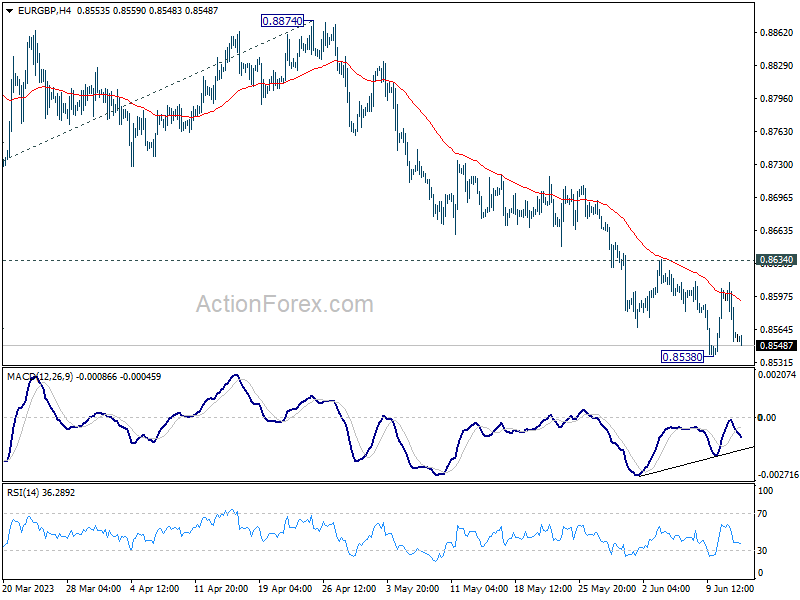
In the bigger picture, the down trend from 0.9267 (2022 high) is still in progress. It's seen as part of the long term range pattern from 0.9499 (2020 high). Deeper fall would be seen towards 0.8201 (2022 low). But strong support should be seen from there to bring reversal. This will now remain the favored case as long as 0.8717 support turned resistance holds.
EUR/AUD Daily Outlook
Daily Pivots: (S1) 1.5894; (P) 1.5938; (R1) 1.5996; More...
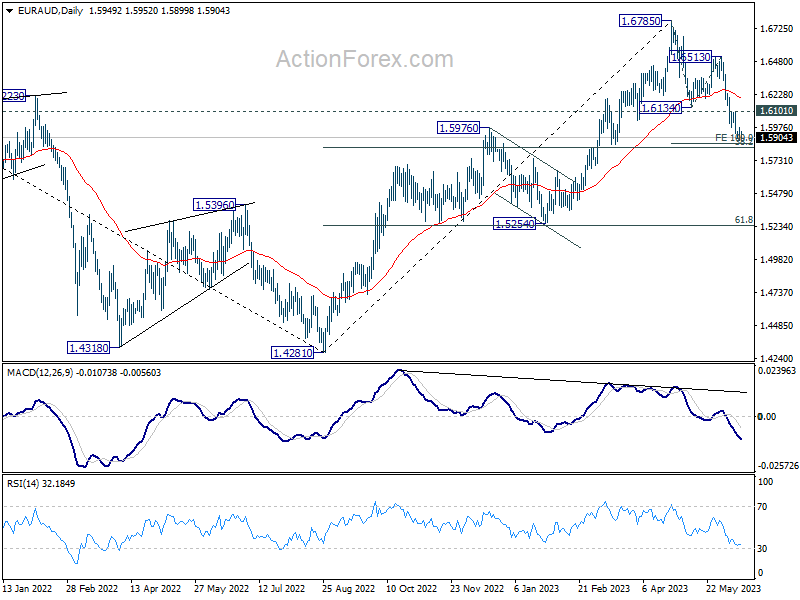
EUR/AUD's fall from 1.6785 might still extend lower. But downside should be contained by 100% projection of 1.6785 to 1.6134 from 1.6513 at 1.5862, on loss of momentum as seen in 4H MACD. Break of 1.6101 support will indicate short term bottoming, and turn bias back to the upside for rebound.
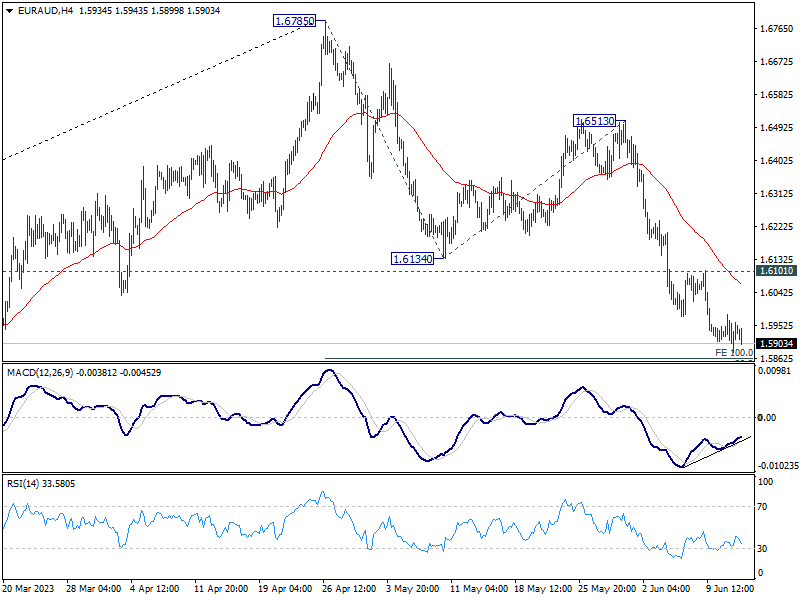
In the bigger picture, a medium term is possibly in place at 1.6785 already, on bearish divergence condition in D MACD. Fall from there is seen as corrective whole up trend from 1.4281 (2022 low). Deeper decline is expected as long as 1.6513 resistance holds, to 38.2% retracement of 1.4281 to 1.6785 at 1.5828. Strong support could be seen there to complete the first leg of the corrective pattern.