Sample Category Title
GBP/USD Outlook: Cable Hits New 2023 High
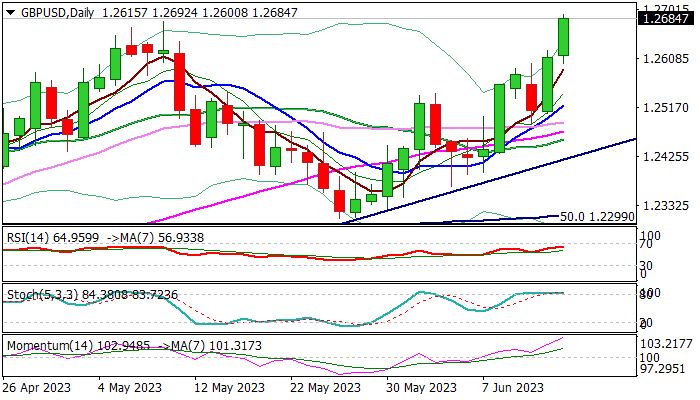
Cable hit new 2023 high on Tuesday on fresh bullish acceleration which extends into the second consecutive day.
Sterling received fresh support from weaker than expected US producer prices in May, which showed the smallest annual increase in 2 ½ years, adding to expectations that the Fed will stay on hold in June meeting which ends today.
Pound was also underpinned by hawkish rate outlook, as the Bank of England remains on track for further rate hikes, in a battle with inflation which is currently more than four times higher than BoE’s target, while economists remain optimistic and say that the economy is unlikely to enter recession.
The central bank is widely expected to raise interest rates by additional 25 basis points to 4.75% in June 22 meeting, with economists being divided about terminal rate, expecting peak at 5.00% and 5.50% range, while markets see rates climbing to 5.75% before start to turn lower.
Strongly hawkish stance of UK policymakers fuels pound’s latest rally, which broke through previous peak and turning focus towards next targets at 1.2759 (Fibo 61.8% of 1.4249/1.0348 downtrend) and 1.2874 (200WMA) which guards psychological 1.30 barrier.
Bulls require daily close above 1.2679 (former annual top of May 10) to be confirmed, with all eyes being on Fed.
The US central bank is likely to pause this time, but markets will be closely watching comments from Fed Chair Powell, for more clues about their next steps.
Initial supports lay at 1.2600/1.2590 zone (session low / rising 5DMA) followed by 1.2534 (daily cloud top) and 1.2521 (10DMA).
Res: 1.2700; 1.2759; 1.2874; 1.3000.
Sup: 1.2600; 1.2534; 1.2487; 1.2457.
Is Inflation About to Fall Off a Cliff?
Inflation may have finally peaked around the world, but central banks remain on alert amid an uptick in some countries and the stickiness of underlying price measures in others. Whilst the view that inflation will continue to decline in the coming months hasn’t changed, policymakers are concerned that it’s not coming down fast enough, and this raises the risk that inflation expectations may start to become unanchored. But what if the risk of that happening isn’t very high at all and the real danger for central banks is inflation falling off a cliff?
Overcompensating for a policy mistake?
It goes without saying that inflation is one of the most important economic indicators that policymakers, analysts and investors, as well as the wider public, watch. But that doesn’t detract from the fact that inflation is a lagging indicator, meaning that it measures the changes in price levels after they have occurred and not before it. This makes the job for central banks quite difficult as they have to base their decisions on interest rates on the predicted path of inflation, often leading to policy mistakes, such as in 2021 when the initial warning signs of simmering prices were deemed to be transitory.
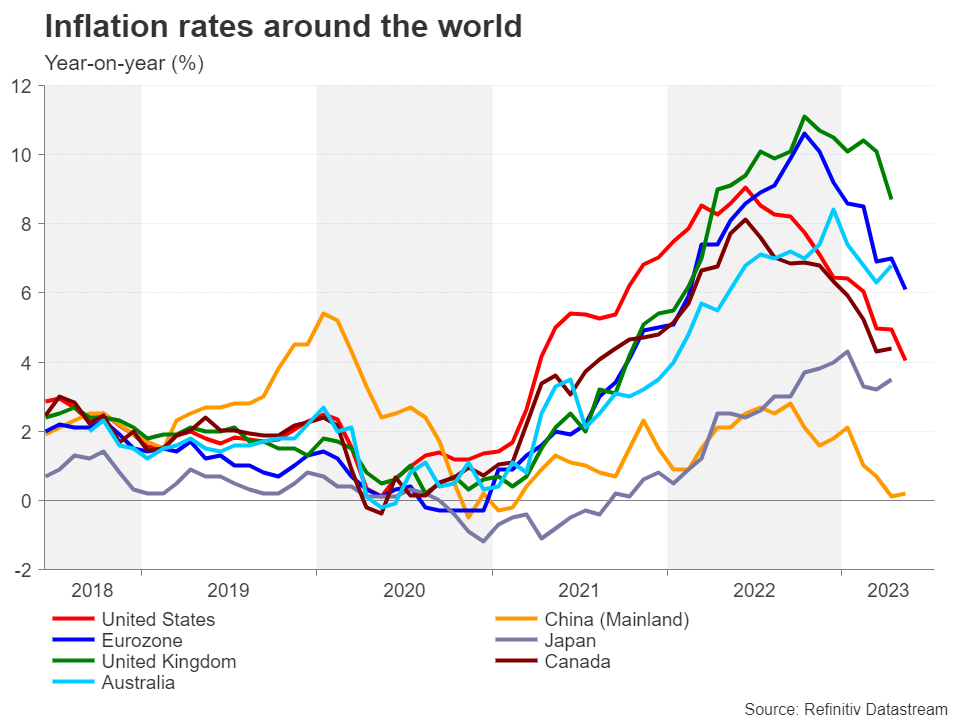
Scarred by that misjudgement, central banks took a very hard line on inflation in 2022 and even now when CPI rates are headed down globally, the likes of the Federal Reserve and European Central Bank are only slowly letting their guards down. This caution seems warranted when considering that consumer demand in just about every region has remained resilient against the rising cost of living and higher borrowing costs, many economies are still experiencing widespread labour shortages and the overall economic pain of the most aggressive tightening cycle in decades has been surprisingly small.
Guided by inflation expectations
However, the fight against high inflation has probably reached its most crucial stage as policymakers have to factor in the substantial policy tightening that’s already in the pipeline against the need for additional rate hikes amid the sticky price pressures. Hence, there is increasing attention on the various leading indicators of inflation for clues on its future trend.
Measures of expected inflation are the foremost leading indicators that central bankers keep an eye on. For the US, there are some very encouraging signals from the two- and five-year breakeven inflation rates as these market-based gauges have settled just above 2%. But this is not a very conclusive sign as they were not particularly great at predicting the extent of the price surges in 2021 and 2022 and they should ideally be hovering slightly below 2% rather than above it, as was the case in the decade before the pandemic.
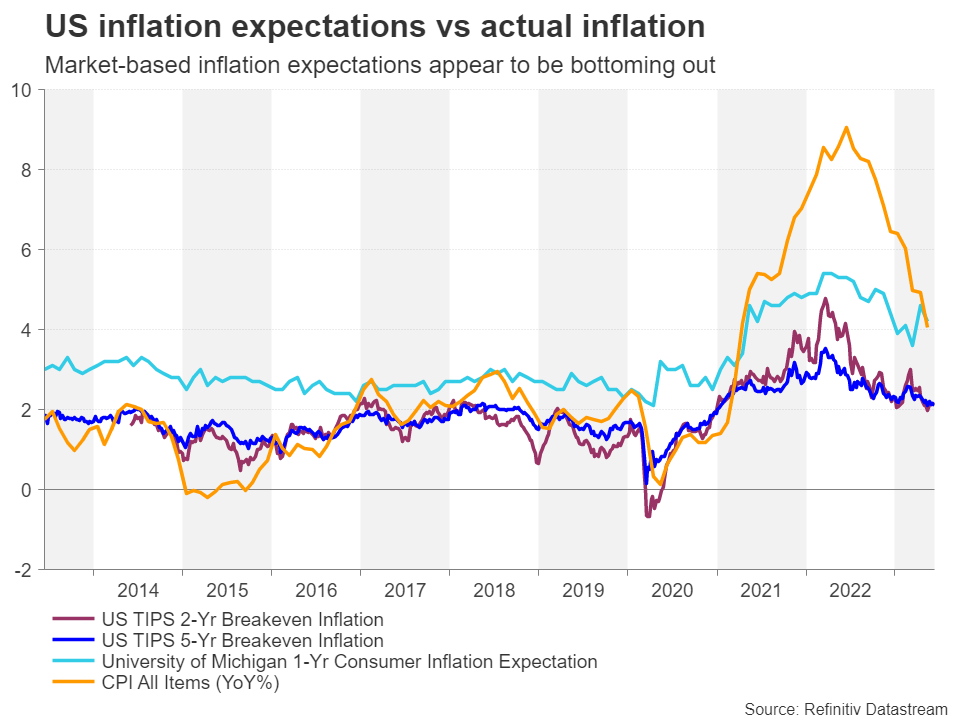
Moreover, a closely watched consumer-based expectation of inflation – the University of Michigan’s one-year inflation expectation – has edged up lately. Taken together, they could be interpreted as suggesting that the decline in inflation has stalled. In the euro area, inflation expectation based on the 5-year/5-year swap rate may not have even peaked yet and remains elevated near the all-time high of 2.58% set in May.
Money supply growth is plunging
But other leading indicators paint a much more promising picture, and in some extreme cases, even a worrying one of disinflation going too far. One major red flag is the sharp drop in money supply growth in both the US and Eurozone. M2 growth in the US turned negative for the first time on record at the end of 2022 and European M2 growth is headed in the same direction. Although the pandemic stimulus is likely distorting these readings, the implied path does nevertheless point to further dramatic falls in inflation over the next 12 months.
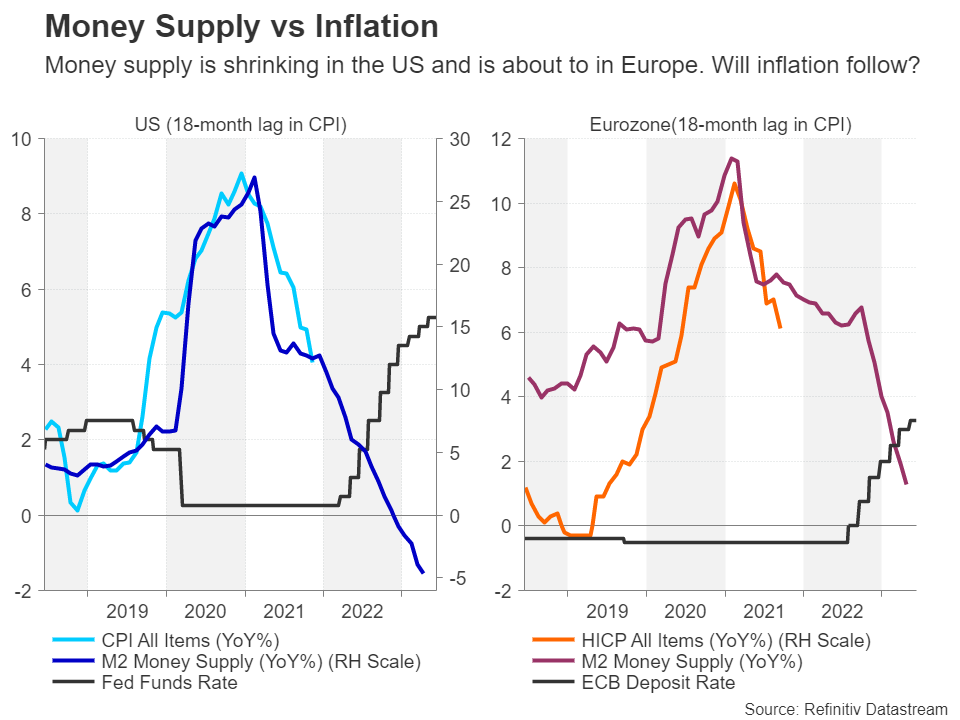
As demonstrated in the charts above, the series of rate hikes on both sides of the Atlantic are having a clear impact in contraining money supply, though this should not be confused with net liquidity changes in the economy.
The only way is down
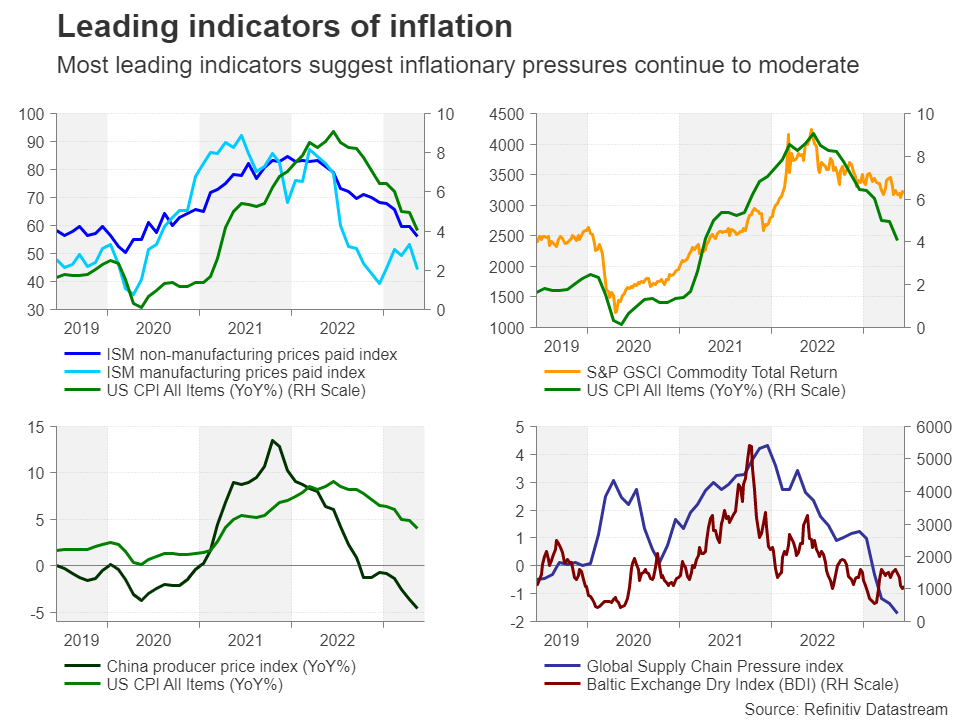
Another key indicator, one that is popular with investors, is the ISM prices paid index. Again, the trend here is downwards, particularly for non-manufacturing prices, and while manufacturing prices may have started to creep slightly higher, the drop in services inflation carries a lot more weight for the Fed as this has been its primary focus this year.
In addition, manufacturing prices in the US and globally have a close correlation with the price of goods coming out of China’s factories, which have been declining year-on-year since late 2022, signalling more disinflation is on the way. Reinforcing this view are the decreases in other industry indicators such as freight costs and supply pressures. One area of disappointment is commodity prices, which have yet to fully reverse their gains from the Ukraine war and crude oil is one of the few exceptions.
Overtightening fears
But on the whole, everything is pointing to inflation decelerating further this year and this raises the question, have central banks overtightened? Well, the jury is out on that and it will probably be a while before the outcome of the past year’s policy actions emerges.
However, with the rate-hike cycle now nearing the end in most Western economies, the angst about overtightening won’t simply vanish for investors when central banks go on a permanent pause and will linger on for the duration that they decide to hold rates at peak levels. The longer that rates are kept high, the greater the risk of recession fears eventually materializing.
FOMC: What Next For The US Dollar?
Get ready for the latest on the Federal Reserve's upcoming decision. In a surprising move, the Fed is expected to keep interest rates unchanged for the first time since embarking on an aggressive tightening cycle. But hold your horses. It's not a pivot or a pause!
The Fed may use this opportunity to signal that more rate hikes are on the horizon, depending on how the economy evolves, financial stability, and inflation trajectory. With a mixed bag of economic data and lingering uncertainties, caution is the name of the game. While the Fed will likely skip a rate increase this time, they may hint at the need for one or two more hikes by the end of 2023. It's a delicate policy compromise amid strong employment and inflation concerns. Stay tuned for the Fed's policy statement and projections, and listen out for Chairman Powell's press conference. Remember, no extended pause or rate cuts are expected for now. So buckle up and keep an eye on the ever-changing forex landscape!
US DOLLAR - Daily Timeframe
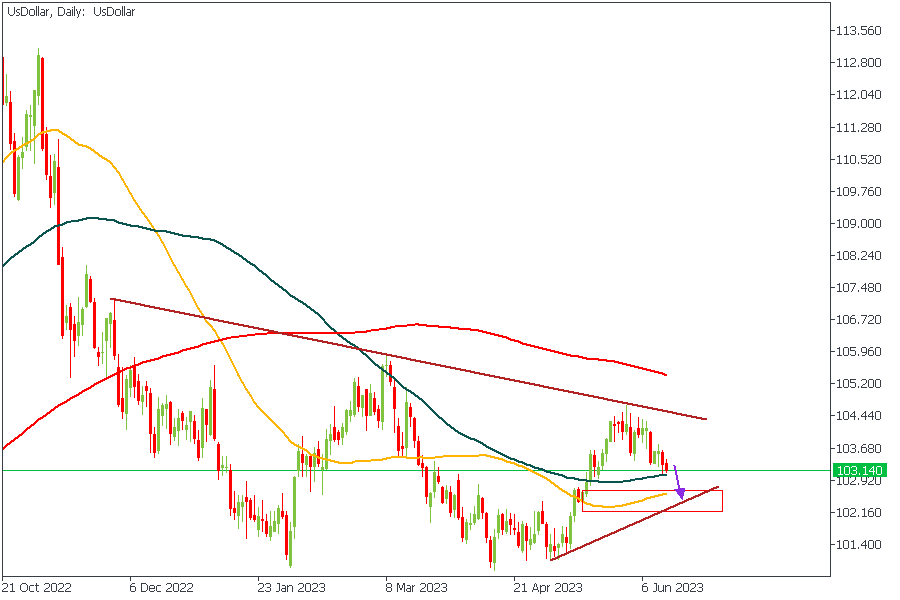
In line with my analysis last week, the US Dollar declined heavily from the pivot zone and resistance trendline. From all indications, the price is expected to continue on that downward path until it reaches the demand zone I’ve marked out - which would be the case if the Fed keeps the interest rate steady at the end of the day. I will watch for a sharp reaction from the marked demand zone before halting my hopes of a bearish continuation.
Analyst’s Expectations:
- Direction: Bearish
- Target: 102.660
- Invalidation: 103.646
EURUSD - Daily Timeframe
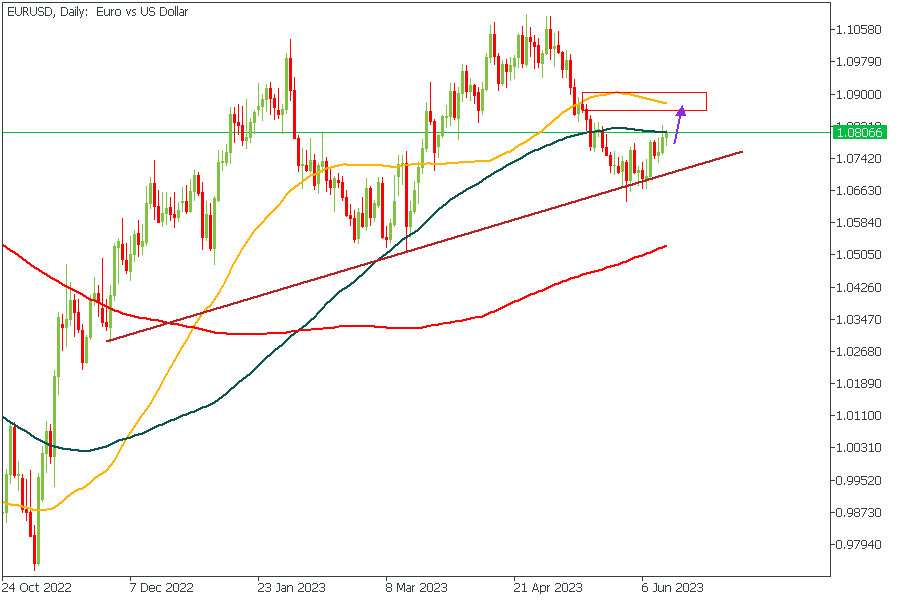
The bullish movement on EURUSD is yet to reach an efficient resistance level. Therefore, as highlighted in the chart above, the only logical poise is to expect a continuation of the bullish movement until the supply zone is reached. If the FOMC rates decision turns out to be dovish, the outlined direction would be the most likely outcome.
Analyst’s Expectations:
- Direction: Bullish
- Target: 1.08595
- Invalidation: 1.07501
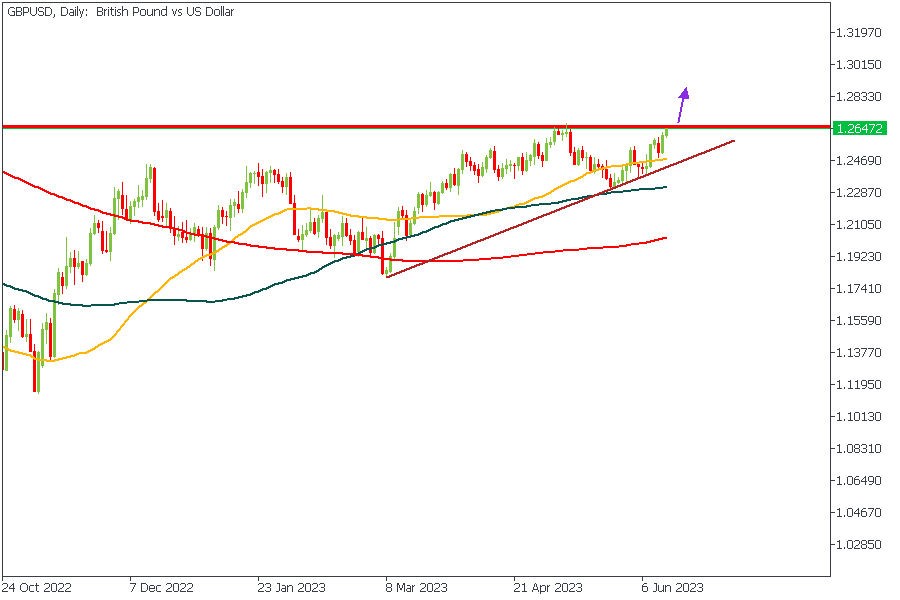
GBPUSD - Daily Timeframe
GBPUSD has reached a crucial resistance level after commencing a solid rally from the 100-Day moving average, which on a regular day would imply a possibility of a bearish movement. However, in this case, we may see the price break clearly above that resistance level owing to the press release from the FOMC meeting later today. The interest rate is expected to play a vital role in the eventual outcome of the GBPUSD forecast.
Analyst’s Expectations:
- Direction: Bullish
- Target: 1.27401
- Invalidation: 1.25084
USDJPY - Daily Timeframe
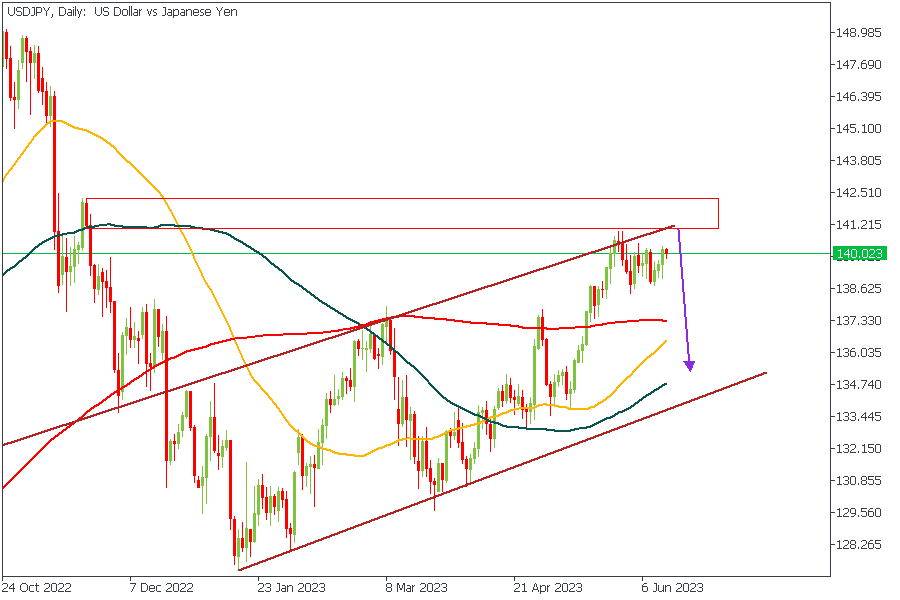
USDJPY is inching closer to a major rally-base-drop supply zone and has been rejected from that area recently. Pending the release of the Fed interest rates figures, I believe we will see a decline of buying pressure from the USD, leading to a bearish momentum overall.
The confluences for this position include;
The resistance trendline
The rally-base-drop supply zone, and
The previous rejection from the supply zone
Analyst’s Expectations:
- Direction: Bearish
- Target: 136.494
- Invalidation: 141.014
CONCLUSION
The trading of CFDs comes at a risk. Thus, to succeed, you have to manage risks properly. To avoid costly mistakes while you look to trade these opportunities, be sure to do your due diligence and manage your risk appropriately.
Fed Could Signal the End of the Hike Cycle
The Fed’s rate decision is the most anticipated event of the day and possibly the coming weeks. As usual, the markets have a strong consensus on what the central bank will do in the short term, but they are more uncertain about its future moves. The tone of the statement and the assessment of the latest economic data are the primary sources of potential market volatility.
Rate futures indicate a 95% probability of keeping the key rate unchanged in the current 5.00-5.25% range, leaving only 5% for a chance of a policy tightening. However, the same FedWatch tool shows a 63% likelihood of a new 25-point rate hike at the end of July. Interestingly, the expected rates shift downward significantly further ahead, with only 35% betting that there will be no rate cut before the end of the year.

Since the beginning of the year, the markets have been consistently expecting a policy reversal – a sentiment that the Fed has been trying to counter by reassuring that it will not cut rates anytime soon. This divergence of view promises to be the most heated topic at Powell’s press conference later today and in his subsequent speeches.
The annual rate of overall inflation has declined for 11 consecutive months and is already below the key rate in May and June. The base effect (a 1.2% price increase for June 2022) suggests an even bigger drop in inflation, which would favour the Fed’s stance. A further rate hike seems unnecessary and risky for the banking system, which faced severe stress in March. It could also trigger a sharp policy reversal, worsening the financial sector’s problems and causing a steep economic slowdown.
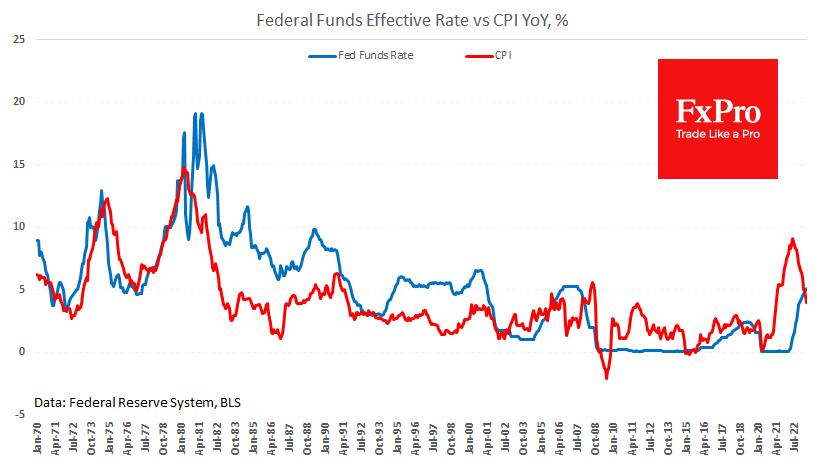
On the other hand, a rate cut is not likely either. Higher monthly core CPI growth, on top of a tight labour market and relatively solid business reports, are reasons to maintain restrictive monetary conditions but not enough to tighten them.
If the Fed shares this view, it will signal a readiness to pause rate hikes while trying to change market expectations in favour of keeping current rates for the following quarters.
BTCUSD Trades Sideways, Bearish Pattern Remains Intact
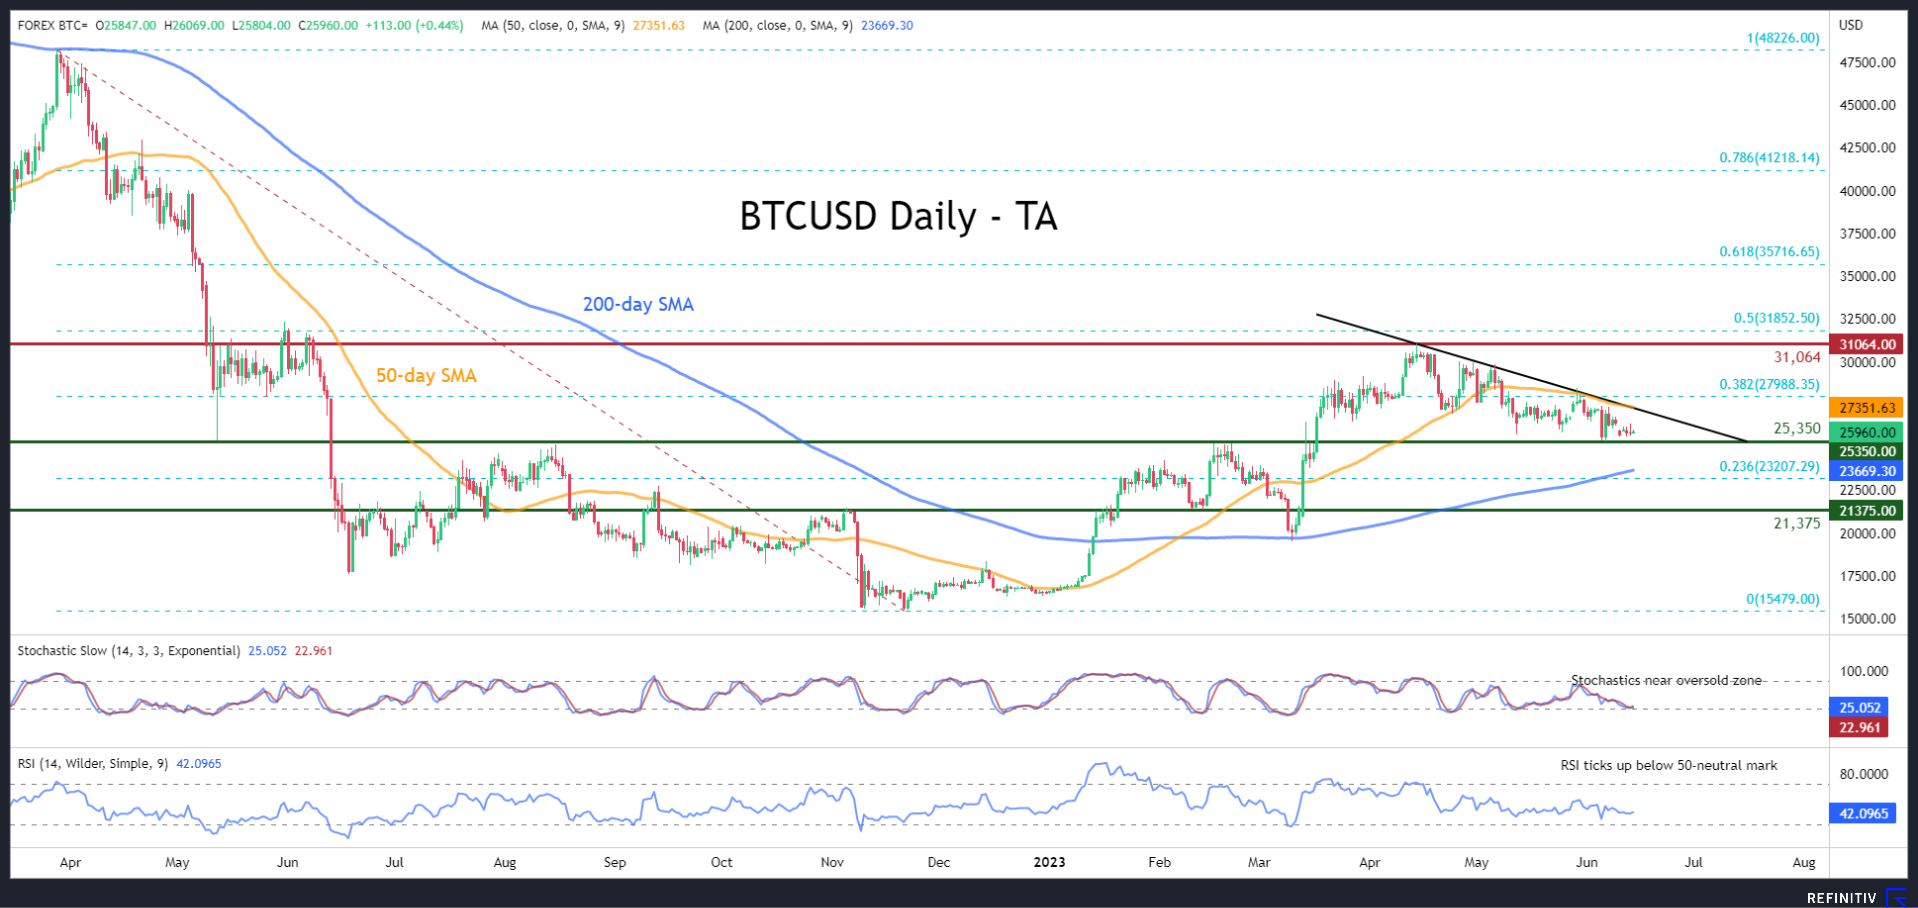
BTCUSD (Bitcoin) has been generating a structure of lower highs and lower lows after peaking at the 11-month high of 31,064 in mid-April. However, the price has been rangebound in the past week, waiting for developments that could provide fresh directional impetus.
The momentum indicators are currently well within their negative territories, but they are also suggesting that positive momentum is picking up. Specifically, the stochastic oscillator posted a bullish cross just shy of the 20-oversold mark, while the RSI ticked up beneath its 50-neutral mark.
If the bulls manage to push the price above the restrictive trendline that connects the recent peaks, immediate resistance could be met at 27,988, which is the 38.2% Fibonacci retracement of the 48,226-15,479 downtrend. Surpassing that zone, Bitcoin could ascend to challenge the 11-month high of 31,064. Further advances could then cease at the 50.0% Fibo of 31,852.
Alternatively, bearish actions could trigger a price retreat towards the recent 2½-month low of 25,350. Should that floor collapse, the spotlight could turn to the 23.6% Fibo of 23,207. Even lower, the 21,375 hurdle could provide downside protection.
Overall, BTCUSD has been trading sideways during the past week, but short-term oscillators are indicating that the bullish momentum is slowly intensifying. Thus, a clear break above the descending trendline is needed to revive bulls’ hopes for a trend reversal.
Gold Retains Sideways Move
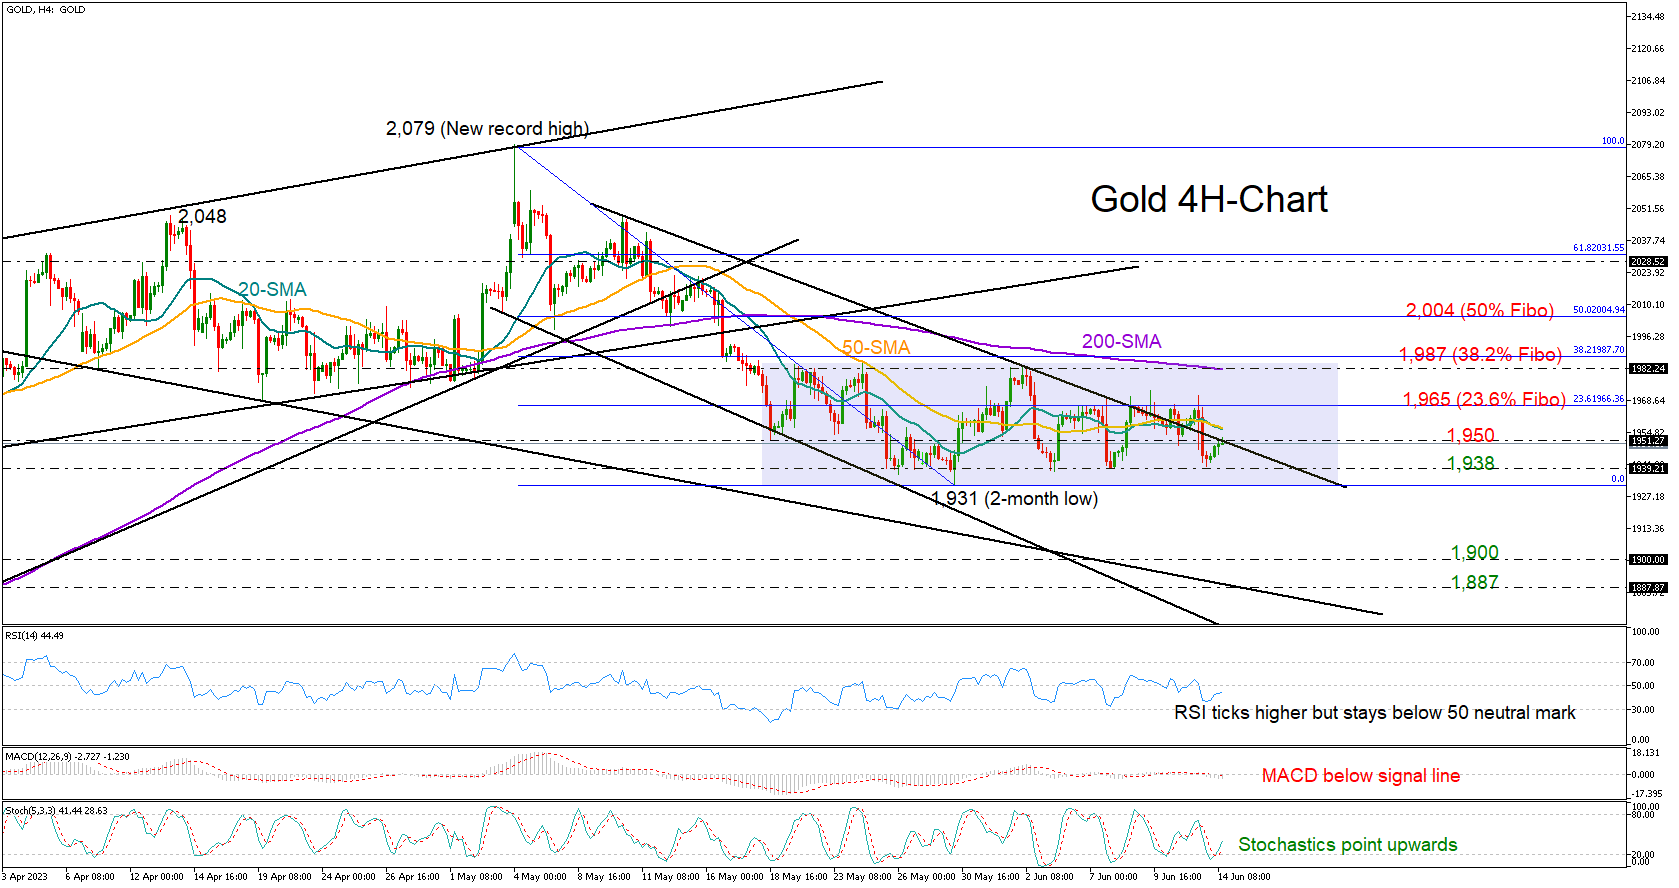
Gold could not sustain its strength above the 1,965 bar on Tuesday, falling aggressively towards the 1,938 floor in the aftermath.
The previous metal switched to recovery mode on Wednesday, though the mixed technical signals in the four-hour chart provide no clear direction. Traders would like to see a close above the constraining falling line at 1,950 before they again turn their attention to the 1,965 barricade. Notably, the 23.6% Fibonacci retracement of the 2,079-1,932 downtrend is placed here too. If that wall collapses, the price may accelerate towards the 200-period simple moving average (SMA) and the 38.2% Fibonacci level of 1,987. Another bullish breakout there could clear the way towards the 2,000 psychological mark.
Failure to jump successfully above 1,950 may bring the 1,938 base back under the spotlight. If the bears exit the range below 1,930, the price may initially pause around the 1,900 number and then head towards the 1,887 region in order to meet the descending line from March 20.
In a nutshell, gold traders are in a wait-and-see mode. A significant move above 1,985 could brighten the short-term outlook, whilst a drop below 1,931 would re-activate May’s downfall.
Sunset Market Commentary
Markets
It’s Fed-day. And with the ECB following on Thursday and the Bank of Japan on Friday it might sound strange, but we’ve probably already faced the two key events for this week. First and foremost, the hot UK payrolls and wage inflation. They are a huge wake-up call for the hesitant Bank of England (BEHIND THE CURVE) and together with last week’s RBA and BoC hawkish rate hikes an omen on how the Indian summer in the US and Europe might look like. And trust us, El Nino won’t be the only one to blame. The second important event was the Chinese 7d reverse repo rate cut which probably heralds a cut in the key 1y MT lending facility rate tomorrow. Chinese monetary policy to save the local and help the global economy might eventually work… you guessed it… inflationary! We can be brief on today’s market moves. Core bonds and stocks gains some ground with the dollar suffering. Moves occur orderly. EUR/USD rises north of 1.0840. It’s probably a preview of what to expect after the Fed skips a meeting in its normalization cycle for the first time in 15 months tonight. After all, given the central bank data dependency it’s back to square one when it comes to the July meeting whatever current thinking/market pricing.
Fed preview: Yesterday’s more or less in-line CPI figures basically cemented the case for a skip in the tightening cycle. That said, we do expect the Fed to add a hawkish flavour because of - amongst others - ongoing economic resilience, especially in the labour market and stalling/insufficient progress in the core disinflationary process. The dot plot serves as the perfect tool for this. The updated version will include a higher terminal rate than the one in March (set back then at the current 5-5.25%). 2024 may also see a higher rate level than expected previously. We don’t expect chair Powell to sound outright hawkish in the press conference afterwards though. He’ll stick to a data-dependent approach instead. With another rate hike almost fully priced in for either July or September, we think the dollar’s room for appreciation against the euro is limited. We might even be getting some buy-the-rumour, sell-the-fact. The US yield rally lost some steam at key technical references, likely triggering rebound action lower. The downside should be protected by the higher-for-longer strategy though. Unless markets take a skip for a pause and the pause eventually for a pivot…
News & Views
Swedish inflation followed the Norwegian example of last week by beating most estimates. Headline inflation using a fixed interest rate (CPIF) rose 0.1% m/m vs. expectations for flatlining. The yearly figure fell sharply from 7.6% to 6.7%. That was bang in line with consensus and even lower than the 7.1% the Riksbank had projected in April. It is by no means a relief though, as core CPIF only eased from 8.4% to 8.2%. That topped both analyst (7.8%) and Riksbank (8.1%) forecasts. Sticky prices make the disinflationary process a painstakingly slow one. In addition, the Swedish krone since the April policy meeting weakened another 2%+, posing upside inflation risks. The central bank last time around hinted at one more 25 bps rate hike either on June 29 or September 21 with odds clearly in favour of the former. But today’s data and the weak SEK suggest that even the level reached then (3.75%) may not suffice. The Swedish krone quickly erased a kneejerk leg higher after the data. EUR/SEK is trading higher for the day around 11.56 even as swap yields in the country rise up to 5.4 bps at the front.
Slovakia’s prime minister Odor in an interview with Bloomberg said his country risks being punished by financial markets if it doesn’t take steps to cut spending. Slovakia is running a projected 6%+ deficit this year, the biggest in over a decade as well as the eurozone’s widest gap. Public debt is expected to hit 58.5% of GDP in 2023. This compares to the 48% in 2019, prior to the spending done to cushion the impact from the pandemic and the Russian war in Ukraine. The government also introduced measures to soften the cost-of-living crisis. Inflation peaked at a 23-year high of 15.4% in February before easing to a still lofty 11.9% in May, according to data published this morning. Odor and his caretaker administration in the runup to the September 30 elections will prepare a set of measures to address the matter. These include a shift to targeted state aid and social payments, higher taxes on consumption and abandoning various tax exceptions.
AUD/USD: Bulls Crack Pivotal Resistance Zone as Fed Expected to Stay on Hold
Australian dollar remains bid in Asia / early Europe on Wednesday, underpinned by weaker dollar and rise in Dalian iron ore.
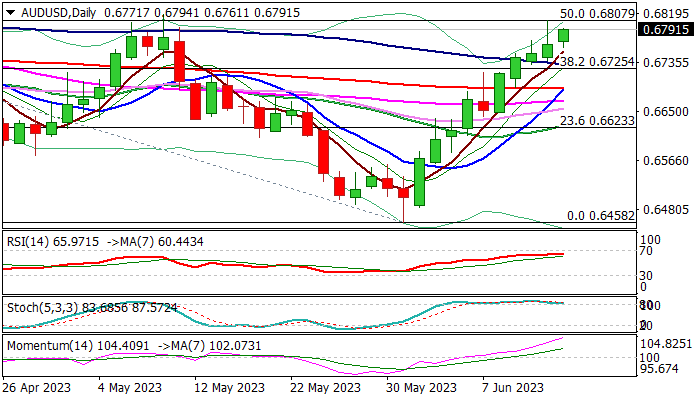
Bulls cracked the lower boundary of strong resistance zone at 0.6807/18 (50% retracement of 0.7157/0.6458 / May 10 high) on Tuesday but was unable to break on the first attempt.
Daily studies are firmly bullish but overbought which may produce additional headwinds and make attempts through pivotal barriers more difficult, however, FOMC decision is likely to be key driver today.
The Fed is widely expected to pull the brake and keep interest rates unchanged for the first time in more than one year of aggressive policy tightening.
Market observers expect a pause in rate raising cycle but with hawkish rhetoric, while focus will be on central bank’s forward guidance, which is likely to determine greenback’s short-term fate.
Sustained break of 0.6807/18 pivots would open way for fresh extension towards 0.6890/0.6915 Fibo 61.8% / weekly cloud top).
Broken 100DMA and Fibo 38.2% offer initial supports at 0.6731/25, followed by converged 10/200DMA’s (0.6689) which are about to form a golden-cross.
Res: 0.6818; 0.6864; 0.6890; 0.6915.
Sup: 0.6761; 0.6725; 0.6689; 0.6668.
USD/JPY Mid-Day Outlook
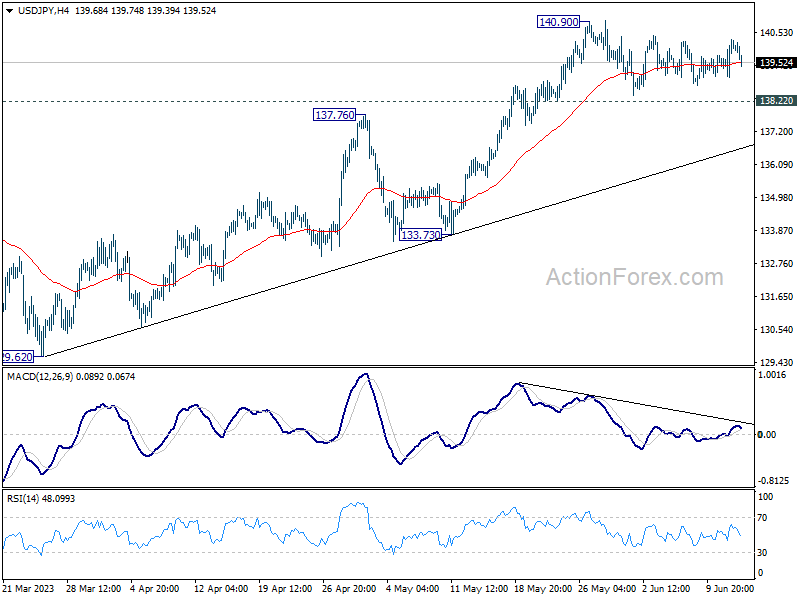
Daily Pivots: (S1) 139.39; (P) 139.85; (R1) 140.69; More...
Range trading continues in USD/JPY and intraday bias stays neutral at this point. Further rally is expected as long as 138.22 minor support holds. On the upside, break of 140.90 will resume larger rise from 127.20 to 142.48 fibonacci level. However, considering bearish divergence condition in 4 hour MACD, break of 138.22 will confirm short term topping, and turn bias back to the downside for 55 D EMA (now at 137.02).
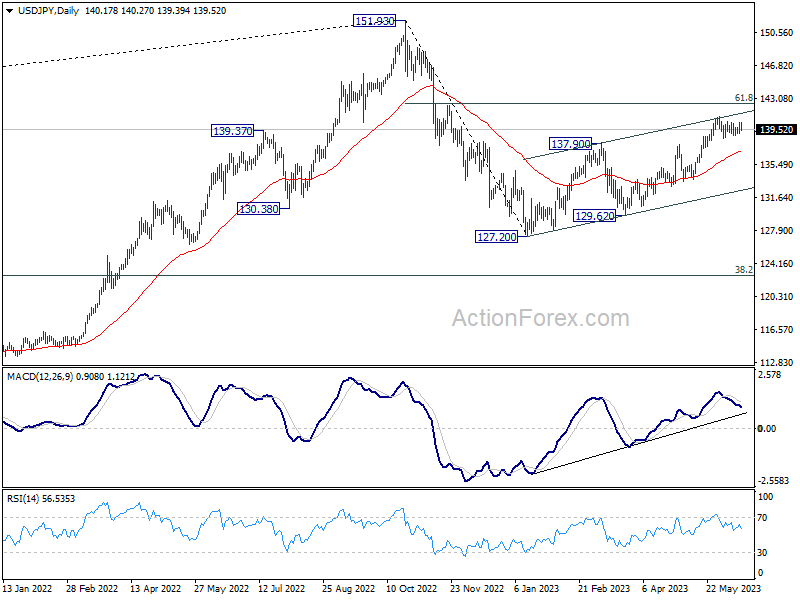
In the bigger picture, rise from 127.20 is seen as the second leg of the corrective pattern from 151.93 high. Stronger rally would be seen to 61.8% retracement of 151.93 to 127.20 at 142.48. Sustained break there will pave the way back to retest 151.93. On the downside, however, break of 133.73 support will argue that the pattern could have started the third leg through 127.20 low.
USD/CHF Mid-Day Outlook
Daily Pivots: (S1) 0.9024; (P) 0.9059; (R1) 0.9087; More...
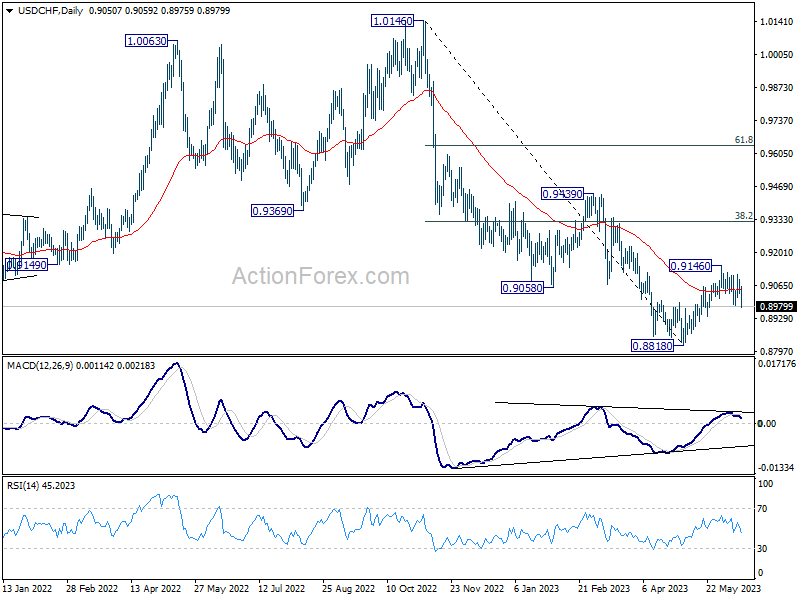
USD/CHF's break of 0.8983 support indicate resumes of fall from 0.9146. The development also revives that case that corrective rebound from 0.8818 has completed at 0.9146. Intraday bias is back on the downside for retesting 0.8818 low. For now, risk will stay on the downside as long as 0.9146 resistance holds.
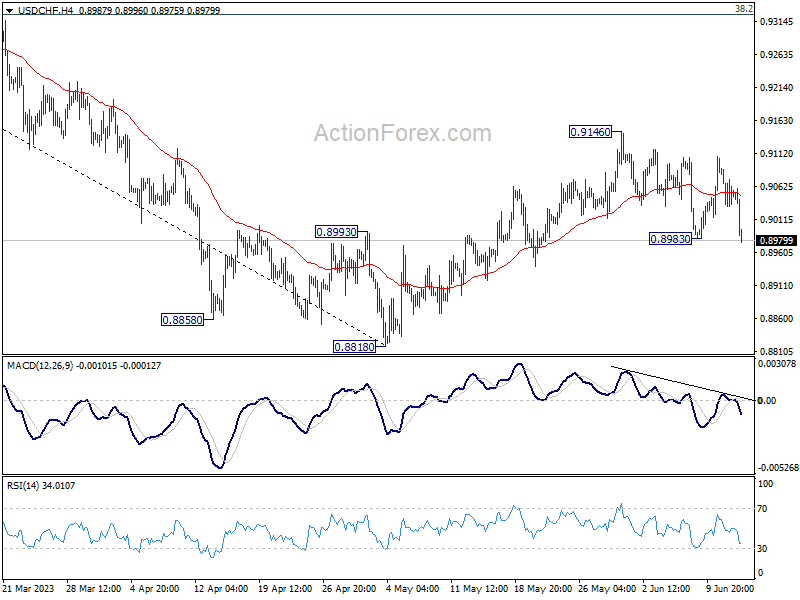
In the bigger picture, fall from 1.1046 (2022 high) is seen as a leg in the long term range pattern from 1.0342 (2016 high), which might have completed at 0.8818 already, just ahead of 0.8756 long term support. Sustained trading above 0.9058 support turned resistance should confirm medium term bottoming. Further break of 0.9439 resistance will confirm bullish trend reversal.