Sample Category Title
EUR/CHF Daily Outlook
Daily Pivots: (S1) 0.9750; (P) 0.9773; (R1) 0.9791; More...
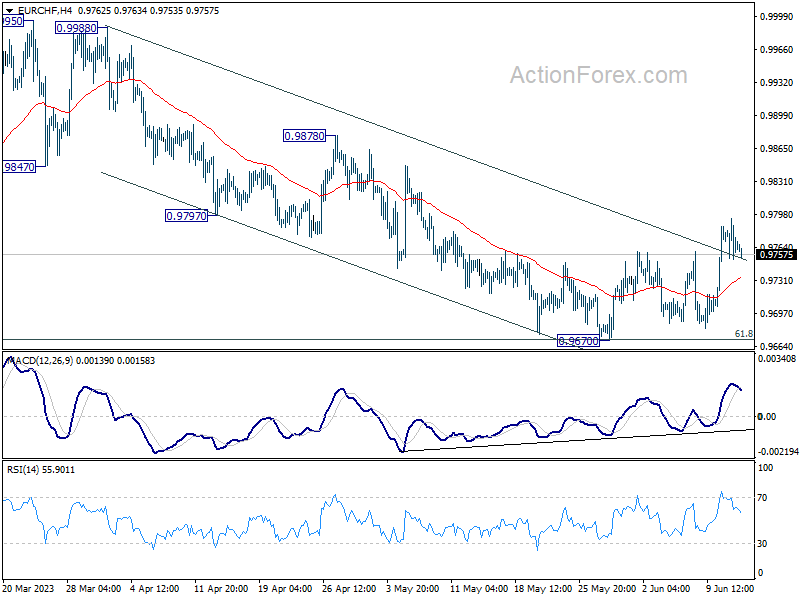
Intraday bias in EUR/CHF remains on the upside at this point. Rebound from 0.9670 is in progress. Sustained trading above 55 D EMA (now at 0.9779) will add to case that whole correction from 1.0095 has completed, after hitting 61.8% retracement of 0.9407 to 1.0095 at 0.9670. Further rally should then be seen to 0.9878 resistance next. For now, risk will stay on the upside as long as 0.9670 support holds.
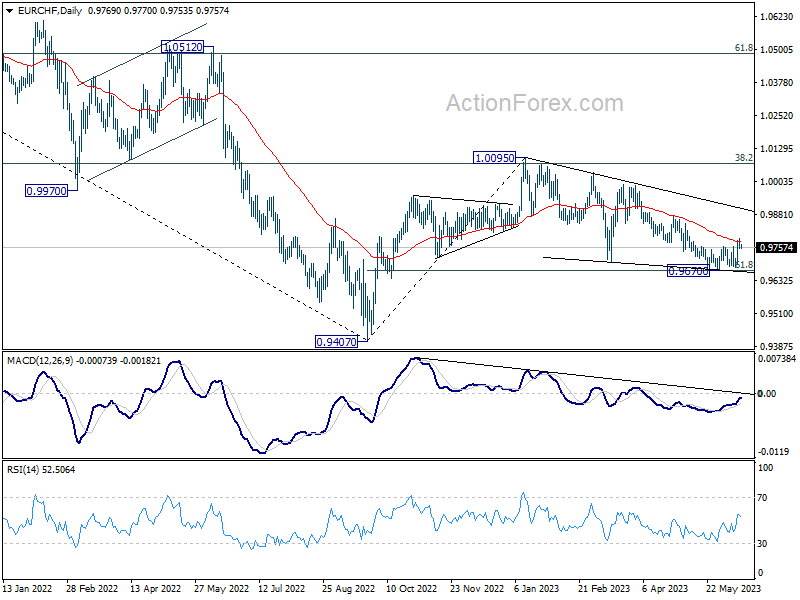
In the bigger picture, prior rejection by 38.2% retracement of 1.1149 to 0.9407 at 1.0072 suggests that medium term outlook is staying bearish. The pair is also capped below 55 W EMA (now at 0.9929). Down trend from 1.2004 (2018 high) is not complete yet and is in favor to resume through 0.9407 at a later stage. However, decisive break of 1.0095 resistance will raise the chance of bullish trend reversal. Rise from 0.9407 should then target 1.0505 cluster resistance (2020 low at 1.0505, 61.8% retracement of 1.1149 to 0.9407 at 1.1484).
EUR/USD Daily Outlook
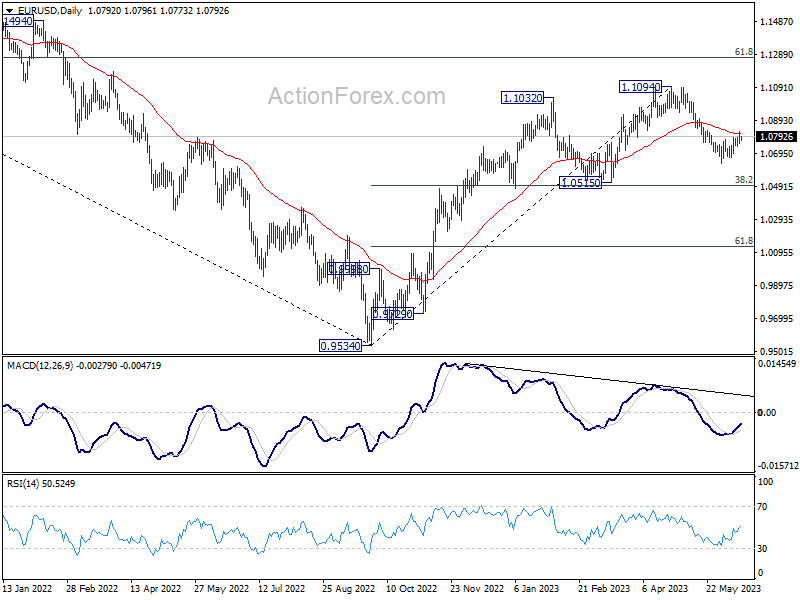
Daily Pivots: (S1) 1.0757; (P) 1.0790; (R1) 1.0827; More...
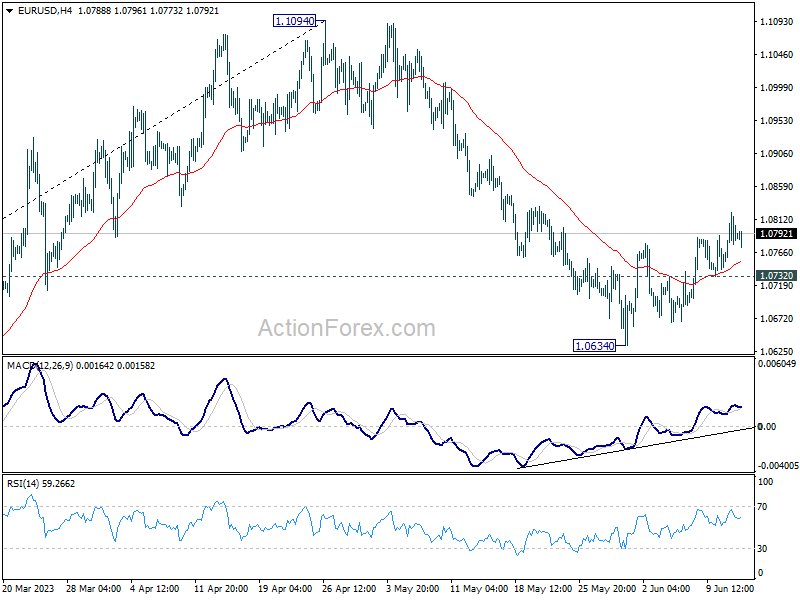
EUR/USD's rebound from 1.0634 short term bottom is in progress and intraday bias stays on the upside. Sustained trading above 55 EMA (now at 1.0810) will pave the way back to retest 1.1094 high. Nevertheless, break of 1.0732 minor support should resume the fall from 1.1094 through 1.0634 support.
In the bigger picture, as long as 1.0515 support holds, rise from 0.9534 (2022 low) would still extend higher. Sustained break of 61.8% retracement of 1.2348 (2021 high) to 0.9534 at 1.1273 will solidify the case of bullish trend reversal and target 1.2348 resistance next (2021 high).
GBP/USD Daily Outlook
Daily Pivots: (S1) 1.2532; (P) 1.2579; (R1) 1.2657; More...
Intraday bias in GBP/USD stays on the upside as rebound from 1.2306 is in progress to retest 1.2678 high. Based on current momentum, upside could be limited there, to bring another fall to extend the corrective pattern from 1.2678. On the downside, break of 1.2485 support will turn bias back to the downside for 1.2306 support instead.
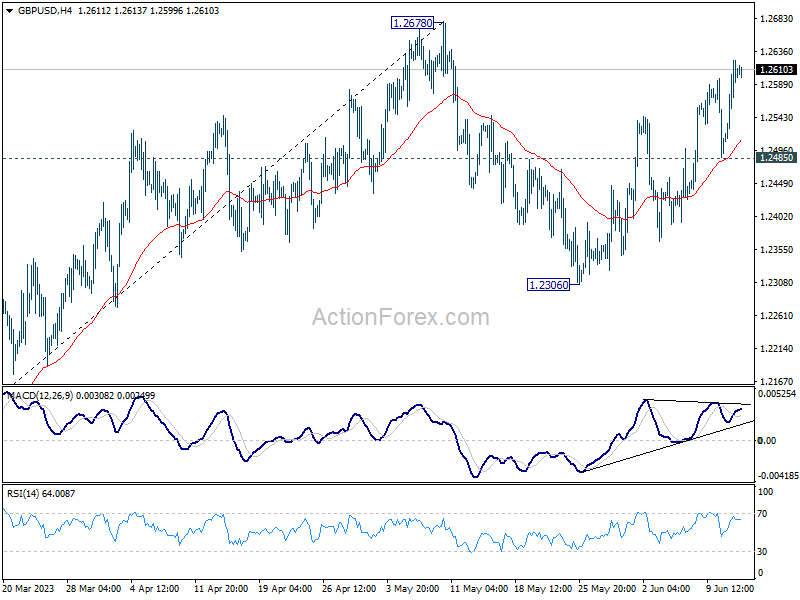
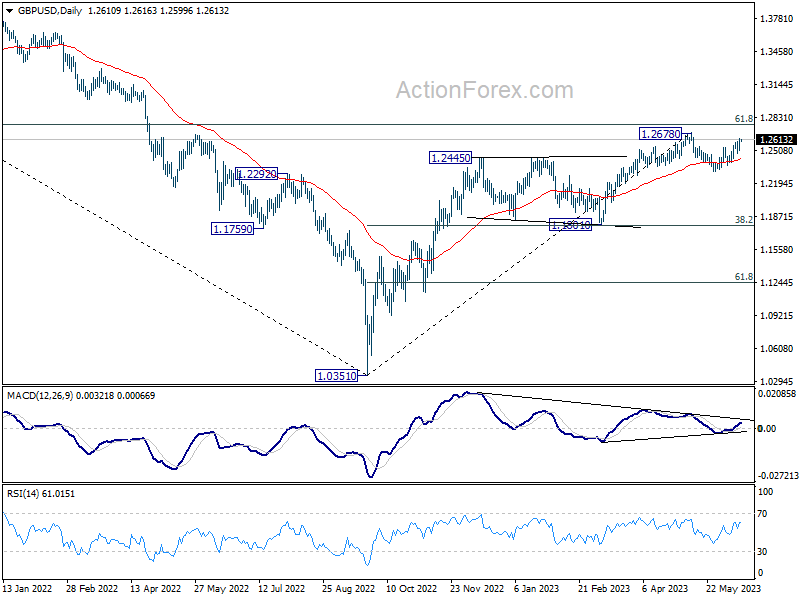
In the bigger picture, as long as 1.1801 support holds, rise from 1.0351 medium term bottom (2022 low) is expected to extend further. Sustained break of 61.8% retracement of 1.4248 (2021 high) to 1.0351 at 1.2759 will add to the case of long term bullish trend reversal. However, firm break of 1.1801 will indicate rejection by 1.2759, and bring deeper decline, even as a correction.
USD/CHF Daily Outlook
Daily Pivots: (S1) 0.9024; (P) 0.9059; (R1) 0.9087; More...
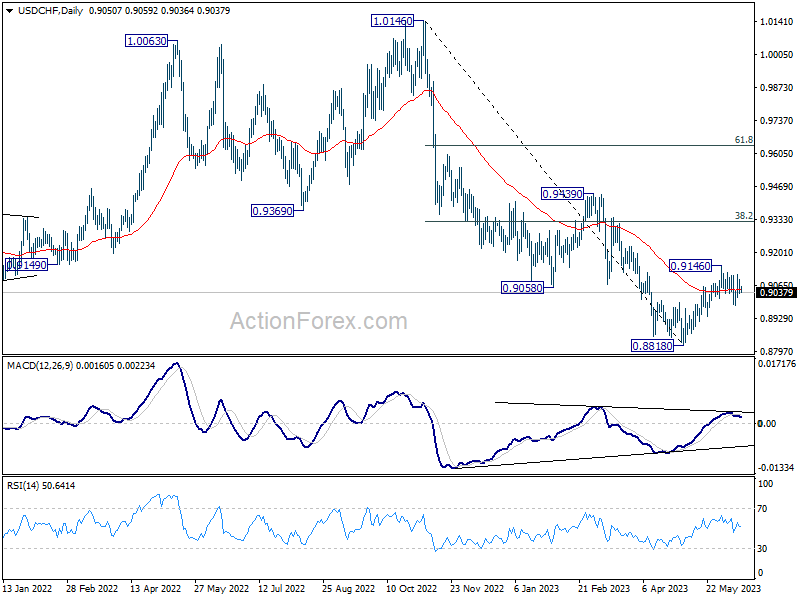
Intraday bias in USD/CHF remains neutral for the moment. On the downside, break of 0.8983 will revive the case that corrective rebound from 0.8818 has completed at 0.9146. Intraday bias will be back to the downside for deeper fall back to retest 0.8818 low. On the upside, however, break of 0.9146 will resume the rebound from 0.8818 instead.
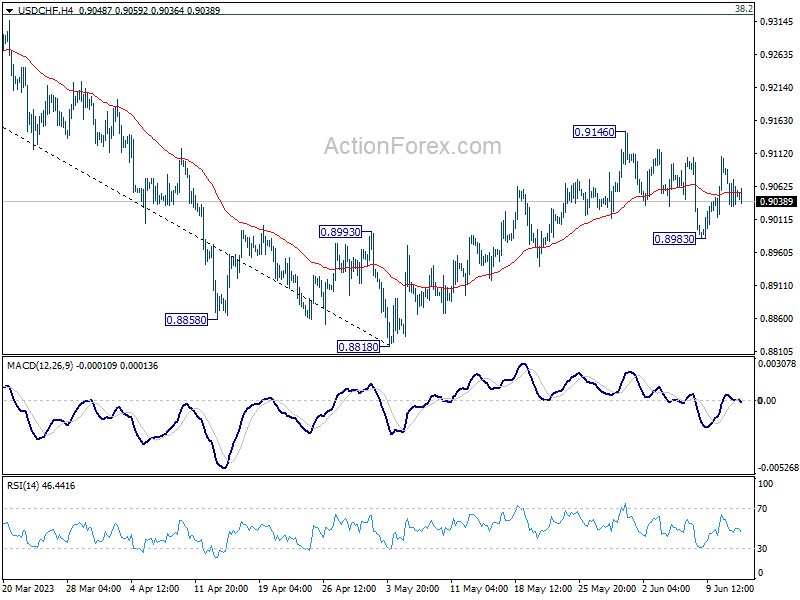
In the bigger picture, fall from 1.1046 (2022 high) is seen as a leg in the long term range pattern from 1.0342 (2016 high), which might have completed at 0.8818 already, just ahead of 0.8756 long term support. Sustained trading above 0.9058 support turned resistance should confirm medium term bottoming. Further break of 0.9439 resistance will confirm bullish trend reversal.
USD/JPY Daily Outlook
Daily Pivots: (S1) 139.39; (P) 139.85; (R1) 140.69; More...
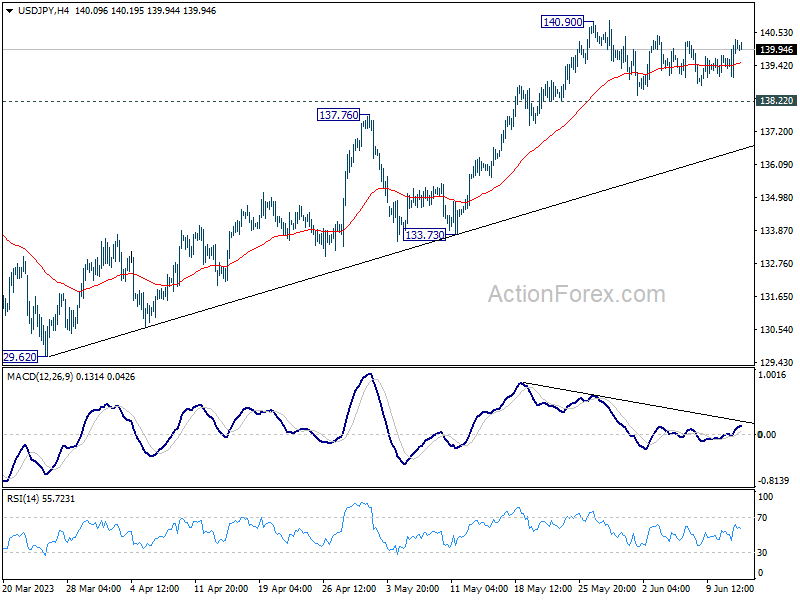
USD/JPY is still bounded in sideway trading and intraday bias stays neutral. Further rally is expected as long as 138.22 minor support holds. On the upside, break of 140.90 will resume larger rise from 127.20 to 142.48 fibonacci level. However, considering bearish divergence condition in 4 hour MACD, break of 138.22 will confirm short term topping, and turn bias back to the downside for 55 D EMA (now at 137.02).
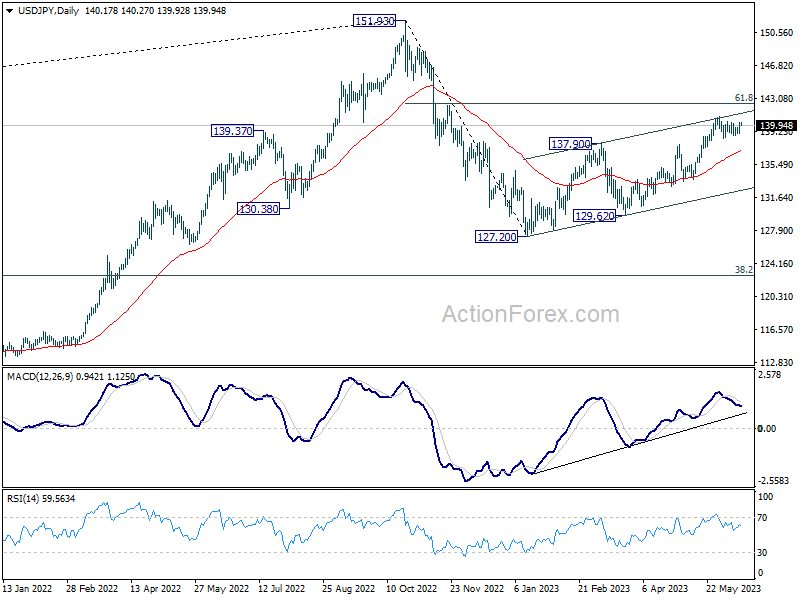
In the bigger picture, rise from 127.20 is seen as the second leg of the corrective pattern from 151.93 high. Stronger rally would be seen to 61.8% retracement of 151.93 to 127.20 at 142.48. Sustained break there will pave the way back to retest 151.93. On the downside, however, break of 133.73 support will argue that the pattern could have started the third leg through 127.20 low.
USD/CAD Daily Outlook
Daily Pivots: (S1) 1.3274; (P) 1.3326; (R1) 1.3366; More....
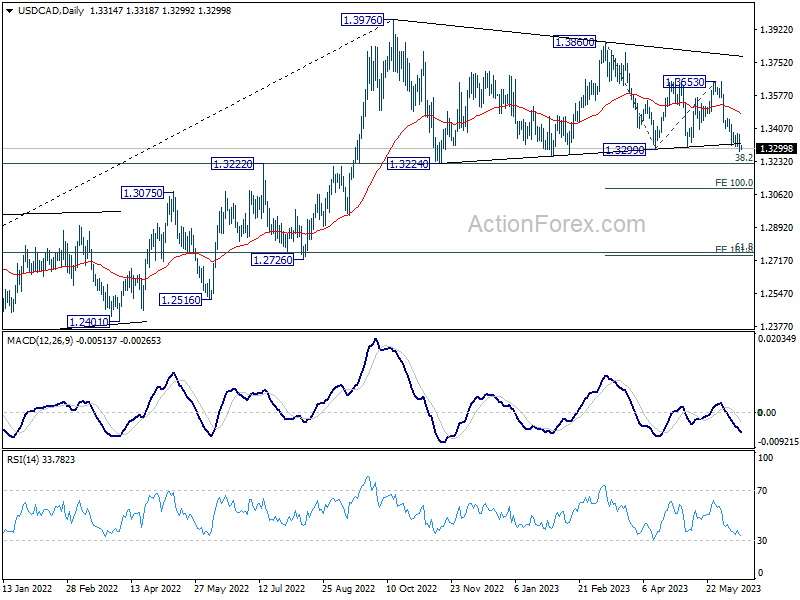
Focus stays on 1.3299 support in USD/CAD. Strong rebound from there, followed by break of 1.3460 resistance will turn bias back to the upside for 1.3653 resistance, to extend the triangle consolidation pattern from 1.3976. However, sustained break of 1.3299 will indicate that larger corrective fall is underway, and target 100% projection of 1.3860 to 1.3299 from 1.3653 at 1.3092.
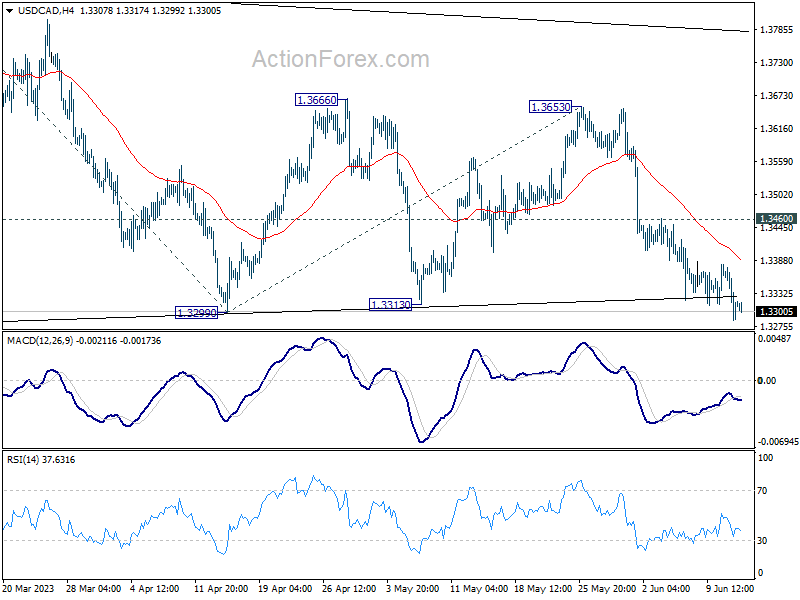
In the bigger picture, rise from 1.2005 (2021 low) is expected to resume through 1.3976 after consolidation from there completes. On decisive break of 1.3976, next target will be 1.4667/89 long term resistance zone. This will remain the favored case as long as 38.2% retracement of 1.2005 to 1.3976 at 1.3233 holds. However, sustained break of 1.3233 will pave the way to 61.8% retracement at 1.2758, and raise the chance of bearish reversal.
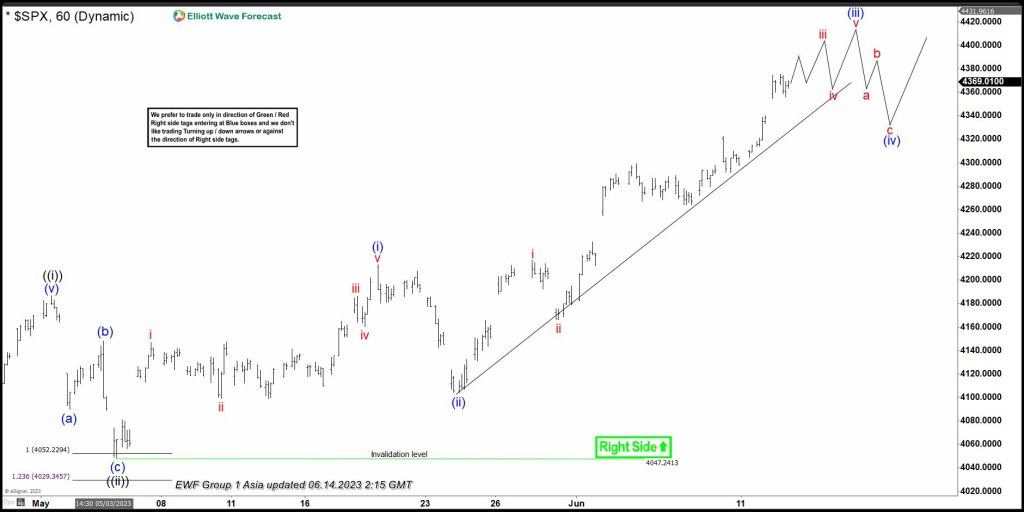
SPX Favors Rally With Bullish Momentum & Remain Supported
Short term, SPX favors upside in wave ((iii)) of 3 started from 4048.28 low of 5.04.2023 and expect to remain supported in pullback. It is nesting as the part of impulse Elliott wave structure and favors further upside. It placed 2 of (3) at 3838.24 low and ((i)) of 3 at 4186.92 high. Within wave ((i)), it favored ended (i) at 4039.49 high and (ii) at 3914.24 low as 0.618 Fibonacci retracement. It finished (iii) at 4162.57 high and (iv) at 4049.35 low. Finally, it finished (v) at 4186.92 high as ((i)) of 3. It retraced in ((ii)) at 4048.28 low as 0.382 Fibonacci retracement of ((i)). Above there, it favors higher in ((iii)) of 3 and expect few more highs to finish it before starts ((iv)) pullback.
It placed (i) of ((iii)) at 4212.91 high and (ii) at 4103.98 low. (ii) was corrected 0.618 Fibonacci retracement of (i). Currently, it favors higher in (iii) of ((iii)) as extended Elliott wave sequence. It placed i of (iii) at 4217 high, ii at 4166.15 low. Currently, it favors higher in iii of (iii) and can see further upside to finish it before pullback starts in iv of (iii). It expect few more highs and can extend between 4398 -4614 area to finish ((iii)) before pullback starts in ((iv)) of 3.
SPX 1 Hour Elliott Wave Chart
SPX Elliott Wave Video
https://www.youtube.com/watch?v=wHxCgPksJZo
Today’s FOMC Will be a Key Focus for China and Hong Kong Stocks
- China proxies; Hang Seng Index, Hang Seng TECH, and Hang Seng China Enterprises have outperformed S&P 500 & MSCI All Country Asia ex Japan since 31 May.
- This outperformance has been reinforced by more impending monetary policy easing measures from China’s central bank, PBoC.
- The key risk to derail the current bout of animal spirits in China and Hong Kong stocks will be a further upward trajectory of the USD/CNH (offshore yuan).
China’s top policymakers are now in a “heightened state of alert” mode to address the current weakening internal domestic consumption environment after a string of disappointing and lackluster key leading economic data such as the NBS Manufacturing and Services PMIs surveys and trade balance for May.
Since February, the initial growth spurt triggered by the exit of stringent Covid-19 lock-down measures has dissipated over the last three months which in turn created a challenge for policymakers to achieve the annual GDP growth target of around 5% set for 2023 based on the current piece-meal targeted expansionary policies.
China’s central bank, PBoC cut its seven-day reverse repo rate by 10 basis points to 1.90% from 2.00% yesterday, 13 June; the first cut in ten months after deposit rates of major Chinese state-owned commercial banks were cut last week by 15 basis points and 5 basis points on the three-year and five-year term deposits as per advised by PBoC.
Thus, the odds of a possible 10 basis points cut to PBoC’s other key monetary policy interest rate; the one-year medium-term lending facility (MLF) rate which PBoC lends out funds to Chinese banks have increased where it is to be announced this Thursday, 15 June. Currently, the one-year MLF rate stands at 2.75%, unchanged since August 2022.
If the one-year MLF rate is being reduced, likely, the one-year and five-year loan prime interest rates that are used to price corporate/consumer loans and mortgages will be cut as well in the following week as these loan prime interest rates have tracked closely with the one-year MLF rate in the past.
Hence, these latest stances from PBoC have implied that the “liquidity tap” has started to open slowly which in turn supports renewed positive animal spirits in China and HK stock indices as highlighted in our earlier analysis report; “China and HK equities see the return of positive animal spirits” published on 7 June 2023.
China proxies-Hong Kong stock indices have outperformed in the past four weeks
The Hang Seng Index, Hang Seng TECH Index, and Hang Seng China Enterprises Index have staged accumulated returns of +8.2%, +13.3%, and +8.8% from 31 May’s lows to Tuesday, 13 June closing levels that outperformed the US S&P 500 (+4.9%) and MSCI All Country Asia ex Japan (6.2%) over the same period.
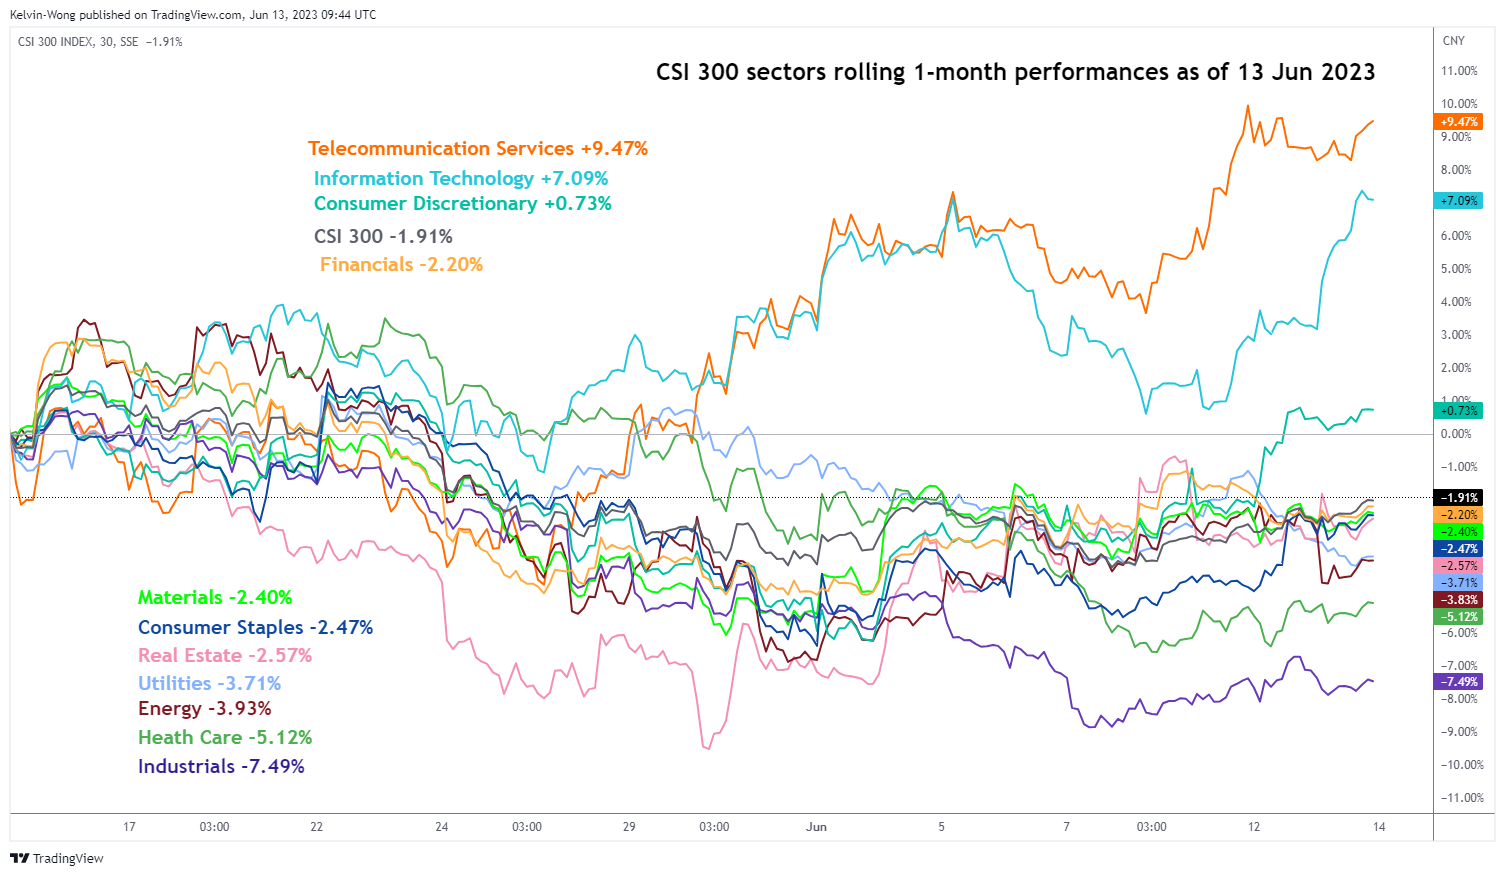
Fig 1: CSI 300 sectors rolling 1-month performances as of 13 Jun 2023 (Source: TradingView, click to enlarge chart)
Also, based on yesterday’s closing prices (13 June) of the eleven key CSI 300 sectors, the top three outperforming sectors were Telecommunications (+9.47%), Information Technology (+7.09%), and Consumer Discretionary (+0.73%). The steepest ascend came from Information Technology as its “performance gap” differential with the leader, Telecommunications Services had been narrowed significantly in the last five days.
USD/CNH (offshore yuan) movement will be the canary in the coal mine
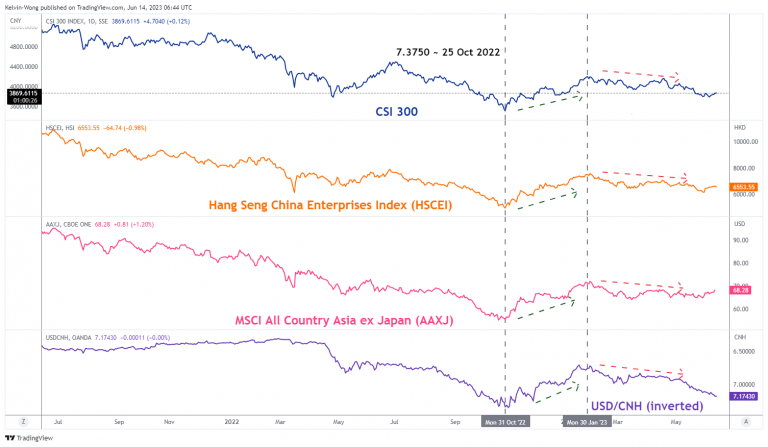
Fig 2: Correlation of USD/CNH (inverted) with CSI 300, HSCEI, & AAXJ as of 14 Jun 2023 (Source: TradingView, click to enlarge chart)
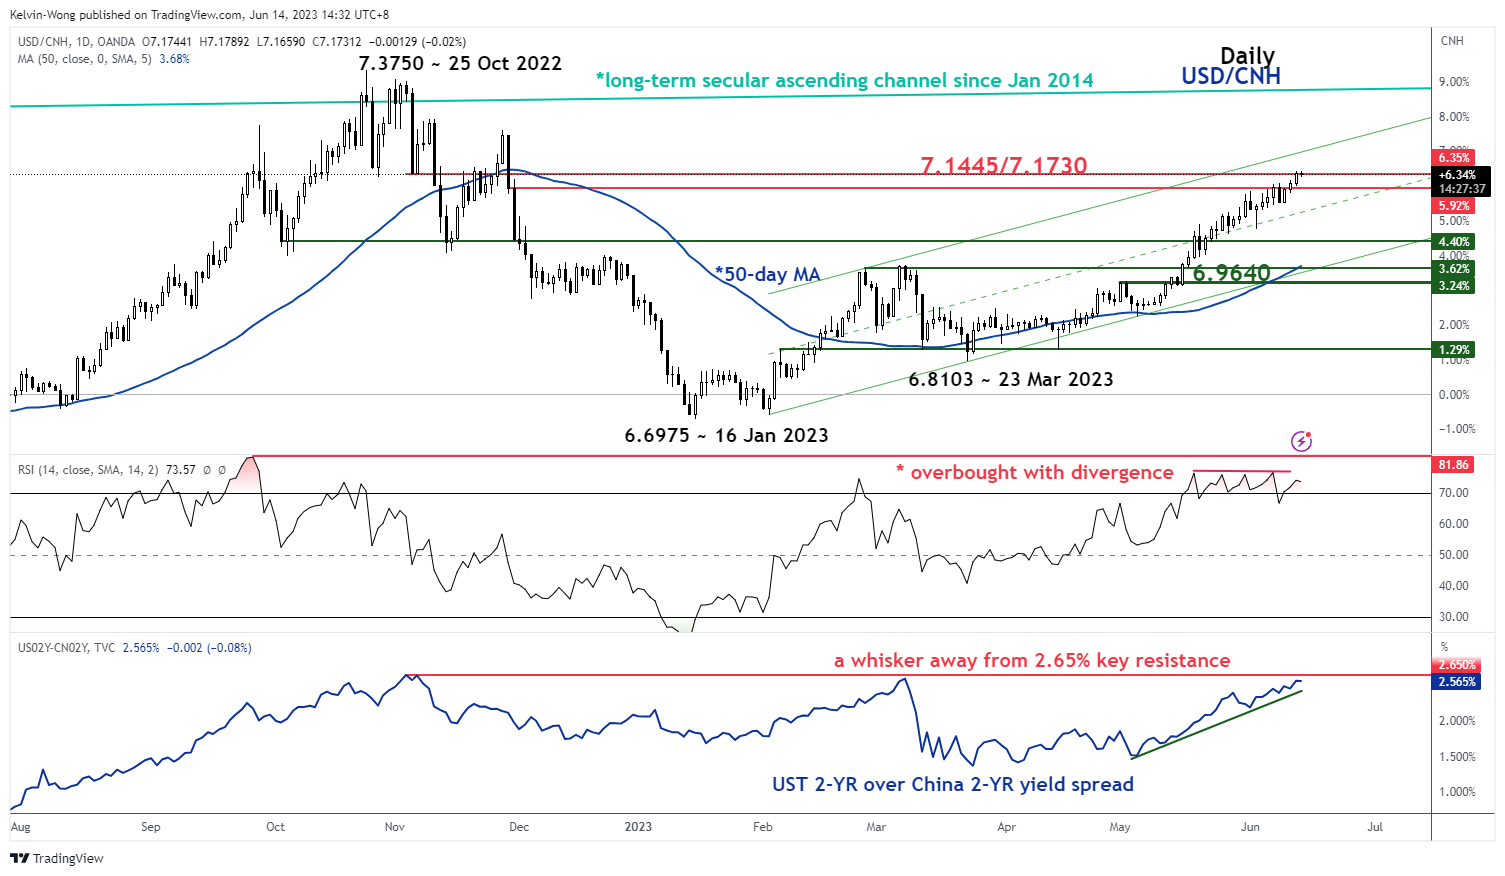
Fig 3: USD/CNH medium-term trend as of 14 Jun 2023 (Source: TradingView, click to enlarge chart)
The movement of the USD/CNH (yuan) tends to have a significant indirect correlation with China-related equities and even the wider Asian ex-Japan stock markets.
As seen from the chart above, the recent bout of pronounced weakness seen in the CNH (offshore yuan) against the USD in place since 30 January 2023 has also led to a similar downtrend movement seen in the CSI 300, Hang Seng China Enterprises Index, and the MSCI All Country Asia Ex Japan.
Therefore, for the recent positive animal spirits to persist in the China and Hong Kong stock indices, the six months of medium-term uptrend seen in the USD/CNH needs to take a pause and staged a corrective pull-back.
From a technical analysis perspective, the up move of the USD/CNH has reached the upper limit of a medium-term resistance zone of 7.1445/7.1730 (printed a current intraday high of 7.1789 at this time of writing).
In addition, the sovereign bond 2-year yield spread of the US Treasury over China has continued to widen since 3 May 2023 which in turn supports the ongoing USD strength over CNH. Interestingly, the US-China sovereign bond 2-year spread is now a whisker away from its key resistance of 2.65% (2.57% intraday).
Given that the bias of the China 2-year sovereign bond yield is likely to be on a path of downward trajectory due to impending monetary policies easing from PBoC. Thus, the other side of the equation will now be paramount which is today’s Fed FOMC outcome, dot plot projections, and future US monetary policy guidance that is likely to be the last remaining pieces of the jigsaw puzzle to determine whether the current leg of positive animal spirits can persist for China and Hong Kong benchmark stock indices.
Gold Tests Major Support
GBP/USD breaks resistance
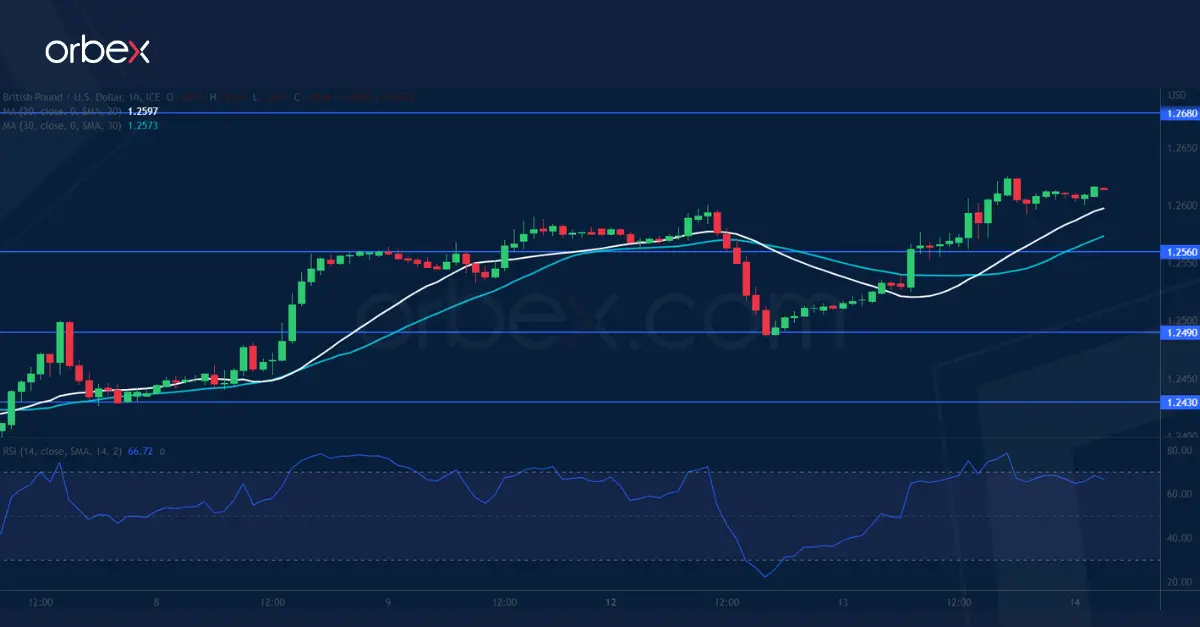
The US dollar sank after slow inflation raised the chance of a pause in interest rate hikes from the Fed. The market mood has stayed positive despite a choppy consolidation under the recent top of 1.2680 over the past month. The pair first hit resistance at 1.2600 and a retracement came to a rest at 1.2490, indicating that buyers are still eager to offer support. Then a decisive bullish breakout would make clearing 1.2680 a formality, extending the pound’s rally towards 1.3000 in the weeks to come. 1.2560 is now a fresh support.
XAU/USD struggles to bounce
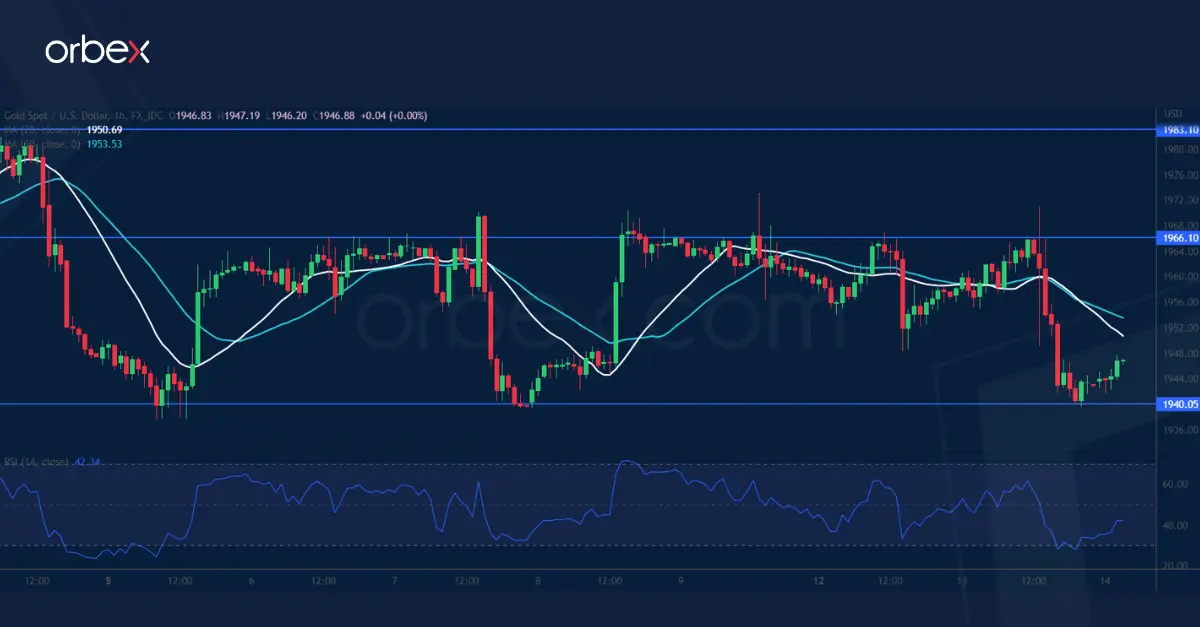
Bullion tumbled as risk assets took over with the FOMC expected to keep interest rates unchanged. As the price struggles to secure support in its corrective phase, the triple bottom around 1940 is the recent bulls’ last stronghold and a critical floor to stabilise sentiment. Its breach would trigger a round of liquidation with the psychological level of 1900 as a potential target. 1966 is the first hurdle to lift in case of a bounce and only a close above 1983 which has proved to be a tough level to crack would turn the tide.
US Oil recoups losses
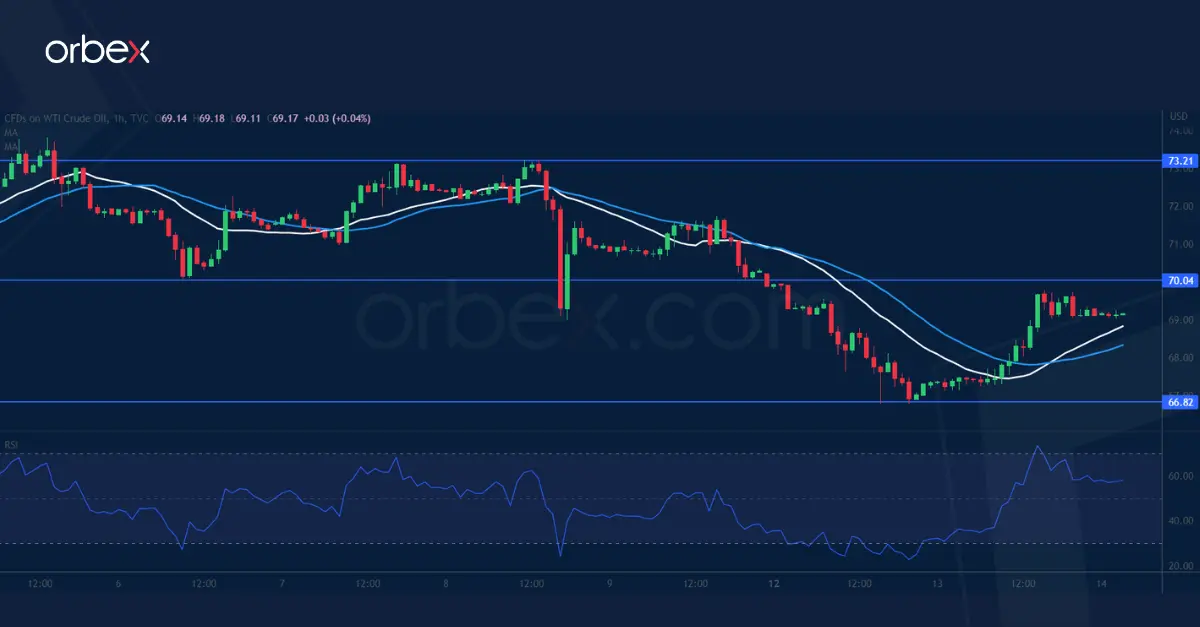
WTI crude bounces thanks to China's rate cut and a probable hike pause by the Fed. Still, a full retracement of a previous rebound below 67.20 showed a lack of commitment to keep the commodity afloat. As the price inches towards the double bottom of 66.00 on the daily chart, 66.80 saw some bargain hunters. 70.00 is the first level to lift to give the buy side some break, who must clear 73.20 before they could hope for a genuine rebound. Otherwise, the oil price would see the March rally as a mere dead cat bounce.
Brent Crude Oil Prices Experience Decline Amidst Market Factors
The commodity market is currently being impacted by various factors, causing Brent crude oil prices to decline. Currently, the price of a barrel of Brent is hovering around $72.35, reflecting a loss of approximately 4% within a 24-hour period.
Bearish sentiment in the oil market has been bolstered by Goldman Sachs' updated price forecast. The investment bank now estimates that the average price per barrel will drop to $86.00, down from the previous forecast of $95.00 at the end of last year. Similarly, the outlook for WTI has worsened, with expectations declining from $89.00 to $81.00 per barrel.
Goldman Sachs analysts had previously held a more optimistic view on oil prices.
Furthermore, the pressure on commodity prices is being exerted by market anticipation of interest rate decisions by the Federal Reserve (Fed) and the European Central Bank (ECB). Both central banks are scheduled to hold their meetings later this week, on Wednesday and Thursday respectively.
Technical Analysis
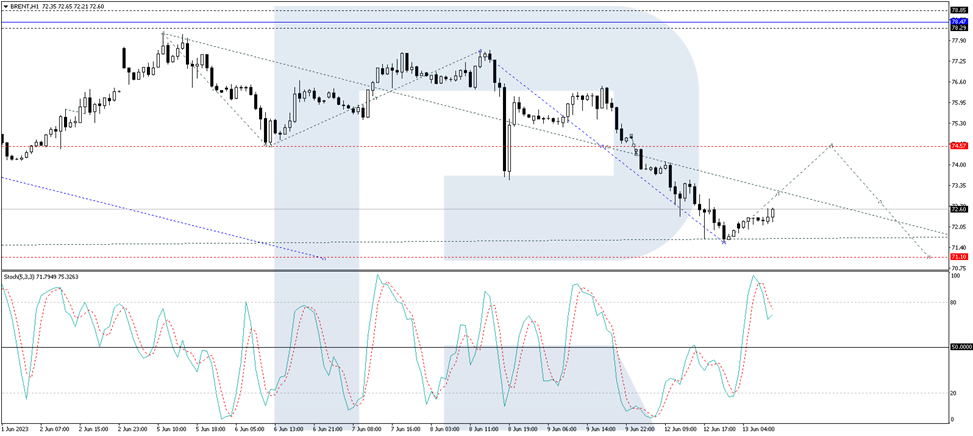
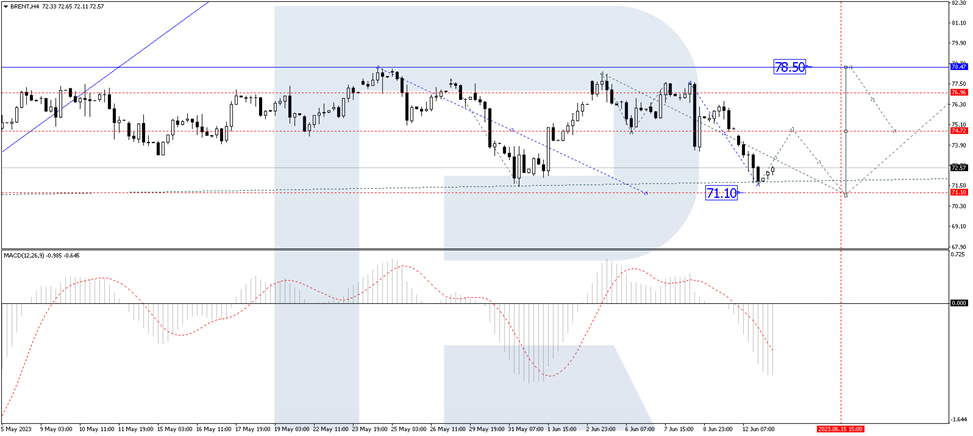
On the H4 timeframe, Brent crude oil is currently forming a wide consolidation range, centered around 74.55. However, the market has extended this range downwards to 71.55, indicating a potential for further correction. Today, we expect to see a potential upward movement towards 74.55, which will be tested from below. Following this, a downward trend towards 71.10 and subsequent upward movement towards 78.50 cannot be ruled out. This is the initial target. Technically, this scenario is supported by the MACD indicator, as its signal line is currently below zero and preparing to exit the histogram area, suggesting potential price growth.
On the H1 timeframe, Brent crude oil is currently following an upward wave structure towards 73.10. Once the price reaches this level, a downward correction towards 72.30 may occur. Subsequently, if the price reaches the 72.30 level, a further rise towards 74.55 is anticipated. Technically, this scenario is confirmed by the Stochastic oscillator, as its signal line continues to decline towards 50. Once it reaches this level, an upward movement towards 80 is expected to begin.