Sample Category Title
Risk-On Sentiment Continued, Dollar Relatively Resilient Despite Receding June Hike Expectations
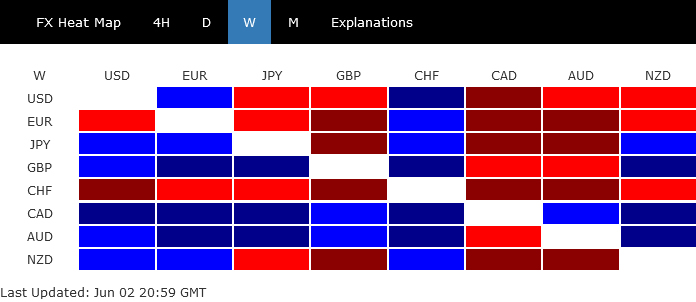
Global stock markets registered impressive gains last week, with the resolution of the US debt ceiling and robust American job data contributing to the bullish momentum. The ebbing expectation of a Federal Reserve rate hike in June also provided additional support. Canadian and Australian dollars emerged as the week's top performers, reflecting the market's increased anticipation of tighter monetary policy by BoC and RBA, even though these moves are not imminent. The British pound also showcased significant strength, gaining ground against other European majors.
Despite closing as the third weakest, the US dollar staged a notable rally towards the end of the week against Euro, Yen, and European majors. This surge was mirrored in stock markets and seems to indicate continuous decoupling from risk sentiment. This trend is expected to persist for some time. On the other end of the spectrum, Euro and Swiss Franc found themselves at the bottom of the performance chart. Lower than expected Eurozone headline and core inflation readings exerted significant pressure on these currencies, leading to their underperformance.
US stocks soar, retest of record high attainable in H2
Last week saw a significant upswing in US stocks, primarily spurred by the resolution of the contentious debt ceiling issue and robust economic data. Market sentiment received a further boost from Friday's impressive non-farm payroll report. Coupled with recent remarks by Fed officials hinting at a potential pause in interest rate hikes in June, market players are increasingly expecting a "skip" at the upcoming Fed meeting.
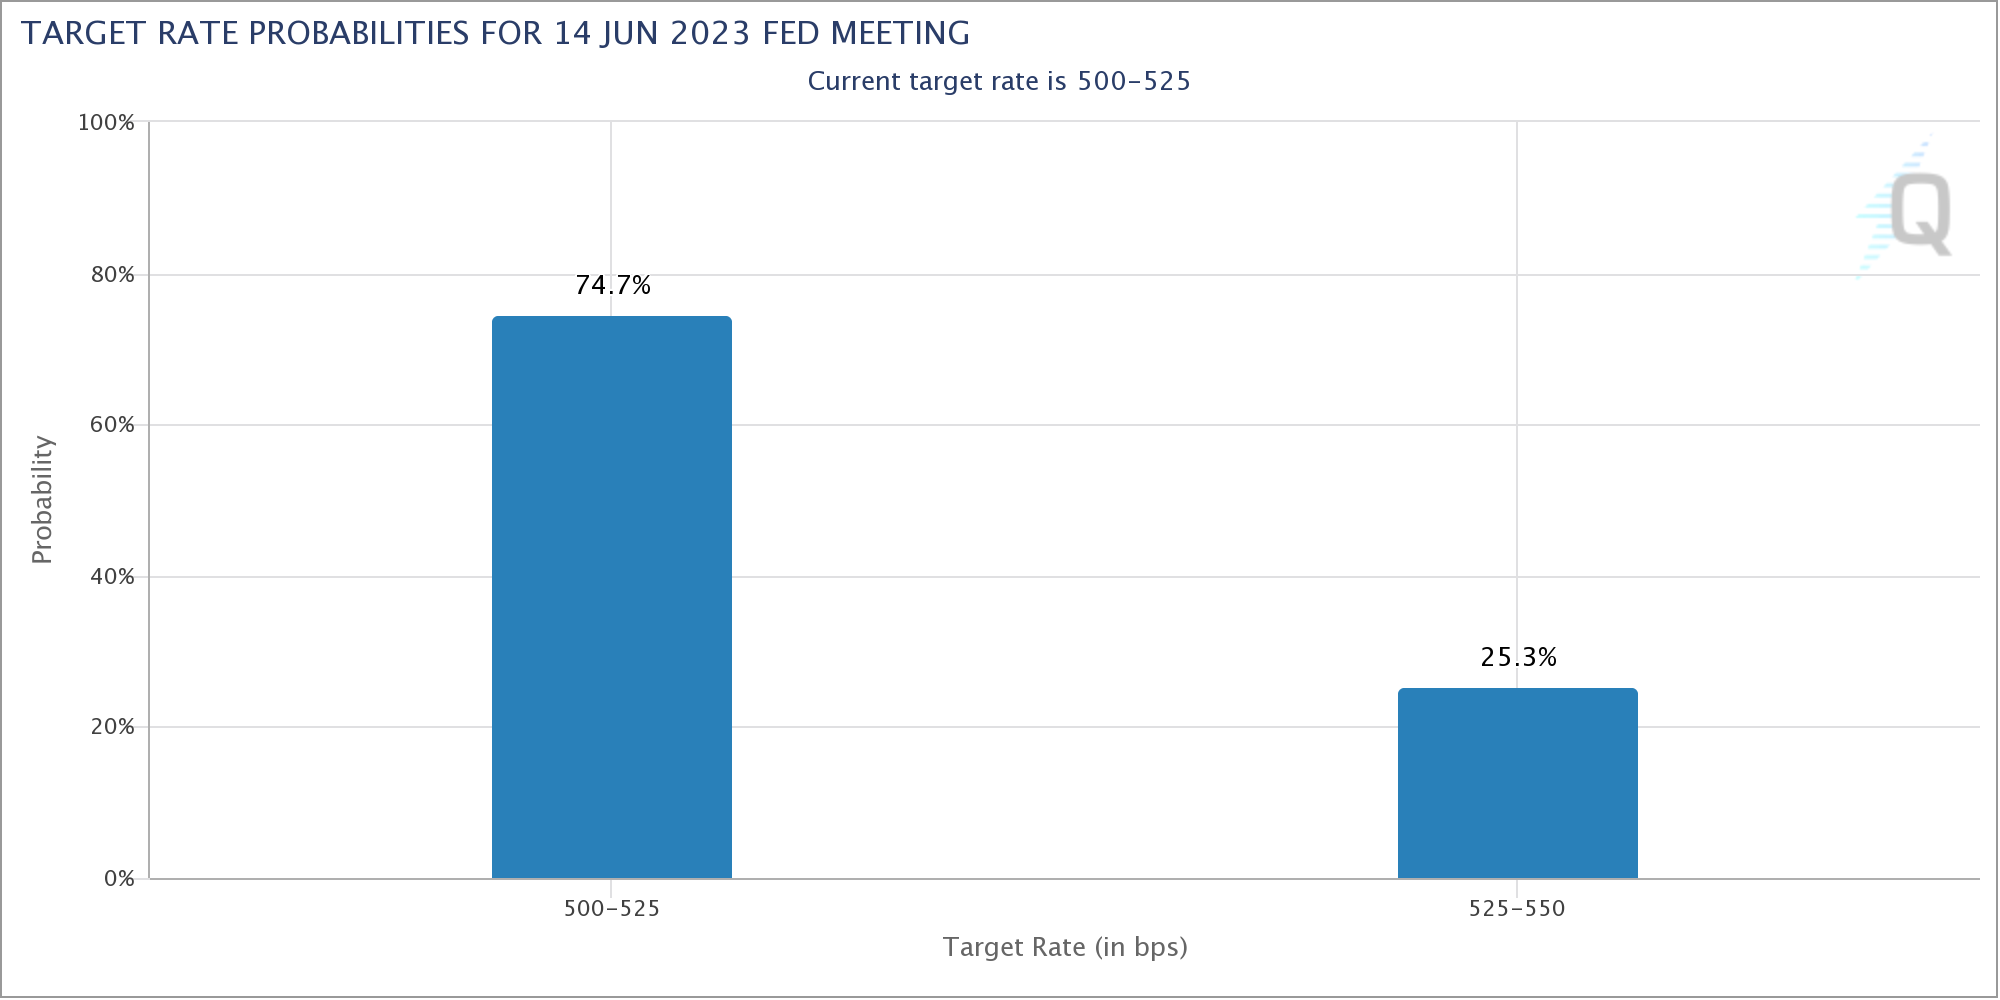
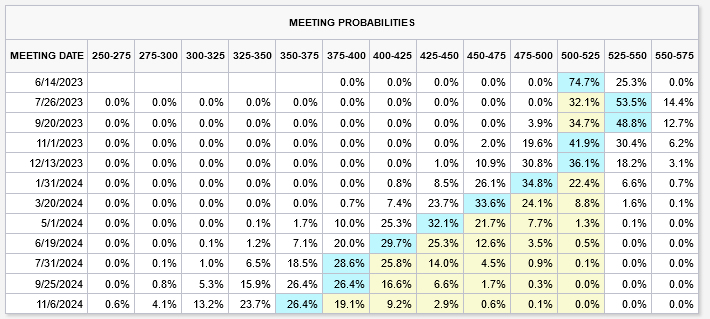
Fed funds futures now indicate a near 75% chance of a hold on June 14. They also predict a 67.9% probability of a further 25bp hike to a range of 5.25-5.50% on July 26, with a 61.5% chance of rates remaining unchanged post September 20 meeting. Expectations are currently at 63.4% for a rate cut to start in November.
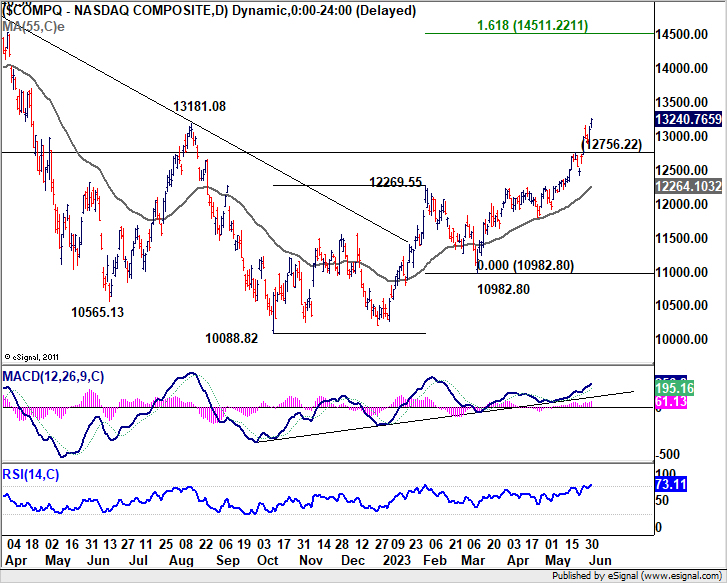
NASDAQ led the way in last week's rally, closing at its highest level in over a year, bolstered by influential mega-cap companies including chipmakers Nvidia and AMD, and AI trailblazers Alphabet and Microsoft.
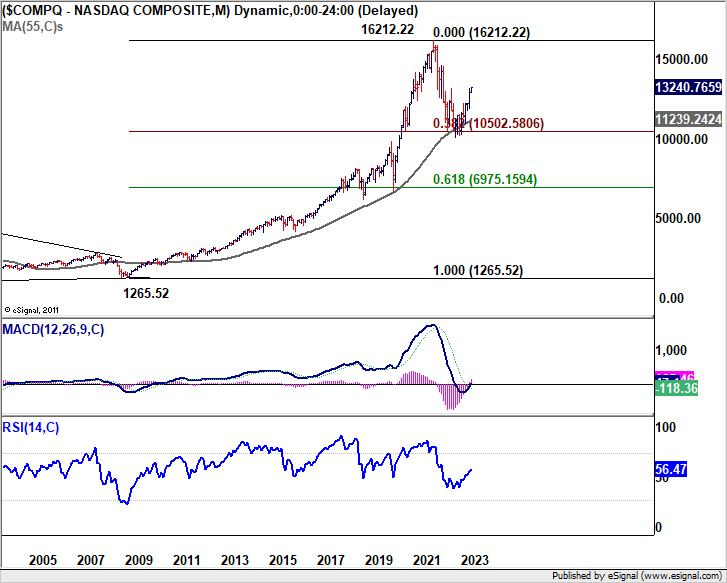
In technical terms, the close above the resistance level of 13181.08 appears to confirm that NASDAQ's correction from 2021 high of 16212.22 ended at 10088.82. Such an outcome came after the support drawn from the 55 M EMA and 38.2% retracement of 1265.52 to 16212.22 at 10502.58.
Near term outlook will now stay bullish as long as 12756.22 support holds. Next target is 161.8% projection of 10088.82 to 12269.55 from 10982.80 at 14511.22.
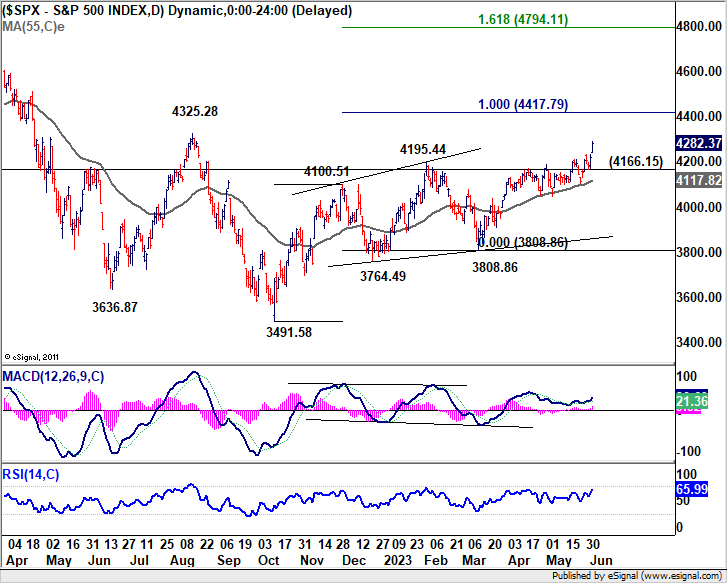
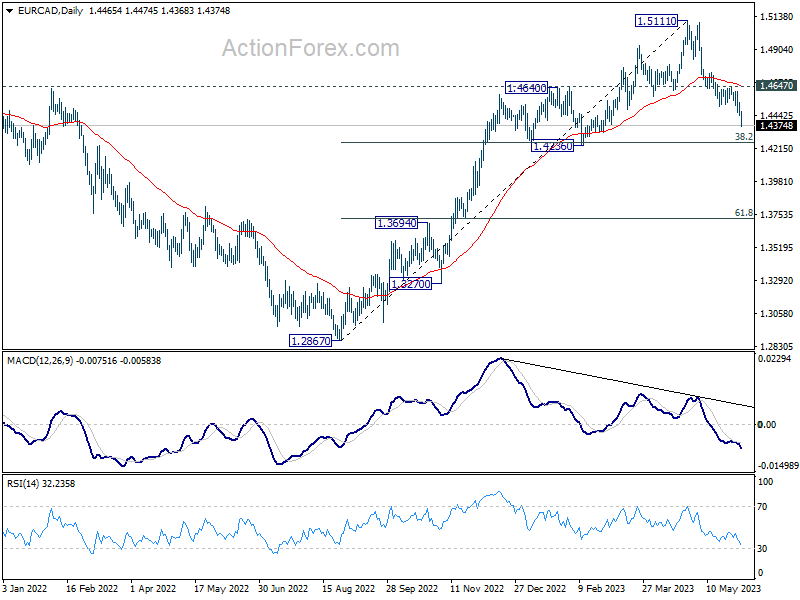
S&P 500 also enjoyed a vigorous rally last week, closing at 4282.37 and now setting its sights on 4325.28 structural resistance. Decisive break above this resistance will signal completion of the correction from the 2021 high of 4818.62, following support from the 55 M EMA.
In any case, near term outlook in SPX will now stay bullish as long as 4166.16 support holds. Next target is 100% projection of 3491.58 to 4100.51 from 3808.86 at 4417.79.
As it stands, it should be noted that while still a bit distant, retests of record highs in both NASDAQ and S&P 500 in the second half of the year now looking attainable.
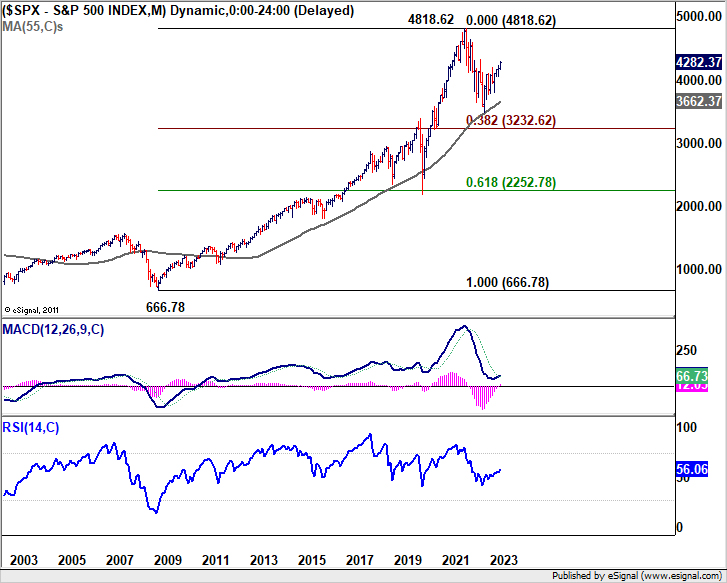
Concurrently, US 10-year yield retreated significantly last week due to diminishing expectations of a June Fed rate hike. Despite this, TNX managed to draw support from 55 Day EMA now at 5.879) to recover and close at 3.691, thus maintaining some degree of near-term bullishness. Outlook remains unchanged, as the correction from 4.333 seems to have completed in three waves down to 3.253, with expectations of another rise towards 4.091 structural resistance.
Dollar in retreat, but further rally still expected for near term
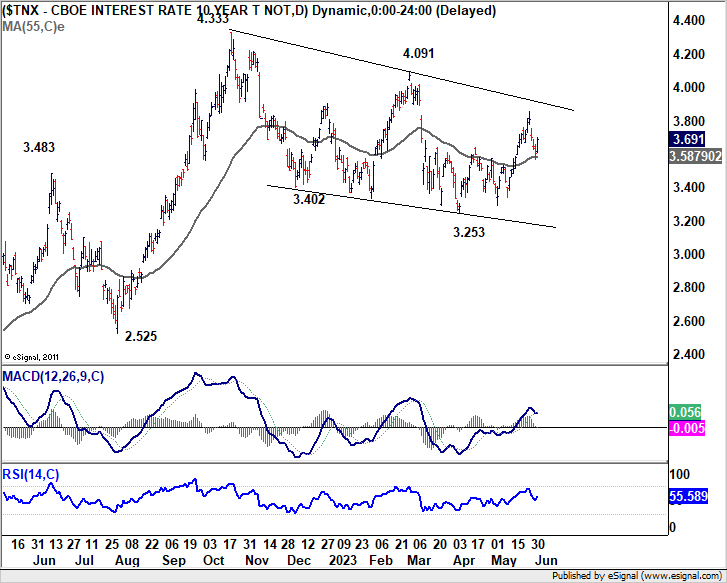
Dollar's correlation with overall risk sentiment appeared to continue to be unclear last week. Dollar index retreated after edging higher to 104.69. But DXY recovered notably on Friday (together with strong rally in stocks) to close at 104.01.
Further rally is expected in Dollar Index as long as 55 D EMA (now at 102.95) holds. Rise from 100.78 is seen as the third leg of the pattern from 100.82, and should target 105.88. Strong resistance could be seen from 38.2% retracement of 114.77 to 100.82 at 106.14 to limit upside, at least on first attempt.
EUR/CAD extended corrective fall, GBP/AUD risks topping
Euro ended as one of the worst performers in spite of persistent hawkish comments from ECB officials. Lower than expected headline and core inflation reading in May was a factor driving the weakness. Additionally, markets have increased expectation on extended tightening by some other major central banks, including BoC and RBA.
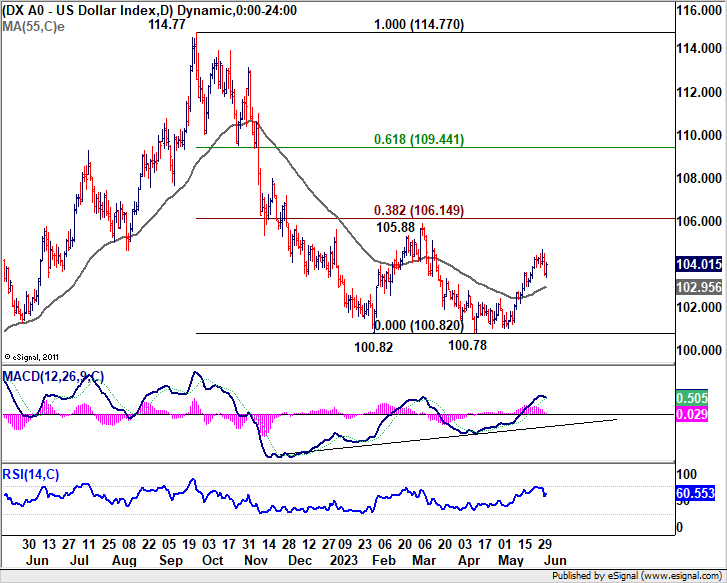
EUR/CAD resumed the corrective fall from 1.5111 last week to close at 1.4374. Near term outlook will stay bearish as long as 1.4647 resistance holds. Next target is 1.4256 cluster support (38.2% retracement of 1.2867 to 1.5111 at 1.4254). Strong support could be seen there to bring rebound, at least on first attempt. However, sustained trading below 1.4254/56 will bring even deeper decline to next cluster support at 1.3694 (61.8% retracement at 1.3724).
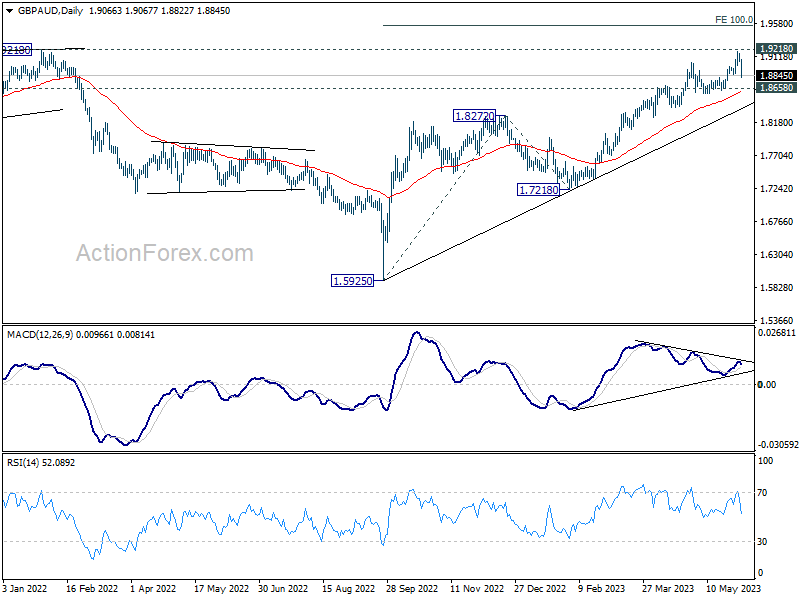
While GBP/AUD extended up trend to as high as 1.9180 risk of deeper pull back and extended correction is increasing. Considering bearish divergence condition in D MACD, firm break of 1.8658 support will indicate medium term topping, just a head of 1.9218 key resistance level. In this case, deeper decline could be seen to 1.8272 resistance support and possibly below, to correct whole up trend from 1.5925. However, firm break of 1.9218 will extend the up trend to 100% projection of 1.5925 to 1.8272 from 1.7218 at 1.9565 before topping.
USD/CHF Weekly Outlook
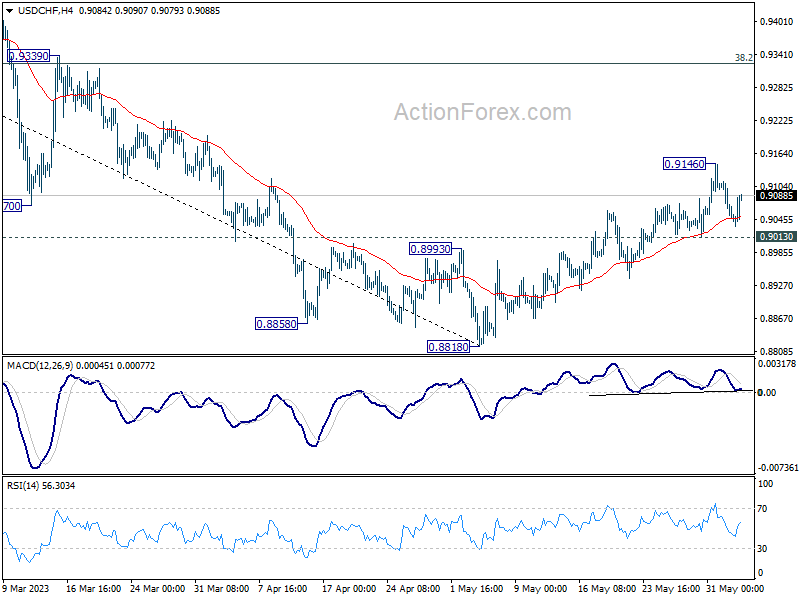
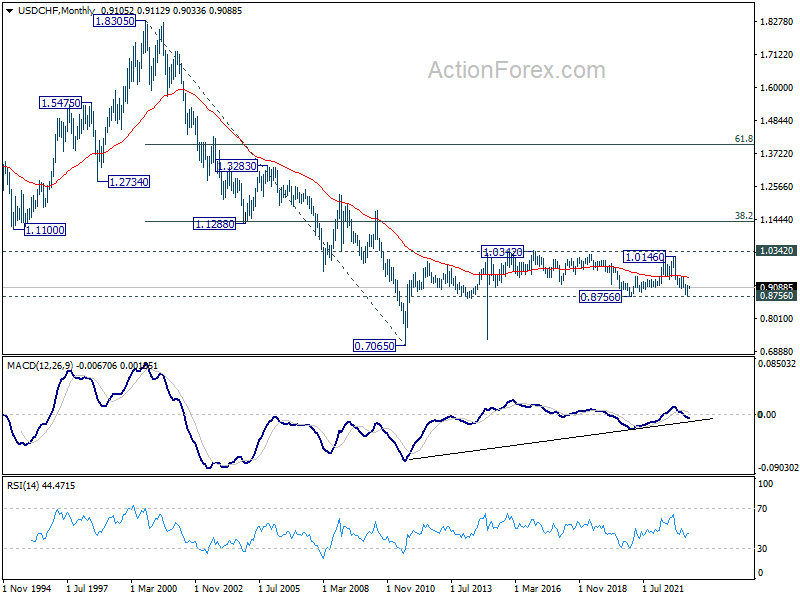
USD/CHF rebounded to 0.9146 last week but retreated since then. Initial bias remains neutral this week for consolidations. But further rally is expected as long as 0.9013 minor support holds. Rise from 0.8818 short term bottom is seen as corrective whole down trend from 1.0146. Above 0.9146 will target 38.2% retracement of 1.0146 to 0.8818 at 0.9325. On the downside, however, break of 0.9013 will turn bias back to the downside for retesting 0.8818 low instead.
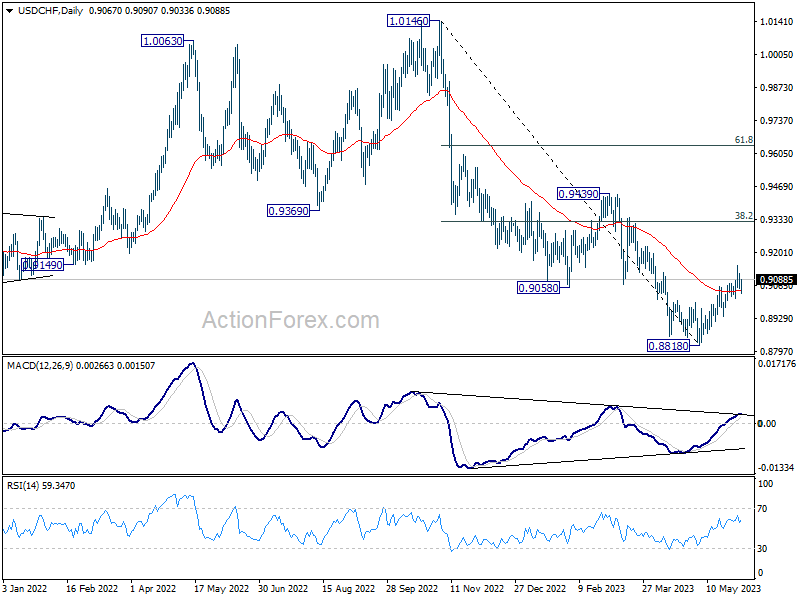
In the bigger picture, fall from 1.1046 (2022 high) is seen as a leg in the long term range pattern from 1.0342 (2016 high), which might have completed at 0.8818 already, just ahead of 0.8756 long term support. Sustained trading above 0.9058 support turned resistance should confirm medium term bottoming. Further break of 0.9439 resistance will confirm bullish trend reversal.
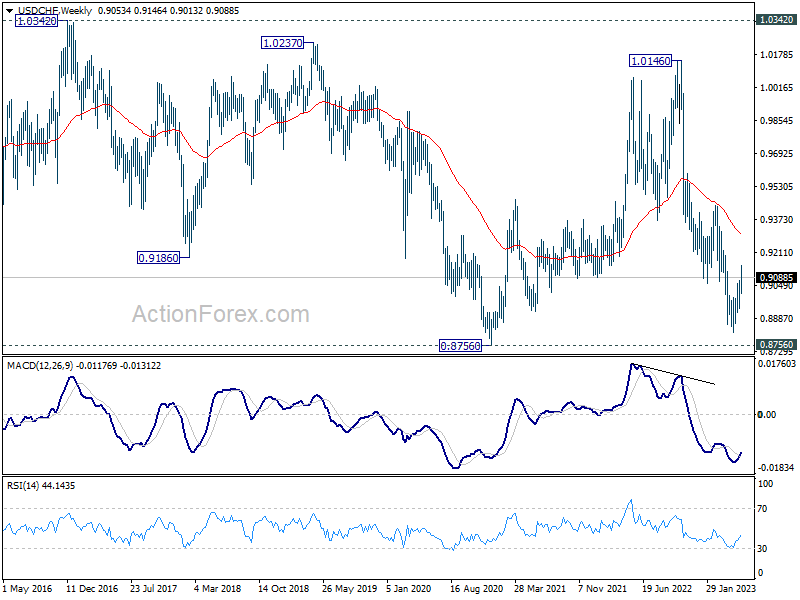
In the long term picture, long term sideway pattern from 1.0342 (2016 high) is expected to continue between 0.8756/1.0342. However, sustained break of 0.8756 will open up deeper fall back towards 0.7065 (2011 low).
EUR/USD Weekly Outlook
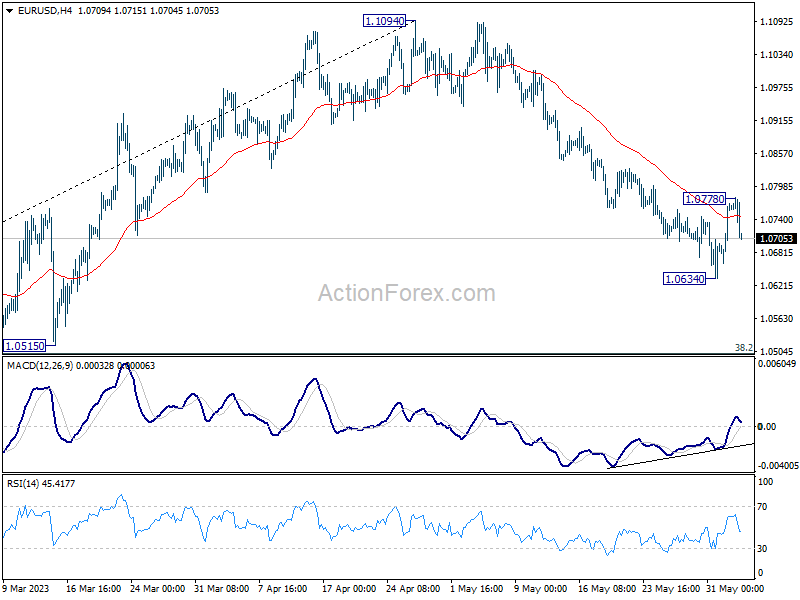
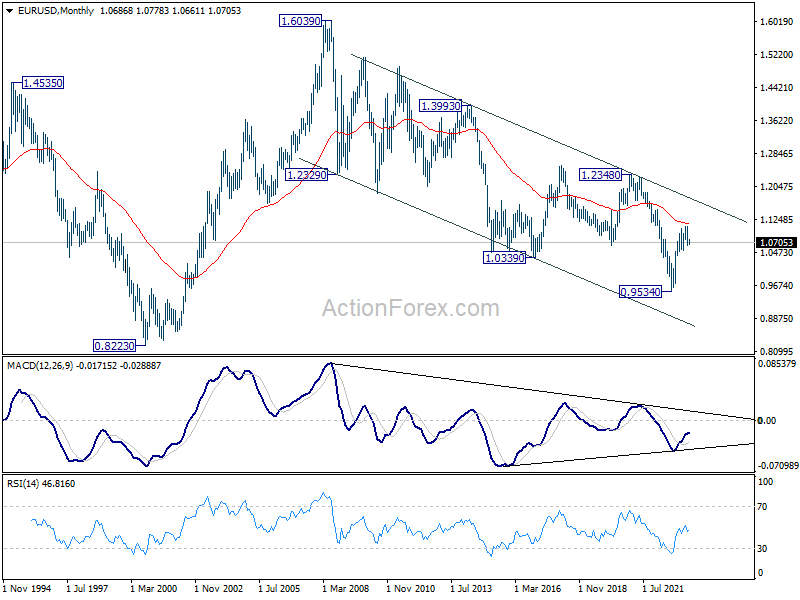
EUR/USD fell further to 1.0634 last week but recovered since then. As a temporary top was then formed at 1.0778, initial bias is turned neutral this week first. On the upside, above 1.0778 will resume the rebound from 1.0634 short term bottom to 55 D EMA (now at 1.0829). On the downside, though, break of 1.0634 will resume the fall from 1.1094 to 1.0515 cluster support, 38.2% retracement of 0.9534 to 1.1094 at 1.0498.
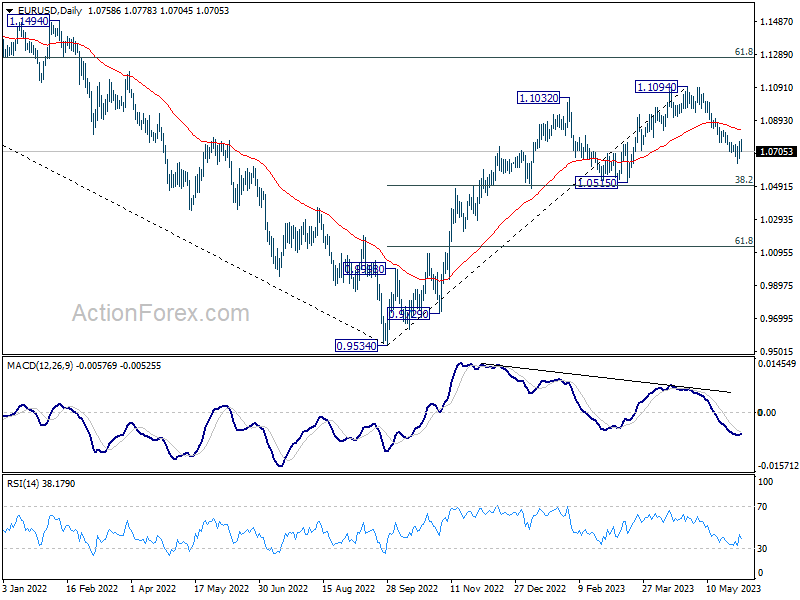
In the bigger picture, as long as 1.0515 support holds, rise from 0.9534 (2022 low) would still extend higher. Sustained break of 61.8% retracement of 1.2348 (2021 high) to 0.9534 at 1.1273 will solidify the case of bullish trend reversal and target 1.2348 resistance next (2021 high).
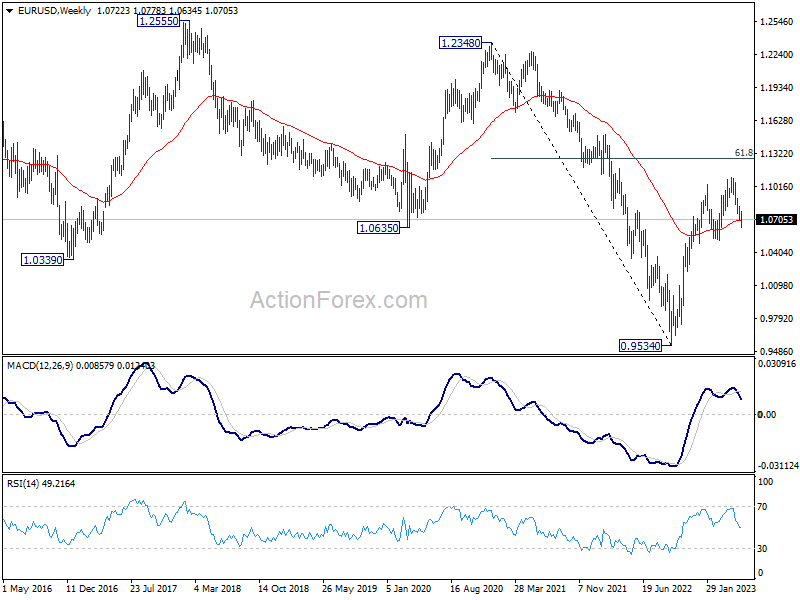
In the long term picture, focus is now on 55 M EMA (now at 1.1134). Rejection by this EMA will revive long term bearishness. However, sustained break above here will be affirm the case of long term bullish reversal and target 1.2348 resistance next.
USD/JPY Weekly Outlook
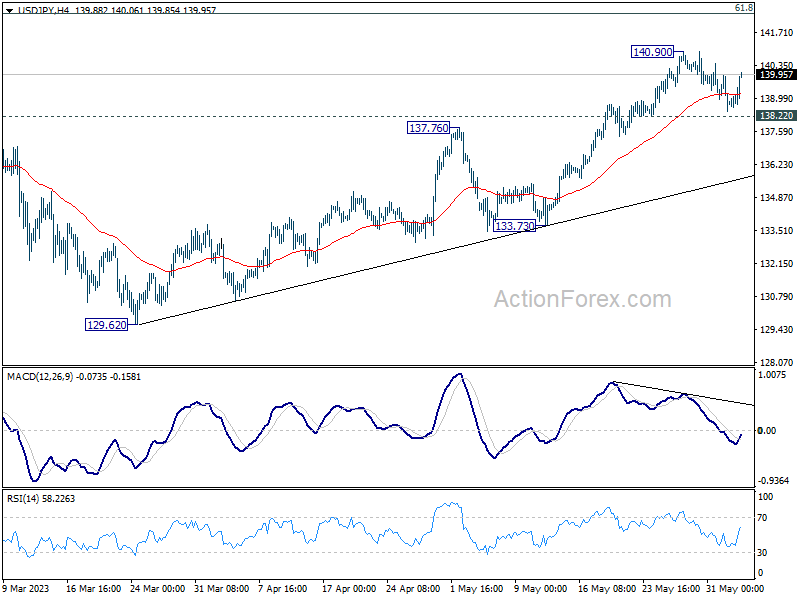
USD/JPY turned into consolidation after edging higher to 140.90 last week. Initial bias remains neutral this week first, and further rally is expected as long as 138.22 minor support holds. On the upside, break of 140.90 will resume larger rise from 127.20 to 142.48 fibonacci level. However, considering bearish divergence condition in 4 hour MACD, break of 138.22 will confirm short term topping, and turn bias back to the downside for 55 D EMA (now at 136.12).
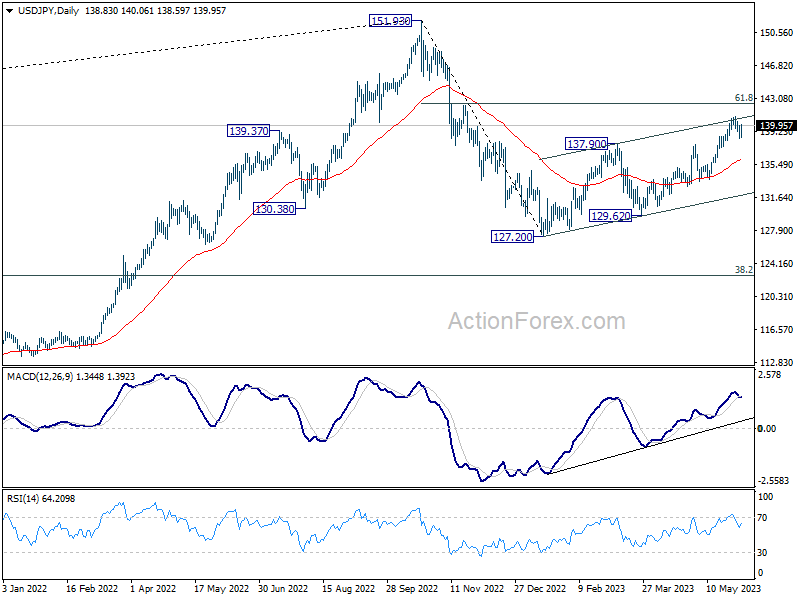
In the bigger picture, rise from 127.20 is seen as the second leg of the corrective pattern from 151.93 high. Stronger rally would be seen to 61.8% retracement of 151.93 to 127.20 at 136.34. Sustained break there will pave the way back to retest 151.93. On the downside, however, break of 133.73 support will argue that the pattern could have started the third leg through 127.20 low.
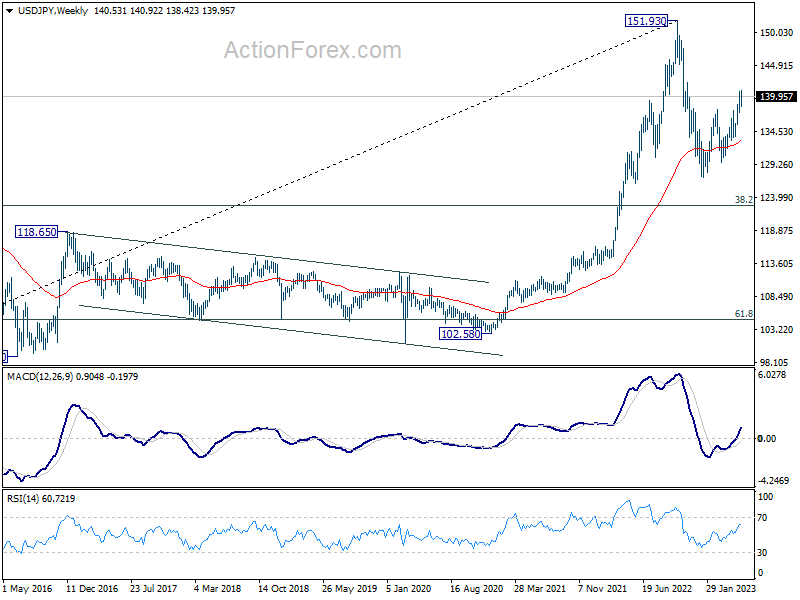
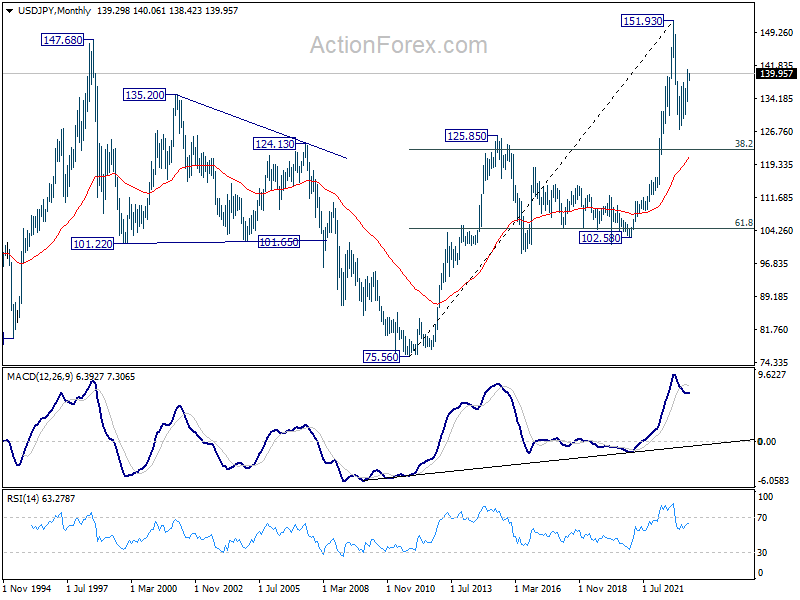
In the long term picture, price action from 151.93 is seen as developing into a corrective pattern to up trend from 75.56 (2011 low). While deeper decline cannot be ruled out, downside should be contained by 38.2% retracement of 75.56 to 151.93 at 122.75.
GBP/USD Weekly Outlook
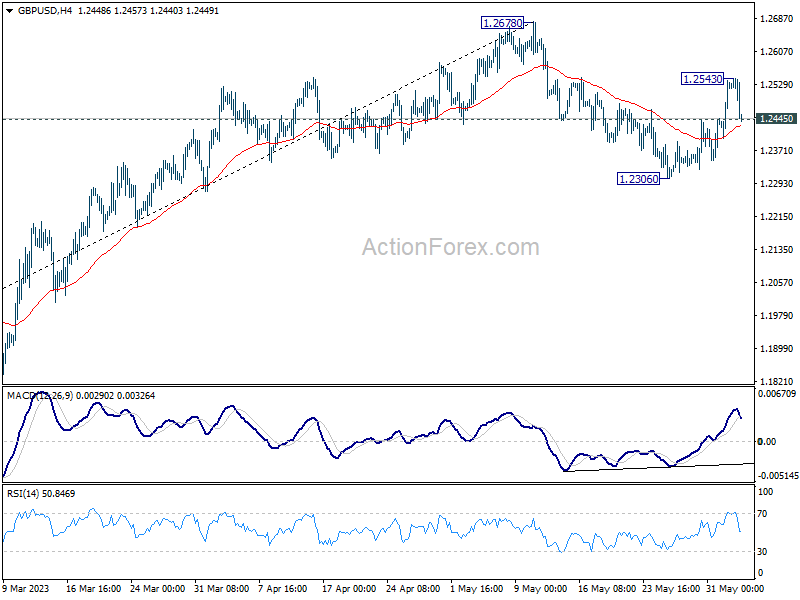
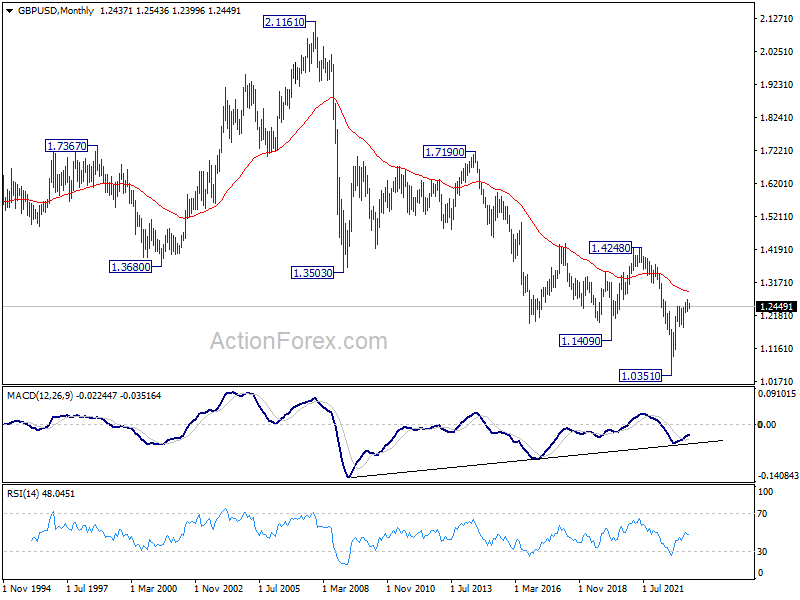
GBP/USD rebounded strongly to 1.2543 last week but retreated since then. Initial bias is neutral this week first. On the upside, above 1.2543 will resume the rebound to retest 1.2678 high. Meanwhile, break of 1.2306 will resume the correction towards 1.1801 cluster support (38.2% retracement of 1.0351 to 1.2678 at 1.1789).
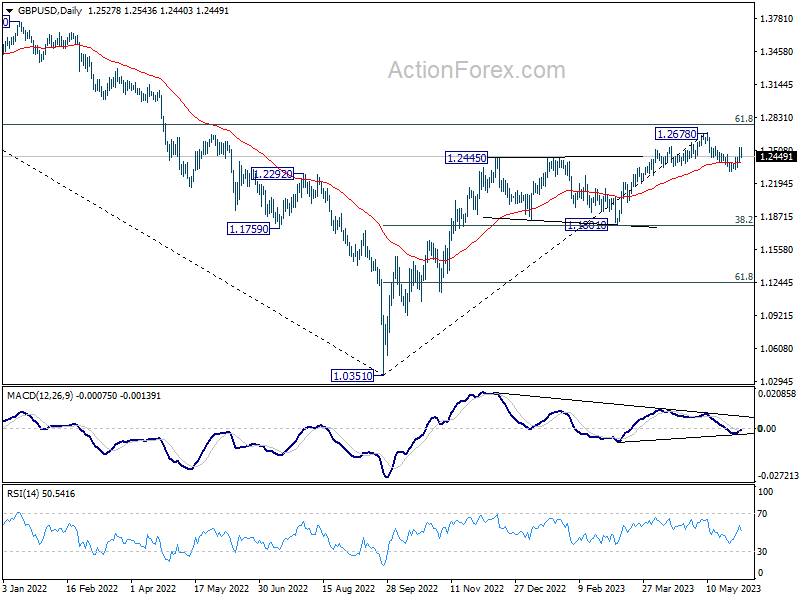
In the bigger picture, as long as 1.1801 support holds, rise from 1.0351 medium term bottom (2022 low) is expected to extend further. Sustained break of 61.8% retracement of 1.4248 (2021 high) to 1.0351 at 1.2759 will add to the case of long term bullish trend reversal. However, firm break of 1.1801 will indicate rejection by 1.2759, and bring deeper decline, even as a correction.
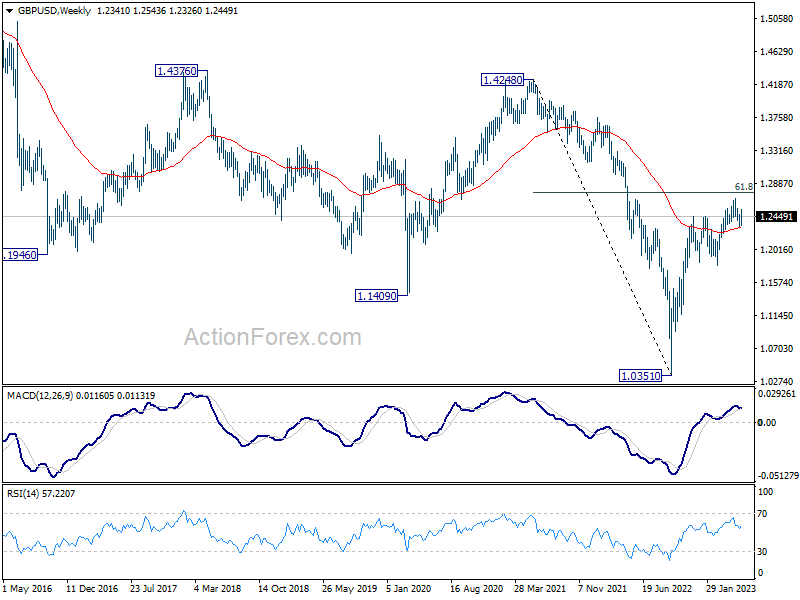
In the long term picture, while the rise from 1.0351 (2022 low) has been strong, there is no clear indicate of long term trend reversal yet. As long as 1.4248 resistance holds (2021 high), long term outlook will remain neutral at best.
USD/CHF Weekly Outlook
USD/CHF rebounded to 0.9146 last week but retreated since then. Initial bias remains neutral this week for consolidations. But further rally is expected as long as 0.9013 minor support holds. Rise from 0.8818 short term bottom is seen as corrective whole down trend from 1.0146. Above 0.9146 will target 38.2% retracement of 1.0146 to 0.8818 at 0.9325. On the downside, however, break of 0.9013 will turn bias back to the downside for retesting 0.8818 low instead.
In the bigger picture, fall from 1.1046 (2022 high) is seen as a leg in the long term range pattern from 1.0342 (2016 high), which might have completed at 0.8818 already, just ahead of 0.8756 long term support. Sustained trading above 0.9058 support turned resistance should confirm medium term bottoming. Further break of 0.9439 resistance will confirm bullish trend reversal.
In the long term picture, long term sideway pattern from 1.0342 (2016 high) is expected to continue between 0.8756/1.0342. However, sustained break of 0.8756 will open up deeper fall back towards 0.7065 (2011 low).
AUD/USD Weekly Report
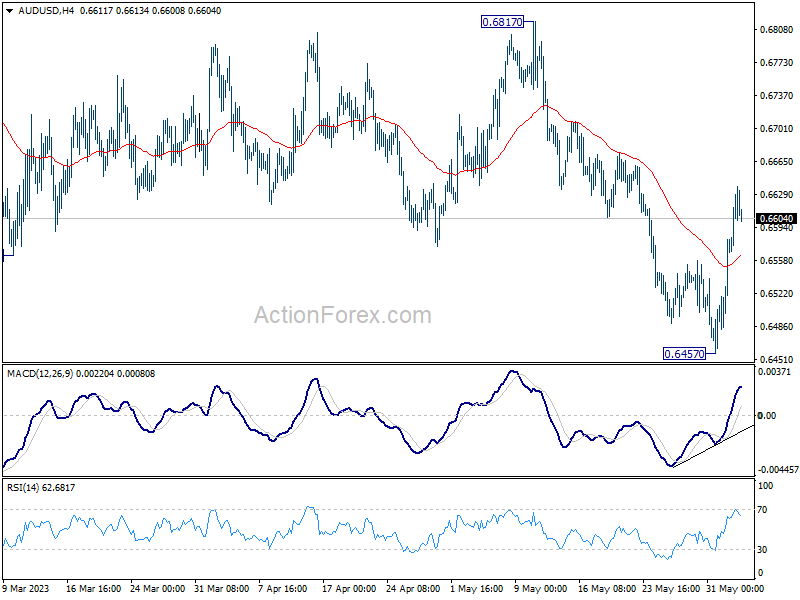
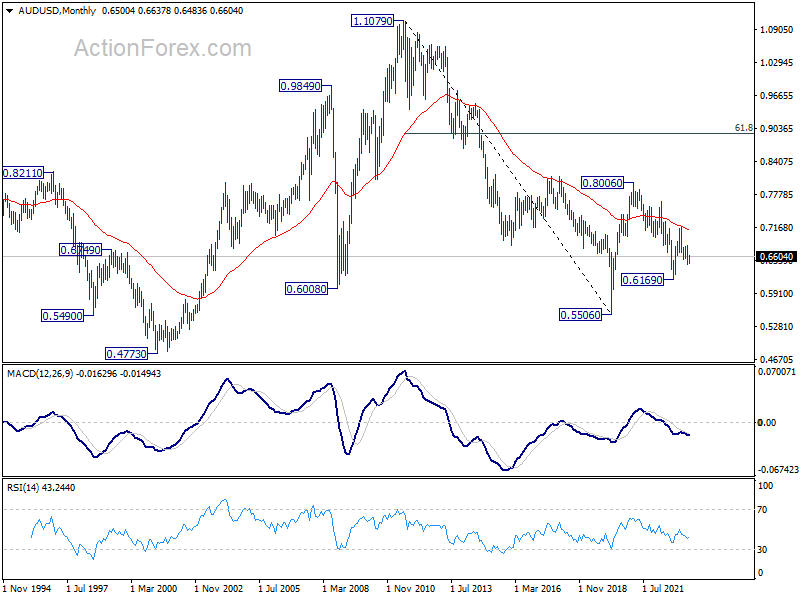
AUD/USD rebounded strongly after initial dip to 0.6457 last week. Initial bias is now mildly on the upside this week for 55 D EMA (now at 0.6659). Sustained break there will target 0.6817 resistance next. Nevertheless, rejection by 55 D EMA will keep near term outlook bearish. Firm break of 0.6457 will resume the fall from 0.7156.
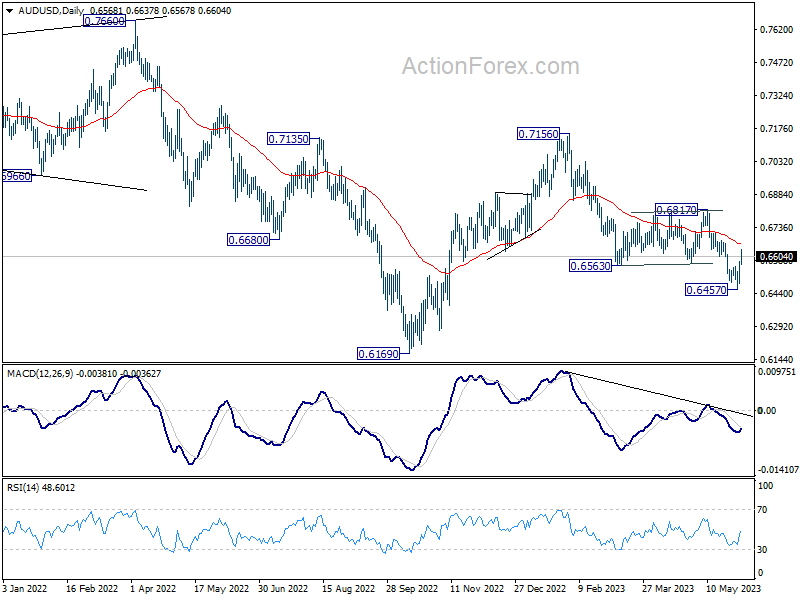
In the bigger picture, rejection by 55 W EMA (now at 0.6811) keeps medium term outlook bearish. Current development suggests that down trend from 0.8006 (2021 high) is possibly still in progress. Retest of 0.6169 (2022 low) should be seen next. Firm break there will confirm down trend resumption. For now, this will remain the favored case as long as 0.6817 resistance holds.
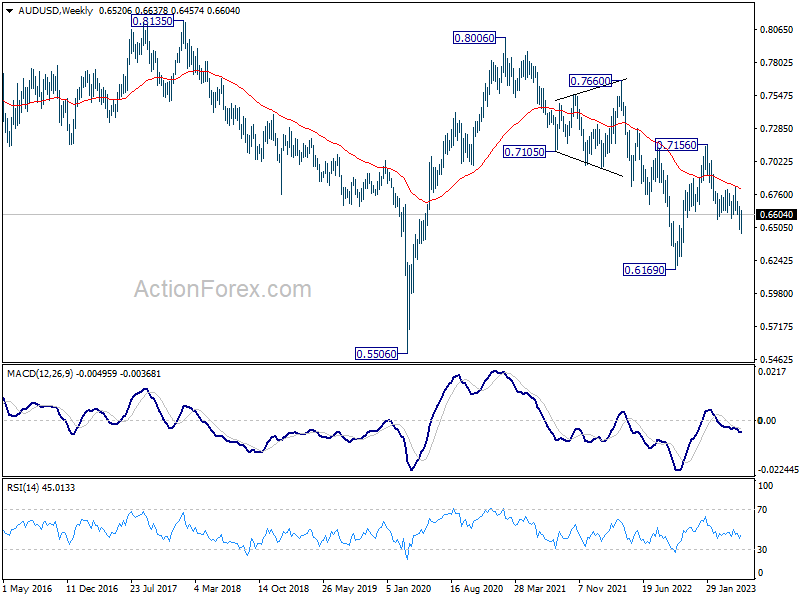
In the long term picture, initial rejection by 55 M EMA (now at 0.7119) retains long term bearishness. That is, down trend from 1.1079 (2011 high) could still resume through 0.5506 (2020 low) on resumption.
USD/CAD Weekly Outlook
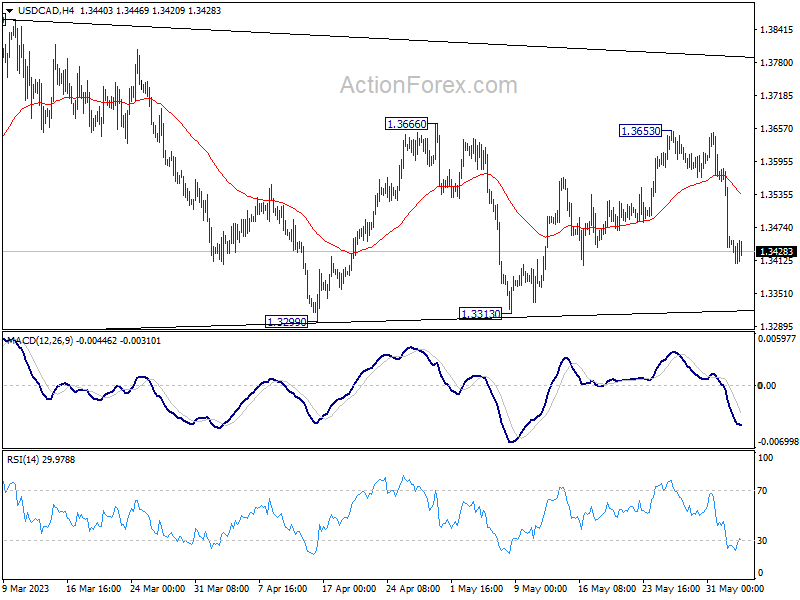
USD/CAD fell sharply last week but overall outlook is unchanged. Initial bias remains neutral this week first. Price actions from 1.3976 are seen as a triangle consolidation pattern. Above 1.3666 will target 1.3860 resistance first. Firm break of 1.3860 will argue that larger up trend is ready to resume through 1.3976 high. Nevertheless, sustained break of 1.3229 will dampen this view and turn near term outlook bearish.
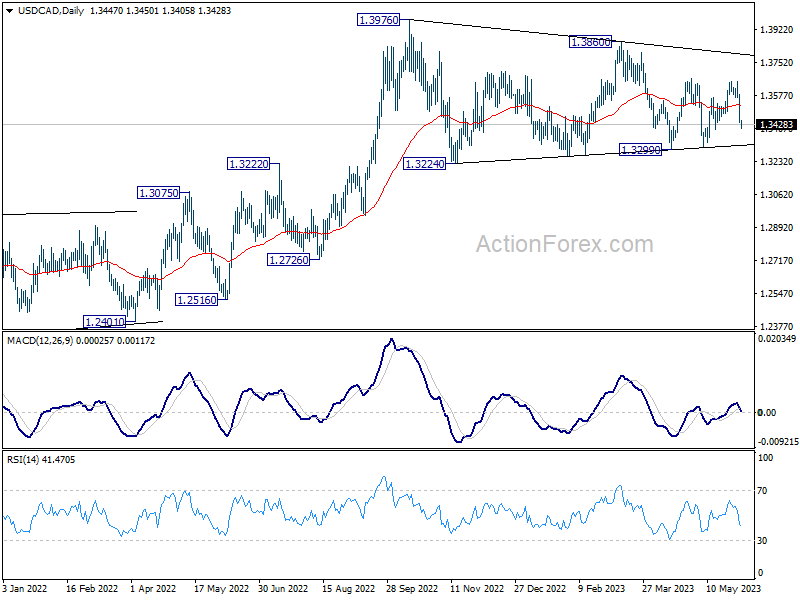
In the bigger picture, rise from 1.2005 (2021 low) is expected to resume through 1.3976 after consolidation from there completes. On decisive break of 1.3976, next target will be 1.4667/89 long term resistance zone. This will remain the favored case as long as 38.2% retracement of 1.2005 to 1.3976 at 1.3233 holds.
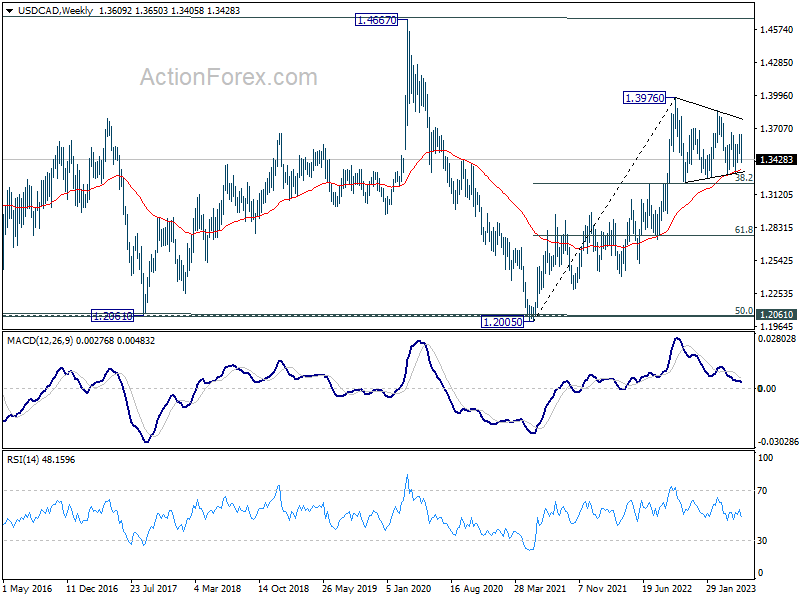
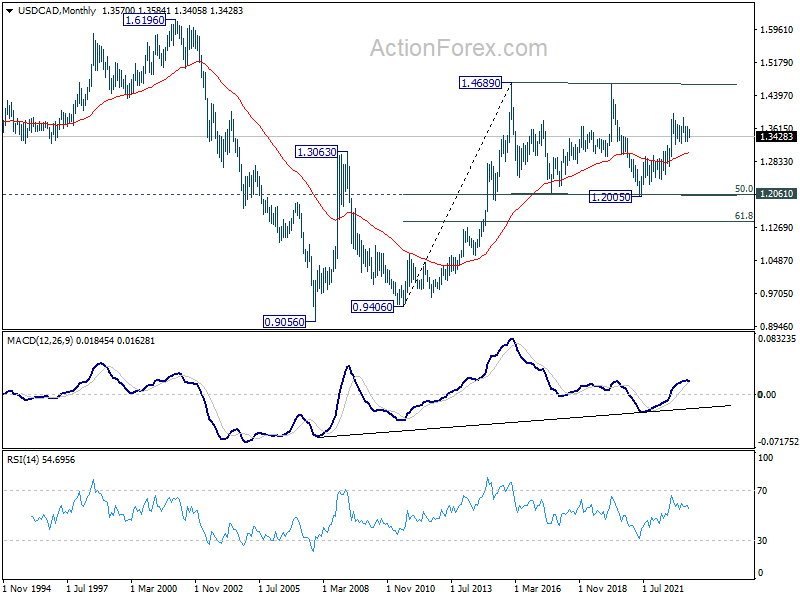
In the longer term picture, price actions from 1.4689 (2016 high) are seen as a consolidation pattern only, which might have completed at 1.2005. That is, up trend from 0.9506 (2007 low) is expected to resume at a later stage. This will remain the favored case as 55 M EMA (now at 1.3046) holds.
GBP/JPY Weekly Outlook
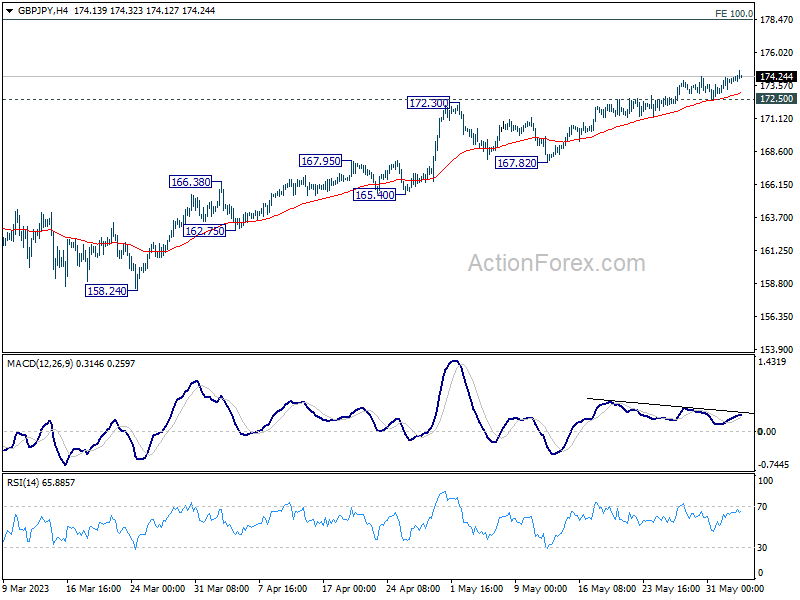
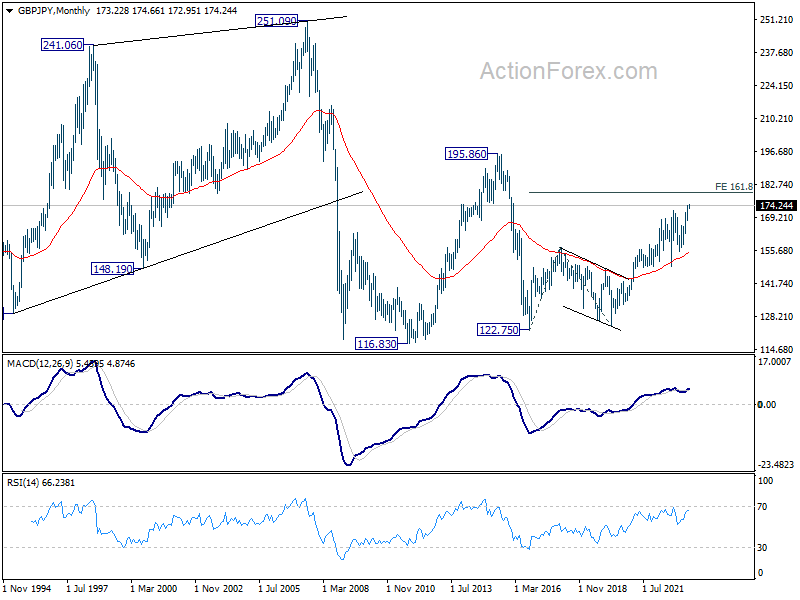
GBP/JPY's uptrend continued last week despite some jittery. Initial bias stays on the upside this week. Next target is 100% projection of 148.93 to 172.11 from 155.33 at 178.51. On the downside, break of 172.50 support will turn bias neutral and bring consolidations first, before staging another rally.
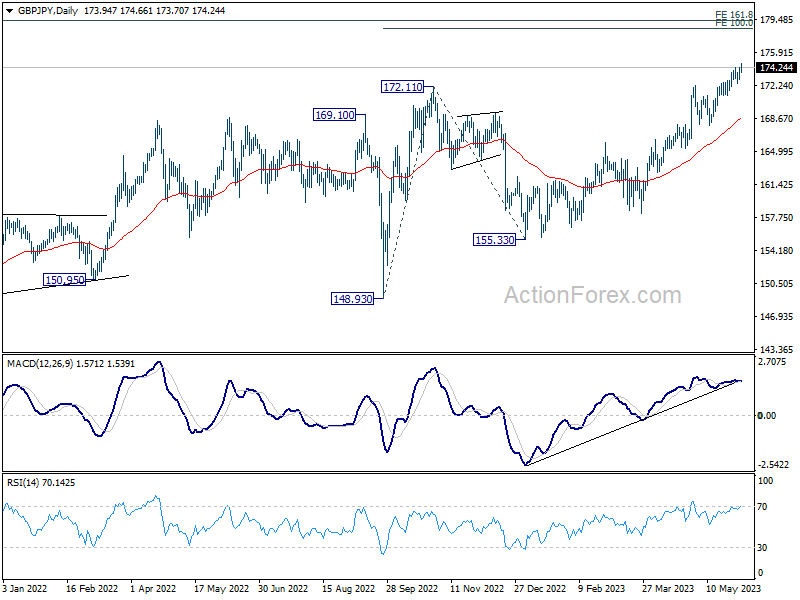
In the bigger picture, up trend from 123.94 (2020 low) is extending. Next target will be 161.8% projection of 122.75 (2016 low) to 156.59 (2018 high) from 123.94 at 178.69. For now, medium term outlook will remain bullish as long as 165.99 resistance turned support holds, even in case of deep pull back.
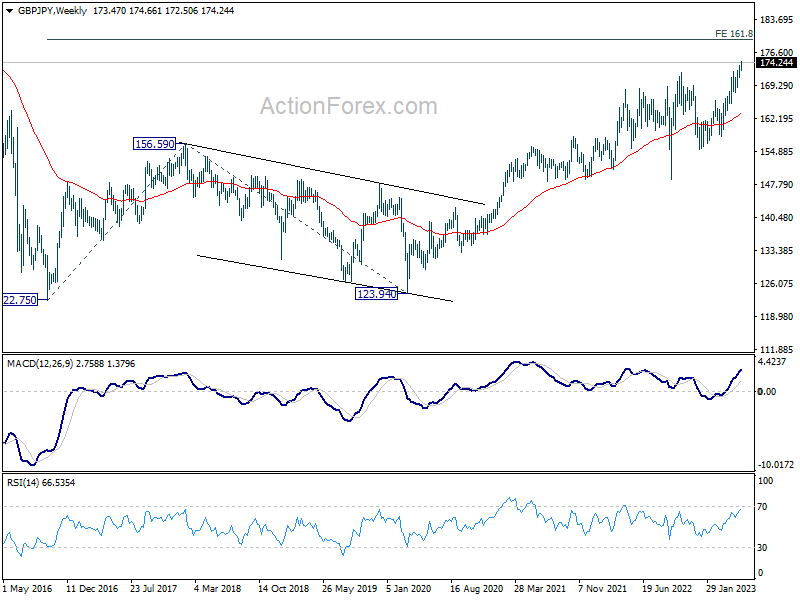
In the longer term picture, as long as 55 M EMA (now at 155.22) holds, rise from 122.75 (2016 low) could still extend higher to 195.86 (2015 high).
EUR/JPY Weekly Outlook
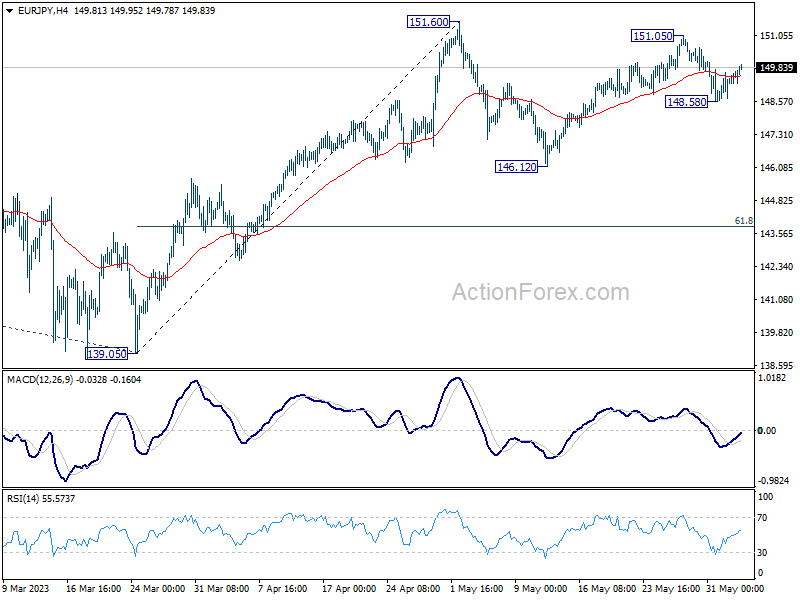
EUR/JPY failed to break through 151.60 resistance last week, and retreated. Initial bias remains neutral this week first. On the downside, below 148.58 temporary low will extend the corrective pattern from 151.60 with another falling leg. Deeper fall would be seen to 146.12 support and possibly below. On the upside, however, above 151.05 will target 151.60 high. Firm break there will resume larger up trend to 153.64 projection level.
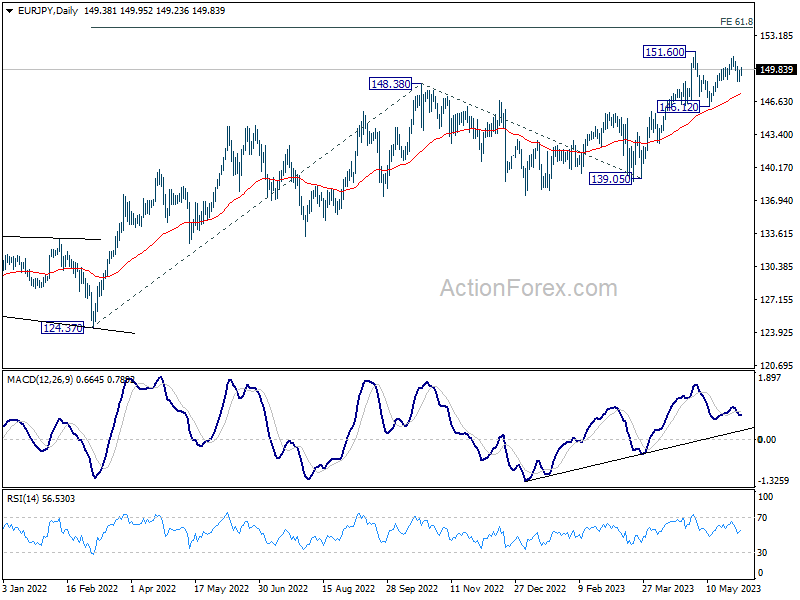
In the bigger picture, rise from 114.42 (2020 low) is in progress. Next target is 61.8% projection of 124.37 to 148.38 from 138.81 at 153.64. Sustained break there will pave the way to 100% projection at 162.82. For now, medium term outlook will remain bullish as long as 139.05 support holds, even in case of deep pull back.
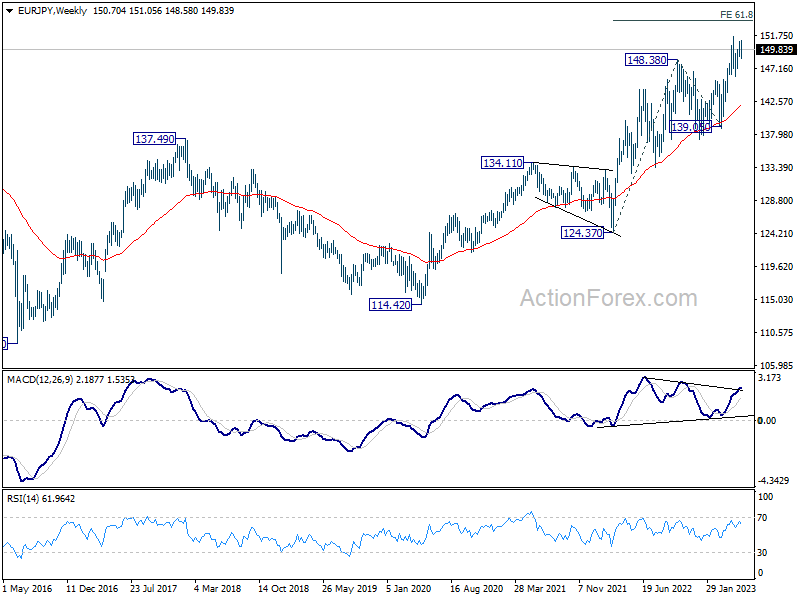
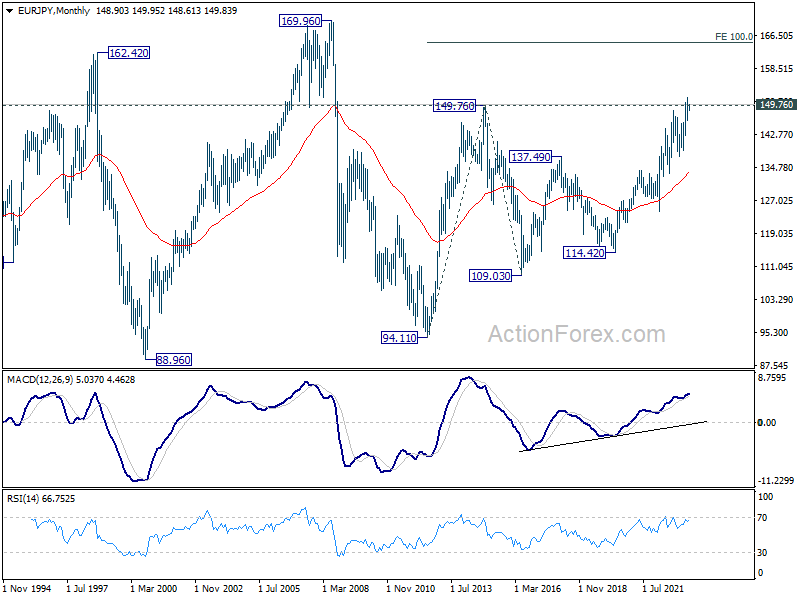
In the long term picture, break of 149.76 (2014 high) argues that whole up trend form 94.11 (2012 low) is resuming. Sustained trading above 149.76 will pave the way to 100% projection of 94.11 to 149.76 from 109.03 at 164.68, which is close to 169.96 (2008 high).
EUR/GBP Weekly Outlook
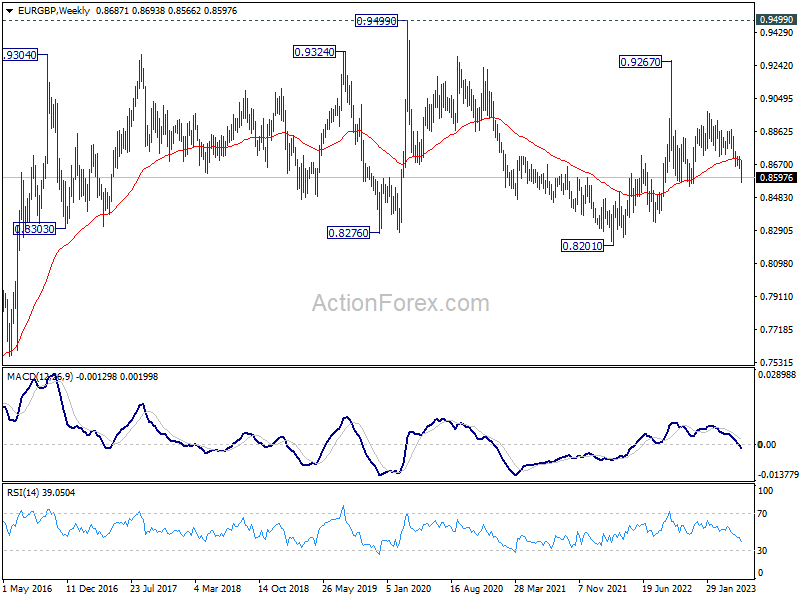
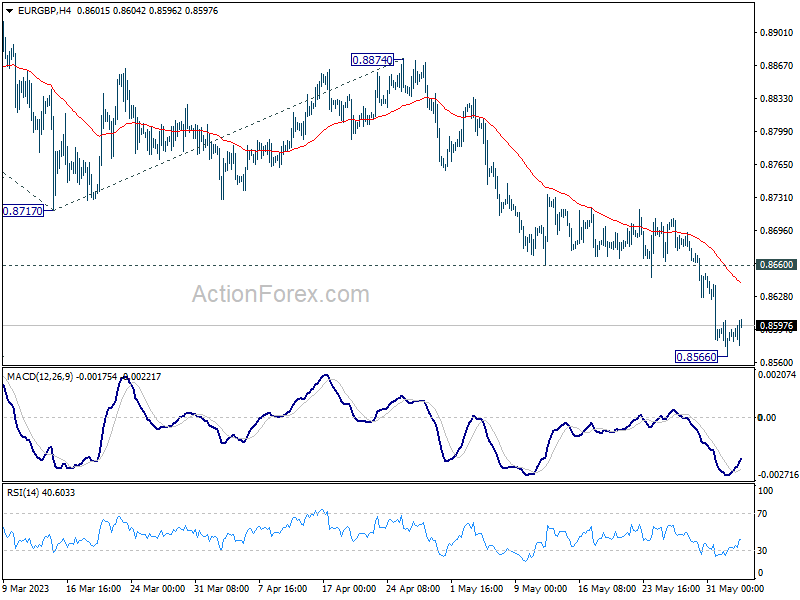
EUR/GBP's decline from 0.8977 continued last week and hit as low as 0.8566. As a temporary low was formed there, initial bias is neutral this week for some consolidations first. But recovery should be limited by 0.8660 support turned resistance and bring another fall. Break of 0.8566 will target 161.8% projection of 0.8977 to 0.8717 from 0.8874 at 0.8453.
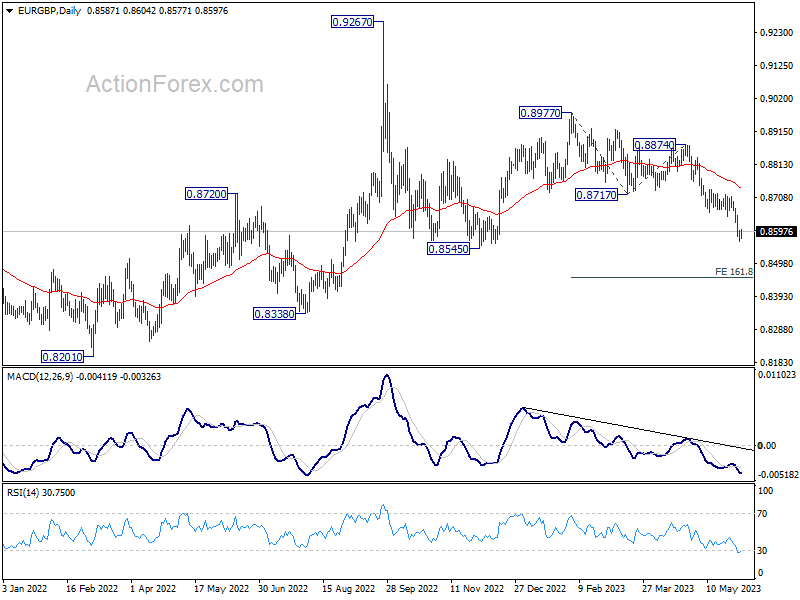
In the bigger picture, current development argues that whole decline from 0.9267 (2022 high) is still in progress. This is part of the long term range pattern from 0.9499 (2020 high). Deeper fall would be seen through 0.8545 support. This will now remain the favored case as long as 0.8717 support turned resistance holds.
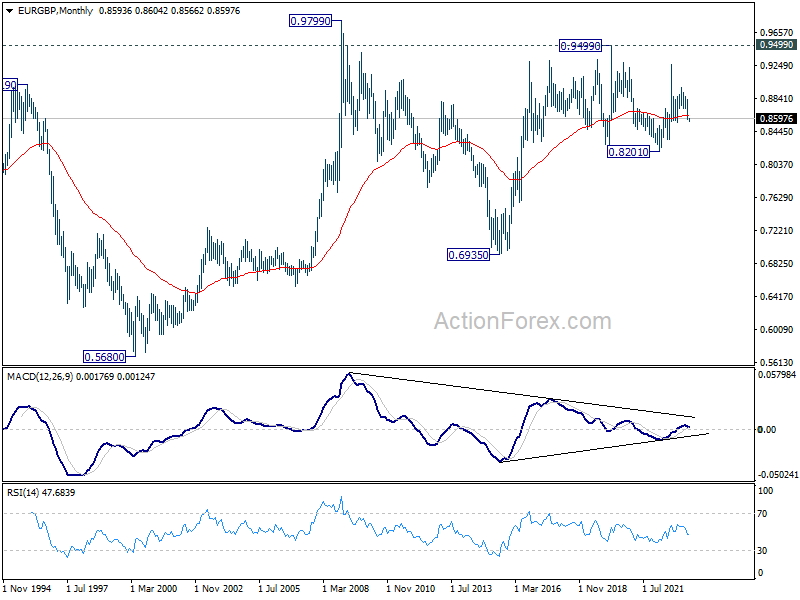
In the long term picture, long term range pattern is extending. But rise from 0.6935 (2015 low) is expected to extend at a later stage, to 0.9799 (2009 high).