
Sample Category Title
US: Retail Sales Take a Breather in December
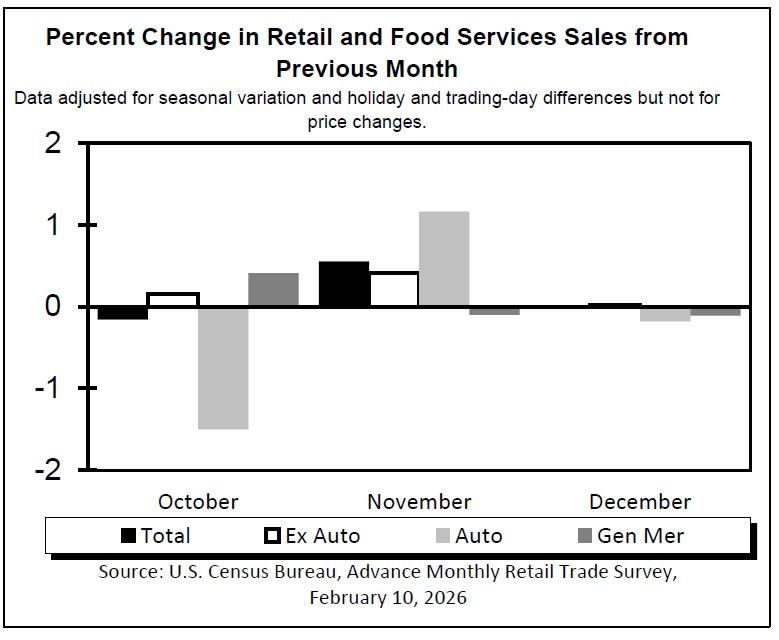
Retail sales remained flat in December, taking a break after a solid gain in November. The headline figure came in weaker than the consensus forecast, which called for sales to increase by 0.4% month-over-month (m/m).
Sales of autos and parts edged lower by 0.2% m/m, while sales at gasoline stations were slightly higher on the month (+0.3% m/m). Meanwhile, sales at building and garden retailers posted a solid gain (+1.2% m/m), advancing for the second consecutive month.
Sales in the "control group", which excludes the three above categories, edged lower (-0.1%). November's gain was also revised lower to 0.2% m/m (from 0.4% m/m). Sales declined at furniture & home furnishing stores (-0.9%) and miscellaneous store retailers (-0.9% m/m), but the pullback in the latter followed three months of strong gains. Ditto for clothing and accessory stores (-0.7% m/m). Sales where little changed elsewhere.
Following a solid gain in November, spending at bars and restaurants was soft in December (-0.1% m/m). This is the only service category in the report.
Key Implications
Retail sales ended the year on a softer footing. After rising for two consecutive months, core sales took a breather in December, while the negative revisions to the previous two months suggest that retail spending had a bit less bounce in its step than previously reported. Still, consumer spending remained resilient through the final quarter of 2025, which was marked by a lengthy government shutdown. According to our tracking, consumer spending likely increased by around 3.0% (annualized) in Q4 2025, only slightly lower than the 3.5% gain in the previous quarter.
As we wrote in our recent report, although consumers at different income levels are experiencing diverging economic outcomes, overall consumer spending is expected to remain robust through 2026. Households are expected to benefit from OBBBA-related fiscal support via higher tax refunds and lower income taxes. Tax refunds, expected between February and April are likely to average $800-$1,000 more than usual, helping to temporarily boost income and spending. Easier financial conditions, previous wealth gains, and some stabilization in the labor market will also help.
US: Small Business Optimism Broadly Unchanged in January, Holds Above Long-Term Average
The NFIB’s Small Business Optimism Index came in at 99.3 in January, only a touch below its December reading of 99.5. The uncertainty index rose by 7 points to 91 (back to its November 2025 level), with a rise in owners reporting uncertainty about 'whether it is a good time to expand' being the main driver.
Of the ten subcomponents in the index, seven deteriorated and three improved on the month. Most declines were modest, with the most noticeable a 3-point pullback in expectations about an improvement in the economy (to 21%). On the other hand, the net percent of owners expecting higher real sales over the next three months rose 6 points to 16% - the highest level in a year.
The employment indicators mostly trended lower, with plans to increase employment (-1 point to 16%), current job openings (-2 points to 31%), and quality of labor concerns (-3 points to 16%) all pulling back on the month. However, actual hiring appeared to have improved a touch, with the share of firms with an increase in employment over the last three months rising into shallow positive territory for the first time since April.
Inflation concerns held steady at 12% for the second month in a row – this as the share of firms raising average selling prices fell 4 points to 26%. However, the share of firms planning to raise prices over the coming months rose 4 points to 32%, one of the higher readings in the last three years. Moving above inflation concerns, were concerns about "the cost or availability of insurance" (up 4 points to 13% – the highest level since late 2018).
Key Implications
Small business optimism remained slightly above its long-term average at the start of this year but failed to make additional headway as uncertainty – especially related to business expansion efforts – picked up in January. Sifting through the details of the report, improving trends with respect to actual hiring and expectations about higher real sales offer some encouragement.
Subsiding 'quality of labor' concerns mark another positive aspect of the report. But small businesses continue to be challenged in other areas – something that is thought to be keeping a lid on business sentiment. To this end, inflation concerns, while steady, are still elevated. Additionally, rising concerns about the cost and availability of insurance highlights another emerging pain point.
EUR/USD Mid-Day Outlook
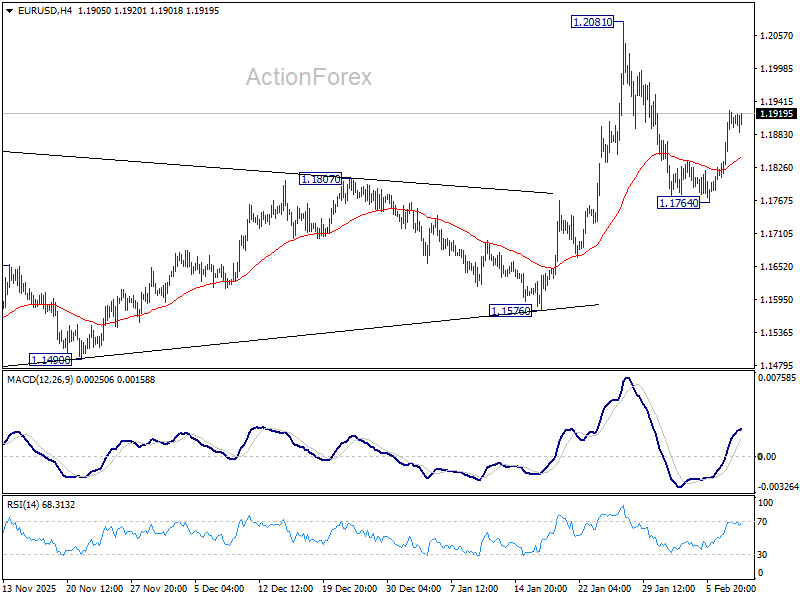
Daily Pivots: (S1) 1.1843; (P) 1.1885; (R1) 1.1960; More….
Outlook is unchanged in EUR/USD and intraday bias remains on the upside for retesting 1.2081 high. Decisive break there and sustained trading above 1.2 psychological level will carry larger bullish implications. On the downside, however, sustained trading below 55 D EMA (now at 1.1744) will raise the chance of reversal on rejection by 1.2 psychological level, and target 1.1576 support for confirmation.
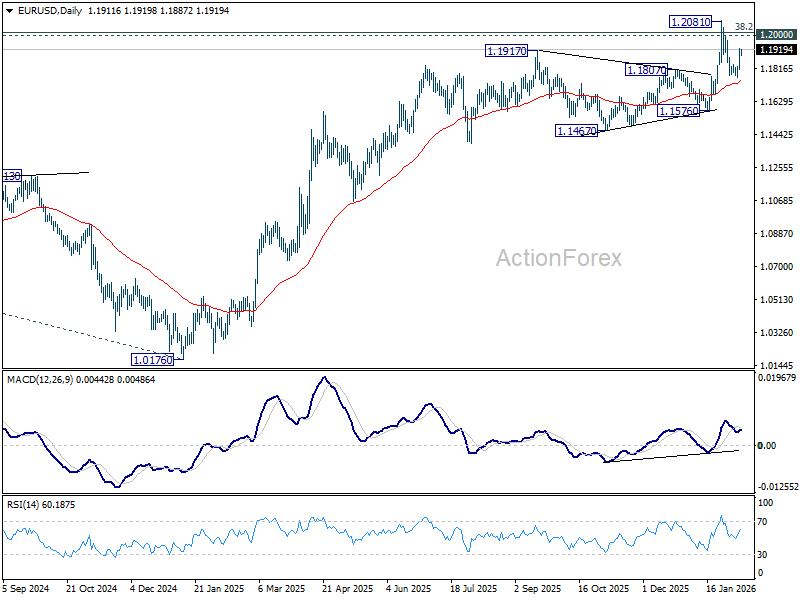
In the bigger picture, as long as 55 W EMA (now at 1.1470) holds, up trend from 0.9534 (2022 low) is still in favor to continue. Decisive break of 1.2 key psychological level will add to the case of long term bullish trend reversal. Next medium term target will be 138.2% projection of 0.9534 to 1.1274 from 1.0176 at 1.2581. However, sustained trading below 55 W EMA will argue that rise from 0.9534 has completed as a three wave corrective bounce, and keep long term outlook bearish.
GBP/USD Mid-Day Outlook
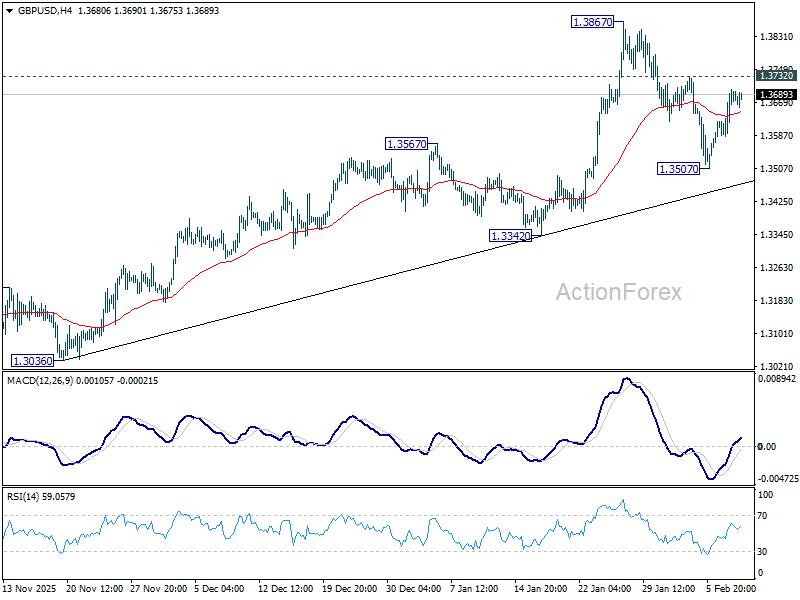
Daily Pivots: (S1) 1.3622; (P) 1.3661; (R1) 1.3736; More...
No change in GBP/USD's outlook and intraday bias remains neutral. On the upside, firm break of 1.3732 resistance will suggest that pullback from 1.3867 has completed as a correction at 1.3507. Retest of 1.3867 should be seen first. Firm break there will resume larger up trend towards 1.4284 key resistance. On the downside, however, sustained trading below 55 D EMA (now at 1.3492) will raise the chance of larger scale correction, and target 1.3342 support for confirmation.
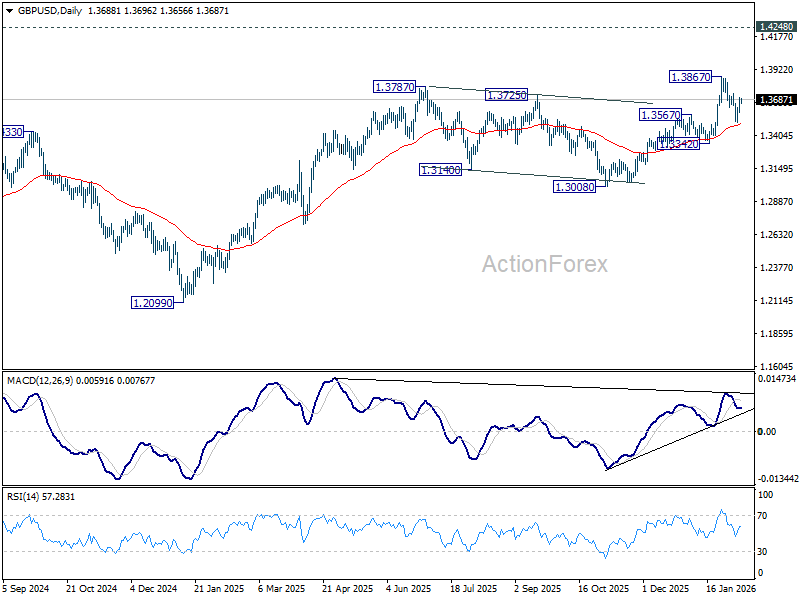
In the bigger picture, rise from 1.0351 (2022 low) is resuming by breaking through 1.3787 high. Further rally should be seen to 1.4284 key resistance (2021 high). Decisive break there will add to the case of long term bullish trend reversal. For now, outlook will stay bullish as long as 1.3008 support holds, even in case of deep pullback.
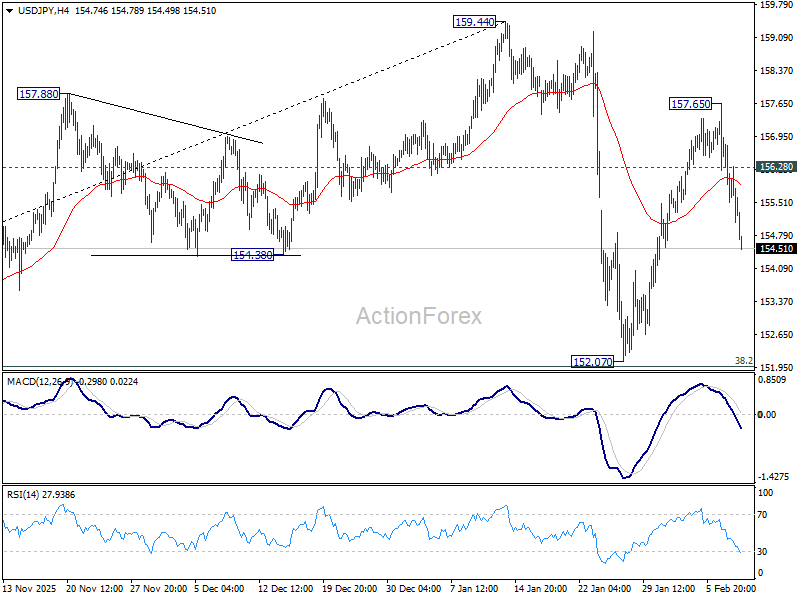
USD/JPY Mid-Day Outlook
Daily Pivots: (S1) 155.05; (P) 156.36; (R1) 157.19; More...
Intraday bias in USD/JPY remains on the downside for the moment, as fall fro 157.65 is extending to 152.07 support. Overall, price actions from 159.44 are seen as a correction to the rally from 139.87, rather than reversal. Downside should be contained by 38.2% retracement of 139.87 to 159.44 at 151.96 to bring rebound. On the upside, above 156.28 minor resistance will resume the rise from 152.07 through 157.65 instead.
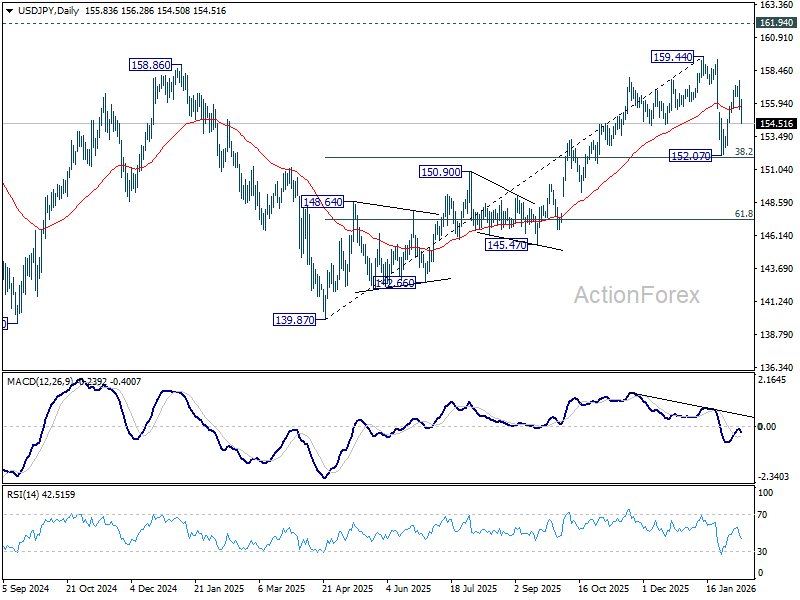
In the bigger picture, outlook is unchanged that corrective pattern from 161.94 (2024 high) should have completed with three waves at 139.87. Larger up trend from 102.58 (2021 low) could be ready to resume through 161.94. This will remain the favored case as long as 55 W EMA (now at 151.68) holds. However, sustained break of 55 W EMA will argue that the pattern from 161.94 is extending with another falling leg.
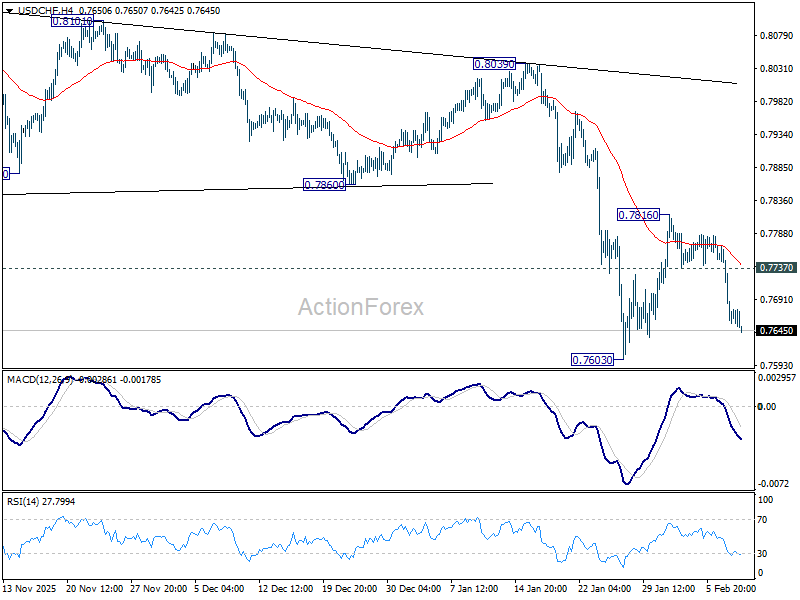
USD/CHF Mid-Day Outlook
Daily Pivots: (S1) 0.7623; (P) 0.7698; (R1) 0.7738; More….
USD/CHF's fall from 0.7816 is in progress and intraday bias stays on the downside for retesting 0.7603 low. Decisive break there will resume larger down trend to 0.7382 projection level next. On the upside, though, above 0.7737 minor resistance will delay the bearish case and extend the corrective pattern from 0.7603 with another leg.
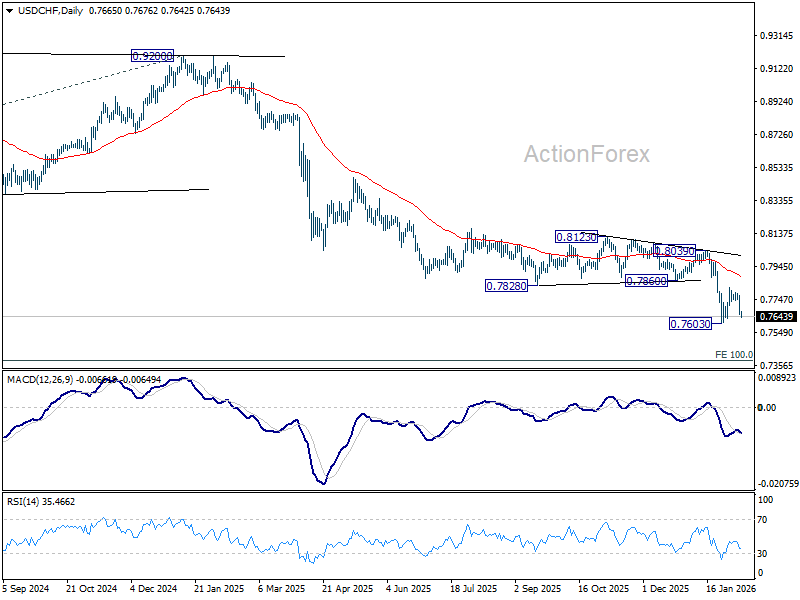
In the bigger picture, larger down trend from 1.0342 (2017 high) is still in progress. Next target is 100% projection of 1.0146 (2022 high) to 0.8332 from 0.9200 at 0.7382. In any case, outlook will stay bearish as long as 55 W EMA (now at 0.8152) holds.
Dollar Look Past Soft US Data, 10-Year Yield Dips
Dollar stayed heavy in early US trade, but muted price action suggested there was little reaction to the disappointing retail sales data. Elsewhere, conditions were also listless. US stock futures edged sideways and broader risk sentiment stayed calm.
While the retail sales miss was discouraging, traders appear content to hold positions steady. Attention remains firmly on tomorrow's delayed non-farm payrolls report, widely seen as the key determinant for near-term Fed easing expectations. Markets were likely viewing labor market signals as more policy-relevant than consumption prints at this stage of the cycle.
Nevertheless, one notable development beneath the surface is the decline in US Treasury yields this week. 10-year yield slipped back below 4.2%. That move has unfolded alongside reports that Chinese regulators have advised domestic financial institutions to curb holdings of US Treasuries. While eye-catching, the bond market reaction suggests little belief in an abrupt or disorderly shift.
Even so, a debate among economists is centered around longer-term structural outflows from US assets. Whether this represents a genuine regime shift remains an open question.
In Europe, French President Emmanuel Macron warned that Europe should brace for further confrontations with Washington, framing recent disputes as evidence of a more hostile US posture. Macron accused the Trump administration of pursuing policies aimed at weakening Europe, arguing that compromise had failed and that the EU should prepare for sustained friction rather than episodic disputes.
In currency markets, Dollar remains the week’s weakest major, followed by Sterling and Kiwi. Yen leads gains and looks to be gathering traction, with Swiss Franc and Loonie also firm. Euro and Aussie trade broadly in the middle of the pack.
In Europe, at the time of writing, FTSE is down -0.38%. DAX is down -0.12%. CAC is up 0.09%. UK 10-year yield is down -0.038 at 4.496. Germany 10-year yield is down -0.024 at 2.819. Earlier in Asia, Nikkei rose 2.28%. Hong Kong HSI rose 0.58%. China Shanghai SSE rose 0.13%. Singapore Strait Times rose 0.07%. Japan 10-year JGB yield fell -0.057 to 2.237.
US retail sales stall in December, consumption ends 2025 on softer note
US retail sales stalled in December, adding to signs that consumer momentum cooled into year-end. Headline sales were flat month-on-month at USD 735B, undershooting expectations for a 0.4% rise and marking a clear slowdown after earlier resilience.
The softness was broad-based. Retail sales excluding autos were also unchanged at USD 596B, missing forecasts for a 0.4% increase. Ex-gasoline sales were flat at USD 682B.
That said, the broader trend remains less alarming. Total retail sales for the October–December 2025 period were up 3.0% year-on-year, pointing to moderation rather than contraction.
ECB's de Guindos plays down CPI undershoot, shrugs off Euro strength
ECB Vice President Luis de Guindos downplayed concerns over January’s softer inflation print. In an interview with Econostream Media, he said that headline inflation dipping below 2% in early 2026 had been clearly signalled well in advance. He cautioned against overreacting to individual releases, arguing that markets tend to fixate on small deviations. However, "the overall trend is in line with what we had projected," he emphasized
Energy prices came in lower than expected, but de Guindos highlighted elevated volatility in that component. Services inflation continues to move in the “right direction.” Minor downside surprises in services, he said, are not policy-relevant.
On the currency side, de Guindos reiterated that the ECB does not target EUR/USD, but acknowledged its importance for an open economy. Euro’s pullback toward the long-standing 1.16–1.18 range was described as unsurprising and fully embedded in the ECB’s projections.
Even with recent euro gains largely reflecting US dollar weakness, de Guindos played down the implications. The move, he said, “deserves attention” but is far from "dramatic", signalling that exchange-rate developments are unlikely to disrupt the ECB’s wait-and-see stance unless they become materially more persistent or disorderly.
ECB research sees tariffs as disinflationary shock
ECB research published in a blog post argued that tariffs are more likely to drag on inflation than fuel it, as the hit to demand outweighs any inflationary impact from disrupted supply chains. ECB economists found that weaker export demand exerts a net disinflationary effect on the Eurozone economy.
According to the study, a tariff-related shock that reduces Eurozone exports to the US by 1% ultimately lowers the consumer price level by around 0.1%, with the effect peaking roughly one and a half years after the shock. The analysis comes as trade data already show material deterioration. In the latest three months for which figures are available, Eurozone exports to the U.S. were down around 6.5% compared with a year earlier.
For policy, the ECB noted that sectors hit hardest by tariffs — including machinery, autos and chemicals — are also among the most sensitive to interest rate changes. Output in these industries may fall sharply after trade shocks, but responds strongly to lower borrowing costs.
"We find that this pattern holds for about 60% of the sectors we study – representing roughly 50% of total average euro zone industrial output and of total goods exports to the United States," the economists said.
Australia Westpac consumer sentiment dips -2.6% mom after RBA hike, but impact contained
Australia’s Westpac Consumer Sentiment Index fell -2.6% mom to 90.5 in February, reflecting the immediate impact of the RBA’s first rate hike in more than two years. However, Westpac noted that the overall hit to confidence was "relatively mild" by historical standards. The February decline was smaller than the average fall typically seen after rate hikes, and sentiment remains well above the extreme lows recorded through much of 2022–2024.
Looking ahead, Westpac expects the RBA to remain cautious. While another hike at the March meeting cannot be ruled out, the more likely outcome is a pause as policymakers wait for additional data, particularly quarterly inflation updates.
With the RBA placing greater weight on trimmed-mean inflation and the next quarterly CPI report due in late April, Westpac continues to see May as the more probable window for a follow-up 25bp rate hike if inflation remains uncomfortably high.
Australia NAB business confidence rises to 3, costs ease as activity momentum holds
Australia’s NAB Business Conditions index slipped modestly from 9 to 7 in January, while Business Confidence edged up from 2 to 3. For the RBA, the report showed a clear easing in inflation pressures. Measures of labor and input costs both softened during the month, while quarterly growth in retail prices slowed sharply to 0.3%, down from 0.5% in December.
NAB economist Michael Hayes noted that cost and price indicators have now fallen to "new post-pandemic lows", reinforcing the view that underlying inflation dynamics are continuing to cool.
At the same time, the survey indicates that the broader economy has not lost much traction. Hayes highlighted that activity has "retained most of its momentum gained through the past year" , even as capacity utilization eased slightly.
USD/CHF Mid-Day Outlook
Daily Pivots: (S1) 0.7623; (P) 0.7698; (R1) 0.7738; More….
USD/CHF's fall from 0.7816 is in progress and intraday bias stays on the downside for retesting 0.7603 low. Decisive break there will resume larger down trend to 0.7382 projection level next. On the upside, though, above 0.7737 minor resistance will delay the bearish case and extend the corrective pattern from 0.7603 with another leg.
In the bigger picture, larger down trend from 1.0342 (2017 high) is still in progress. Next target is 100% projection of 1.0146 (2022 high) to 0.8332 from 0.9200 at 0.7382. In any case, outlook will stay bearish as long as 55 W EMA (now at 0.8152) holds.
US retail sales stall in December, consumption ends 2025 on softer note
US retail sales stalled in December, adding to signs that consumer momentum cooled into year-end. Headline sales were flat month-on-month at USD 735B, undershooting expectations for a 0.4% rise and marking a clear slowdown after earlier resilience.
The softness was broad-based. Retail sales excluding autos were also unchanged at USD 596B, missing forecasts for a 0.4% increase. Ex-gasoline sales were flat at USD 682B.
That said, the broader trend remains less alarming. Total retail sales for the October–December 2025 period were up 3.0% year-on-year, pointing to moderation rather than contraction.
ECB research sees tariffs as disinflationary shock
ECB research published in a blog post argued that tariffs are more likely to drag on inflation than fuel it, as the hit to demand outweighs any inflationary impact from disrupted supply chains. ECB economists found that weaker export demand exerts a net disinflationary effect on the Eurozone economy.
According to the study, a tariff-related shock that reduces Eurozone exports to the US by 1% ultimately lowers the consumer price level by around 0.1%, with the effect peaking roughly one and a half years after the shock. The analysis comes as trade data already show material deterioration. In the latest three months for which figures are available, Eurozone exports to the U.S. were down around 6.5% compared with a year earlier.
For policy, the ECB noted that sectors hit hardest by tariffs — including machinery, autos and chemicals — are also among the most sensitive to interest rate changes. Output in these industries may fall sharply after trade shocks, but responds strongly to lower borrowing costs.
"We find that this pattern holds for about 60% of the sectors we study – representing roughly 50% of total average euro zone industrial output and of total goods exports to the United States," the economists said.
ECB’s de Guindos plays down CPI undershoot, shrugs off Euro strength
ECB Vice President Luis de Guindos downplayed concerns over January’s softer inflation print. In an interview with Econostream Media, he said that headline inflation dipping below 2% in early 2026 had been clearly signalled well in advance. He cautioned against overreacting to individual releases, arguing that markets tend to fixate on small deviations. However, "the overall trend is in line with what we had projected," he emphasized
Energy prices came in lower than expected, but de Guindos highlighted elevated volatility in that component. Services inflation continues to move in the “right direction.” Minor downside surprises in services, he said, are not policy-relevant.
On the currency side, de Guindos reiterated that the ECB does not target EUR/USD, but acknowledged its importance for an open economy. Euro’s pullback toward the long-standing 1.16–1.18 range was described as unsurprising and fully embedded in the ECB’s projections.
Even with recent euro gains largely reflecting US dollar weakness, de Guindos played down the implications. The move, he said, “deserves attention” but is far from "dramatic", signalling that exchange-rate developments are unlikely to disrupt the ECB’s wait-and-see stance unless they become materially more persistent or disorderly.