
Sample Category Title
EUR/CHF Daily Outlook
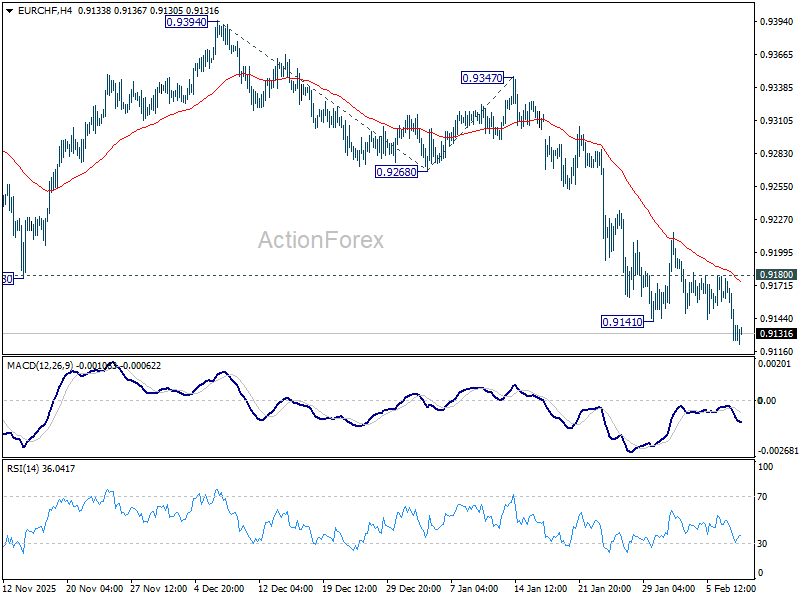
Daily Pivots: (S1) 0.9111; (P) 0.9146; (R1) 0.9164; More....
EUR/CHF's down trend resumed by breaking through 0.9141 support and intraday bias is back on the downside. Next target is 261.8% projection of 0.9394 to 0.9268 from 0.9347 at 0.9017. On the upside, however, break of 0.9180 resistance will now indicate short term bottoming, and bring lengthier consolidations.
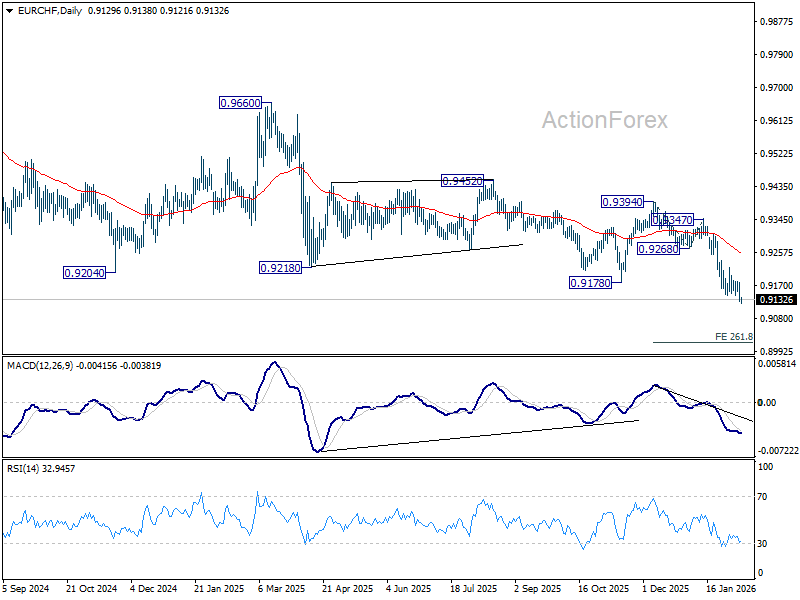
In the bigger picture, down trend from 0.9928 (2024 high) is still in progress with falling 55 W EMA (now at 0.9334) intact. Next target is 61.8% projection of 1.1149 to 0.9407 from 0.9928 at 0.8851. Outlook will stay bearish as long as 0.9394 resistance holds, in case of recovery.
USD/CAD Daily Outlook
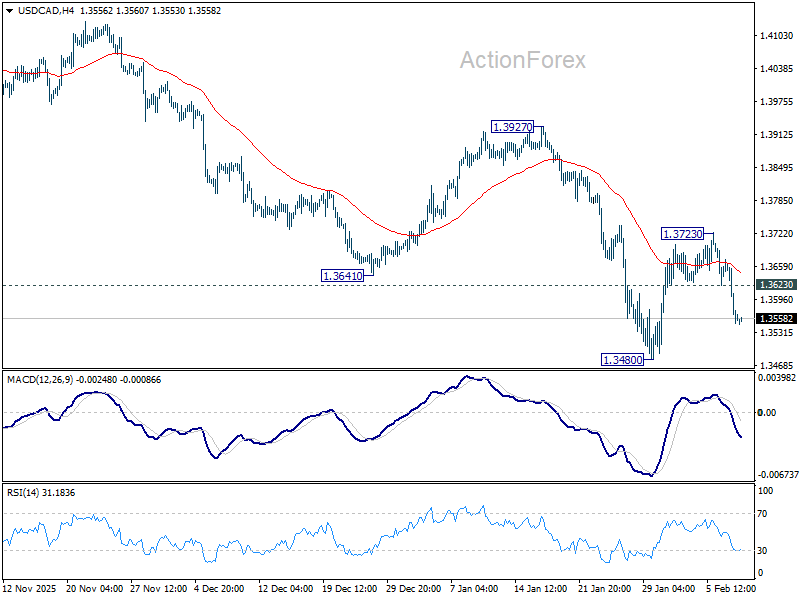
Daily Pivots: (S1) 1.3624; (P) 1.3675; (R1) 1.3725; More...
Intraday bias in USD/CAD remains on the downside for retesting 1.3480 low. Firm break there resume larger down trend from 1.4791 to 61.8% projection of 1.4791 to 1.3538 from 1.4139 at 1.3365. On the upside, above 1.3623 minor resistance will delay the bearish case, and extend the corrective pattern from 1.3480 with another leg.
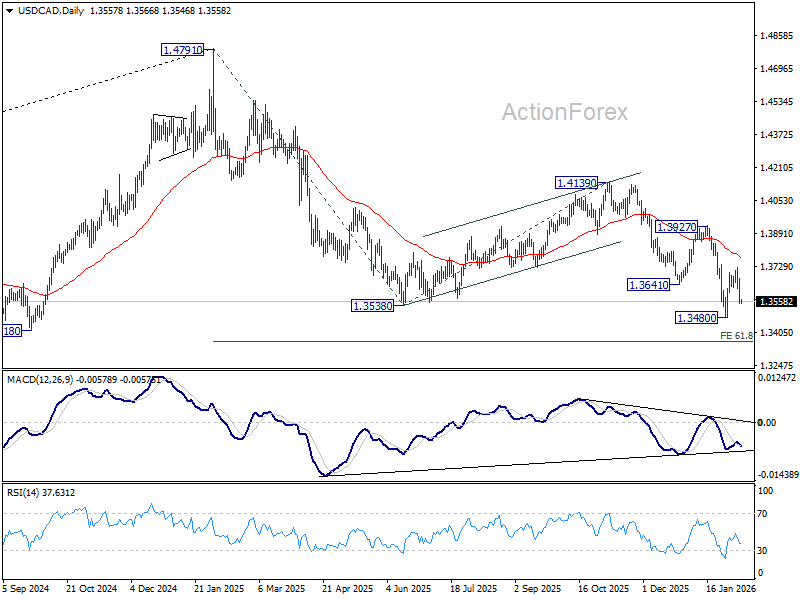
In the bigger picture, price actions from 1.4791 are seen as a corrective pattern to the whole up trend from 1.2005 (2021 low). Deeper fall could be seen as the pattern extends, to 61.8% retracement of 1.2005 to 1.4791 at 1.3069. For now, medium term outlook will be neutral at best, until there are signs that the correction has completed, or that a bearish trend reversal is confirmed.
AUD/USD Daily Report
Daily Pivots: (S1) 0.7036; (P) 0.7067; (R1) 0.7126; More...
Intraday bias in AUD/USD remains neutral with focus on 0.7093 resistance. Decisive break there will resume larger up trend. Next target is 100% projection of 0.5913 to 0.6706 from 0.6420 at 0.7213. In case of another fall as the consolidation extends, downside should be contained by 38.2% retracement of 0.6420 to 0.7093 at 0.6836.
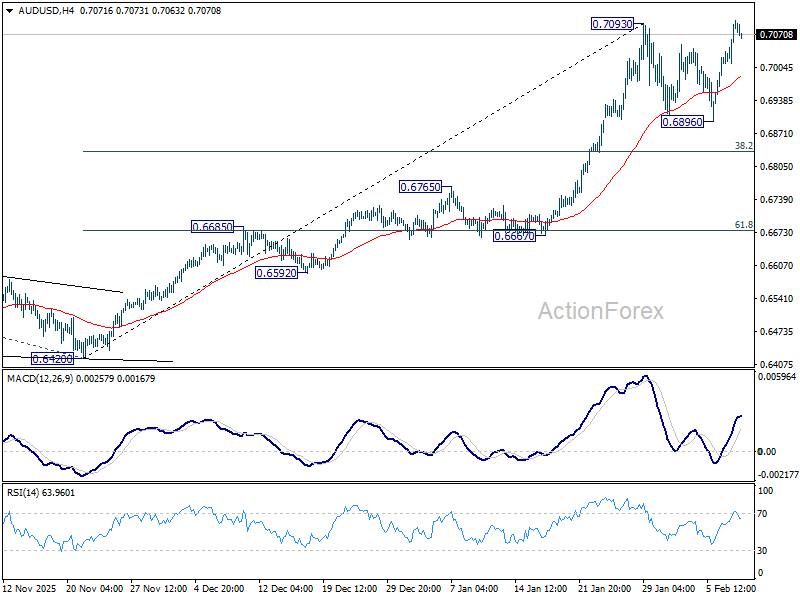
In the bigger picture, current development argues that rise from 0.5913 (2024 low) is reversing whole down trend from 0.8006 (2021 high). Further rally should be seen to 61.8% retracement of 0.8006 to 0.5913 at 0.7206. This will remain the favored case as long as 0.6706 resistance turned support holds, even in case of deep pullback.

EUR/USD Daily Outlook
Daily Pivots: (S1) 1.1843; (P) 1.1885; (R1) 1.1960; More….
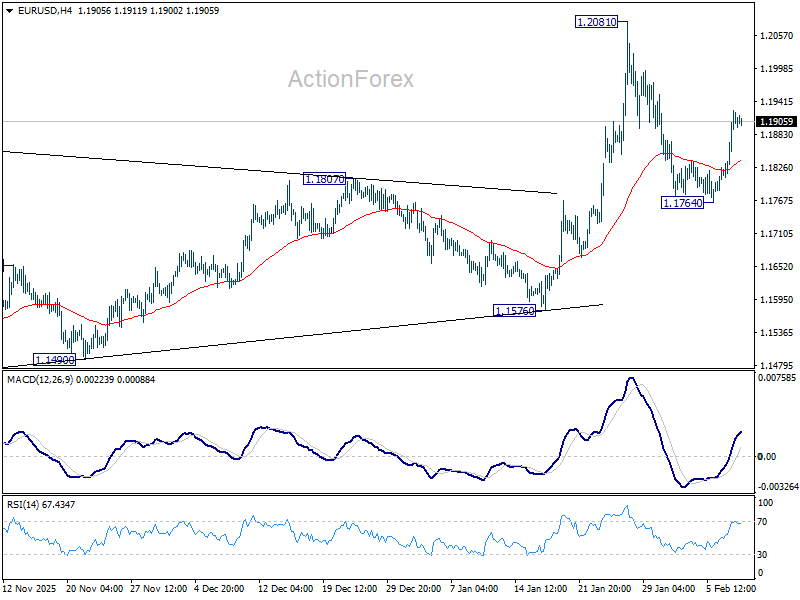
Intraday bias in EUR/USD remains on the upside for retesting 1.2081 high. Decisive break there and sustained trading above 1.2 psychological level will carry larger bullish implications. On the downside, however, sustained trading below 55 D EMA (now at 1.1744) will raise the chance of reversal on rejection by 1.2 psychological level, and target 1.1576 support for confirmation.
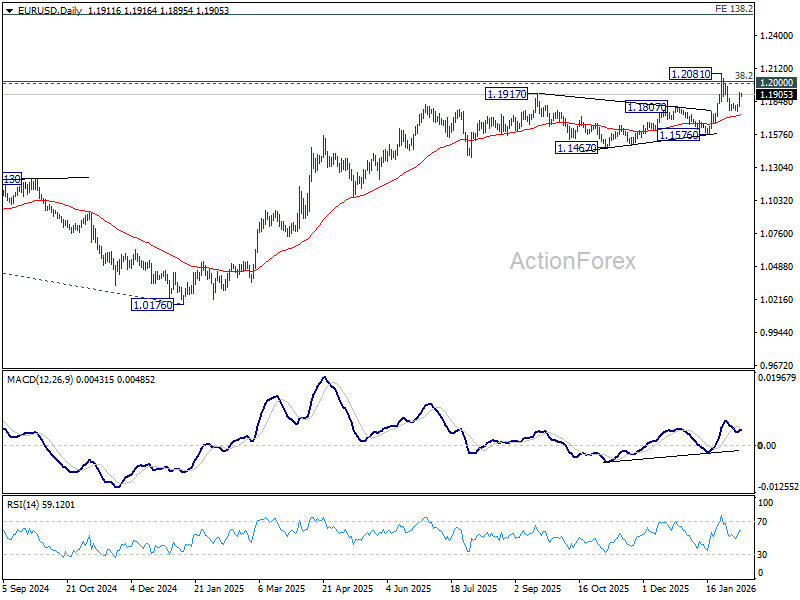
In the bigger picture, as long as 55 W EMA (now at 1.1470) holds, up trend from 0.9534 (2022 low) is still in favor to continue. Decisive break of 1.2 key psychological level will add to the case of long term bullish trend reversal. Next medium term target will be 138.2% projection of 0.9534 to 1.1274 from 1.0176 at 1.2581. However, sustained trading below 55 W EMA will argue that rise from 0.9534 has completed as a three wave corrective bounce, and keep long term outlook bearish.
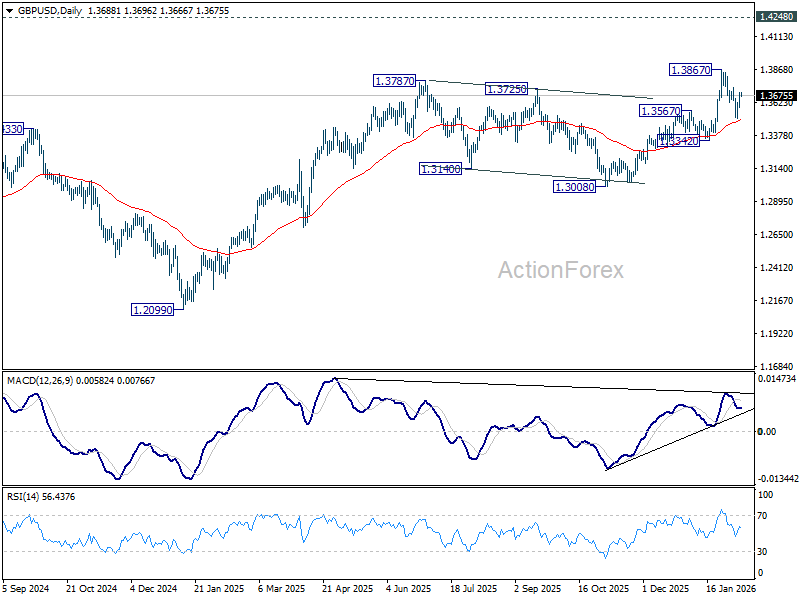
GBP/USD Daily Outlook
Daily Pivots: (S1) 1.3622; (P) 1.3661; (R1) 1.3736; More...
Intraday bias in GBP/USD remains neutral at this point. On the upside, firm break of 1.3732 resistance will suggest that pullback from 1.3867 has completed as a correction at 1.3507. Retest of 1.3867 should be seen first. Firm break there will resume larger up trend towards 1.4284 key resistance. On the downside, however, sustained trading below 55 D EMA (now at 1.3492) will raise the chance of larger scale correction, and target 1.3342 support for confirmation.
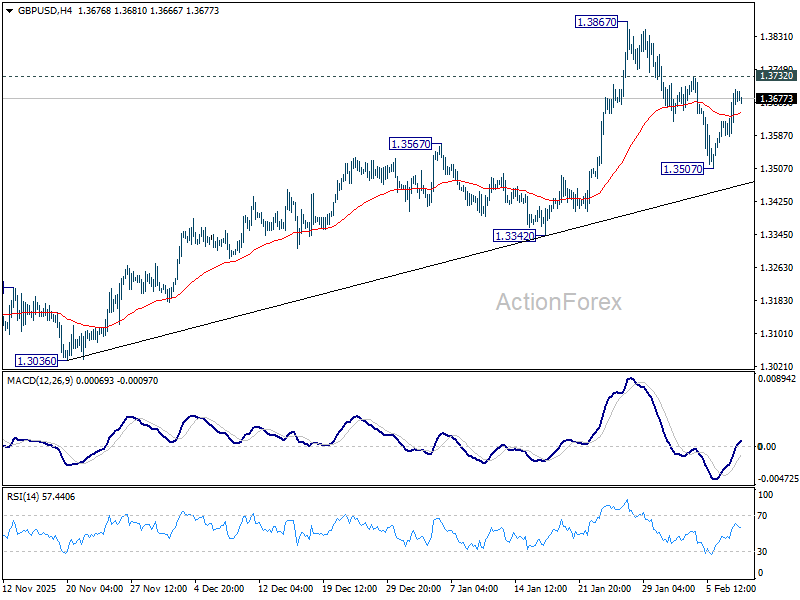
In the bigger picture, rise from 1.0351 (2022 low) is resuming by breaking through 1.3787 high. Further rally should be seen to 1.4284 key resistance (2021 high). Decisive break there will add to the case of long term bullish trend reversal. For now, outlook will stay bullish as long as 1.3008 support holds, even in case of deep pullback.
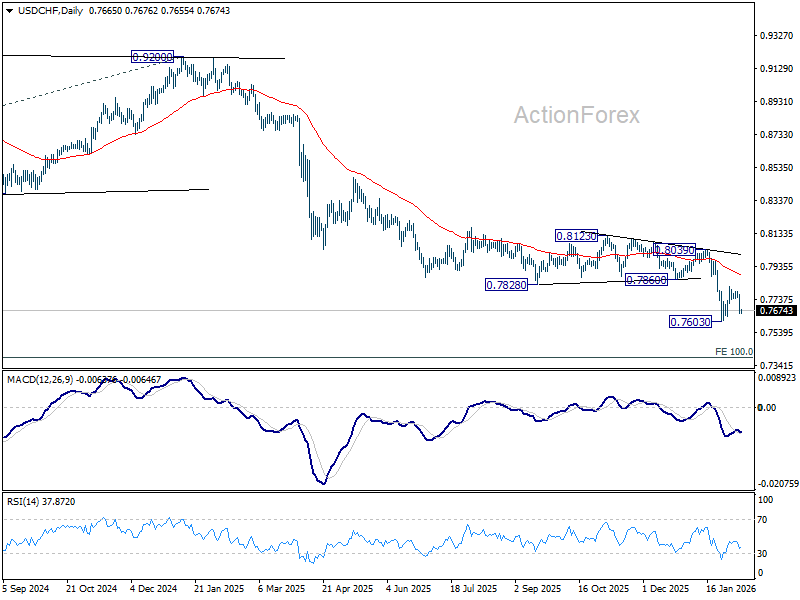
USD/CHF Daily Outlook
Daily Pivots: (S1) 0.7623; (P) 0.7698; (R1) 0.7738; More….
Intraday bias in USD/CHF remains on the downside for retesting 0.7603 low. Decisive break there will resume larger down trend to 0.7382 projection level next. On the upside, though, above 0.7737 minor resistance will delay the bearish case and extend the corrective pattern from 0.7603 with another leg.
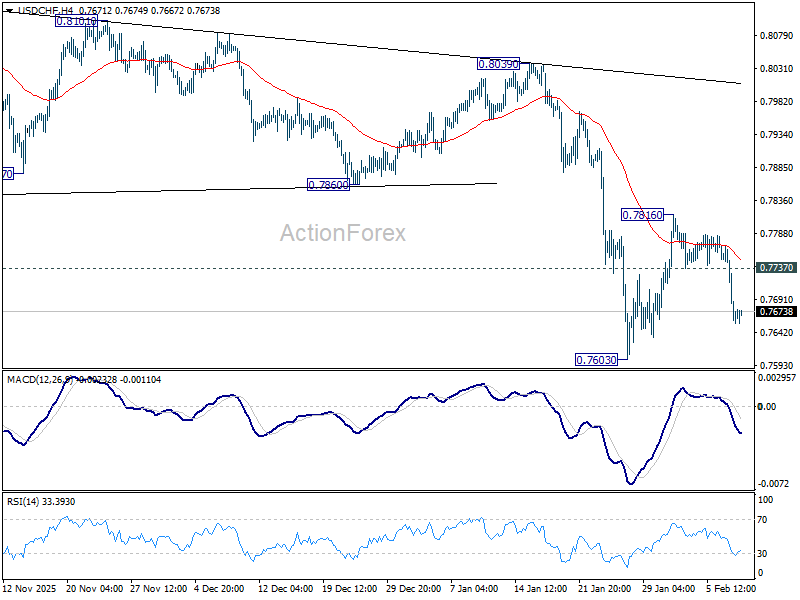
In the bigger picture, larger down trend from 1.0342 (2017 high) is still in progress. Next target is 100% projection of 1.0146 (2022 high) to 0.8332 from 0.9200 at 0.7382. In any case, outlook will stay bearish as long as 55 W EMA (now at 0.8152) holds.
US Employment Cost Data in Focus
In focus today
From the US, NFIB's January small business optimism index, December retail sales and Q4 employment cost index are all due for release today. From the Fed's perspective, the latter carries the most weight; leading data has signalled cooling wage growth towards the end of 2025. Retail sales data provides further insight into the strength of the US consumer. And finally, the NFIB has so far signalled improving confidence in stronger business conditions after last year's elevated uncertainty.
In Denmark, January inflation data is due today, a month that typically brings extra uncertainty due to annual price adjustments, clothing sales and higher food prices following December discounts. With the electricity fee almost eliminated, we expect inflation to drop to 1.0% y/y (Dec: 1.9%), despite a rise in spot electricity prices. However, these factors add further uncertainty to the estimate.
In Norway, we expect that core inflation in January was somewhat lower than last year, driven by lower price growth in domestic-produced goods and food. We expect a figure of 2.9% y/y in line with Norges Bank's estimate from the December MPR, but uncertainty is greater than usual in January. This is partly due to the change in consumption weights, but primarily because many administrative prices change in January.
China releases CPI and PPI for January overnight. CPI inflation is set to decline from 0.8% y/y to 0.3 % y/y as Chinese New Year is in February this year instead of January as it was in 2025. Prices typically get a lift around the New Year so the base from last year is quite high pushing the annual inflation rate lower. PPI inflation is set to increase from -1.9% y/y to -1.6% y/y as higher commodity prices will likely feed through to PPI.
Economic and market news
What happened yesterday
In Norway, mainland GDP rose by 0.4% q/q in Q4 (cons: 0.4%, DB: 0.3%), reflecting continued moderate growth since early 2025. Private investments, residential investments and public demand contributed positively, while net exports weighed on growth due to imported cars. Hours worked remained flat, indicating higher productivity drove the rebound. The figure is slightly below Norges Bank's December estimate of 0.5%, but unlikely to change signals of a possible rate cut in June.
In the UK, Prime Minister Keir Starmer is under pressure to resign after two aides stepped down amidst controversy over Peter Mandelson's appointment as ambassador to Washington. Scottish Labour leader Anas Sarwar called for Starmer's resignation, but the Prime Minister has vowed to stay, citing support from key ministers and his mandate from voters.
In the US, the Trump administration proposed limiting fired federal employees' ability to appeal their dismissals to the independent Merit Systems Protection Board. Instead, appeals would go to the Office of Personnel Management, which reports directly to President Trump. The move aligns with Trump's broader efforts to reduce the size of the federal government.
In France, François Villeroy, president of the Bank of France and influential ECB governing council member, will step down in June, over a year before his term was set to end in November 2027. Known as one of the most vocal doves, his departure could marginally shift the council's balance towards the hawkish side, though the consensus to hold policy rates steady remains firm. French President Macron will appoint his successor.
In the euro area, the February Sentix Investor Confidence rose to 4.2 (cons: 0, prior: -1.8), signalling a stronger-than-expected improvement in investor sentiment with the highest reading since July 2025.
In pharma, Novo Nordisk sued Hims and Hers Health after the firm launched, then withdrew, a $49 semaglutide-based weight-loss pill following FDA backlash. The lawsuit highlights growing tensions between obesity drugmakers and compounding pharmacies, with the FDA's response signalling a broader crackdown on compounded GLP-1 drugs. Novo's shares rose 6%, while Hims fell 25% on the news
Equities: Global equities started the week on a firm footing, led by Japan and the broader Asian complex. Despite being less than six weeks into the year, the South Korean equity market is now up close to 30% YTD. Yesterday's equity tape was otherwise characterised by a classic risk-on with outperformance in cyclicals and small caps, while defensives such as consumer staples, healthcare and min vol lagged. This is broadly the set of dynamics one would expect in a market environment where geopolitical noise and disruption risk fade into the background and investor focus rotates back towards fundamentals. Consistent with this narrative, several major equity indices printed new all-time highs yesterday. In the US yesterday, Dow +0.04%, S&P 500 +0.5%, Nasdaq +0.9% and Russell 2000 +0.7%. This morning, Japan once again stands out on the upside on renewed expectations of fiscal stimulus, pulling most of Asia higher, while European and US equity futures are more mixed.
FI and FX: EUR/USD drifted toward the 1.19 mark as the broad USD softened at the start of the week. USD/JPY slipped back below 156 as the yen strengthened broadly, driven by general USD softness and lingering intervention concerns after the brief post-election bout of JPY weakness. In the US, yields edged slightly lower, with both the 2-year and 10-year Treasury yields declining by 2bp. In the euro area, Bund yields saw a modest decline at the front end, with the 2-year down 1.5bp, while the 10-year remained unchanged. EUR/GBP was in for a reverse v shaped price action during yesterday's session as UK politics came back into focus. The oil price continues to trade close to USD70/bbl mark - a relatively high level compared to the development in recent months. Yesterday, saw EUR/SEK edge slightly lower on the back of a weaker dollar and benign risk sentiment. In Norway, focus turns to the monthly CPI release this morning.
USD/JPY Daily Outlook
Daily Pivots: (S1) 155.05; (P) 156.36; (R1) 157.19; More...
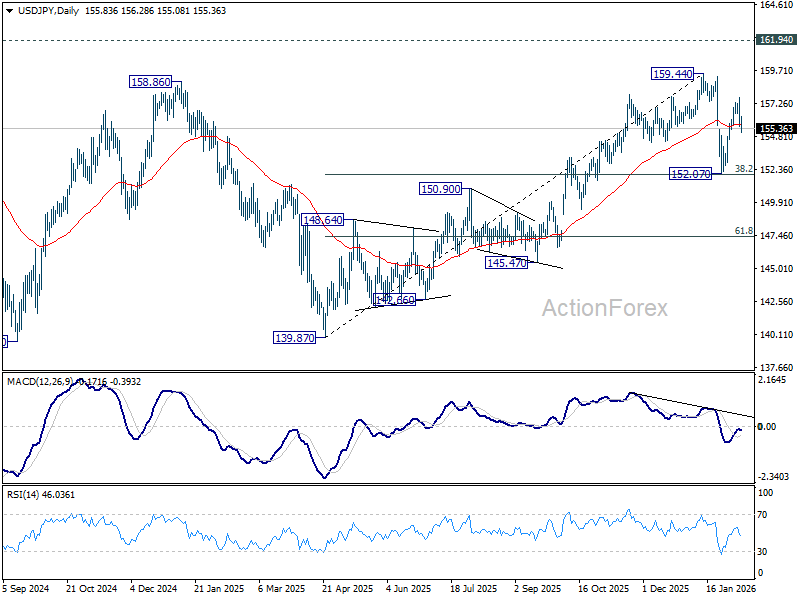
USD/JPY's break of 155.51 minor support suggests that rebound from 152.07 has already completed at 157.65. Intraday bias is back on the downside for 152.07. Overall, price actions from 159.44 are seen as a correction to the rally from 139.87, rather than reversal. Downside should be contained by 38.2% retracement of 139.87 to 159.44 at 151.96 to bring rebound.
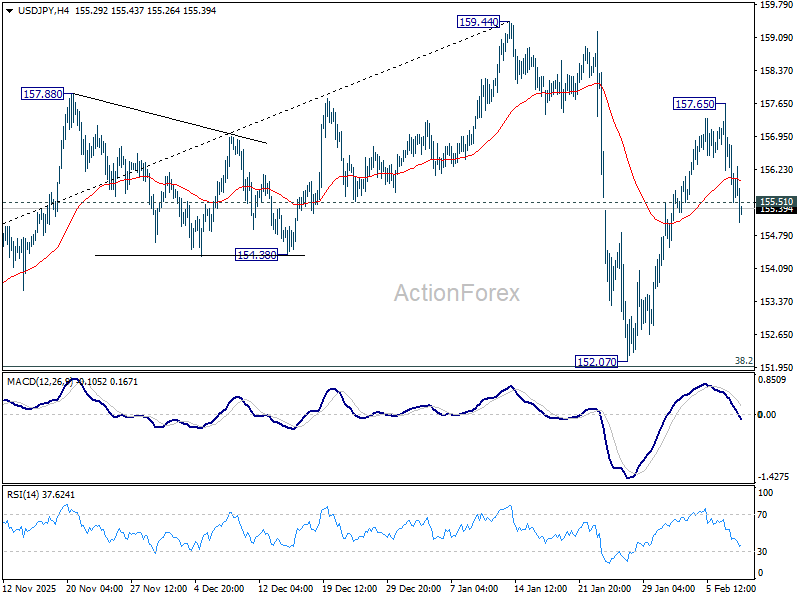
In the bigger picture, outlook is unchanged that corrective pattern from 161.94 (2024 high) should have completed with three waves at 139.87. Larger up trend from 102.58 (2021 low) could be ready to resume through 161.94. This will remain the favored case as long as 55 W EMA (now at 151.68) holds. However, sustained break of 55 W EMA will argue that the pattern from 161.94 is extending with another falling leg.
Yen Finds Room to Recover, As Optimism Continues to Lift Nikkei
Japan remained the focal point of the Asian session as the Nikkei surged to yet another record high, extending gains fueled by post-election political optimism. What stood out, however, was that Yen extended its recovery alongside rising equities, a notable shift from its usual role as a pure risk proxy. The currency’s resilience suggests a temporary decoupling from risk sentiment, with positioning and policy expectations playing a larger role.
Intervention risk remains a key anchor. Japanese officials have maintained a steady stream of verbal warnings, keeping traders cautious about aggressively selling the yen. That deterrent effect has limited speculative momentum, even as global equity markets push higher.
Beyond intervention, there are additional forces at play. Some investors are now reassessing the fiscal outlook, arguing that a supermajority could allow Takaichi’s government to act more decisively and, paradoxically, with greater discipline by removing the need for compromise spending. Those perceptions were reinforced after Finance Minister Satsuki Katayama suggested that surplus reserves could be used to help fund proposed food sales-tax cuts. Some economists interpreted that as a signal that the government remains mindful of funding sources, rather than relying solely on deficit expansion.
That said, the bigger picture for Yen remains unchanged. Over time, fiscal policy is still expected to loosen under a more assertive Takaichi administration, implying renewed downward pressure on the currency at a later stage. For now, though, sellers lack conviction, allowing Yen to enjoy a corrective recovery phase.
Elsewhere, Dollar stayed broadly soft as markets held back ahead of a heavy US data calendar. December retail sales today are seen as a warm-up, with January non-farm payrolls as the main event, followed by January CPI later in the week. Barring repeated large downside surprises, the base case remains that the Fed stays on hold until June, after Kevin Warsh takes over as Fed Chair in mid-May.
For the week so far, Yen leads gains, followed by Swiss Franc, while Dollar and Kiwi lag. Euro and Aussie trade mid-pack.
In Asia, Nikkei rose 2.28%. Hong Kong HSI is up 0.44%. China Shanghai SSE is up 0.14%. Singapore Strait Times is down -0.07%. Japan 10-year JGB yield fell -0.052 to 2.242. Overnight, DOW rose 0.04%. S&P 500 rose 0.47%. NASDAQ rose 0.90%. 10-year yield fell -0.008 to 4.198.
Australia Westpac consumer sentiment dips -2.6% mom after RBA hike, but impact contained
Australia’s Westpac Consumer Sentiment Index fell -2.6% mom to 90.5 in February, reflecting the immediate impact of the RBA’s first rate hike in more than two years. However, Westpac noted that the overall hit to confidence was "relatively mild" by historical standards. The February decline was smaller than the average fall typically seen after rate hikes, and sentiment remains well above the extreme lows recorded through much of 2022–2024.
Looking ahead, Westpac expects the RBA to remain cautious. While another hike at the March meeting cannot be ruled out, the more likely outcome is a pause as policymakers wait for additional data, particularly quarterly inflation updates.
With the RBA placing greater weight on trimmed-mean inflation and the next quarterly CPI report due in late April, Westpac continues to see May as the more probable window for a follow-up 25bp rate hike if inflation remains uncomfortably high.
Australia NAB business confidence rises to 3, costs ease as activity momentum holds
Australia’s NAB Business Conditions index slipped modestly from 9 to 7 in January, while Business Confidence edged up from 2 to 3. For the RBA, the report showed a clear easing in inflation pressures. Measures of labor and input costs both softened during the month, while quarterly growth in retail prices slowed sharply to 0.3%, down from 0.5% in December.
NAB economist Michael Hayes noted that cost and price indicators have now fallen to "new post-pandemic lows", reinforcing the view that underlying inflation dynamics are continuing to cool.
At the same time, the survey indicates that the broader economy has not lost much traction. Hayes highlighted that activity has "retained most of its momentum gained through the past year" , even as capacity utilization eased slightly.
Lagarde, Nagel reinforce ECB pause as medium-term inflation anchors hold
ECB President Christine Lagarde reiterated overnight that the Governing Council remains comfortable with its current policy stance, telling European lawmakers that inflation is still expected to stabilise at the 2% target over the medium term. In an environment marked by elevated uncertainty, Lagarde stressed that a "data-dependent, meeting-by-meeting approach to monetary policy serves us well."
That message was reinforced by Bundesbank President Joachim Nagel, who said “many factors” point to the current level of interest rates being appropriate. Nagel downplayed recent inflation softness, arguing that the shortfall is "small, temporary deviations", while medium-term inflation dynamics remain firmly aligned with the ECB’s target.
Nagel emphasised that policy action would only be warranted if medium-term inflation expectations deviated “sustainably and noticeably” from target — something he said is clearly not happening.
USD/JPY Daily Outlook
Daily Pivots: (S1) 155.05; (P) 156.36; (R1) 157.19; More...
USD/JPY's break of 155.51 minor support suggests that rebound from 152.07 has already completed at 157.65. Intraday bias is back on the downside for 152.07. Overall, price actions from 159.44 are seen as a correction to the rally from 139.87, rather than reversal. Downside should be contained by 38.2% retracement of 139.87 to 159.44 at 151.96 to bring rebound.
In the bigger picture, outlook is unchanged that corrective pattern from 161.94 (2024 high) should have completed with three waves at 139.87. Larger up trend from 102.58 (2021 low) could be ready to resume through 161.94. This will remain the favored case as long as 55 W EMA (now at 151.68) holds. However, sustained break of 55 W EMA will argue that the pattern from 161.94 is extending with another falling leg.
EURUSD : Moved Higher and Banked +105 Pips +3%
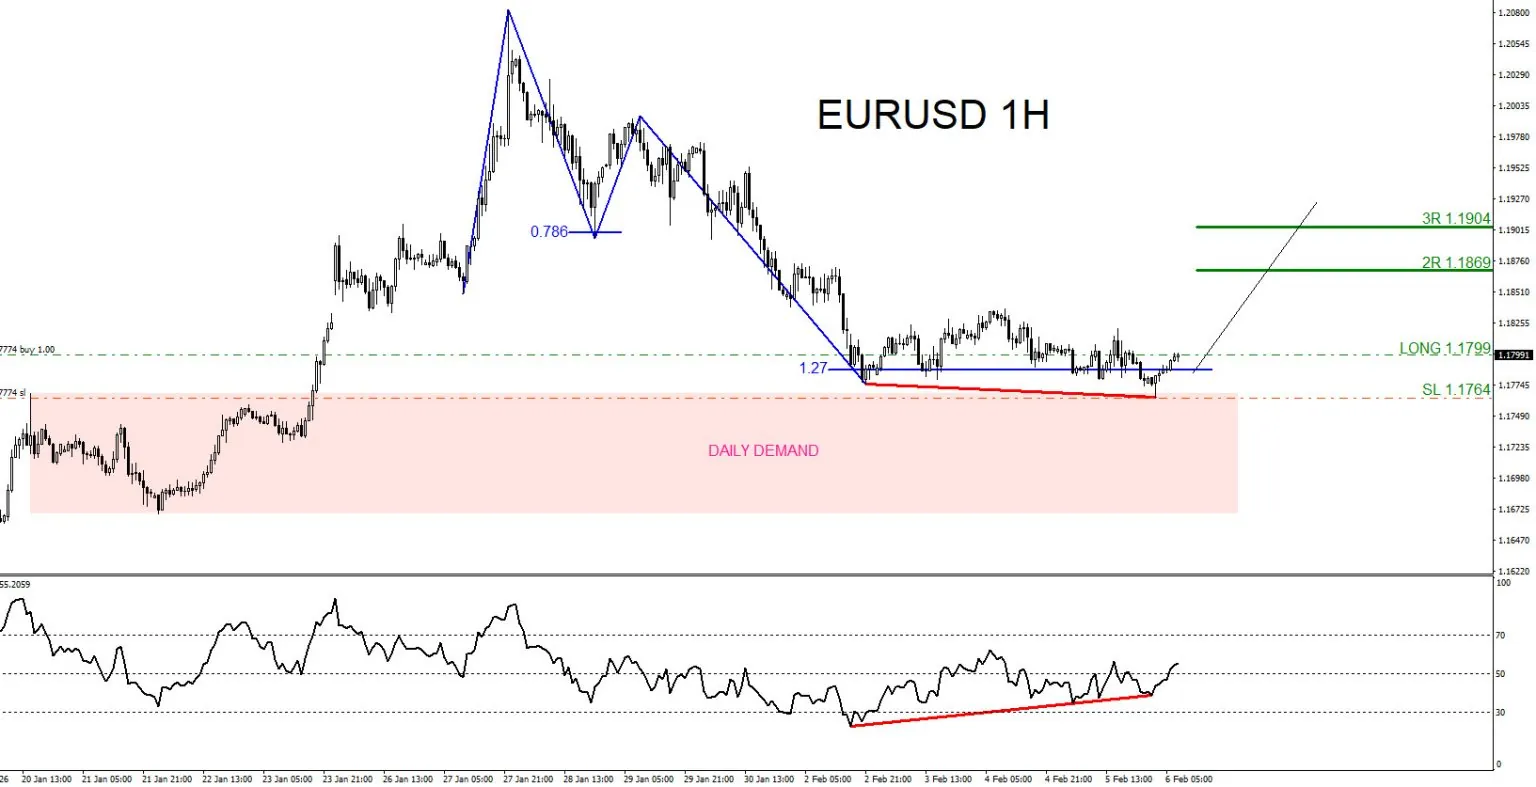
February 6 2026 I entered the buy entry on the EURUSD pair at 1.1799 with a 35 pip stop loss at 1.1764 and was looking for a move higher to the 3R target at 1.1904.
Buy Trade Setup
- Price taps the bullish daily demand zone (Pink) and reacted with a move higher.
- Bullish divergence pattern formed in the demand zone signalling a move higher. (Red line)
- Bullish market pattern 1.27 Fib. level hits signalling bulls will be looking to push the market higher. (Blue)
- All combined together and entered the BUY/LONG trade with confidence.
EURUSD 1 Hour Chart February 6 2026 (Entry)
EURUSD 1 Hour Chart February 9 2026 (Target hits/Trade closed)
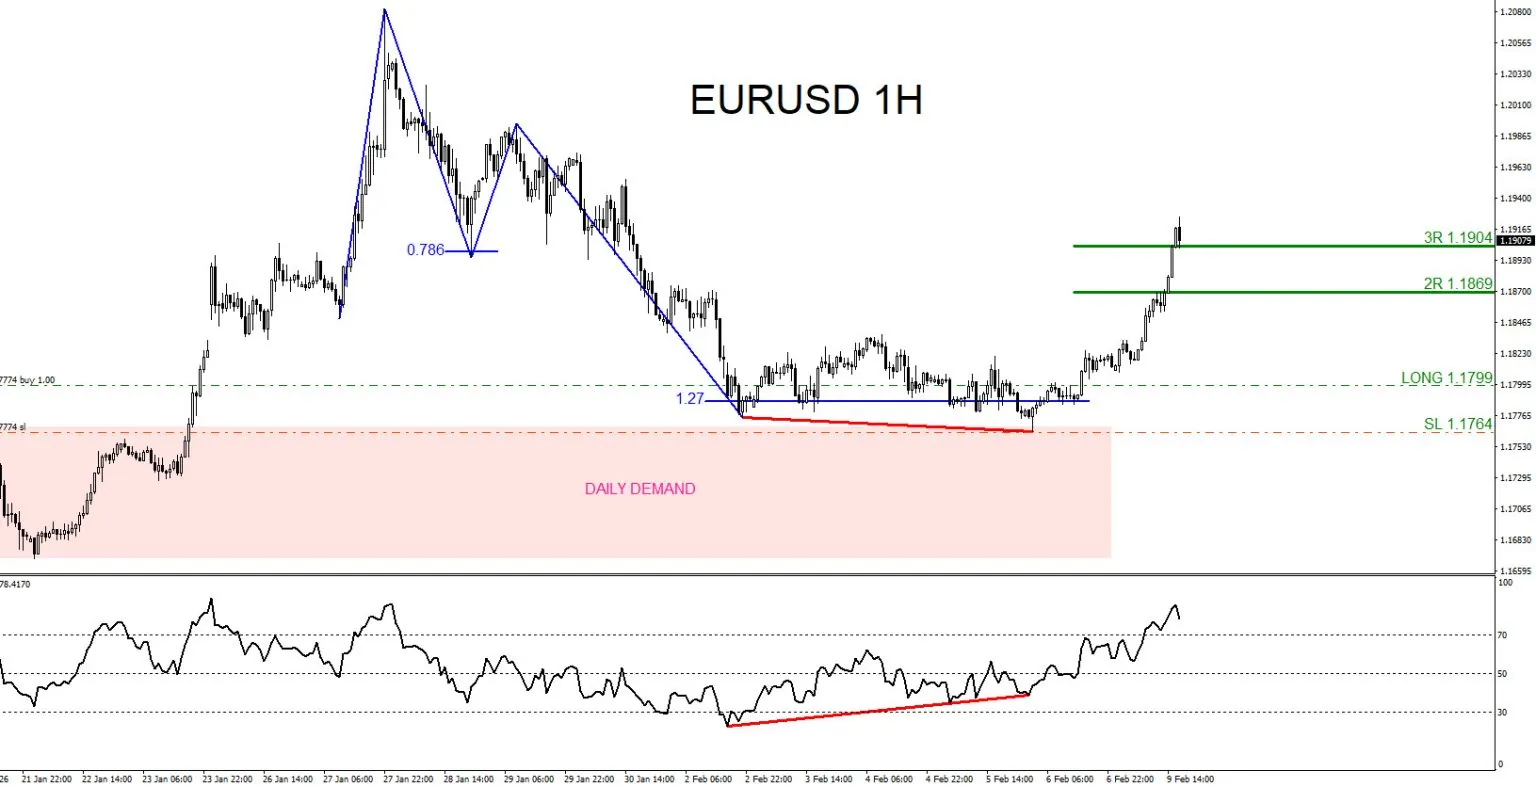
EURUSD moves higher and hits 3R target at 1.1904 from 1.1799 and I closed trade for +105 pips (+3% gain risking 1% on every trade)
A trader should always have multiple strategies all lined up before entering a trade. Never trade off one simple strategy. When multiple strategies all line up it allows a trader to see a clearer trade setup. We at EWF never say we are always right. No market service provider can forecast markets with 100% accuracy. Only thing we at EWF 100%, is that we are RIGHT more than we are WRONG.
Of course, like any strategy/technique, there will be times when the strategy/technique fails so proper money/risk management should always be used on every trade. Hope you enjoyed this article and follow me on social media for updates and questions> @AidanFX
At Elliottwave-Forecast we cover 78 instruments (Forex, Commodities, Indices, Cryptos, Stocks and ETFs) in 4 different time frames and we offer 5 Live Session Webinars everyday. We do Daily Technical Videos, Elliott Wave Trade Setup Videos and we have a 24 Hour Chat Room. Our clients are always in the loop for the next market move.