
Sample Category Title
USD/JPY Mid-Day Outlook
Daily Pivots: (S1) 156.75; (P) 157.01; (R1) 157.51; More...
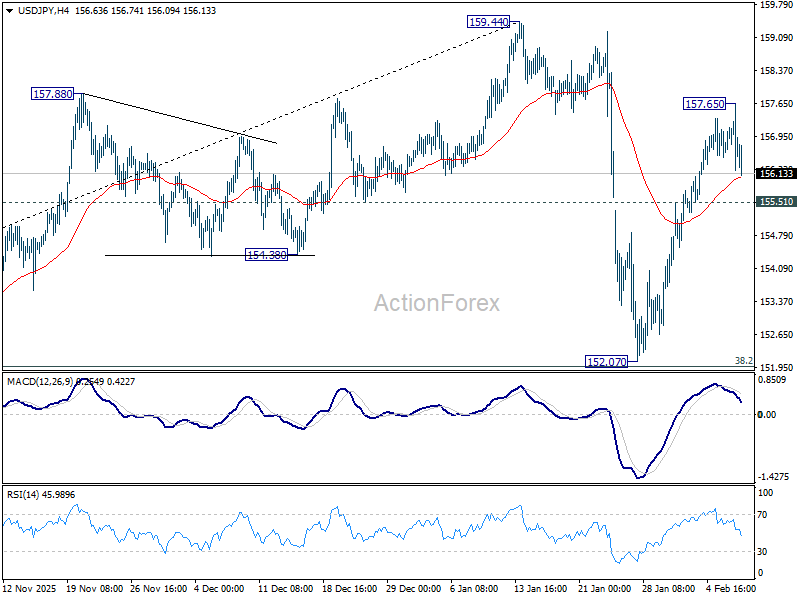
Intraday bias in USD/JPY remains neutral for the moment. Rise from 152.07 is seen as the second leg of the corrective pattern from 159.44. Above 157.65 will target a retest on 159.44 high. However, on the downside, below 155.51 minor support will bring deeper fall as another falling leg. But downside should be contained by 38.2% retracement of 139.87 to 159.44 at 151.96.
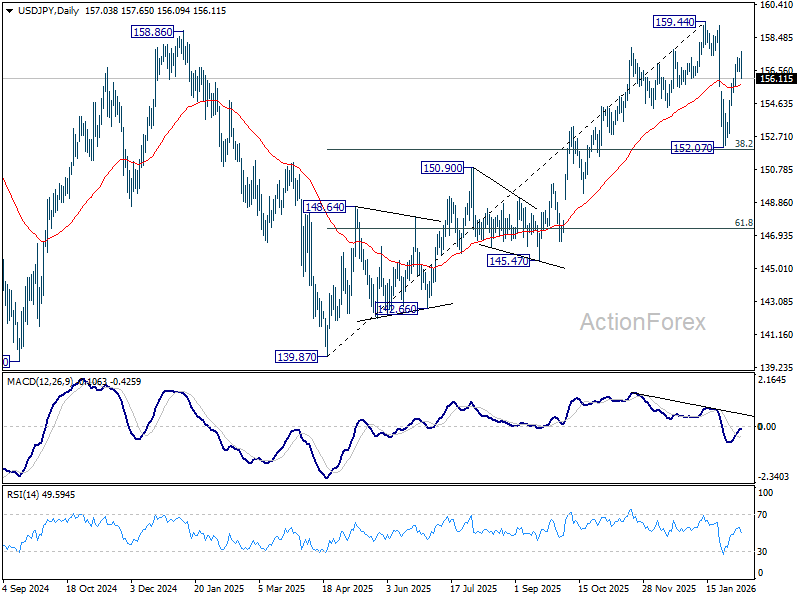
In the bigger picture, outlook is unchanged that corrective pattern from 161.94 (2024 high) should have completed with three waves at 139.87. Larger up trend from 102.58 (2021 low) could be ready to resume through 161.94. This will remain the favored case as long as 55 W EMA (now at 151.68) holds. However, sustained break of 55 W EMA will argue that the pattern from 161.94 is extending with another falling leg.
USD/CHF Mid-Day Outlook
Daily Pivots: (S1) 0.7746; (P) 0.7767; (R1) 0.7782; More….
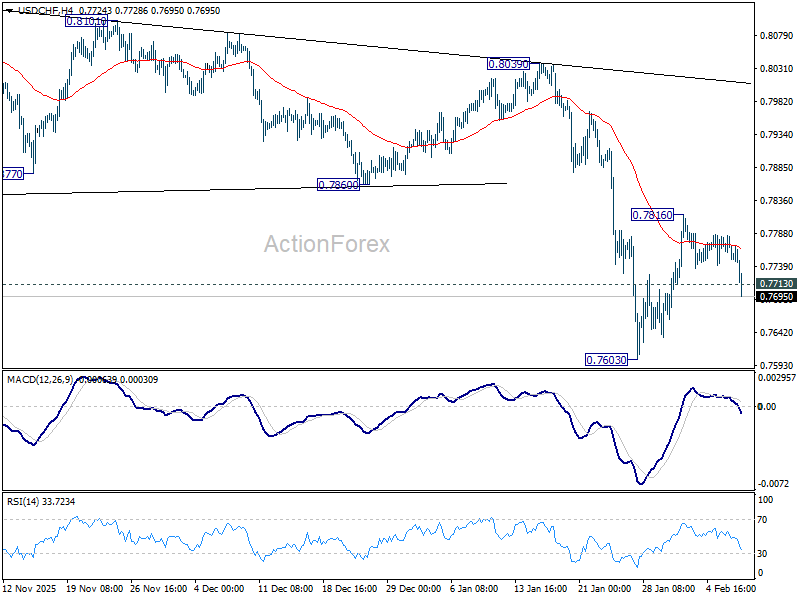
USD/CHF's break of 0.7713 support suggests that corrective rebound from 0.7603 has already completed at 0.7816. Intraday bias is back on the downside for retesting 0.7603 first. Firm break there will resume larger down trend to 0.7382 projection level next.
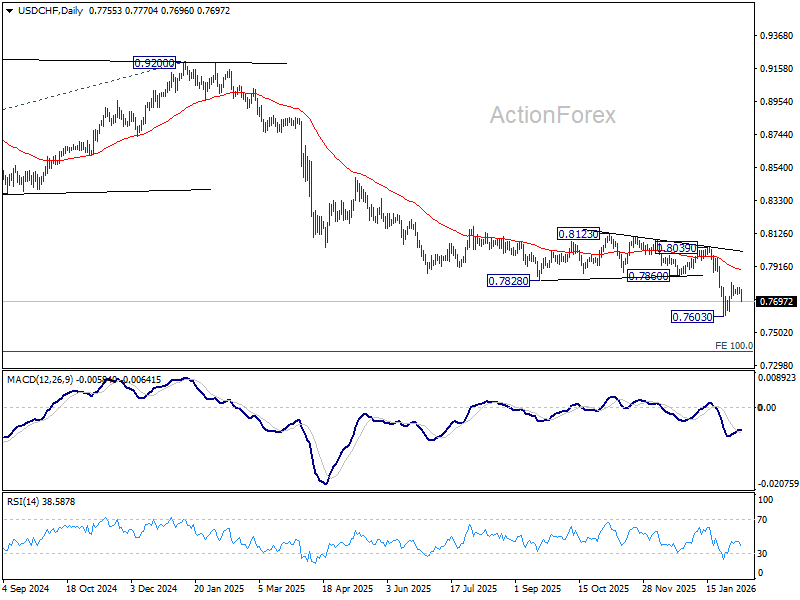
In the bigger picture, larger down trend from 1.0342 (2017 high) is still in progress. Next target is 100% projection of 1.0146 (2022 high) to 0.8332 from 0.9200 at 0.7382. In any case, outlook will stay bearish as long as 55 W EMA (now at 0.8152) holds.
Dollar Slips, Yen Stabilizes, Sterling Under Pressure
Dollar is softer across the board today as its recent rebound appears to be losing momentum. The move lacks a single defining trigger, instead reflecting a convergence of sentiment shifts and near-term positioning adjustments. One important backdrop is the stabilization in risk appetite. After markets spent much of last week grappling with AI-related disruption fears and concerns over surging capital expenditure, those anxieties have eased. Equity markets, particularly in the US, have steadied, reducing the need for defensive Dollar exposure.
Another factor may be growing caution ahead of the delayed January non-farm payroll report. Following a string of softer labor market signals last week, some traders appear to be hedging against the risk of a downside surprise in headline job creation. Adding to the pressure are reports suggesting Chinese regulators have encouraged financial institutions to scale back holdings of US Treasuries due to heightened market volatility. While the immediate impact is unclear, the headlines add to broader uncertainty surrounding foreign demand for US assets.
Despite these pressures, the Dollar’s pullback remains orderly. Many market participants appear reluctant to commit to larger directional trades, at least until the payroll data provides clearer guidance on the Fed’s policy path.
Meanwhile, Sterling is also under pressure today, particularly against Euro and Swiss Franc, as domestic political risk resurfaces sharply. UK Prime Minister Keir Starmer’s government is facing its most severe crisis yet following the back-to-back resignations of two senior aides. Chief of Staff Morgan McSweeney resigned on Sunday, followed less than 24 hours later by Director of Communications Tim Allan, intensifying scrutiny around leadership stability.
The resignations are tied to a widening scandal surrounding the appointment of Peter Mandelson as UK ambassador to the US, amid revelations about the depth of his past relationship with the late convicted sex offender Jeffrey Epstein. The issue has quickly escalated from reputational risk to a full-blown political liability.
Reports suggest Downing Street is bracing for a delegation of Cabinet ministers to urge Starmer to step aside. Names such as Health Secretary Wes Streeting and former Deputy Prime Minister Angela Rayner are already being floated as potential successors, injecting fresh uncertainty into the UK political outlook.
In Japan, the so-called “Takaichi trade” partially resurfaced after Prime Minister Sanae Takaichi secured a historic supermajority in the Lower House, delivering the LDP its strongest result since World War Two. The result significantly strengthens her legislative authority.
While Nikkei surged to new record highs on the back of the election outcome, Yen did not collapse as some had expected. Instead, it staged a modest recovery as a chorus of senior Japanese officials stepped up verbal intervention, warning against one-sided FX moves. Still, this should not be mistaken for a structural Yen reversal. The currency is merely retracing a portion of recent losses as traders adopt a wait-and-see stance, likely looking for better levels to re-establish short positions.
For the day so far, Dollar sits at the bottom of the performance table, followed by Kiwi and Sterling. Swiss Franc leads gains, with Euro and Yen also firmer, while Loonie and Aussie are trading in the middle of the pack.
In Europe, at the time of writing, FTSE is down -0.12%. DAX is up 0.44%. CAC is up 0.09%. UK 10-year yield is up 0.049 at 4.562. Germany 10-year yield is up 0.009 at 2.853. Earlier in Asia, Nikkei rose 3.89%. Hong Kong HSI rose 1.76%. China Shanghai SSE rose 1.41%. Singapore Strait Times rose 0.54%. Japan 10-year JGB yield rose 0.059 to 2.294.
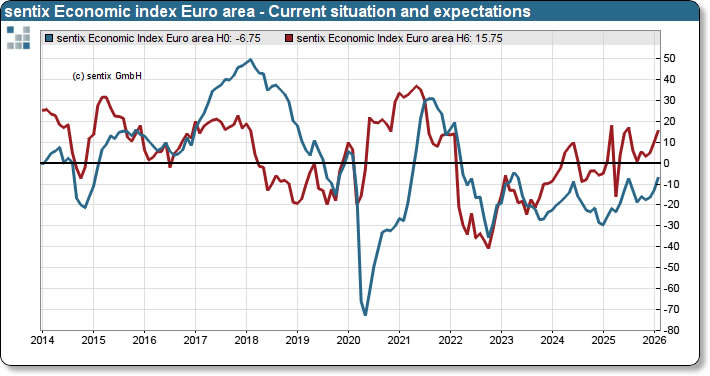
Eurozone Sentix jumps to 4.2, growth hope without inflation alarm
Eurozone investor confidence showed notable improvement in February, with the Sentix Investor Confidence Index rising from -1.8 to 4.2, above expectations of -0.2 and marking the highest reading since July 2025. The improvement was broad-based. Current Situation Index climbed from -13.0 to -6.8, its strongest level since April 2023. Meanwhile, Expectations Index rose from 10.0 to 15.8, also the highest since last summer, pointing to growing belief that the worst of the downturn has passed.
Sentix described the data as a “silver lining” for the Eurozone economy, arguing that the recession phase has likely ended and an upturn is beginning. While private investors remain somewhat cautious, institutional investors appear to be turning decisively more optimistic, with professional expectations reportedly rising to +24 points.
Inflation concerns have not re-emerged despite volatility in commodity markets and firmer oil prices. Investors surveyed see little risk of renewed inflation pressure, a backdrop that should allow the ECB to maintain its current policy stance. Markets continue to expect monetary policy to remain mildly supportive, and "definitely do not anticipate a restrictive phase."
Japan's nominal pay accelerates to 2.4% in December, but real wages still negative
Japan’s real wages fell -0.1% yoy in December, marking the 12th consecutive monthly decline, though the contraction was the smallest seen in 2025. While the pace of erosion is clearly slowing, the data underline how inflation continues to outpace pay gains for households.
Nominal wages rose 2.4% yoy, extending a 48-month streak of increases, but the outcome fell short of expectations for a 3.0% rise. The acceleration from November’s 1.7% growth points to improving momentum, but not yet at a pace sufficient to deliver sustained real income gains.
Breaking down the components, base salaries rose 2.2% yoy, picking up from November's 1.7% yoy. Overtime pay increased 0.9%, slightly slower than the prior month's 1.2%. Special payments, largely winter bonuses, rose 2.6% up from 1.5%.
Attention now shifts firmly to the upcoming spring wage negotiations. The key questions are whether large firms can again deliver pay hikes above 5% for the third straight years, and whether those gains finally spill over to smaller companies.
USD/CHF Mid-Day Outlook
Daily Pivots: (S1) 0.7746; (P) 0.7767; (R1) 0.7782; More….
USD/CHF's break of 0.7713 support suggests that corrective rebound from 0.7603 has already completed at 0.7816. Intraday bias is back on the downside for retesting 0.7603 first. Firm break there will resume larger down trend to 0.7382 projection level next.
In the bigger picture, larger down trend from 1.0342 (2017 high) is still in progress. Next target is 100% projection of 1.0146 (2022 high) to 0.8332 from 0.9200 at 0.7382. In any case, outlook will stay bearish as long as 55 W EMA (now at 0.8152) holds.
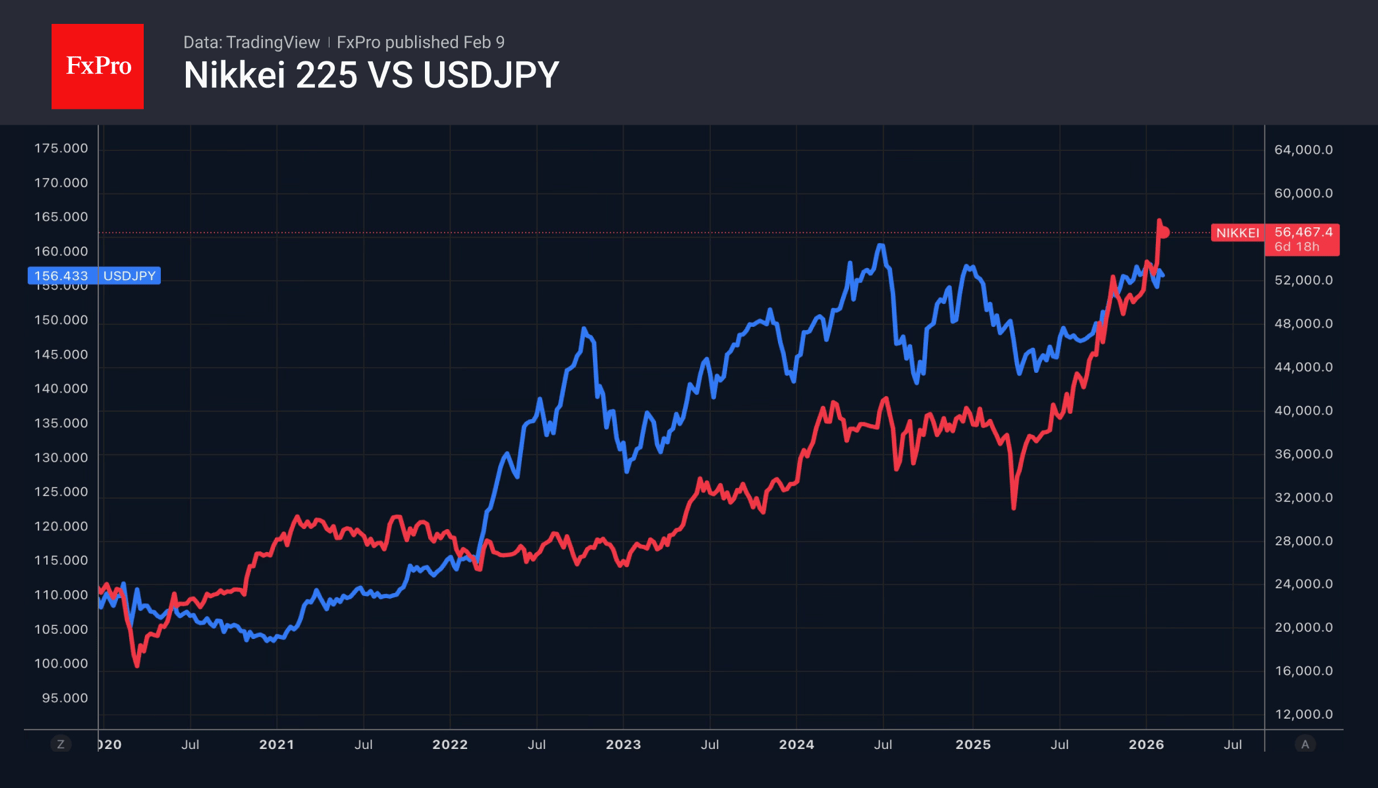
Yen Plays Out ‘Buy the Rumour, Sell the Fact’
- The LDP’s landslide victory in Japan led to a pullback in USDJPY.
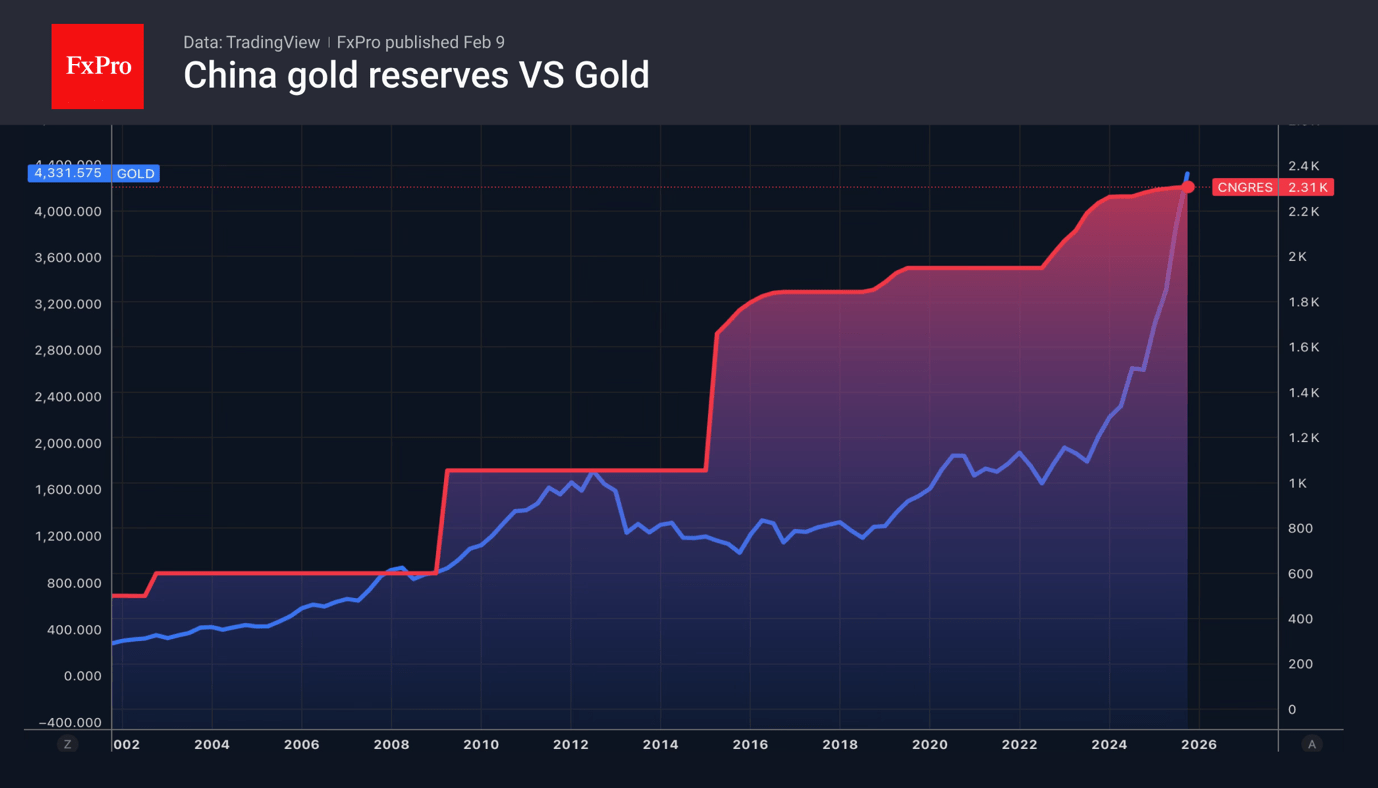
- China has been buying gold for 15 months in a row, supporting the price.
Improved global risk appetite undermined the US dollar. The S&P 500 recorded its best daily rally since May amid easing fears about the negative impact of artificial intelligence on technology and other companies’ shares. Bitcoin managed to bottom out and followed the rally in US stock indices. Gold returned above $5,000 per ounce, while demand for the greenback as a safe-haven asset declined.
Traders are taking profits on long positions in the USD index after the best week for the US dollar since early January, as important reports approach. Releases of data on employment, inflation and retail sales will clarify the situation with the US economy and allow conclusions to be drawn about the Fed’s monetary policy. The futures market sees a 70% probability of a rate cut in June and a 33% chance for April. Growing confidence in a rate cut, if not undermined by US statistics, will inspire the EURUSD bulls.
USDJPY quotes rose in anticipation of the vote outcome in the lower house. However, when the market opened, investors preferred to take profits, which strengthened the yen by almost 1%.
The Liberal Democratic Party won a record 316 seats in the lower house of Parliament. Together with its coalition partner, the Japan Innovation Party, it holds 354 of the 465 seats, allowing the LDP to pursue its policies without the approval of other parties. Takaichi contributed to the Nikkei 225’s rise to a historic high.
Gold returned above $5,000 per ounce thanks to support from central banks. The People’s Bank of China reported its 15th consecutive month of gold bar purchases. Its precious metal reserves grew by 40,000 ounces in January. The series began in November 2024 and has continued without interruption since then, despite price fluctuations.
The process of gold acquisition by central banks slowed down in 2025 to 860 tonnes after 1,000 tonnes over the previous three years. Nevertheless, regulators’ activity in the precious metals market remains high, which supports the gold price.
Gold Price Climbs Above $5,000 At the Start of the Week
As shown by today’s XAU/USD chart, gold began the week on a bullish note: trading opened with a bullish gap above Friday’s high, lifting the price above the psychological $5,000 level.
The strengthening of gold has been driven by the following factors (according to media reports):
- → The US dollar, which is weakening ahead of key US economic data. The January employment report is due on Wednesday (it is expected to show signs of stabilisation in the labour market), followed by inflation data on Friday.
- → Political developments in Japan. The decisive victory of Prime Minister Sanae Takaichi has reinforced expectations of large-scale fiscal stimulus (“Sanaenomics”), which traditionally puts pressure on the yen and supports gold.
- → Demand from central banks. It has been reported that China’s central bank extended its gold purchases for the fifteenth consecutive month in January.
On 3 February, when analysing gold price fluctuations, we:
- → noted that the market was extremely oversold within the context of a long-term ascending channel;
- → suggested that a rebound from the zone of extreme oversold conditions could encounter a resistance area formed by the median of that channel and the classic Fibonacci levels (50% and 61.8%).
Indeed, on 4 February, after recovering into this area (with the formation of peak C), the market reversed lower and found support near the lower boundary of the aforementioned channel on Friday, 6 February.
Technical Analysis of the XAU/USD Chart
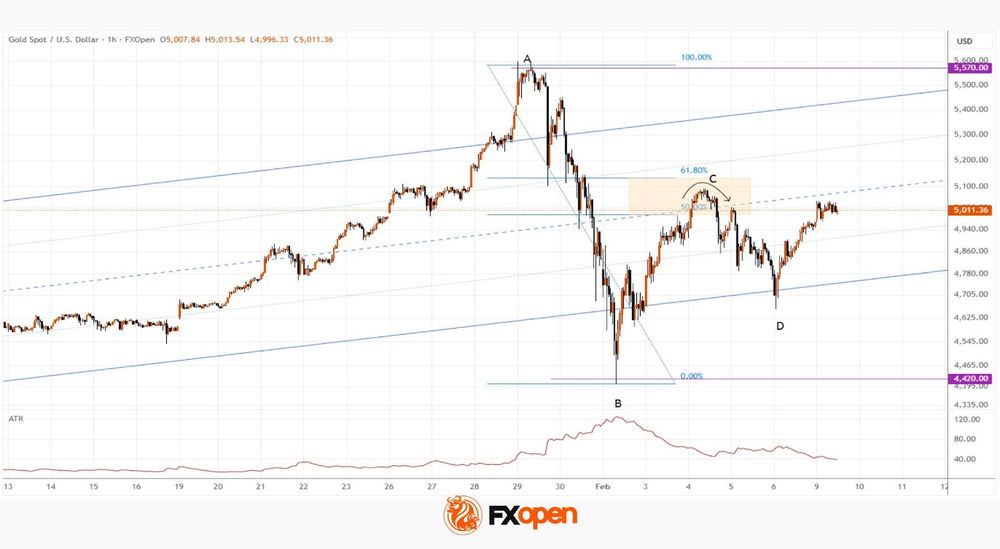
Price action (expanding amplitude) during the formation of low D points to aggressive demand, which may reflect the intentions of large capital.
At the same time, analysis of the market structure based on the A–B–C–D swing points suggests that, following the burst of extreme volatility at the turn of the month (highlighted by the peak in the ATR indicator), the market is searching for a new equilibrium.
It is therefore reasonable to assume that in the near term we may see a contraction in the amplitude of price fluctuations on the XAU/USD chart. It cannot be ruled out that supply and demand will find a temporary balance around the psychological $5k level.
Trade over 50 forex markets 24 hours a day with FXOpen. Take advantage of low commissions, deep liquidity, and spreads from 0.0 pips (additional fees may apply). Open your FXOpen account now or learn more about trading forex with FXOpen.
This article represents the opinion of the Companies operating under the FXOpen brand only. It is not to be construed as an offer, solicitation, or recommendation with respect to products and services provided by the Companies operating under the FXOpen brand, nor is it to be considered financial advice.
Eurozone Sentix jumps to 4.2, growth hope without inflation alarm
Eurozone investor confidence showed notable improvement in February, with the Sentix Investor Confidence Index rising from -1.8 to 4.2, above expectations of -0.2 and marking the highest reading since July 2025. The improvement was broad-based. Current Situation Index climbed from -13.0 to -6.8, its strongest level since April 2023. Meanwhile, Expectations Index rose from 10.0 to 15.8, also the highest since last summer, pointing to growing belief that the worst of the downturn has passed.
Sentix described the data as a “silver lining” for the Eurozone economy, arguing that the recession phase has likely ended and an upturn is beginning. While private investors remain somewhat cautious, institutional investors appear to be turning decisively more optimistic, with professional expectations reportedly rising to +24 points.
Inflation concerns have not re-emerged despite volatility in commodity markets and firmer oil prices. Investors surveyed see little risk of renewed inflation pressure, a backdrop that should allow the ECB to maintain its current policy stance. Markets continue to expect monetary policy to remain mildly supportive, and "definitely do not anticipate a restrictive phase."
USD/JPY Reacts to Political News: Budget Line Will Be Soft
USD/JPY is down to 156.73 on Monday. The Japanese yen had earlier dropped to its lowest levels in almost two weeks after a landslide victory for Japan's ruling Liberal Democratic Party in early elections to the lower house of parliament. The coalition is led by Prime Minister Sanae Takaichi. However, demand for the yen returned shortly after.
Takaichi's coalition won 352 of 465 seats in the House of Representatives, according to NHK. At the same time, the Liberal Democratic Party of Japan itself secured a majority of 316 seats. The vote's outcome provided the prime minister with a clear mandate to implement an expansive fiscal policy.
Markets regarded the result as a signal in favour of a softer budget line and possible tax breaks. This increased pressure on the yen and Japanese government bonds amid fears of a rise in the debt burden. At the same time, the results supported expectations of more favourable dynamics for the stock market.
A more conservative domestic agenda is now expected to advance, including stricter immigration policies and land ownership rules. All this adds uncertainty to the assessment of medium-term consequences for the economy and financial markets.
Technical Analysis
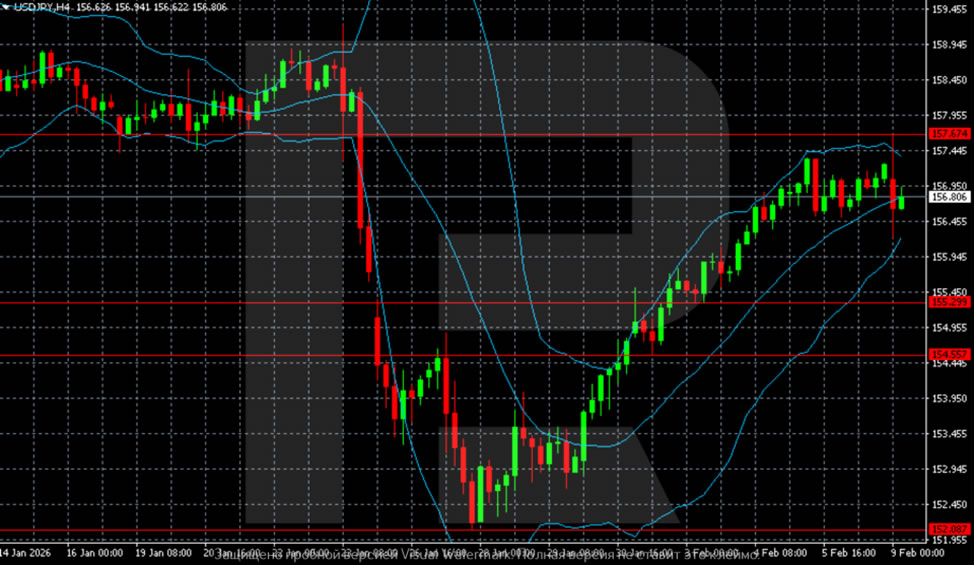
On the H4 chart for USD/JPY, following a sharp decline at the end of January, a local bottom formed in the 152.00-152.20 zone, from which the pair began to recover. This impulsive growth was accompanied by movement along the upper border of the Bollinger Bands. The price is now trading below recent highs and consolidating in the 155.80-157.70 range. Volatility has decreased, and the structure remains corrective. However, momentum weakened, and the market has entered a pause phase under resistance.
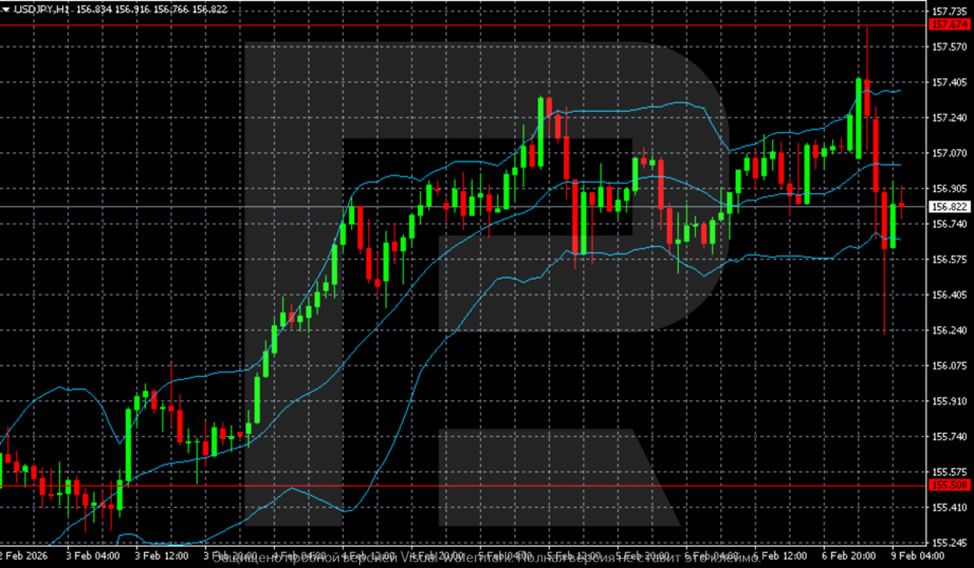
The H1 chart shows the development of lateral dynamics after growth, with the price hovering around the Bollinger Bands' midline, and no new momentum forming. Selling pressure quickly cancelled attempts to move higher to 157.40-157.70, while support holds in the 155.50-155.80 region. The near-term trajectory appears neutral, with a balance between correction and attempts to continue the recovery.
Conclusion
In summary, USD/JPY is undergoing a corrective pullback as the market digests the political implications of Japan's election outcome. While the landslide victory initially weakened the yen on expectations of expansive fiscal policy, a technical pause has followed. The pair is now consolidating, caught between the fundamental pressure from anticipated higher Japanese debt (bearish for JPY) and technical resistance. The near-term trajectory will depend on whether this consolidation leads to a continuation of the recovery or a deeper correction, with clarity on the new government's fiscal measures serving as the next major catalyst.
Gold Climbs Back Over 5,000, Can It Hold Above?
- Gold extends Friday’s strong rebound above the 20-day SMA.
- Supported by a slightly weaker dollar and rising geopolitical risks.
- Rebound still lacks strong technical momentum.
Gold is rising over 1% today, building on Friday's 4% gain, to trade back above the key 5,000 key threshold for the first time in almost a week, helped by bargain hunting, lingering concerns over US-Iran tensions and a softer dollar. Meanwhile, investors await key US economic data due this week to gauge the US interest rate trajectory.
A sustained close above 5,000 could open the way toward resistance at the 61.8% Fibonacci retracement level of the January-February selloff from the record high near 5,141. A break higher, could lead to a gain toward the 5,342-5,430 range.
However, the technical indicators are not fully endorsing the bullish momentum. While still in positive territory, the RSI is hovering only slightly above neutral, and the MACD remains above zero but is easing below its red signal line.
This suggests the market could still face a pullback from current levels, which represent a strong technical barrier. Initial support lies at the 20-day simple moving average (SMA) at 4,891, a break below which could expose 4,685, which capped losses last week, followed by the medium‑term ascending trendline near 4,590.
Overall, gold is attempting to break above a significant technical threshold, having retraced nearly half of the steep decline from its record high. Yet the rebound continues to lack strong momentum, and only a sustained move back toward 5,100 would set the stage for a potential retest of record territory in the near term.
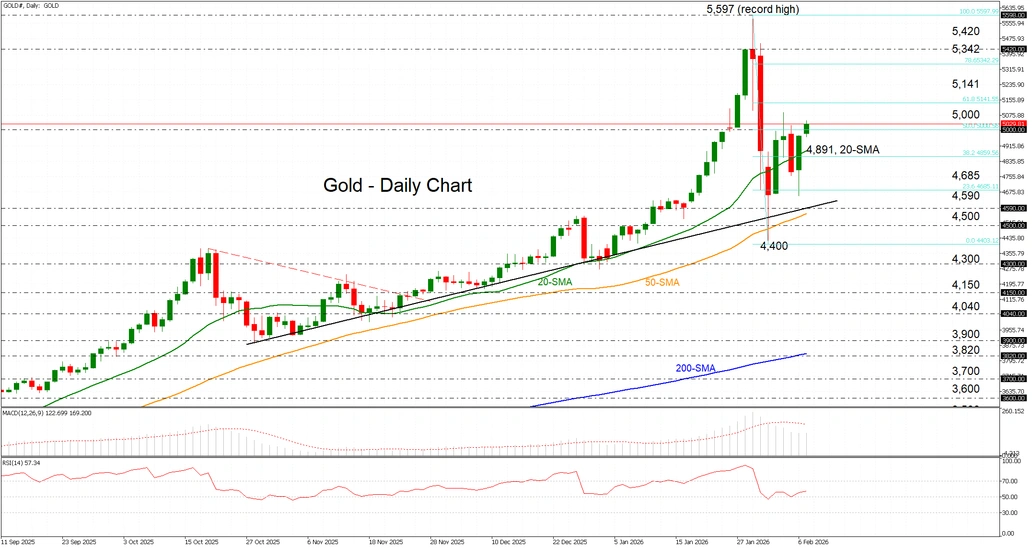
Chart Alert: USD/JPY Rebound Fades as Intervention Fears Signal Renewed Downside Risk Below 157.50
Key takeaways
- Sharp drop, failed rebound: USD/JPY broke below 157.50 and slid 3% to a three-month low at 152.09 before rebounding, but the recovery toward 157 has now stalled, suggesting the bounce is losing steam.
- Politics didn’t weaken the yen as expected: Despite PM Takaichi’s landslide election win and scope for expansionary policies, the anticipated “Takaichi trade” faded quickly as intervention fears capped USD/JPY upside.
- Bearish technical inflection: Price action has formed a bearish engulfing pattern, with momentum rolling over; a break below 156.36 risks renewed downside toward 155.66–153.85, while 157.50 remains key resistance.
This is a follow-up analysis and an update of our prior report, “Chart alert: USD/JPY plunging below 158 on suspected intervention, watch 157.50 support”, published on 23 January 2026.
Since our last report, the USD/JPY has broken below the highlighted key support of 157.50 and staged a swift decline of around 3% within three days to print a three-month low of 152.09 on 27 January 2026.
Thereafter, the price actions of USD/JPY rebounded by 3.4% to hit a high of 157.27 last Friday, 6 February 2026, on the backdrop of a potential hawkish tilt that may be undertaken by the newly nominated Fed Chair, Kevin Warsh.
Also, in anticipation of favourable outcome for Japanese Prime Minister Takaichi’s coalition party performance on the 8 February snap election for the lower house, which allows her to have a stronger mandate to push for expansionary policies that will likely “hinder” the Bank of Japan (BoJ)’s current gradual interest rate hike monetary policy stance.
“Takaichi trade” on a weaker JPY gets fizzle out
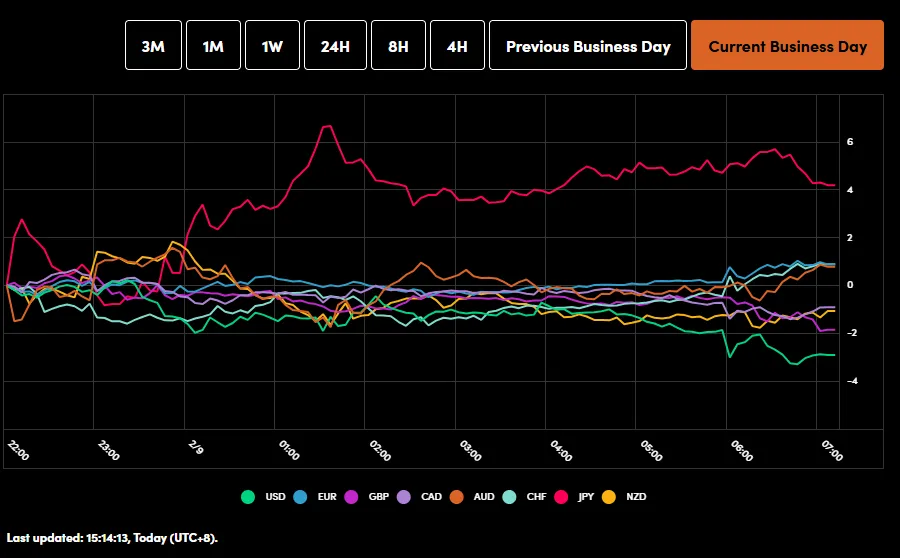
Fig. 1: OANDA Labs Currency Power Balance tool as of 9 Feb 2026 (Source: OANDA Labs tools)
Takaichi’s coalition party has managed to score a stunning victory in the snap election and surpassed the two-thirds majority of 310 seats, where Takaichi's Liberal Democratic Party won 316 seats in the 465-seat chamber.
A super majority allows Takaichi’s coalition party to secure a majority on all parliamentary committees. A supermajority means it could overrule opposition to draft legislation in the upper house, which in turn allows Takaichi to push ahead with her campaign's expansionary policies more easily.
On paper, such a scenario is likely to see a significant sell-off in the Japanese yen once the FX market reopens on Monday, 9 February early Asian session. In contrast, the earlier anticipated sell-off in the JPY was short-lived; the USD/JPY only spiked up by 42 pips to print an intraday high of 157.66 (slightly above the former broken-down key short-term support of 157.50) before it traded down lower by 0.5% to print a current intraday level of 156.50 at the time of writing where the JPY is now the strongest intraday major currency against the greenback (see Fig. 1).
Intervention fears put a halt to further intraday JPY weakness
Japanese Finance Minister Katayama reiterated on Sunday, as the election results came in favour of PM Takaichi’s coalition party, that she was keeping in close contact with US Treasury Secretary Bessent and pledged that she “will communicate” with financial markets today if needed.
These remarks have sparked fears in speculators of a joint intervention, and or rate checks if the USD/JPY rallied swiftly, triggering a déjà vu experience on the recent swift three-day sell-off of the USD/JPY from 23 January.
Let's now look at the technical chart of USD/JPY to decipher its short-term trajectory.
Short-term trend (1 to 3 days): Inflection point reached for bearish reversal
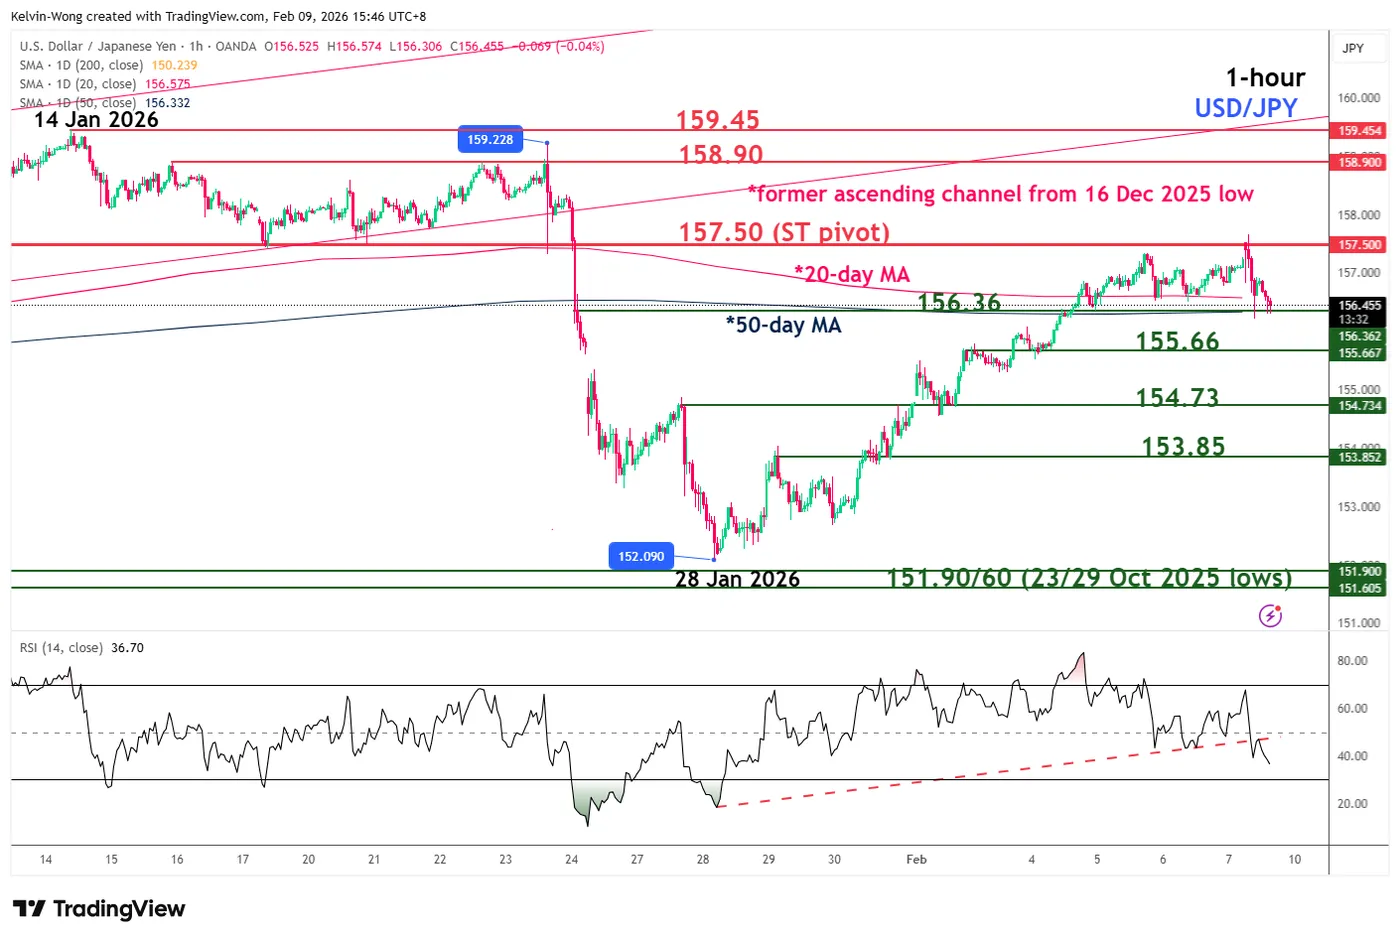
Fig. 2: USD/JPY minor trend as of 9 Feb 2026 (Source: TradingView)
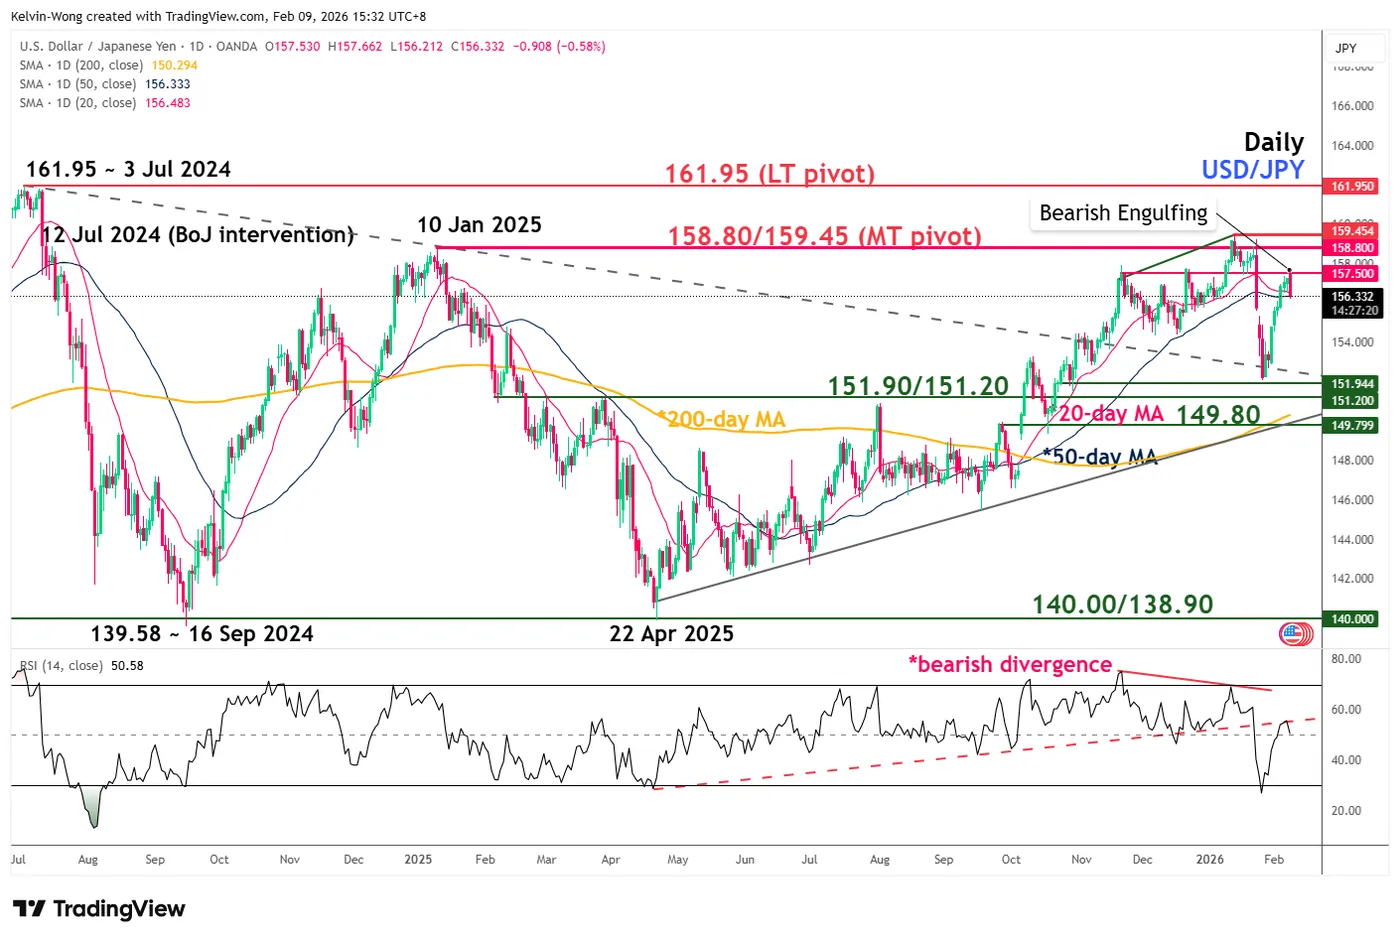
Fig. 3: USD/JPY medium-term trend as of 9 Feb 2026 (Source: TradingView)
USD/JPY’s rebound from the 28 January 2026 low of 152.09 is likely to have ended. Watch the 157.50 short-term pivotal resistance, and a break below 156.36 may trigger further short-term weakness to expose the next intermediate supports at 155.66, 154.73, and 153.85 (see Fig. 2).
However, a clearance above 157.50 invalidates the bearish scenario for a squeeze up towards 158.80/159.45 medium-term pivotal resistance zone.
Key elements to support the short-term bearish bias
- Based on the recent two sessions of price actions from 6 February to 9 February 2026, USD/JPY has formed an impending daily “Bearish Engulfing” candlestick pattern, which increases the odds of a bearish reversal (see Fig. 3).
- The hourly RSI momentum indicator has staged a bearish breakdown from its former parallel ascending support from 28 January 2026, which implies a potential build-up in short-term bullish momentum conditions.
AUD/USD And NZD/USD Build Momentum As Bulls Target Fresh Gains
AUD/USD started a fresh increase above 0.6980 and 0.7000. NZD/USD is also rising and might aim for more gains above 0.6060.
Important Takeaways for AUD USD and NZD USD Analysis Today
- The Aussie Dollar started a decent increase above 0.6950 against the US Dollar.
- There was a break above a key bearish trend line with resistance at 0.7000 on the hourly chart of AUD/USD at FXOpen.
- NZD/USD is consolidating gains above the 0.5995 pivot zone.
- There is a major bearish trend line forming with resistance at 0.6030 on the hourly chart of NZD/USD at FXOpen.
AUD/USD Technical Analysis
On the hourly chart of AUD/USD at FXOpen, the pair started a fresh increase from 0.6900. The Aussie Dollar was able to clear 0.6950 to move into a positive zone against the US Dollar.
There was a close above 0.6980 and the 50-hour simple moving average. Besides, there was a break above a key bearish trend line with resistance at 0.7000. Finally, the pair tested 0.7035. A high was formed near 0.7037 and the pair recently started a consolidation phase.
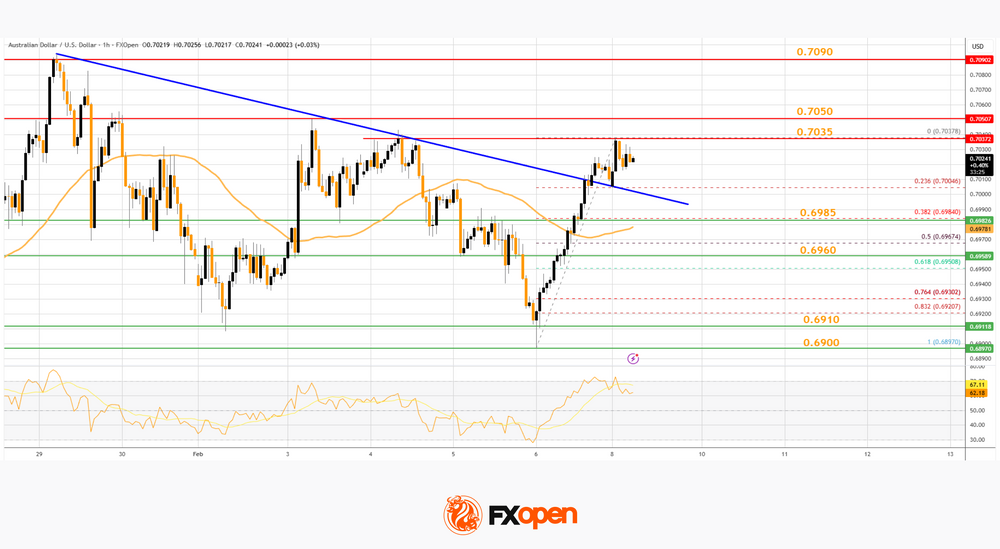
There was a minor decline below 0.7030. On the downside, initial support is near the 23.6% Fib retracement level of the upward move from the 0.6897 swing low to the 0.7037 high.
The next area of interest could be near 0.6985, the 50% Fib retracement, and the 50-hour simple moving average. If there is a downside break below 0.6985, the pair could extend its decline toward 0.6960. Any more losses might signal a move toward 0.6910.
On the upside, the AUD/USD chart indicates that the pair is now facing resistance near 0.7035. The first major hurdle for the bulls might be 0.7050. An upside break above 0.7050 might send the pair further higher. The next stop is near 0.7090. Any more gains could clear the path for a move toward 0.7120.
NZD/USD Technical Analysis
On the hourly chart of NZD/USD on FXOpen, the pair started a fresh increase from 0.5930. The New Zealand Dollar broke the 0.5950 barrier to start the recent rally against the US Dollar.
The pair settled above 0.6000 and the 50-hour simple moving average. The bulls were able to push the pair above the 61.8% Fib retracement level of the downward move from the 0.6060 swing high to the 0.5928 low.
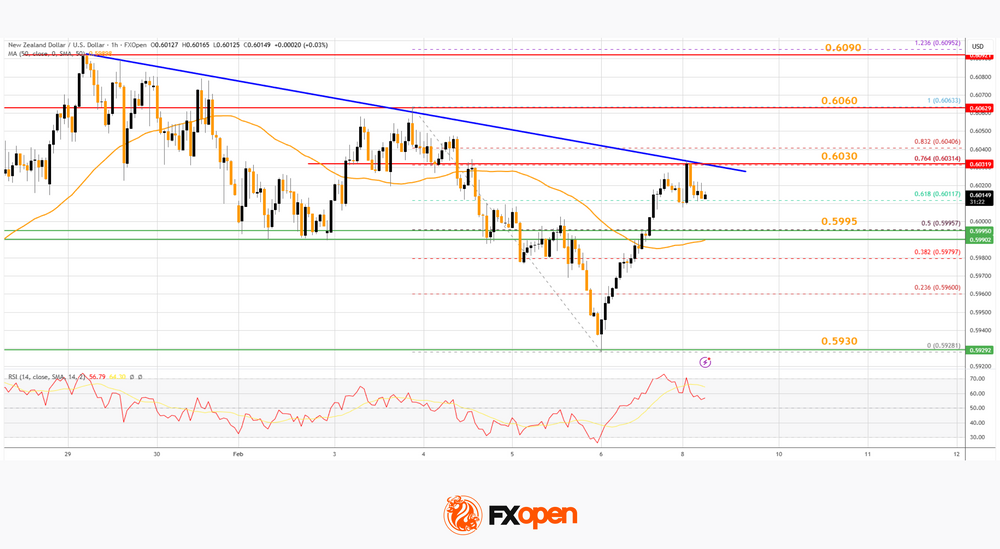
However, the bears are now protecting the 76.4% Fib retracement at 0.6030. There is also a major bearish trend line forming with resistance at 0.6030. The NZD/USD chart suggests that the RSI is still above 50.
On the downside, immediate support is near the 0.5995 level and the 50-hour simple moving average. The first key zone for the bulls sits at 0.5930.
The next key level is 0.5900. If there is a downside break below 0.5900, the pair might slide toward 0.5865. Any more losses could lead NZD/USD into a bearish zone to 0.5820.
On the upside, the pair might struggle near 0.6030. The next major resistance is near the 0.6060 zone. A clear move above 0.6060 might even push the pair toward 0.6090. Any more gains might clear the path for a move toward the 0.6120 zone in the coming days.
Trade over 50 forex markets 24 hours a day with FXOpen. Take advantage of low commissions, deep liquidity, and spreads from 0.0 pips (additional fees may apply). Open your FXOpen account now or learn more about trading forex with FXOpen.
This article represents the opinion of the Companies operating under the FXOpen brand only. It is not to be construed as an offer, solicitation, or recommendation with respect to products and services provided by the Companies operating under the FXOpen brand, nor is it to be considered financial advice.