Sample Category Title
EURCAD Approaches 100-day SMA as Bearish Pressures Ease
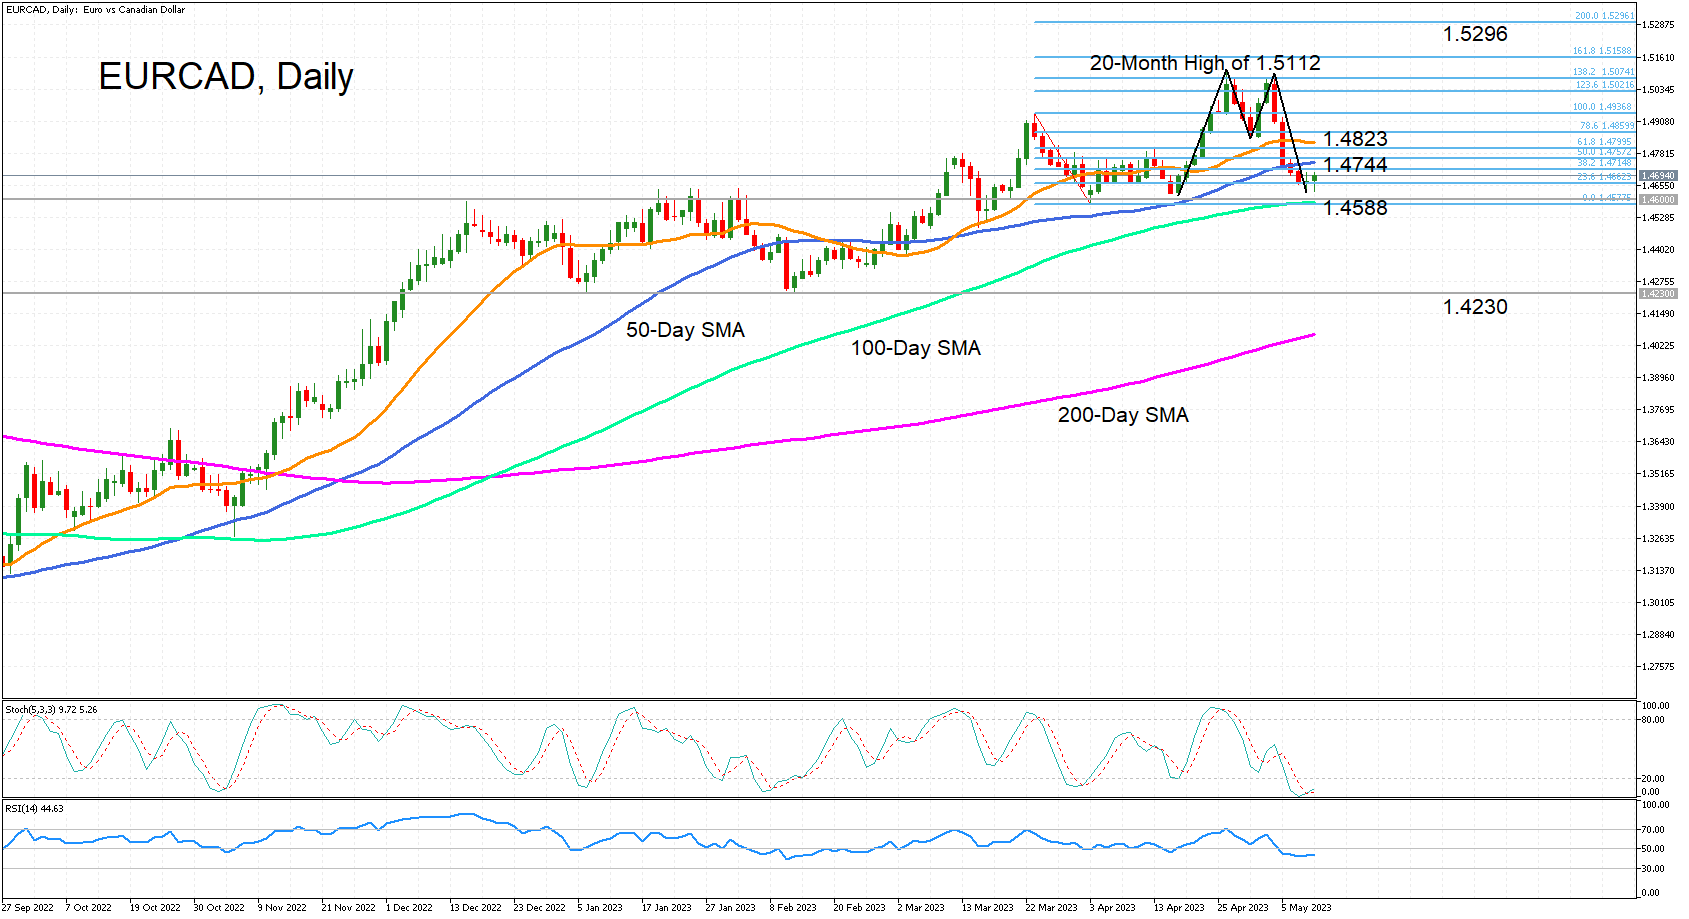
EURCAD has steadied in the 1.4675 region following the sharp pullback from around the 1.5100 level where a double top was formed. However, despite the bearish signal, the pair remains above its long-term moving averages and the momentum indicators are pointing to an easing of the selling pressure.
The fast stochastic (%K) has just crossed above the slow stochastic (%D), though they both remain within the oversold area, while the RSI has flatlined slightly below the 50 neutral level.
With the 100-day simple moving average (SMA) lurking about slightly below 1.4600, this is the key support to the downside that could determine whether the latest slide is just another correction within the broader uptrend or the start of a bearish reversal.
Should the pair slip below the 100-day SMA, currently at 1.4588, the next major support could come at 1.4230, which was a low in both January and February. A drop below this mark would shift attention to the 200-day SMA.
However, if EURCAD sees further improvement in positive momentum, the first test looks set to be the 50-day SMA at 1.4744, followed by the 20-day SMA at 1.4823. Higher up, the 20-month peak of 1.5112 from April would be the next big challenge for the bulls. A break above this double top would signal a resumption of the uptrend that began in August 2022. Even higher, the 200% Fibonacci extension of the March-April downleg at 1.5296 would likely become the next target.
In brief, EURCAD’s outlook is at risk of turning bearish should the 100-day SMA fail to act as support, while a climb above 1.51 is needed to reinforce the positive longer-term picture.
Silver Bears Aim to Stay; Eyes on 24.45
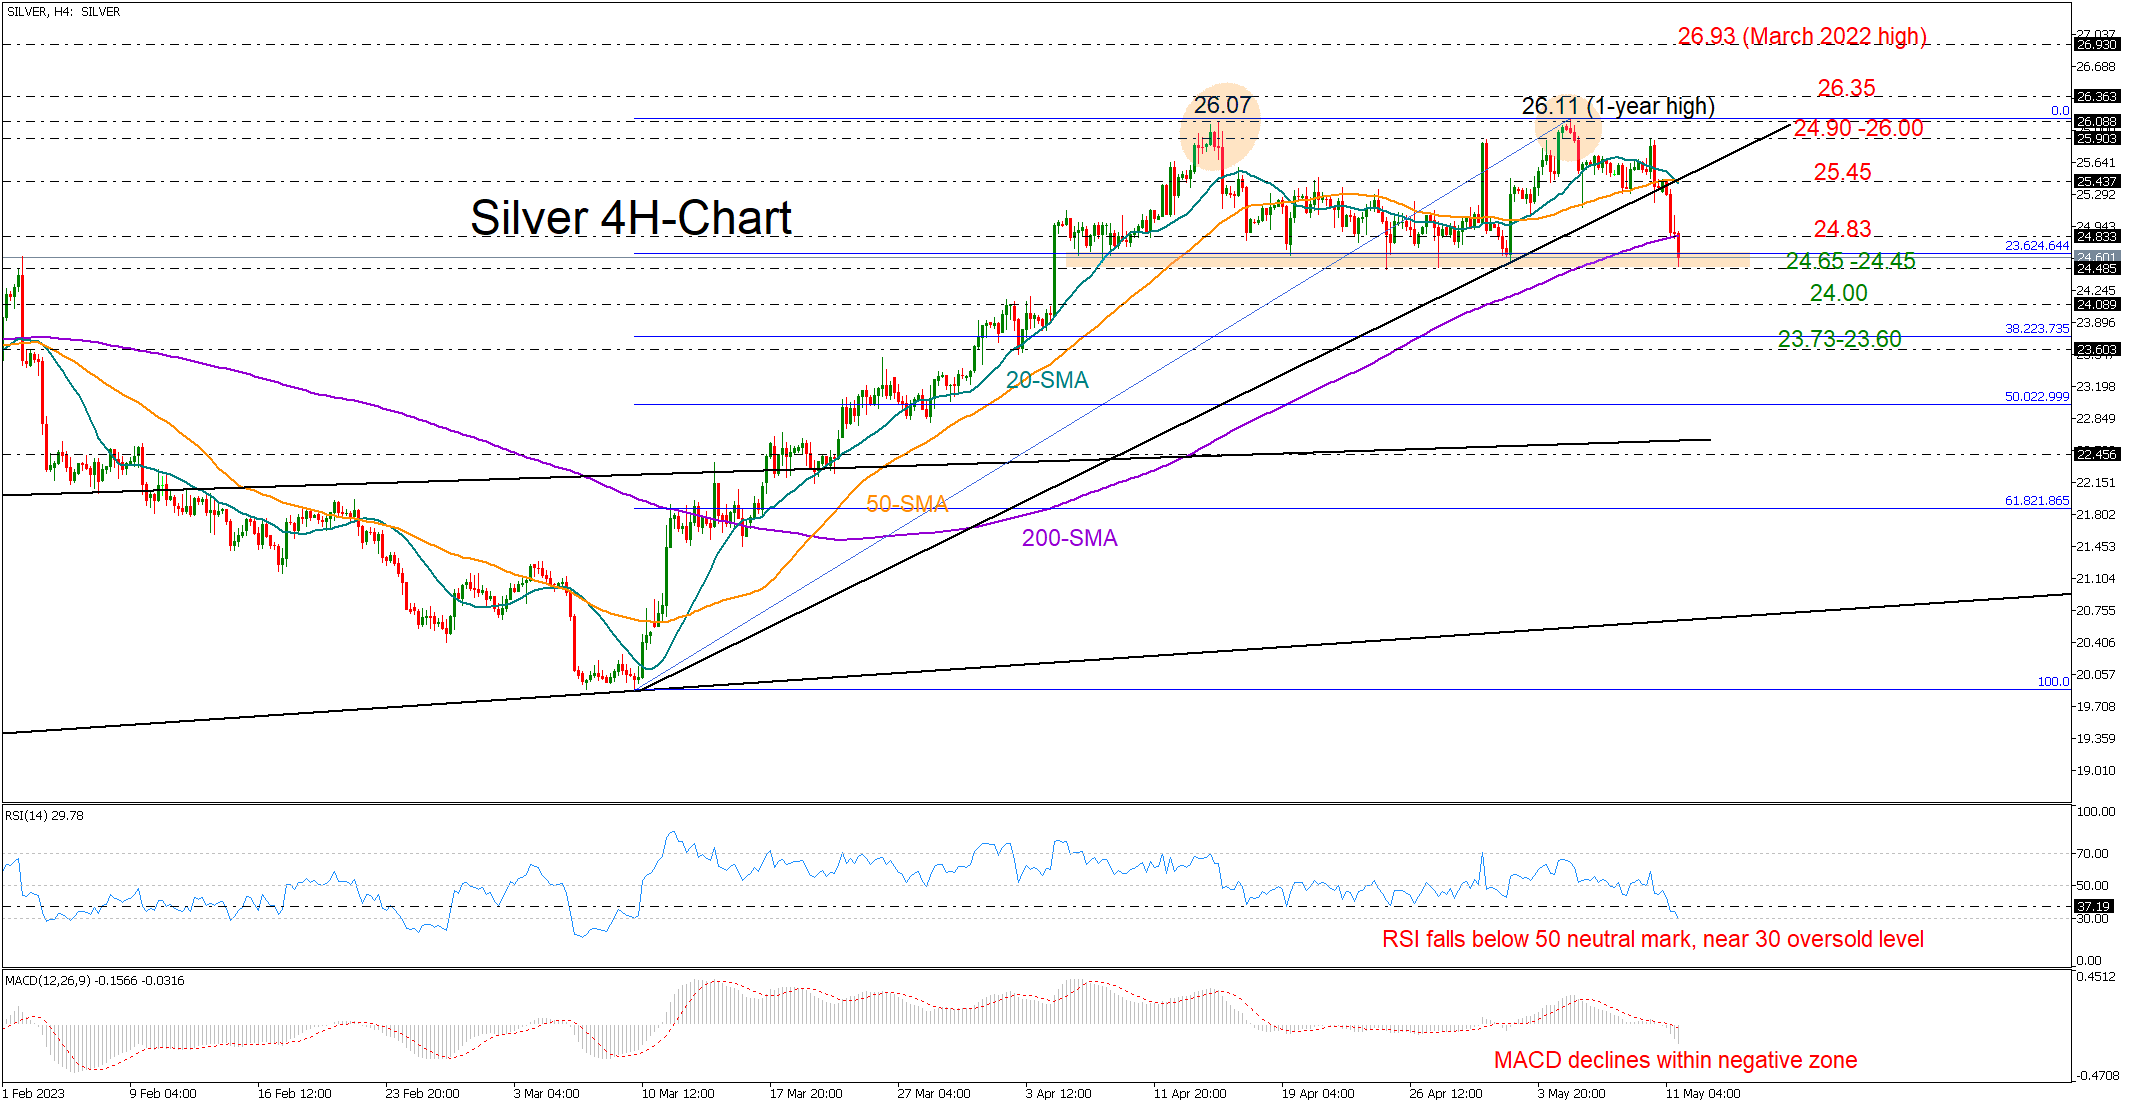
Silver got rejected near April’s high of 26.00 last week, charting a bearish double top pattern in the short-term picture after an impressive two-month rally.
Selling forces may persist in the short term according to the falling momentum indicators, though with the RSI approaching its 30 oversold mark, some consolidation cannot be ruled out within the 24.83-24.45 region. This is formed by the 23.6% Fibonacci retracement of the latest upleg and the neckline of the bearish pattern.
Should the bears breach the 24.45 floor, downgrading the big picture back to neutral, the decline may stretch towards the 24.00 number and then head for the 38.2% Fibonacci level of 23.73.
Otherwise, if the price returns above the 200-period SMA, it may crawl up to meet the 20- and 50-day SMAs at 25.45. A successful penetration higher could take a breather near 25.90 before touching the 26.00 ceiling. Beyond the latter point, the price may pause around the 26.35 barrier before advancing towards the March 2022 peak of 26.93.
In short, silver is exposed to a bearish trend reversal, with traders awaiting confirmation below 24.45.
Copper Futures Collapse to a Fresh 2023 Low
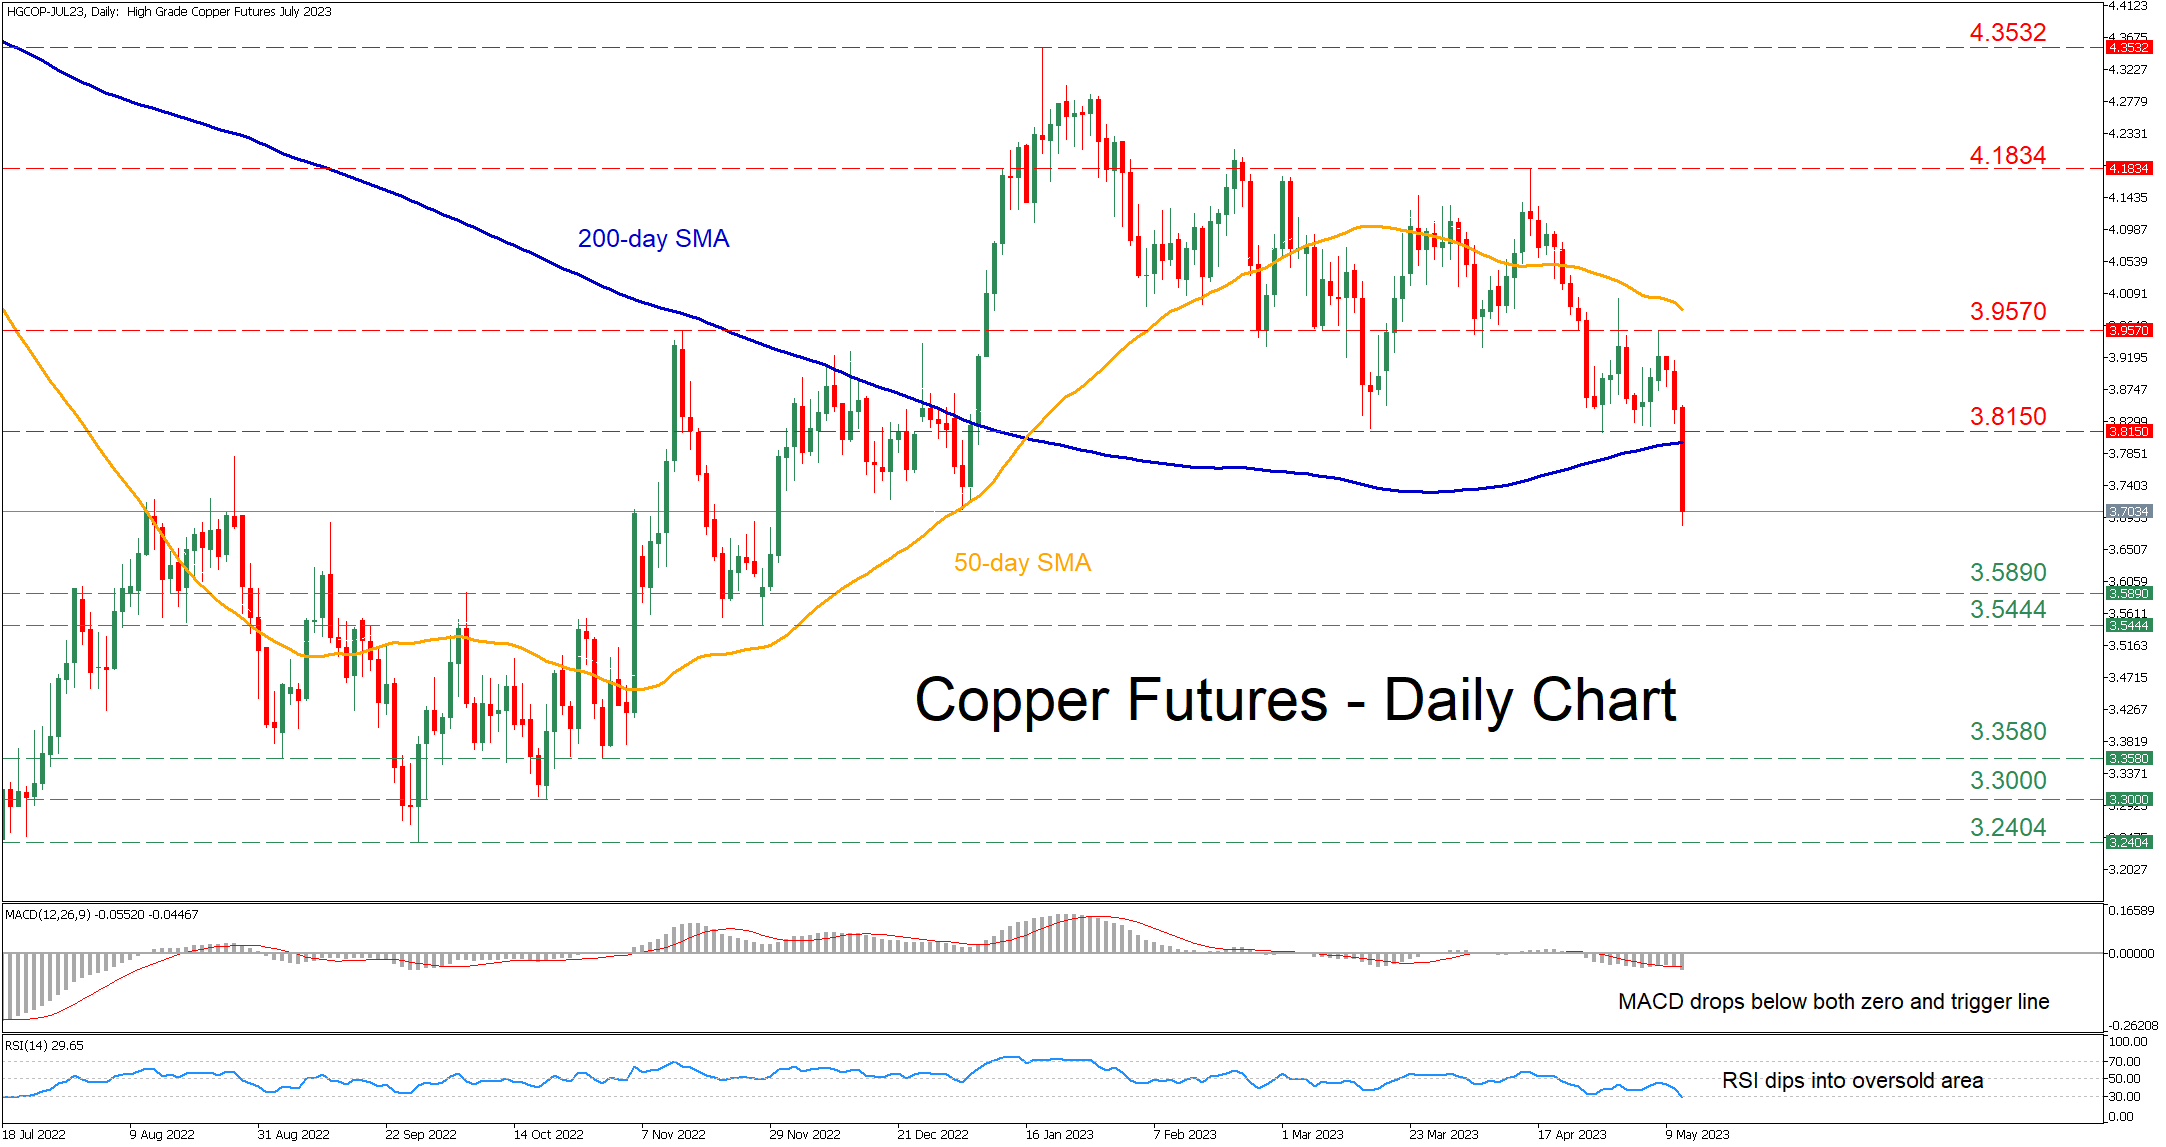
Copper futures (HGCOP, July delivery) have been in a steady downtrend after peaking at the 2023 high of 4.3532 in mid-January. Moreover, the commodity experienced a huge downward spike in Thursday’s session, dropping beneath the 200-day simple moving average (SMA) and posting a fresh 2023 low.
This aggressive move to the downside is also reflected in the short-term oscillators. Specifically, the MACD dropped beneath its red signal line in the negative territory, while the RSI fell into its 30-oversold zone.
Should the recent decline extend, the price could challenge the 3.5890 hurdle before the November support of 3.5444 appears on the radar. Sliding beneath that floor, the commodity could then descend towards 3.3580, which served as strong support multiple times during late 2022. If that barricade fails, the October low of 3.3000 may provide downside protection.
Alternatively, bullish actions could propel the price back above its 200-day SMA to test the previous support of 3.8150, which could act as resistance in the future. Surpassing that level, the price may extend its advance towards the November high of 3.9570. Conquering this barricade, the bulls might aim for the April peak of 4.1834.
Overall, copper futures sliced aggressively through the 200-day SMA and posted a fresh 2023 low in today’s session. However, the price has reached oversold conditions, thus an upside correction should not be ruled out.
AUD/USD: Australian Dollar Loses Ground on Weak China’s Inflation Data, Higher US Dollar
Australian dollar lost ground and declined almost 1.2% until the start of US session on Thursday, hit by weaker than expected China’s April inflation data.
US weekly jobless claims rose well above consensus and reached the highest since Oct 2021, adding to worries that higher interest rates were starting to hurt labor market and lifted the US dollar.
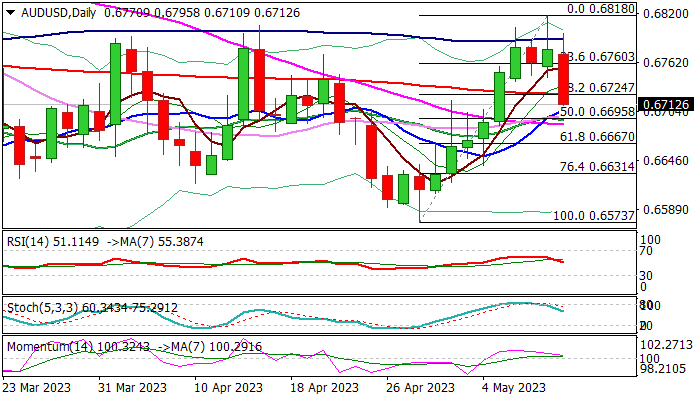
Fresh acceleration lower broke through pivotal support at 0.6724 (200DMA / Fibo 38.2% of 0.6573/0.6818 recovery leg), adding to initial negative signal on bull-trap above 100DMA (0.6790).
Bears look for a verification on daily close below 0.6724 level and further retracement of 0.6573/0.6818 advance, with break through next key support at 0.6695 (daily Kijun-sen / base of thick daily Ichimoku cloud) to generate fresh bearish signal and further weaken near-term structure, as daily studies are still mixed.
Caution on failure to register close below 200DMA and possible bounce, which would point to a healthy correction of 0.6573/0.6818 and keep alive hopes for fresh push higher.
Res: 0.6724; 0.6760; 0.6790; 0.6818.
Sup: 0.6695; 0.6667; 0.6631; 0.6591.
Sunset Market Commentary
MarketsThe Bank of England as expected raised the policy rate by 25 bps to 4.50% in 7-2 vote. Reasons for the hike are obvious: inflation is more than fivefold the 2% target. Recent data even forced the BoE to lift the path again. Prices in 2023Q4 could still rise 5.1% vs 3.9% expected in February. Pressures should have eased to 2.3% (vs 1.4%) end next year before dropping sub 2% in the subsequent period running through 2026Q2. The BoE judges inflation risks to be significantly skewed to the upside as second-round effects may take longer to unwind. Governor Bailey during the press conference was even more outspoken: “second round effects are unlikely to go away”. Growth projections saw the largest upward revision in MPC history. The UK economy is able to escape a recession thanks to stronger global growth, lower energy prices, fiscal support and a tight labour market. The BoE also downplayed the impact on GDP from the tightening in credit conditions following the recent banking turmoil. Activity is expected to grow 0.25% this year (vs -0.5% in February) and 0.75% in 2024 and 2025 (vs -0.25% and +0.25% respectively). Unemployment would remain below 4% until the end of next year and may rise to 4.5% by 2025. All of these forecasts are based on market expectations for the policy rate to peak around 4.75% at the end of this year. The BoE indeed does not rule out further tightening, but keeps it conditional on evidence of more persistent inflationary pressures. Money markets nevertheless stick to their 4.75% terminal rate expectations. UK yields tried a comeback but are still down 9.3-12.7 bps for the day, caught in core bond yields’ slipstream. US and German yields drop in the area of 7.7-11 bps across the curve with Bunds slightly outperforming. Declines extended after second-tier US data (weekly jobless claims, PPI) hit the lower end of expectations. Additional sterling gains after a recent rally were short-lived. EUR/GBP hit an intraday low of 0.866 before reverting to a 0.87 opening level. The dollar and especially the Japanese yen are better bid as general risk sentiment deteriorated throughout European and going into US dealings. The EuroStoxx50 swapped a 0.8% gain for a 0.4% loss. WS opens mostly lower. EUR/USD falls towards 1.092. USD/JPY eases to 133.85 and EUR/JPY loses more than a big figure to 146.42. News & Views
According to the ECB Consumer expectations survey of March published today, consumer inflation expectations increased significantly. Median expectations for inflation over the next 12 months rose from 4.6% to 5.0% and from 2.4% to 2.9% for the three years ahead. European consumers expected nominal income to increase 1.3% over the next year. Nominal spending was seen rising to 7.1% from 6.6%. Expectations on growth turned slightly more negative from -0.9% to -1.0%, translating into an expected rise in the future unemployment rate from 11.5% to 11.7%. The perceived current unemployment rate stands at 11.3%. European consumers grew slightly more optimistic on the price of their home over the coming year (2.7%) though this remains well below the levels seen mid last year. In a context of tightened access to credit, expectations for mortgage rates in the 12 months ahead edged up to 5.1%, 1.8% higher compared to expectations at the start of 2022.
CPI inflation in the Czech Republic slowed more than expected in April. Prices declined 0.2% M/M, bringing the Y/Y measure down to 12.7% Y/Y (was 0.1% M/M and 15.0% Y/Y in March). The outcome was also below the 13.2% May forecast of the Czech National Bank. The decline was for an important part due to food prices, which showed the first m/m decline since October 2021. Prices of food and non-alcoholic beverages dropped 1.6% M/M, alcoholic beverages and tobacco eased 0.9%. Transport (-0.2%), recreation and culture (-1.2%) and package holidays were lower than in March. Household equipment (+1.1%), health (1.0%) restaurants and hotels (0.8%) and goods with administered prices (0.5%) still showed higher prices. A CNB comment indicated that also core inflation eased slightly more than expected to 10.0% VS 10.2% expected, but warned that the deviation from the April forecast should not be overestimated given the volatile nature of food prices. Last week, the CNB warned that at its next meeting it will decide whether rates will remain unchanged or increase. In its assessment, CNB will keep a close eye at wages and fiscal policy. Even so, Czech money market rates, especially for tenors around the end of the year and early next year declined up to 20-25 bps. The koruna eased, albeit modestly, with EUR/CZK rebounding from 23.45 to 23.51.
AUD/USD Mid-Day Report
Daily Pivots: (S1) 0.6743; (P) 0.6780; (R1) 0.6817; More...
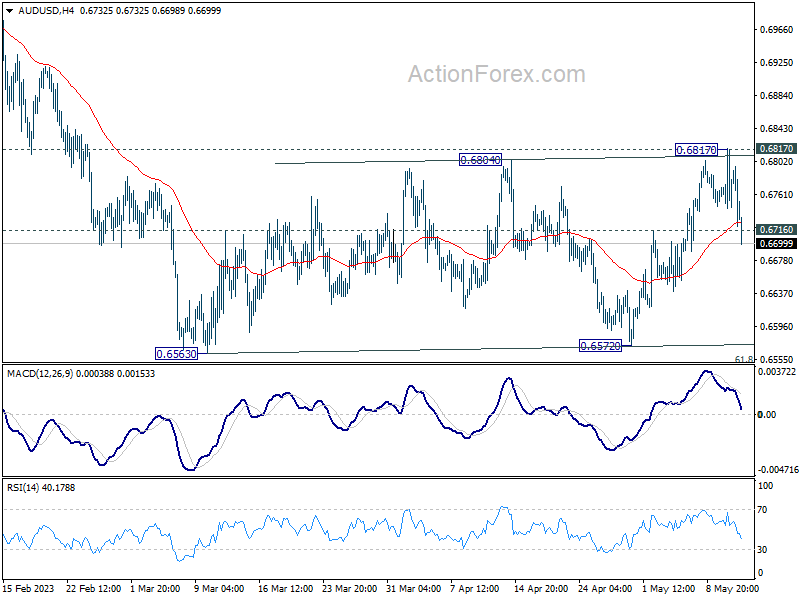
AUD/USD's break of 0.6716 minor support argues that rebound from 0.6572 has completed. Also, the corrective pattern from 0.6563 might be finished too. Intraday bias is back on the downside for retesting 0.6563 low. Firm break there will resume larger fall from 0.7156. For now, risk will stay mildly on the downside as long as 0.6817 resistance holds, in case of recovery.
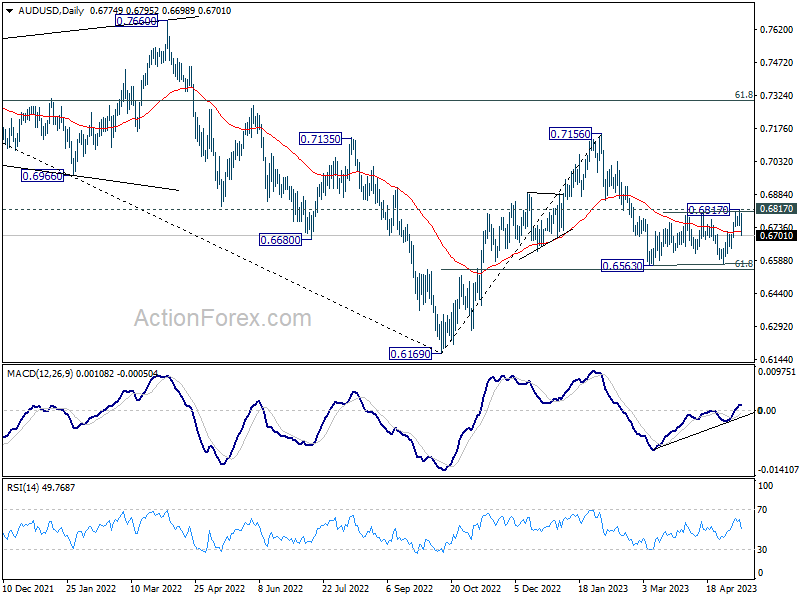
In the bigger picture, as long as 61.8% retracement of 0.6169 to 0.7156 at 0.6546 holds, the decline from 0.7156 is seen as a correction to rally from 0.6169 (2022 low) only. Another rise should still be seen through 0.7156 at a later stage. However, sustained break of 0.6546 will raise the chance of long term down trend resumption through 0.6169 low.
EUR/JPY Mid-Day Outlook
Daily Pivots: (S1) 146.86; (P) 147.76; (R1) 148.49; More....
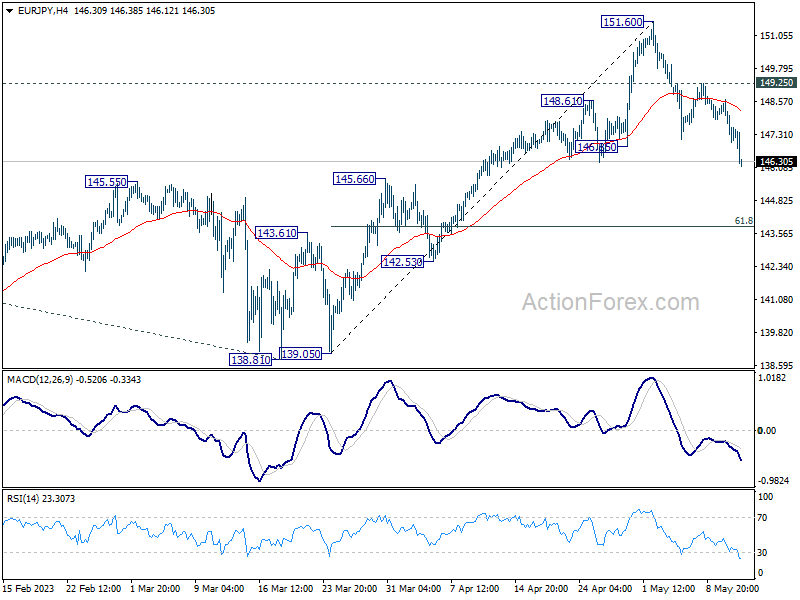
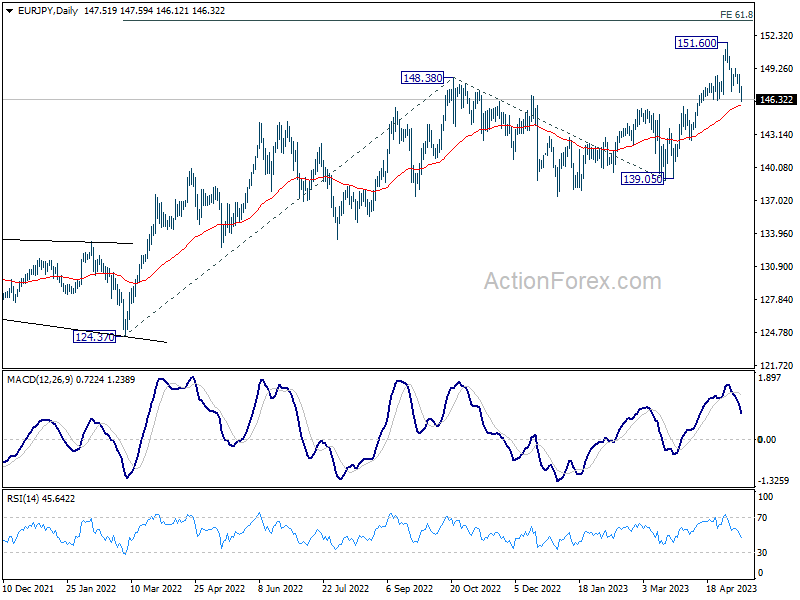
EUR/JPY's break of 165.85 support confirms short term topping at 151.60. Intraday bias is now back on the downside for 61.8% retracement of 139.05 to 151.60 at 143.84. But strong support should emerge above 139.05 to complete the correction and bring rebound. On the upside, break of 149.25 minor resistance will turn bias back to the upside for retesting 151.60 high.
In the bigger picture, current development indicates that rise from 114.42 (2020 low) is in progress. Next target is 61.8% projection of 124.37 to 148.38 from 139.05 at 154.14. Sustained break there will pave the way to 100% projection at 162.82. For now, medium term outlook will remain bullish as long as 139.05 support holds, even in case of deep pull back.
USD/JPY Mid-Day Outlook
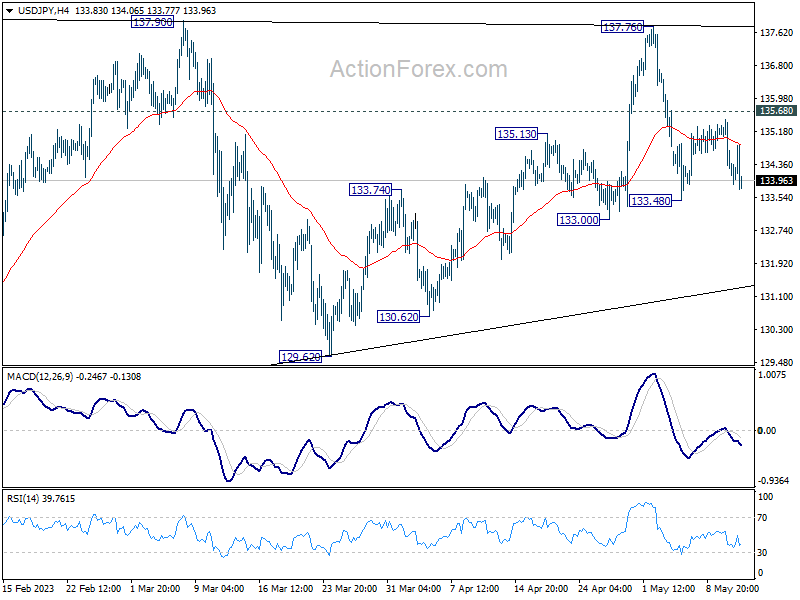
Daily Pivots: (S1) 133.84; (P) 134.65; (R1) 135.20; More...
Intraday bias in USD/JPY remains neutral first and further decline is in favor with 135.68 resistance intact. Fall from 137.76 is seen as the third leg of the pattern from 137.90. Below 133.48 will target 133.00 first, break will target 129.62 support. Still, as long as 129.62 holds, larger rebound from 127.20 is still in favor to resume at a later stage. On the upside, above 135.68 minor resistance will turn bias back to the upside for 137.76/90 instead.
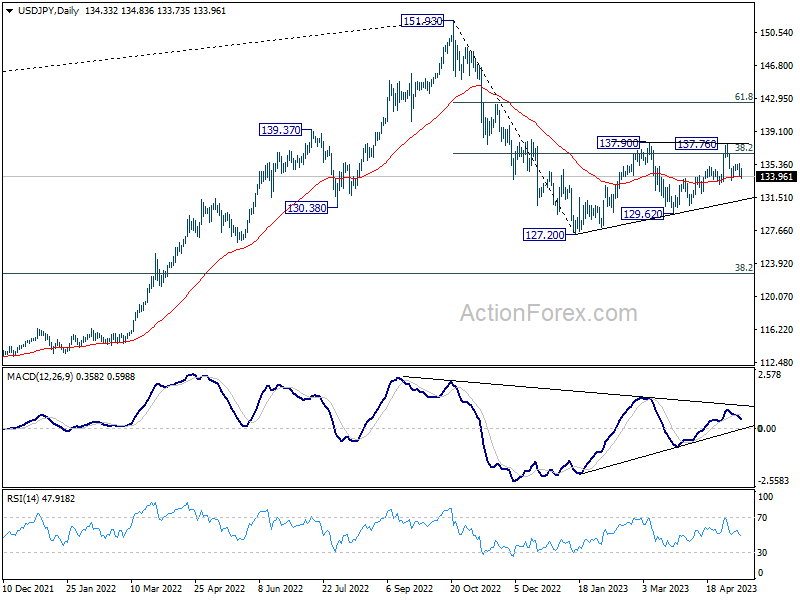
In the bigger picture, price actions from 151.93 high are currently seen as a corrective pattern to the long term up trend. The first leg should have completed at 127.20. Rebound from there is seen as the second leg. Sustained break of 38.2% retracement of 151.93 to 127.20 at 136.34 will bring stronger rebound to 61.8% retracement at 142.48. Meanwhile, break of 129.62 will argue that the third leg is starting through 127.20 low.
USD/CHF Mid-Day Outlook
Daily Pivots: (S1) 0.8868; (P) 0.8897; (R1) 0.8927; More...
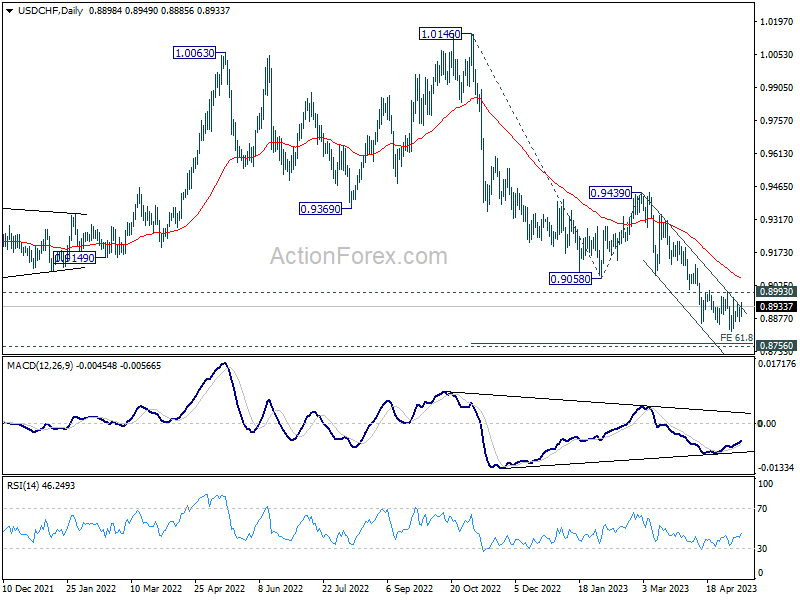
No change in USD/CHF's outlook and intraday bias remains neutral for the moment. While down trend from 1.0146 could still extend lower, strong support should be seen from 61.8% projection of 1.0146 to 0.9058 from 0.9439 at 0.8767, which is close to 0.8756 long term support, to bring rebound, at least on first attempt. On the upside, break of 0.8993 resistance will indicate short term bottoming, on bullish convergence condition in 4H MACD, and turn bias back to the upside for stronger rebound to 55 D EMA (now at 0.9054) and possibly above.
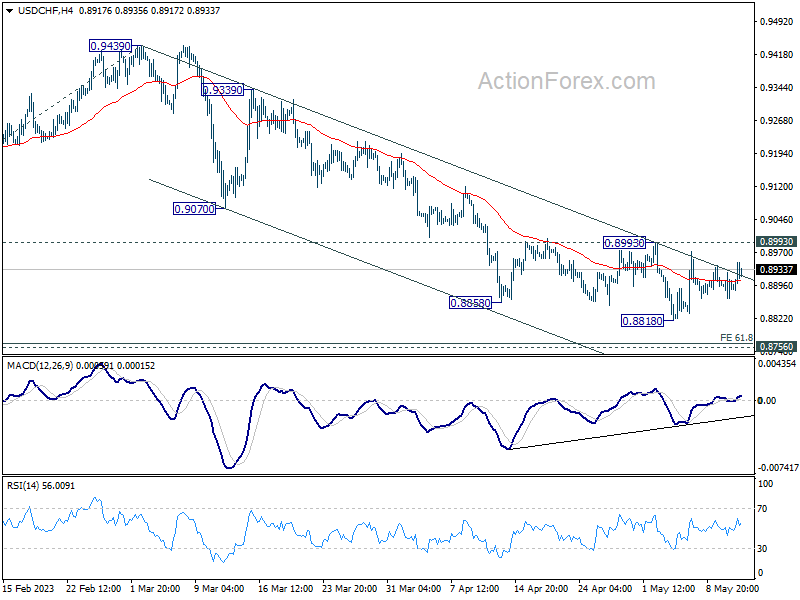
In the bigger picture, fall from 1.1046 (2022 high) is seen as a leg in the long term range pattern from 1.0342 (2016 high). So, downside should be contained by 0.8756 to bring reversal. Sustained break of 0.9058 support turned resistance will be the first sign of medium term bottoming. However, decisive break of 0.8756 will carry larger bearish implications.
EUR/USD Mid-Day Outlook
Daily Pivots: (S1) 1.0948; (P) 1.0977; (R1) 1.1013; More...
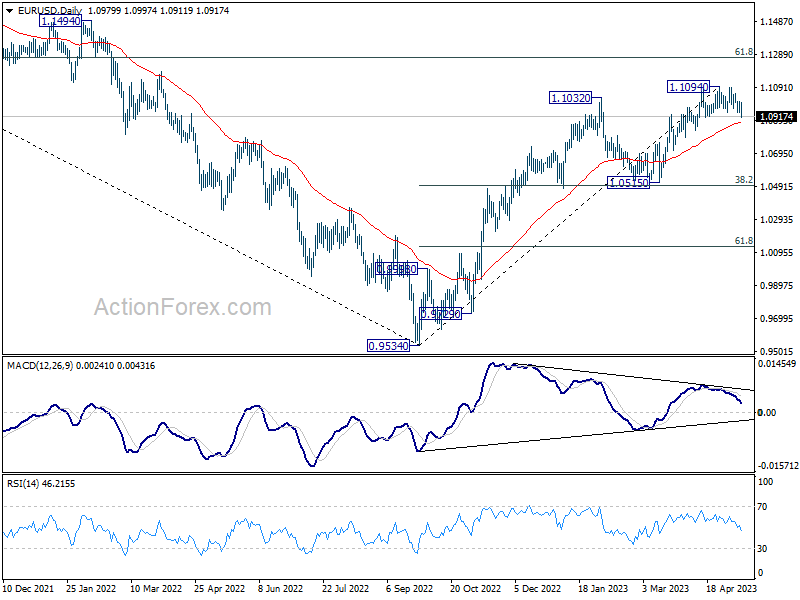
Intraday bias remains neutral for the moment. On the upside, firm break of 1.1094 will resume larger up trend to 1.1273 fibonacci level. However, considering bearish divergence condition in 4H MACD, break of 1.0908 support will indicate short term topping and turn bias back to the downside. Further break of 1.0830 will target 1.0515 key support level.
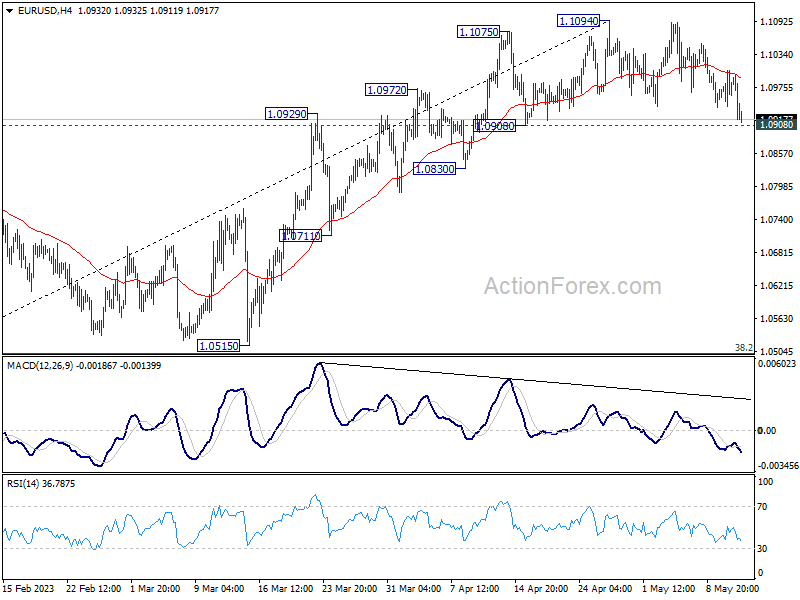
In the bigger picture, rise from 0.9534 (2022 low) is in progress for 61.8% retracement of 1.2348 (2021 high) to 0.9534 at 1.1273. Sustained break there will solidify the case of bullish trend reversal and target 1.2348 resistance next (2021 high). This will now remain the favored case as long as 1.0515 support holds, even in case of deeper pull back.