Sample Category Title
GBP/USD Edges Lower Ahead of BoE Meeting
- BoE likely to raise rates by 25 bp
- US to release PPI and unemployment claims later today
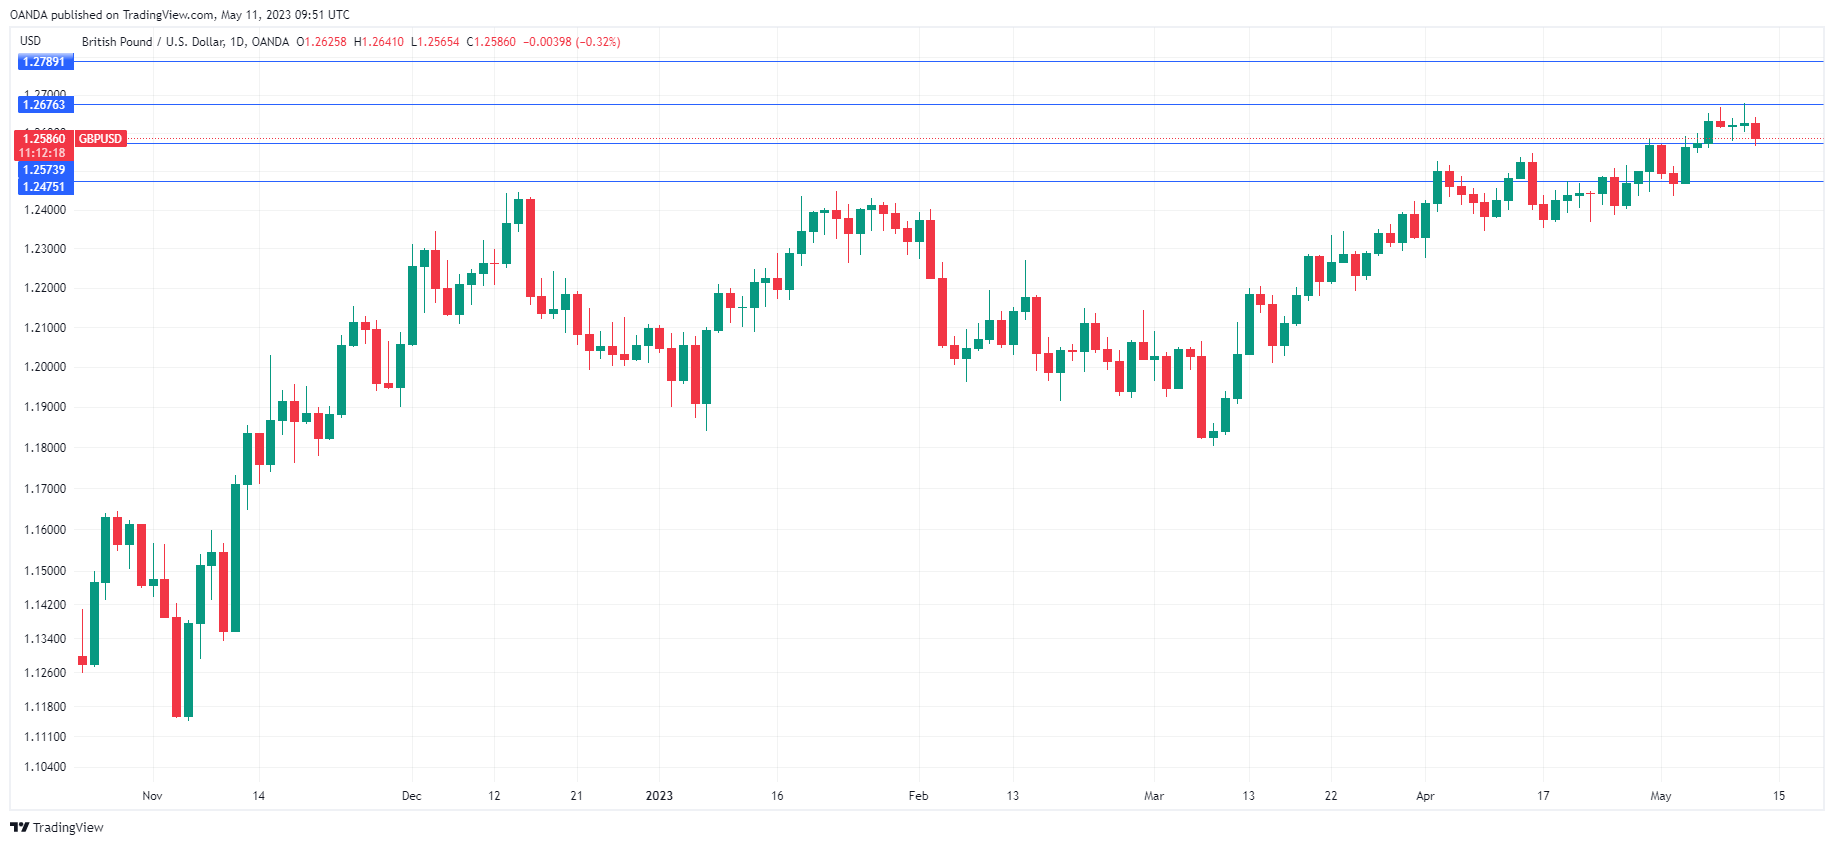
GBP/USD is trading at 1.2587 in Europe, down 0.30% on the day.
BoE expected to raise rates by 25 bp
The Bank of England is expected to raise rates today for a 12th consecutive time, with a 25-basis point hike. This would bring the benchmark cash rate to 4.50%. The BoE can’t be faulted for not being aggressive, but it failed to react to rising inflation fast enough and has found itself playing catch-up with inflation. In March, CPI dipped but remained in double digits, at 10.1%. This has led to a severe cost-of-living crisis and the BoE has little choice but to continue raising rates until it is clear that inflation is on a downswing.
The BoE remains optimistic and projected in February that inflation would fall to 3% within 12 months. This may be a bit of a stretch but I expect inflation to fall more quickly as the rate hikes make themselves felt and cool economic activity. The rate hike itself is unlikely to move the dial on the pound, but Bank statement and updated economic forecasts, especially with regard to inflation, could result in a market reaction.
US inflation dips lower
The US inflation report for April showed a small drop, with headline CPI falling from 5.0% to 4.9%. Still, the financial markets were pleased and the US dollar lost ground. Investors appeared to focus on one particular indicator that declined (CPI Core Services Ex-Housing) while ignoring that Core CPI was almost unchanged at 5.5%.
The markets are widely expecting a pause in June, with a 91% probability, according to the CME Group. With the core rate remaining sticky, I am doubtful that the Fed is considering any rate cuts at this stage, although the markets have mostly priced in a cut in September.
GBP/USD Technical
- GBP/USD tested support at 1.2573 earlier in the day. The next support level is 1.2475
- 1.2676 and 1.2789 are the next resistance lines
WTI Oil Futures Set Bullish Tone, But Too Early for Trend Reversal
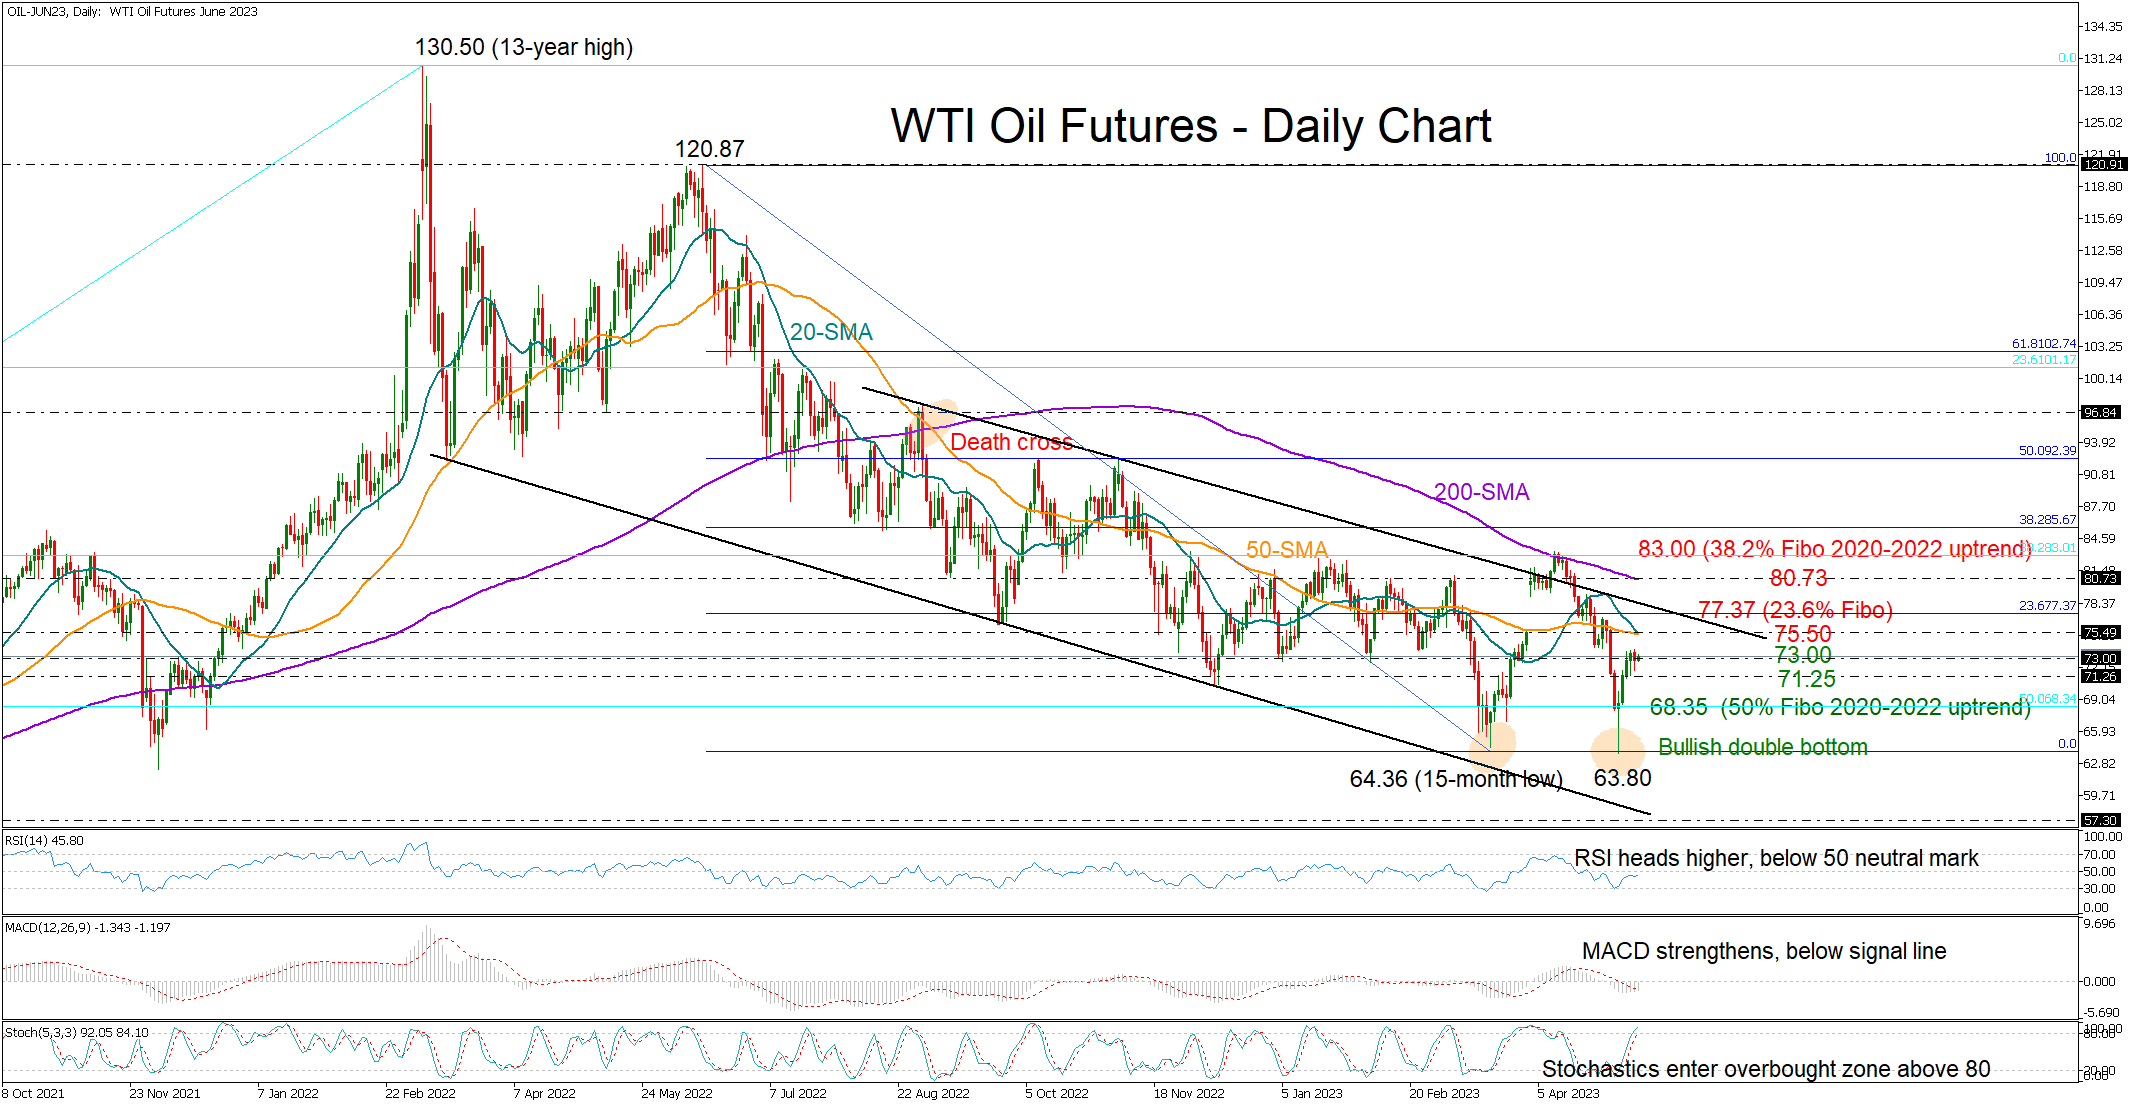
WTI oil futures bounced back into the 70.00 territory after its latest downfall stalled marginally below the March 15-month low of 64.36.
While the market seems to have formed a bullish double bottom pattern in the short-term picture, flagging a potential upside trend reversal, a confirmation signal could appear significantly higher above 83.00. In other trend signals, the simple moving averages (SMAs) have yet to post bullish crosses while maintaining a downward trajectory, warning that a change in the market direction could be a long battle.
Meanwhile, the momentum indicators have shown some improvement, with the RSI pivoting higher in the bearish area and the MACD gradually strengthening towards its red signal line. However, the indicators have not entered the bullish region yet, suggesting that traders may retain some caution in the coming sessions.
The 20- and 50-day SMAs could be the first obstacles on the upside near 75.50. Surpassing that border, the spotlight will immediately fall on the 23.6% Fibonacci retracement of the 2020-2022 uptrend at 77.37. Notably, the upper boundary of the broad bearish channel is located in the same region. Therefore, a decisive close above that bar might be a prerequisite to reaching the constraining 200-day SMA at 80.70 and then the 38.2% Fibonacci retracement of the 120.87-64.36 downtrend at 83.00.
In the event the price slips below the nearby support of 73.00, it may initially test its weekly lows around 71.25 before diving towards the 50% Fibonacci mark of the 2020-2022 uptrend at 68.35. Another bearish correction below 68.00 could bring the 65.87 handle under examination ahead of the 64.36 and 63.80 lows.
Summing up, although WTI oil futures have set a bullish tone in the short-term picture, it may take some effort for the market to exit its broad negative trajectory.
S&P 500 Reacts Positively to Declining Inflation
Yesterday's news showed that the consumer price index fell to 4.9%. The last time inflation was below 5% was in May 2021. Thus, the Fed has received new evidence of success in its fight against rising prices, and market participants now expect that a halt will be made in a series of interest rate hikes.
The stock index reacted positively. As a result of yesterday, the price of the E-mini S&P 500 futures increased, and this morning it is growing towards yesterday's highs.
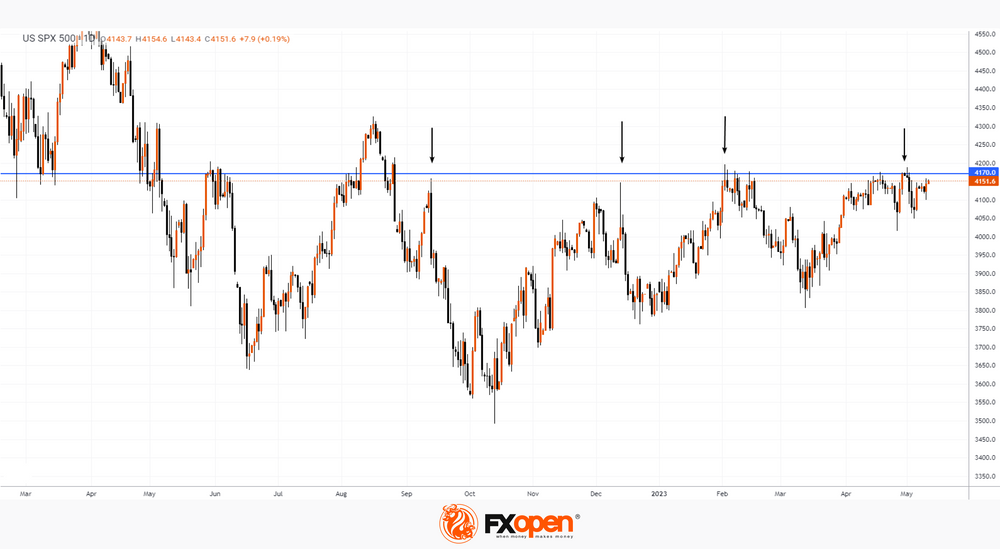
The E-mini S&P 500 futures chart also shows that the contract value is near the important resistance level of 4,170.
According to analysts at UBS Bank, the price will be flat. And according to analysts at Morgan Stanley, US stocks will decline as there is a possibility of the economy plunging into recession and keeping Fed rates at a high level.
It is also unlikely that the unresolved problem with the US debt ceiling will contribute to optimism in the stock market. Therefore, level 4,170 may continue to provide resistance as it did before (shown by arrows).
EUR/GBP Technical: Minor Downtrend Intact
- EUR/GBP is still evolving within a major sideways range since August 2017 with its key resistance and support at 0.9300 and 0.8300.
- A minor downtrend phase has started to develop from its 3 February 2023 high of 0.8979.
- Short-term downside momentum remains intact below 0.8750 key short-term resistance.
Since the start of this week, the EUR/GBP cross pair has continued its drop by 0.9% to print its current intraweek low of 0.8671 where market participants anticipant that the Bank of England (BoE) is likely to maintain its hawkish monetary policy stance throughout 2023 after its monetary policy decision due later today.
It is widely expected that BoE will hike its policy interest rate by another 25 basis points to 4.5%, its 12th consecutive rise and it is still way behind a red-hot March CPI print of 10.1% year-on-year inflationary growth for the UK.
Let’s now take a look at the recent EUR/GBP movements from a technical analysis perspective.
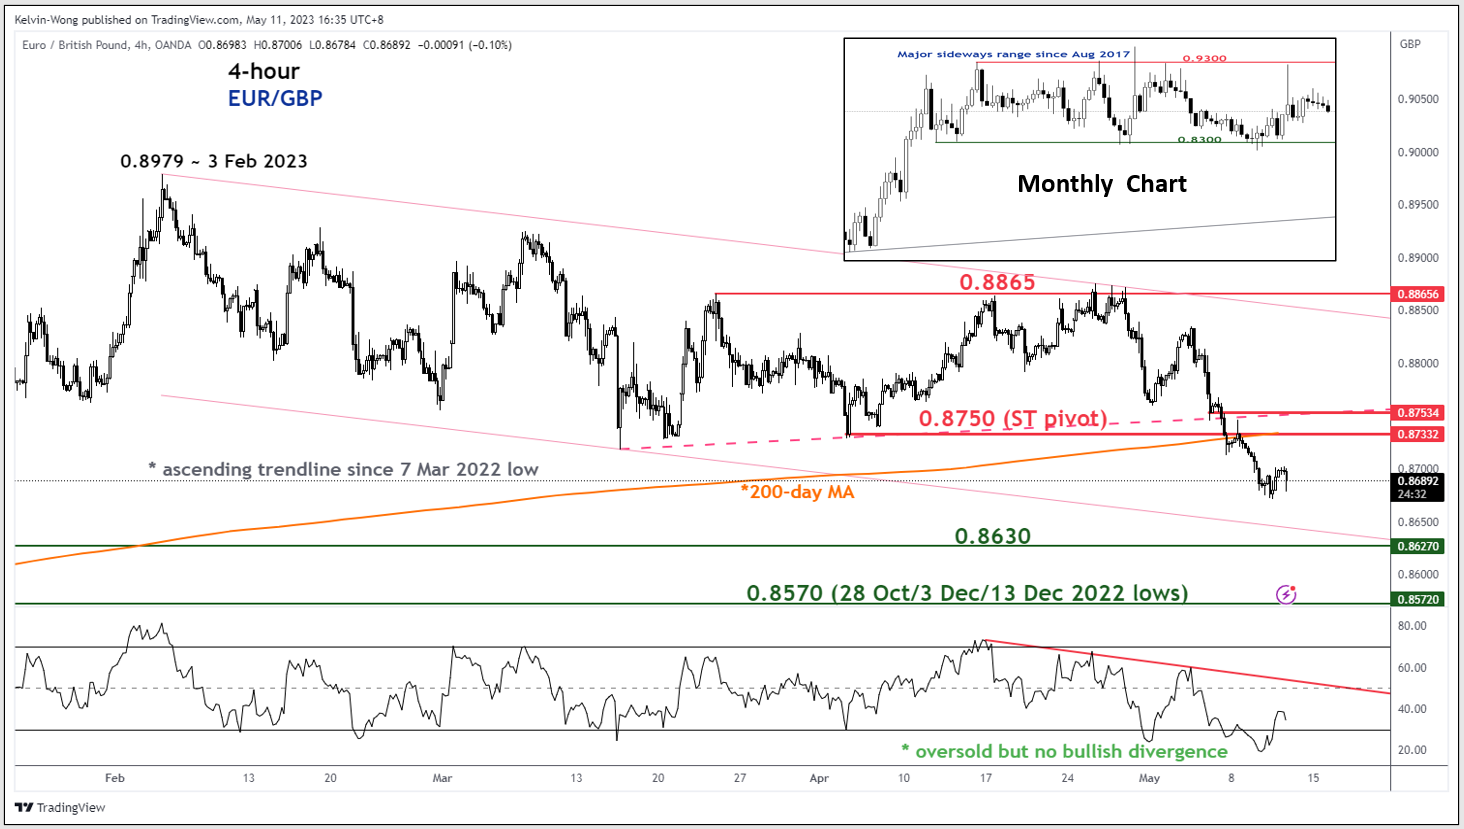
Fig 1: EUR/GBP trend as of 11 May 2023 (Source: TradingView, click to enlarge chart)
Since its 3 February 2023 high of 0.8979, the EUR/GBP cross rate has started to evolve into a minor downtrend phase with the upper and lower limits of its short-term descending channel at 0.8865 and 0.8630 respectively. In the longer-term (monthly chart), it is still trapped inside a major sideways range configuration since August 2017.
Since last Friday, 5 May, its price actions have broken and traded below the key 200-day moving average now acting as a resistance at around 0.8730. In addition, the 4-hour RSI oscillator has rebounded from its recently reached oversold region (below 30%) but has not formed any bullish divergence signal yet.
In addition, the 4-hour RSI is still capped below by a corresponding descending resistance at the 50% level. These observations suggest that short-term downside momentum remains intact. The next intermediate support to watch will be at 0.8630 and a break below it exposes the next support at 0.8570.
However, a clearance above 0.8750 short-term pivotal resistance negates the bearish tone to see the descending channel resistance coming in at around 0.8865 which also confluences with the minor swing high areas of 23 March/27 April 2023.
USD/JPY: Slight Bullish Bias Above Trendline Support But Near-Term Outlook Still Mixed
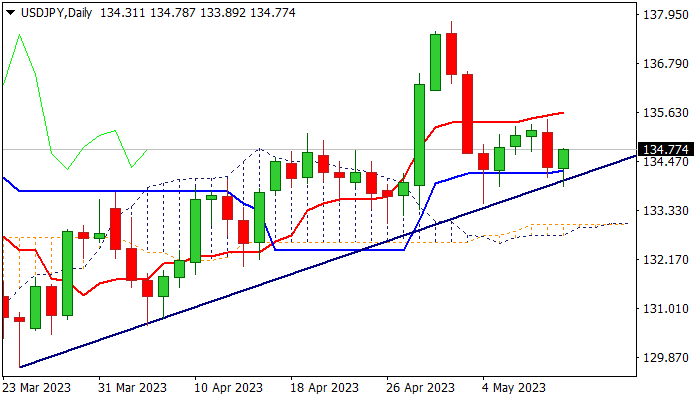
The USDJPY edges higher in early Thursday, keeping slight bullish bias as recent drops (larger pullback from May 2 peak at 137.77 and Wednesday’s dip) were contained by rising bull-trendline off 129.61 (Mar 24 low) and also registered several daily closes above daily Kijun-sen (134.27).
However, daily studies are still lacking clear direction signal as moving averages are in mixed setup and near-term action continues to range between daily Tenkan-sen (135.64) and daily Kijun-sen.
Bulls need a clear break above cracked Fibo barrier at 135.13 (38.2% of 137.77/133.50 bear-leg) to firm near-term structure, with lift above daily Tenkan-sen to spark stronger acceleration higher.
Conversely, loss of pivotal supports at 134.27/13 (daily Kijun-sen / trendline support) would weaken the tone and risk break of 133.50 pivot (May 4 trough), loss of which would signal a continuation of a bear-leg off 137.77 top
Res: 136.98; 137.90; 138.17; 139.58.
Sup: 136.14; 135.90; 135.10; 133.95.
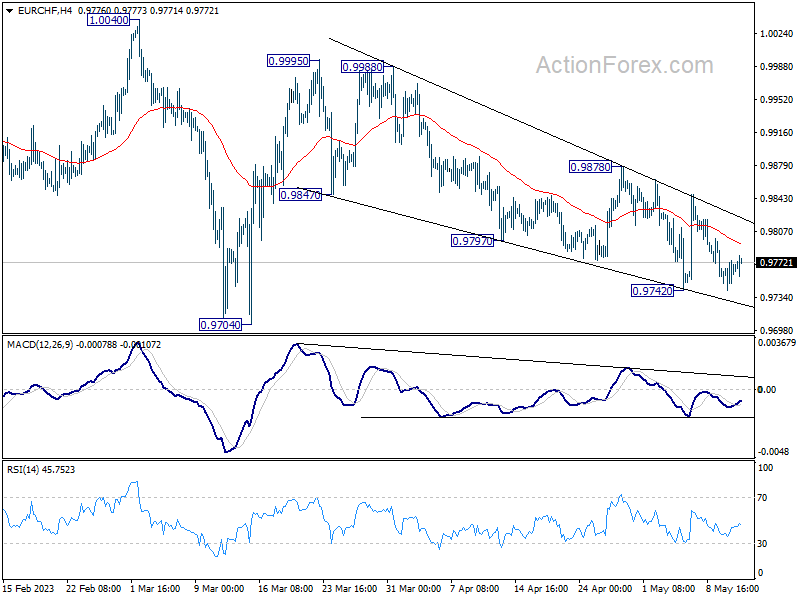
EUR/CHF Daily Outlook
Daily Pivots: (S1) 0.9751; (P) 0.9764; (R1) 0.9785; More...
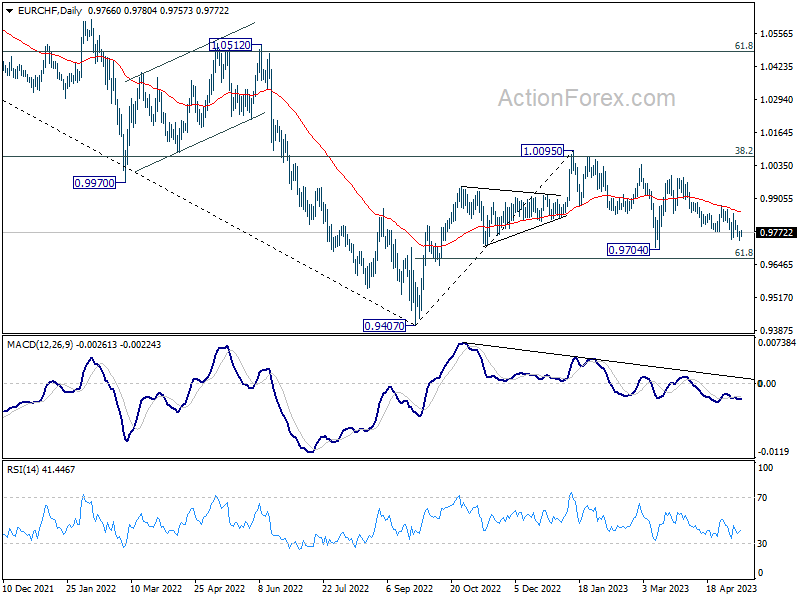
Intraday bias in EUR/CHF stays neutral and outlook is unchanged. Fall from 0.9995 is a correction to rise from 0.9704 only. Break of 0.9878 resistance will indicate that such correction has completed and target 0.9995. Firm break there should confirm that larger corrective decline from 1.0095 has completed at 0.9704 too.
In the bigger picture, prior rejection by 55 W EMA (now at 0.9971) and 38.2% retracement of 1.1149 to 0.9407 at 1.0072 suggests that medium term outlook is staying bearish. That is, down trend from 1.2004 is not completed yet and is in favor to resume through 0.9407 at a later stage. However, decisive break of 1.0095 resistance will raise the chance of bullish trend reversal. Rise from 0.9407 should then target 1.0505 cluster resistance (2020 low at 1.0505, 61.8% retracement of 1.1149 to 0.9407 at 1.1484).
EUR/GBP Daily Outlook
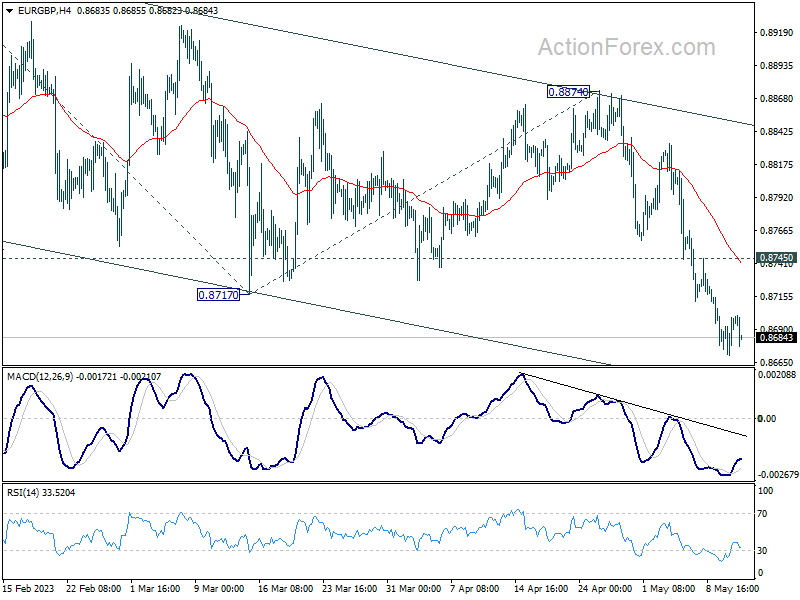
Daily Pivots: (S1) 0.8681; (P) 0.8690; (R1) 0.8709; More...
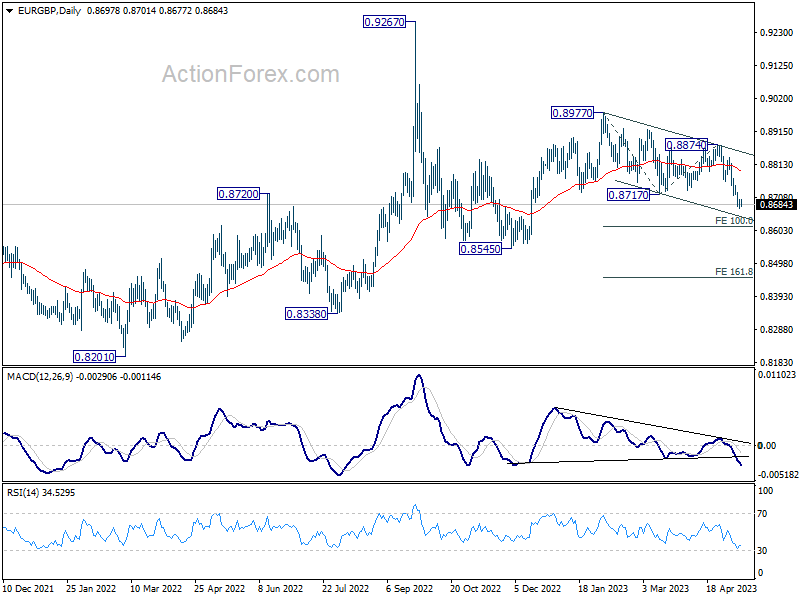
Further fall is expected in EUR/GBP as long as 0.8745 resistance holds. Current decline from 0.8977 should target 100% projection of 0.8977 to 0.8717 from 0.8874 at 0.8614. Firm break there will pave the way to 161.8% projection at 0.8453. On the upside, above 0.8745 minor resistance will turn intraday bias neutral first. But outlook will remain cautiously bearish as long as 0.8874 resistance holds.
In the bigger picture, current development argues that whole decline from 0.9267 (2022 high) is still in progress. This is part of the long term range pattern from 0.9499 (2020 high). Deeper fall would be seen to 0.8338 support, or further to 0.8201. This will now remain the favored case as long as 0.8874 resistance holds.
EUR/AUD Daily Outlook
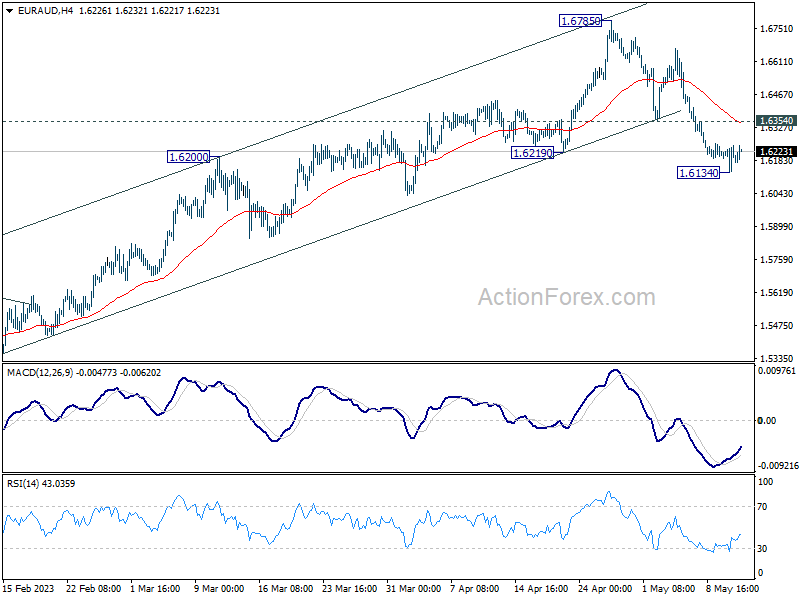
Daily Pivots: (S1) 1.6142; (P) 1.6196; (R1) 1.6255; More...
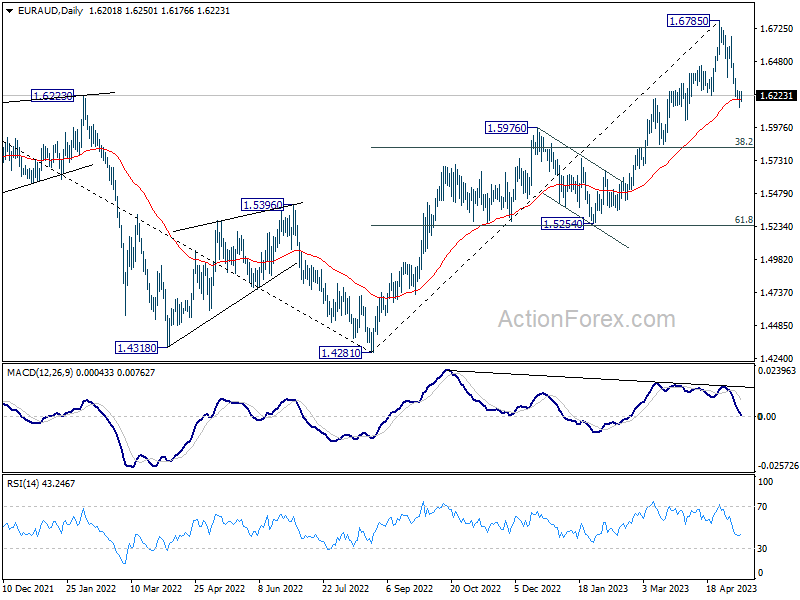
EUR/AUD dived to 1.6134 but quickly formed a temporary low there and recovered. Intraday bias is turned neutral first. Considering bearish divergence condition in D MACD, fall from 1.6785 might be correction to whole up trend form 1.4281. Deeper decline is in favor as long as 1.6354 support turned resistance holds. Below 1.6134 will target 1.5254/5976 support zone. Nevertheless, break of 1.6354 will revive near term bullishness and turn bias back to the upside for rebound.
In the bigger picture, the solid break of 1.6434 resistance argues that whole down trend from 1.9799 (2020 high) has completed at 1.4281 (2022 low). Further rise should be seen to 61.8% retracement of 1.9799 to 1.4281 at 1.7691 next. For now, outlook will stay bullish as long as 1.5976 resistance turned support holds, even in case of deep pull back.
EUR/JPY Daily Outlook
Daily Pivots: (S1) 146.86; (P) 147.76; (R1) 148.49; More....
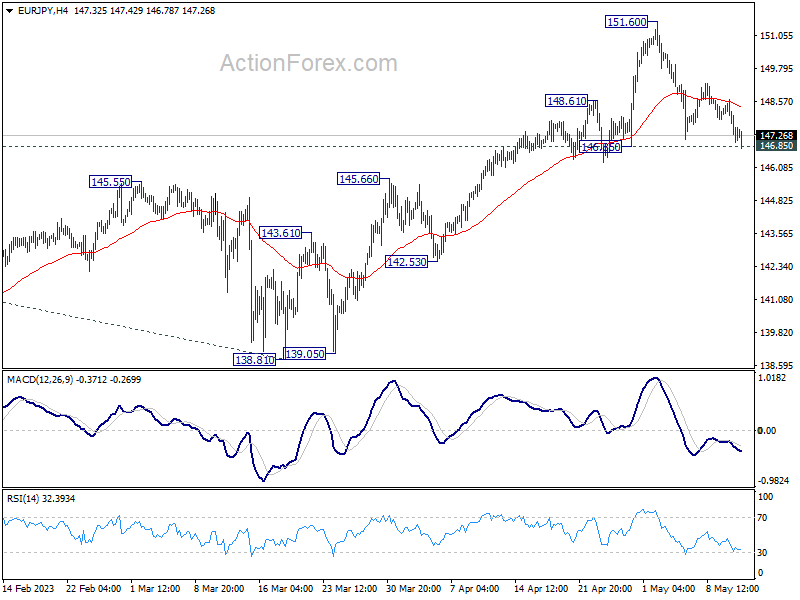
EUR/JPY is holding on to 146.85 support and intraday bias remains neutral at this point. Further rise is still expected with 146.85 support intact. On the upside, break of 151.60 will resume larger up trend to 153.64 projection level. Nevertheless, firm break of 146.85 will confirm short term topping and turn bias to the downside for deeper pull back.
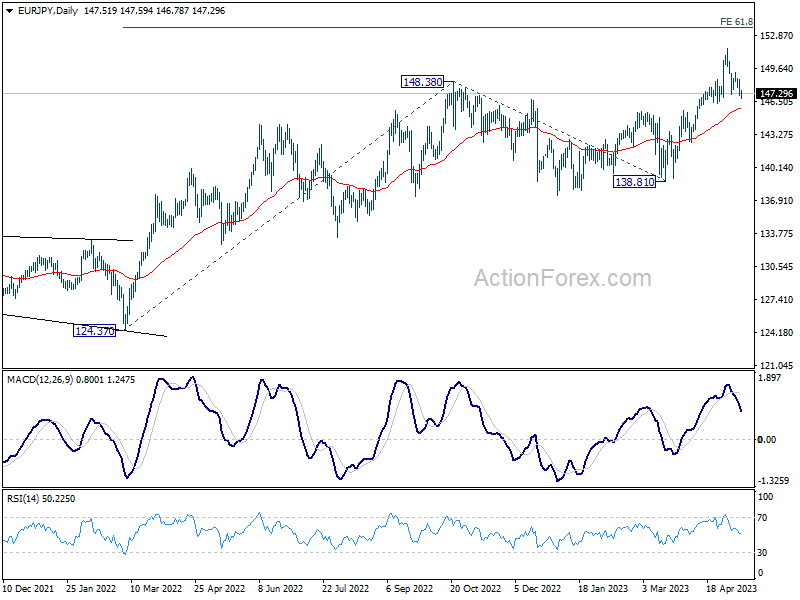
In the bigger picture, current development indicates that rise from 114.42 (2020 low) is in progress. Next target is 61.8% projection of 124.37 to 148.38 from 138.81 at 153.64. Sustained break there will pave the way to 100% projection at 162.82. For now, medium term outlook will remain bullish as long as 138.81 support holds, even in case of deep pull back.
GBP/JPY Daily Outlook
Daily Pivots: (S1) 168.79; (P) 169.98; (R1) 170.86; More...
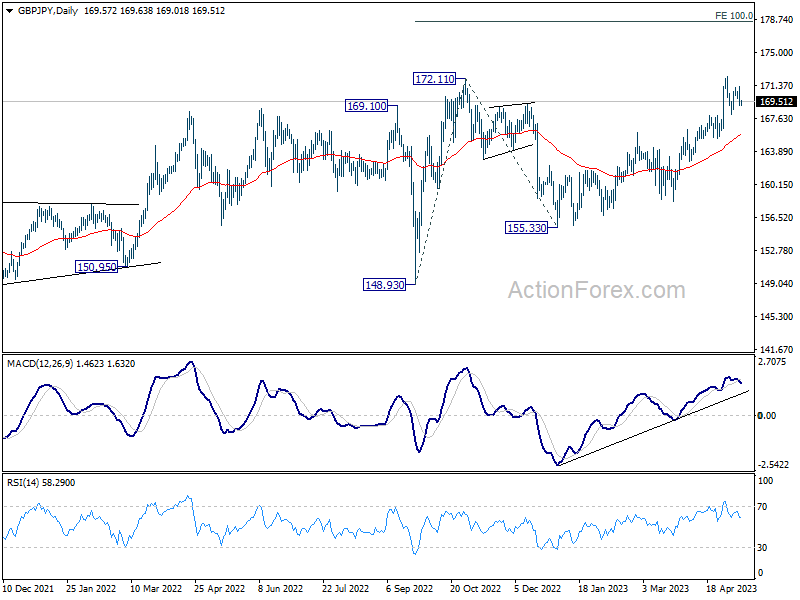
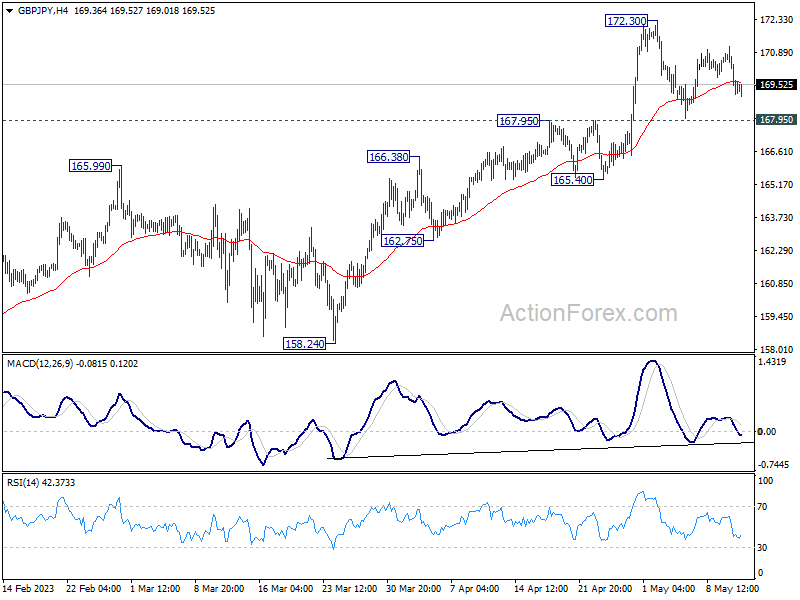
Range trading continues in GBP/JPY below 172.30 and intraday bias stays neutral at this point. Further rally is in favor with 167.95 resistance turned support intact. On the upside, break of 172.30 will resume larger up trend to 100% projection of 148.93 to 172.11 from 155.33 at 178.51. Nevertheless, firm break of 167.95 should confirm short term topping, and turn bias back to the downside for deeper pull back to 165.40 support instead.
In the bigger picture, based on current momentum, up trend from 123.94 (2020 low) is likely ready to resume. Next target is 161.8% projection of 122.75 (2016 low) to 156.59 (2018 high) from 123.94 at 178.69. This will now remain the favored case as long as 165.40 support holds, in case of retreat.