Sample Category Title
USD/CAD Daily Outlook
Daily Pivots: (S1) 1.3333; (P) 1.3374; (R1) 1.3413; More....
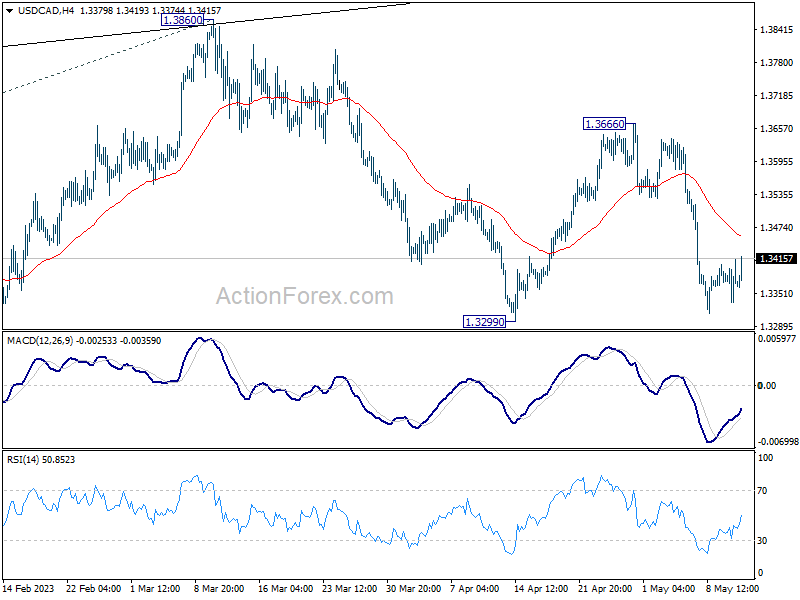
Intraday bias in USD/CAD remains neutral for the moment. Further fall is mildly in favor. Firm break of 1.3299 will extend the corrective pattern from 1.3976 lower to 100% projection of 1.3976 to 1.3224 from 1.3860 at 1.3395 next. nevertheless, sustained trading above 55 4H EMA (now at 1.3456) will bring stronger rebound back to 1.3666 resistance instead.
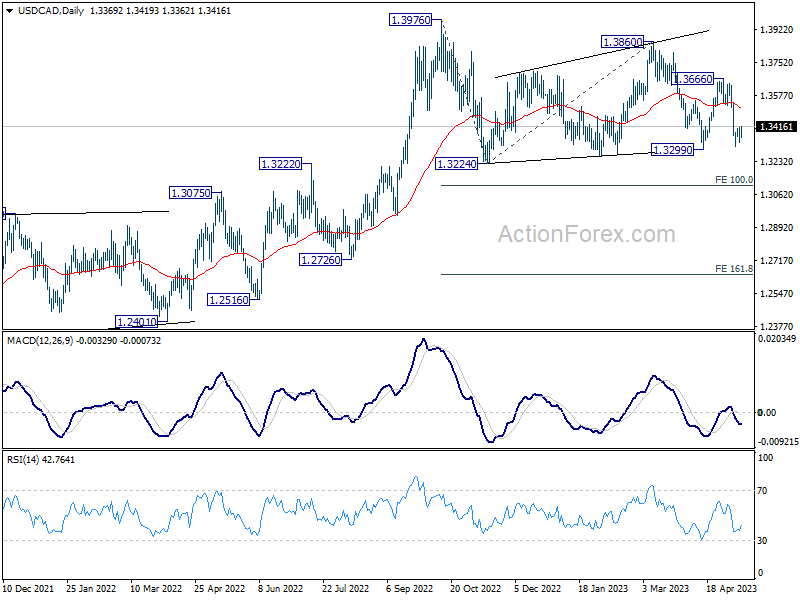
In the bigger picture, as long as 55 W EMA (now at 1.3315) holds, up trend from 1.2005 (2021 low) is still in favor to resume through 1.3976 at a later stage. However, sustained trading below the EMA and 38.2% retracement of 1.2005 to 1.3976 at 1.3233 will raise the chance of bearish reversal. Deeper should then be seen to 61.8% retracement at 1.2758 next.
AUD/USD Daily Report
Daily Pivots: (S1) 0.6743; (P) 0.6780; (R1) 0.6817; More...
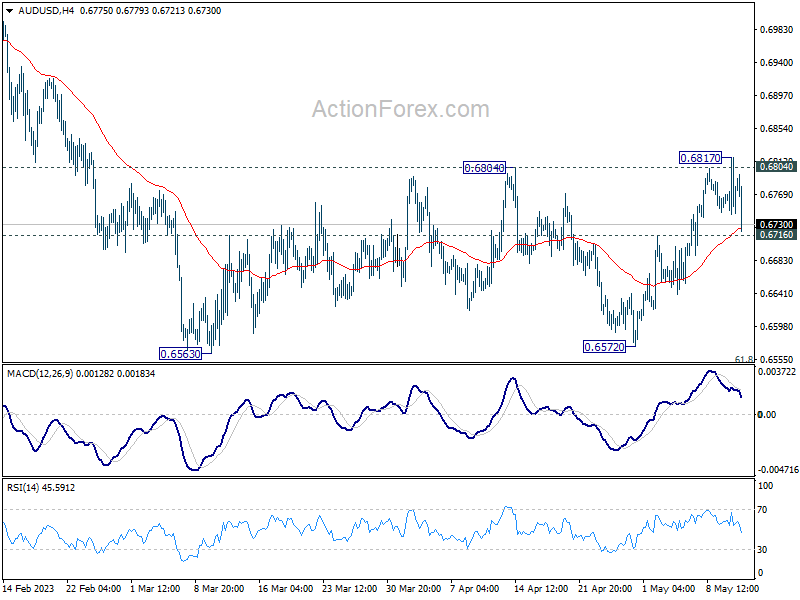
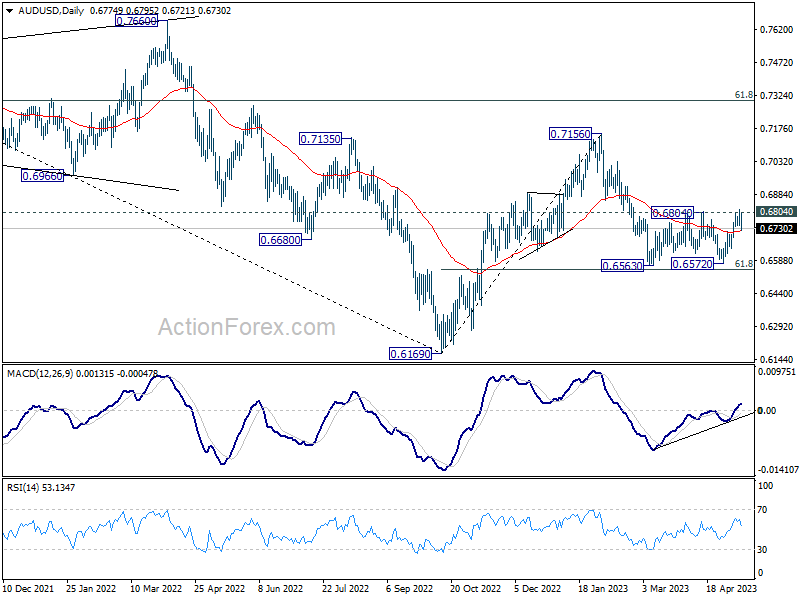
AUD/USD edged higher to 0.6817 but quickly retreated after failing to sustain above 0.6804 resistance. Intraday bias remains neutral for the moment. On the upside, decisive break of 0.6817 resistance will indicate completion of whole fall from 0.7156, and turn near term outlook bullish for retesting this high. However, break of 0.6716 minor support will indicate rejection by 0.6804. That would retain near term bearishness, and turn bias back to the downside for retesting 0.6563/72 support zone, with prospect of resuming the whole decline from 0.7156.
In the bigger picture, as long as 61.8% retracement of 0.6169 to 0.7156 at 0.6546 holds, the decline from 0.7156 is seen as a correction to rally from 0.6169 (2022 low) only. Another rise should still be seen through 0.7156 at a later stage. However, sustained break of 0.6546 will raise the chance of long term down trend resumption through 0.6169 low.
USD/JPY Daily Outlook
Daily Pivots: (S1) 133.84; (P) 134.65; (R1) 135.20; More...
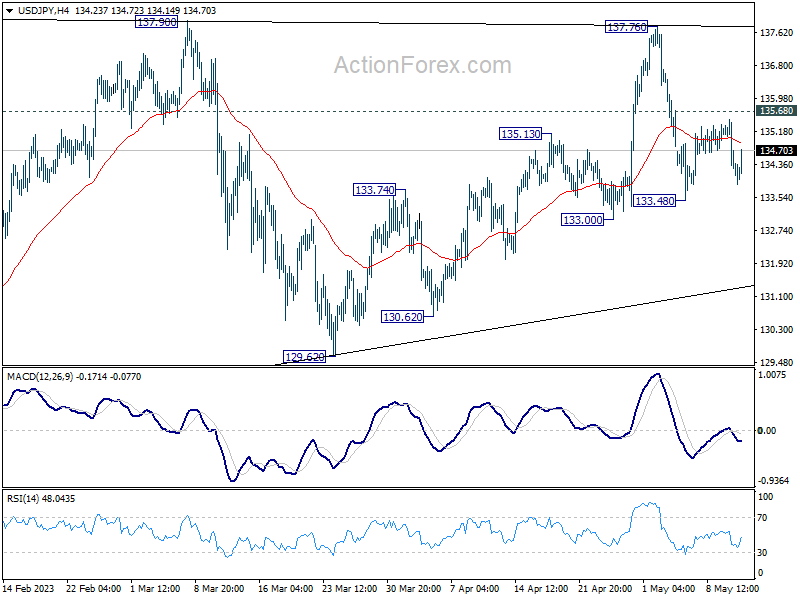
Intraday bias in USD/JPY remains neutral as consolidation continues above 133.48. With 135.68 minor resistance intact, deeper decline is mildly in favor. Fall from 137.76 is seen as the third leg of the pattern from 137.90. Below 133.48 will target 133.00 first, break will target 129.62 support. Still, as long as 129.62 holds, larger rebound from 127.20 is still in favor to resume at a later stage. On the upside, above 135.68 minor resistance will turn bias back to the upside for 137.76/90 instead.
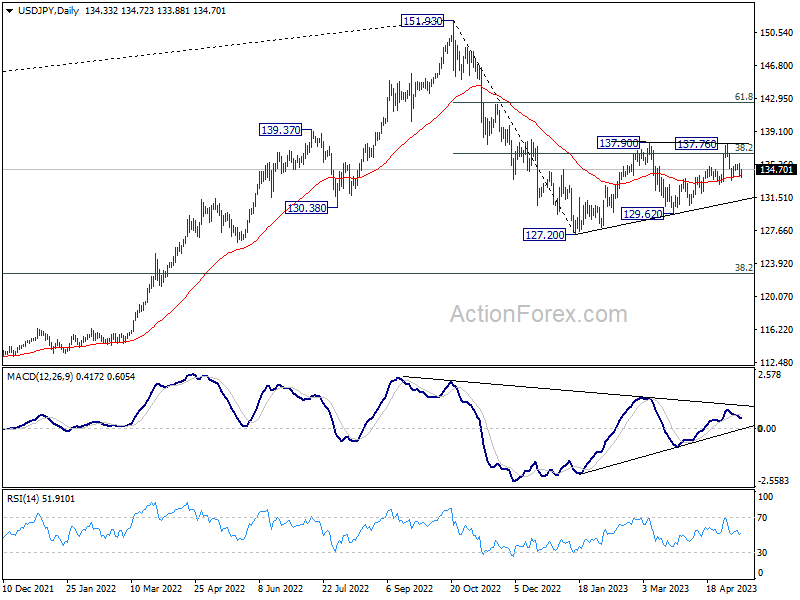
In the bigger picture, price actions from 151.93 high are currently seen as a corrective pattern to the long term up trend. The first leg should have completed at 127.20. Rebound from there is seen as the second leg. Sustained break of 38.2% retracement of 151.93 to 127.20 at 136.34 will bring stronger rebound to 61.8% retracement at 142.48. Meanwhile, break of 129.62 will argue that the third leg is starting through 127.20 low.
USD/CHF Daily Outlook
Daily Pivots: (S1) 0.8868; (P) 0.8897; (R1) 0.8927; More...
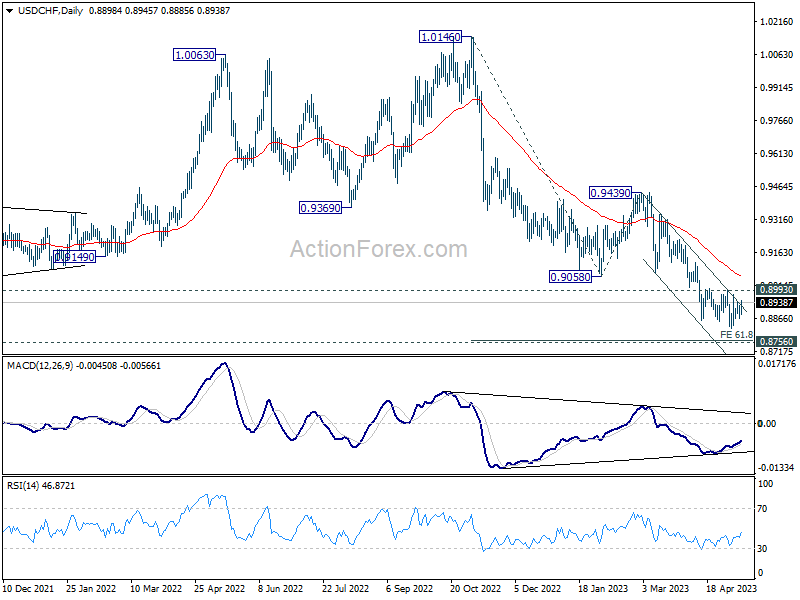
Intraday bias in USD/CHF remains neutral at this point. While down trend from 1.0146 could still extend lower, strong support should be seen from 61.8% projection of 1.0146 to 0.9058 from 0.9439 at 0.8767, which is close to 0.8756 long term support, to bring rebound, at least on first attempt. On the upside, break of 0.8993 resistance will indicate short term bottoming, on bullish convergence condition in 4H MACD, and turn bias back to the upside for stronger rebound to 55 D EMA (now at 0.9054) and possibly above.
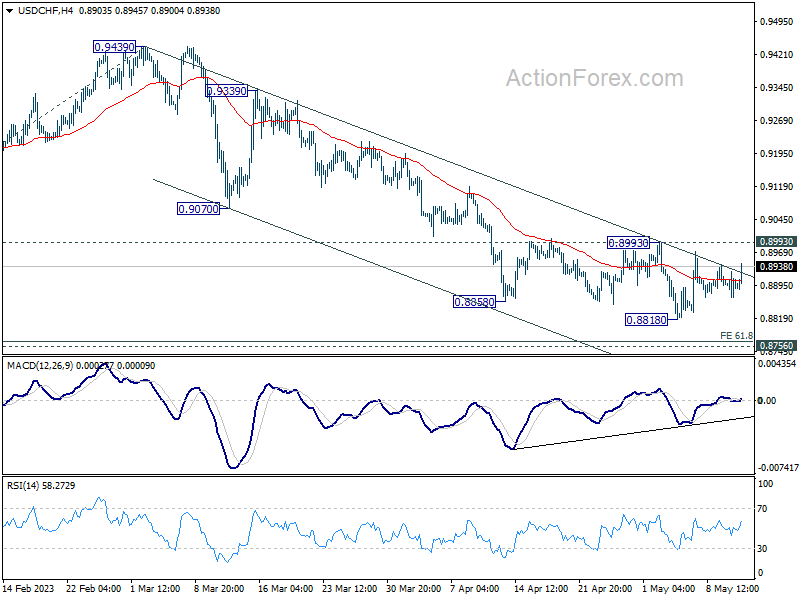
In the bigger picture, fall from 1.1046 (2022 high) is seen as a leg in the long term range pattern from 1.0342 (2016 high). So, downside should be contained by 0.8756 to bring reversal. Sustained break of 0.9058 support turned resistance will be the first sign of medium term bottoming. However, decisive break of 0.8756 will carry larger bearish implications.
EUR/USD Daily Outlook
Daily Pivots: (S1) 1.0948; (P) 1.0977; (R1) 1.1013; More...
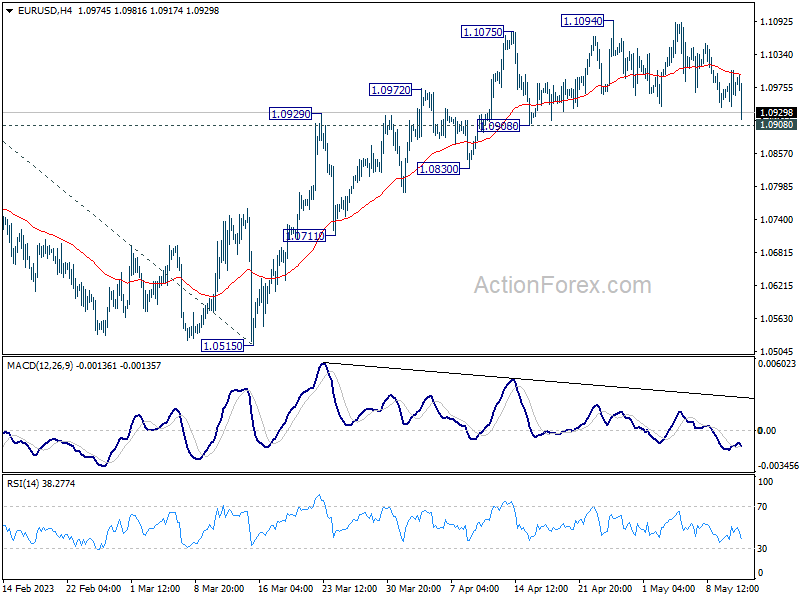
EUR/USD is still holding above 1.0908 support and intraday bias stays neutral. On the upside, firm break of 1.1094 will resume larger up trend to 1.1273 fibonacci level. Break there will target 61.8% projection of 0.9534 to 1.1032 from 1.0515 at 1.1441 However, considering bearish divergence condition in 4H MACD, break of 1.0908 support will indicate short term topping and turn bias back to the downside. Further break of 1.0830 will target 1.0515 key support level.
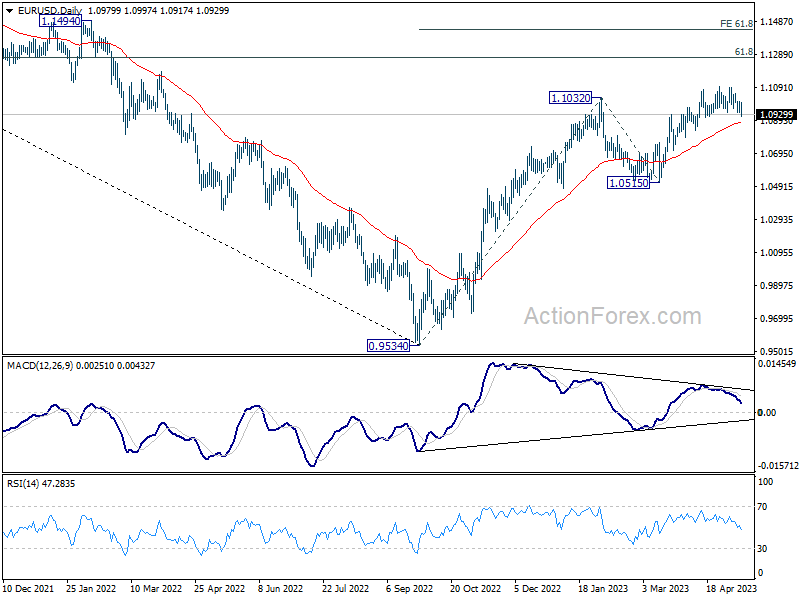
In the bigger picture, rise from 0.9534 (2022 low) is in progress for 61.8% retracement of 1.2348 (2021 high) to 0.9534 at 1.1273. Sustained break there will solidify the case of bullish trend reversal and target 1.2348 resistance next (2021 high). This will now remain the favored case as long as 1.0515 support holds, even in case of deeper pull back.
Is AUDUSD Ready for a Bullish Breakout?
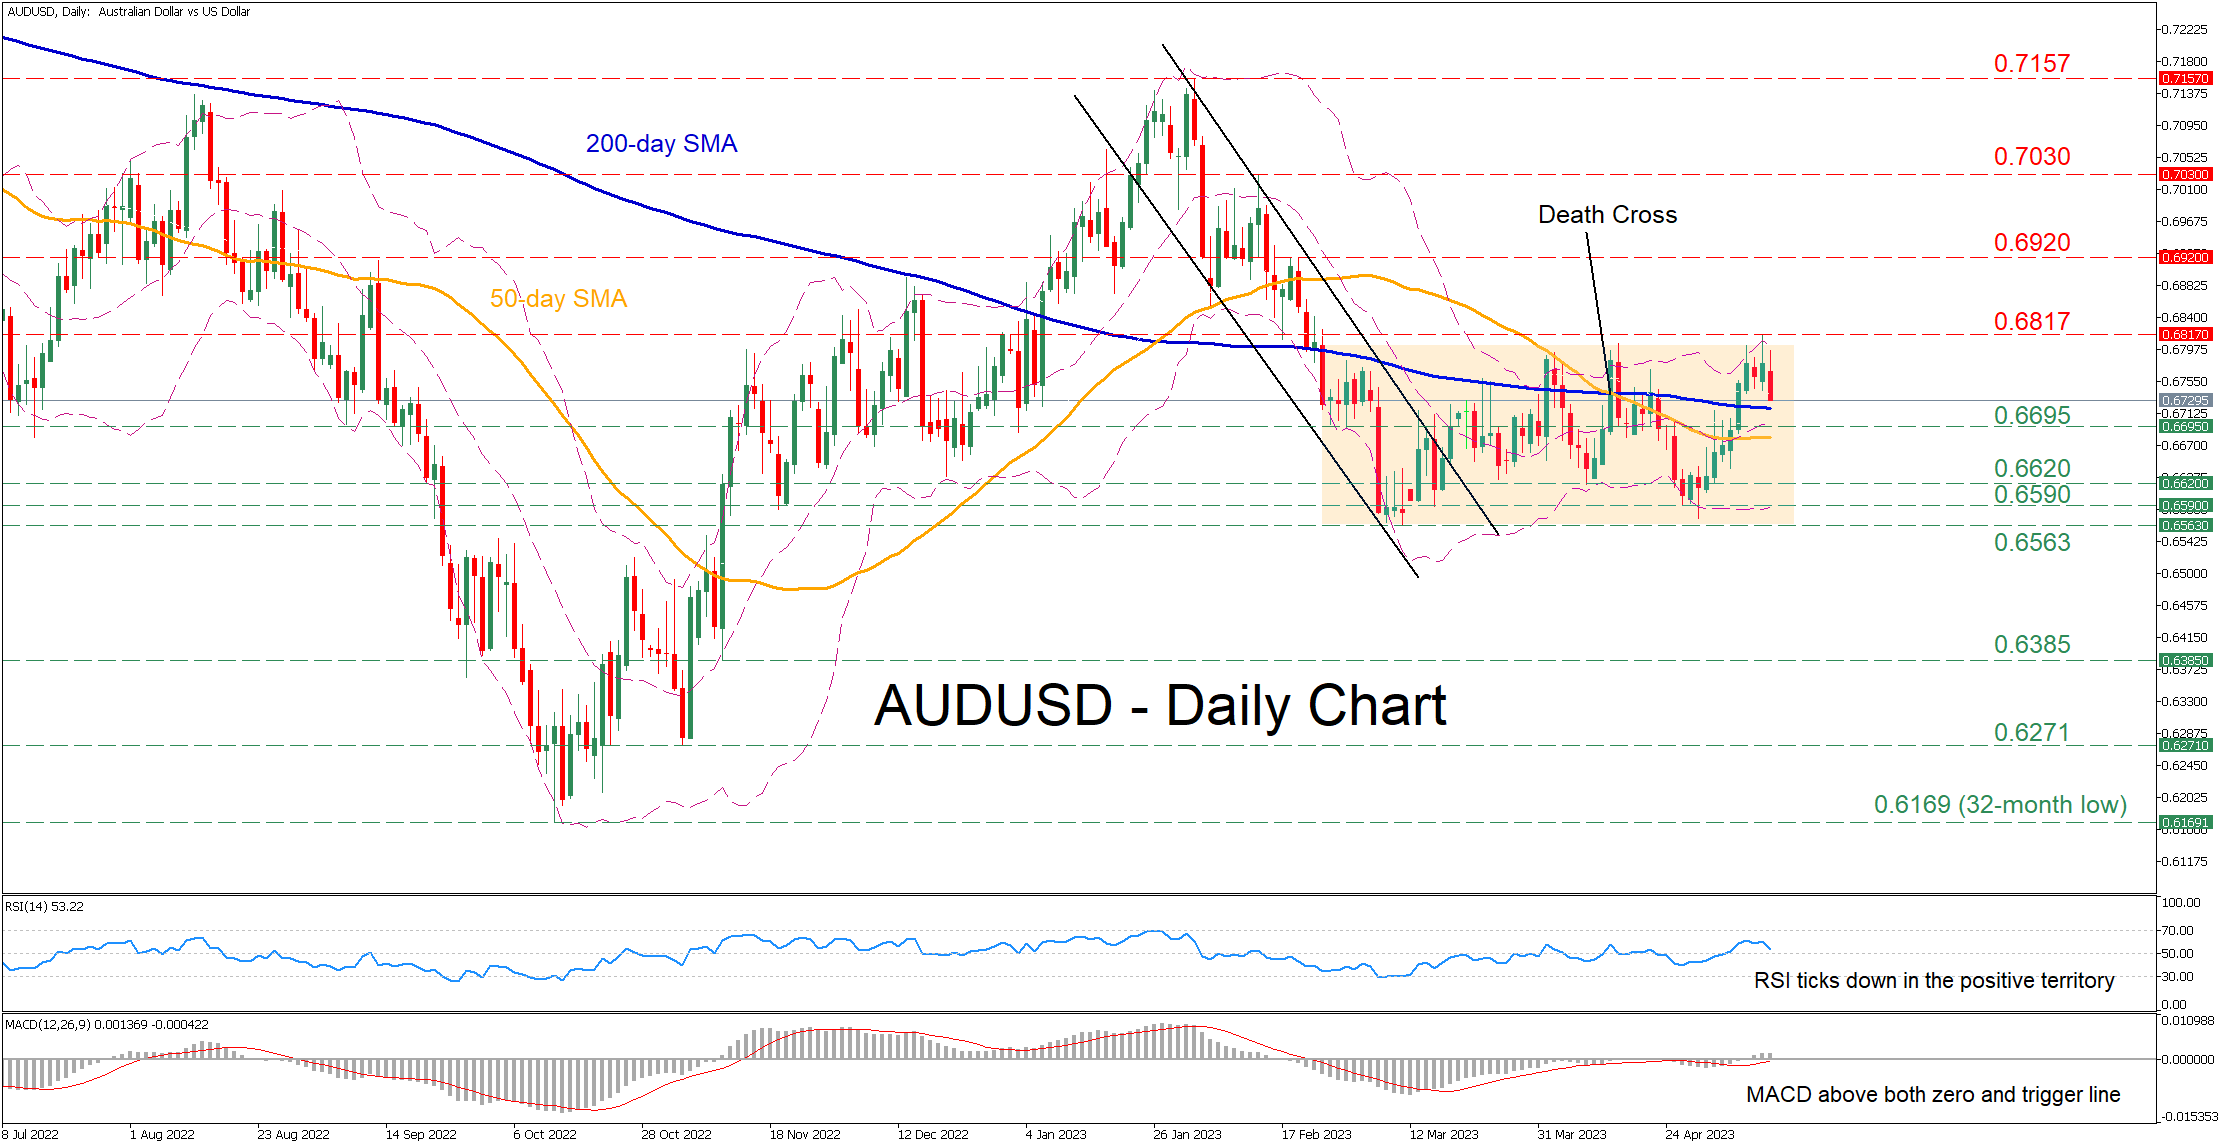
AUDUSD had been trending lower within a downward sloping channel after peaking at 0.7157 in early February. Although the pair managed to break above this bearish pattern, it has been directionless since then, while its recent attempt to escape its tight range faltered and the price experienced a pullback.
The short-term oscillators are cautiously tilting towards the positive side. The RSI is pointing down above its 50-neutral mark, while the MACD histogram is holding above zero and its red signal line.
Should buying pressures persist, the price might face the recent resistance of 0.6817, which is the highest level observed since February 24. Escaping the rangebound pattern, the pair could extend its advance towards 0.6920 before it tests the 0.7030 hurdle. A break above the latter may open the door for the 11-month high of 0.7157.
Alternatively, if the bears manage to push the price lower, initial declines could come to a halt at the 0.6695 territory. Should that floor collapse, the bears could target 0.6620 before the 0.5590 support gets tested. Failing to halt there, the pair could encounter strong support at the 2023 bottom of 0.6563.
Overall, AUDUSD failed to close above its sideways pattern and retraced lower, but the technical indicators currently suggest that bullish forces retain the upper hand. Hence, the pair could enter a consolidation phase before the bulls retry to push the price higher.
XAU/USD: Bulls Hold Grip But Hesitate Above $2050
Gold keeps firm tone well above $2000 level, following last week’s spike to new marginally higher all-time high, though traders remain cautious and continue to collect profits on jumps above $2050.
The metal is supported by prospects of pause in Fed rate hikes as annual inflation in the US eased below expectations in April, contributing to the notion.
Growing uncertainty on recession fears, increased stress in banking sector and the latest turmoil over raising country’s $31.4 trillion debt ceiling, also contribute to increased safe-haven demand which offers solid ground for gold price for now, in addition to persisting geopolitical turbulence.
Positive daily technical studies (rising bullish momentum/ascending and thickening daily cloud continues to underpin) support the action, with strong bullish bias seen above $2000 level.
Uninterrupted series of higher lows and higher highs signal that bulls remain intact, with shallow dips expected to provide better buying opportunities.
Rising 10DMA ($2020) offers immediate support, followed by 20DMA ($2007) and psychological $2000 support, break of which would question bulls, but the action will remain biased higher as long as the price stays above a higher base at $1970 zone (also near Fibo 38.2% of $1804/$2080 upleg).
Only firm break here would put larger bulls on hold and risk deeper pullback.
Res: 2050; 2070; 2074; 2080.
Sup: 2020; 2007; 2000; 1975.
Bitcoin and Ether Supported on Dips But Look Vulnerable
Market Picture
Bitcoin rallied at the start of Wednesday’s US session but unexpectedly plunged $1400 or 5% to $26.7K mid-session. This short-term dip shows continued demand for Bitcoin on dips below $27.5K.
The sharp price drop has sparked rumours that US government officials were behind it, selling previously confiscated Bitcoins. However, we also note that the fall was preceded by a rally, during which speculators may have built up liquidity for a following dump.
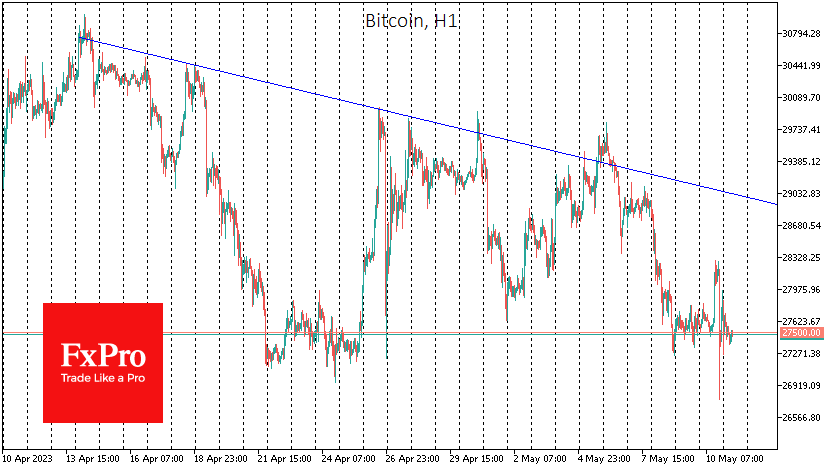
Either way, the price dynamics are becoming increasingly bearish: the formation of a series of descending highs, a consolidation below the 50-day moving average and a break of the April lows suggest that sellers are dominating.
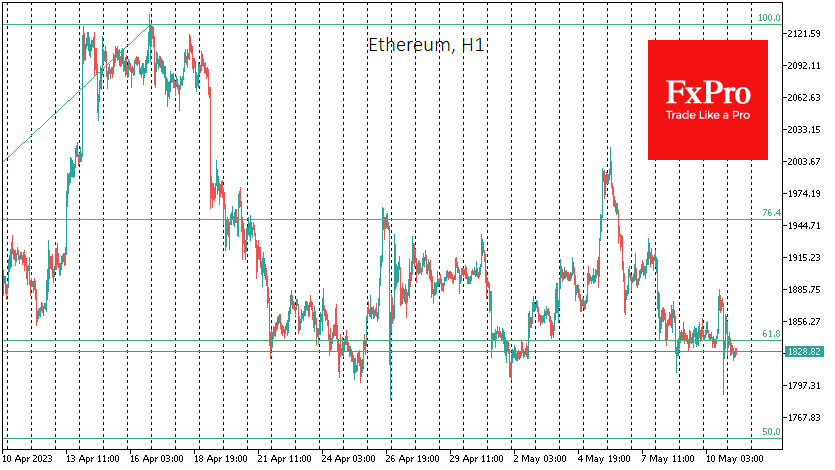
Ethereum is also forming horizontal support at $1830, which has existed since early April. The fact that the price is increasingly testing this level, and one needs to develop a sustainable rally, makes one cautious about its short-term prospects.
New Background
Glassnode has seen an increase in transaction fees on the BTC blockchain and miners switching to hoarding tactics. Their sales could resume at levels above $30K.
The head of mining company Marathon Digital said that last year’s downturn in the crypto market helped weed out “dubious operators” and spurred regulators worldwide into action. He pointed to the efforts of the EU, UK, Hong Kong, Singapore, and the UAE, as opposed to the US, which has been “partly behind” on the issue.
SEC Commissioner Hester Pearce said that the crypto asset market regulation bill (MiCA) passed in Europe and the UK’s approach to digital asset regulation could be a starting point for a regulatory framework in the US.
German crypto start-up Unstoppable Finance announced its intention to create Europe’s first fully regulated bank offering crypto-assets and DeFi services to customers.
XAU/USD: The Final Impulse Continues to Build in a Bullish Zigzag
In the long term, XAUUSD forms a primary double zigzag, it consists of three main sub-waves Ⓦ-Ⓧ-Ⓨ.
Apparently, the primary sub-waves Ⓦ-Ⓧ have already been formed, and the third sub-wave Ⓨ is under development.
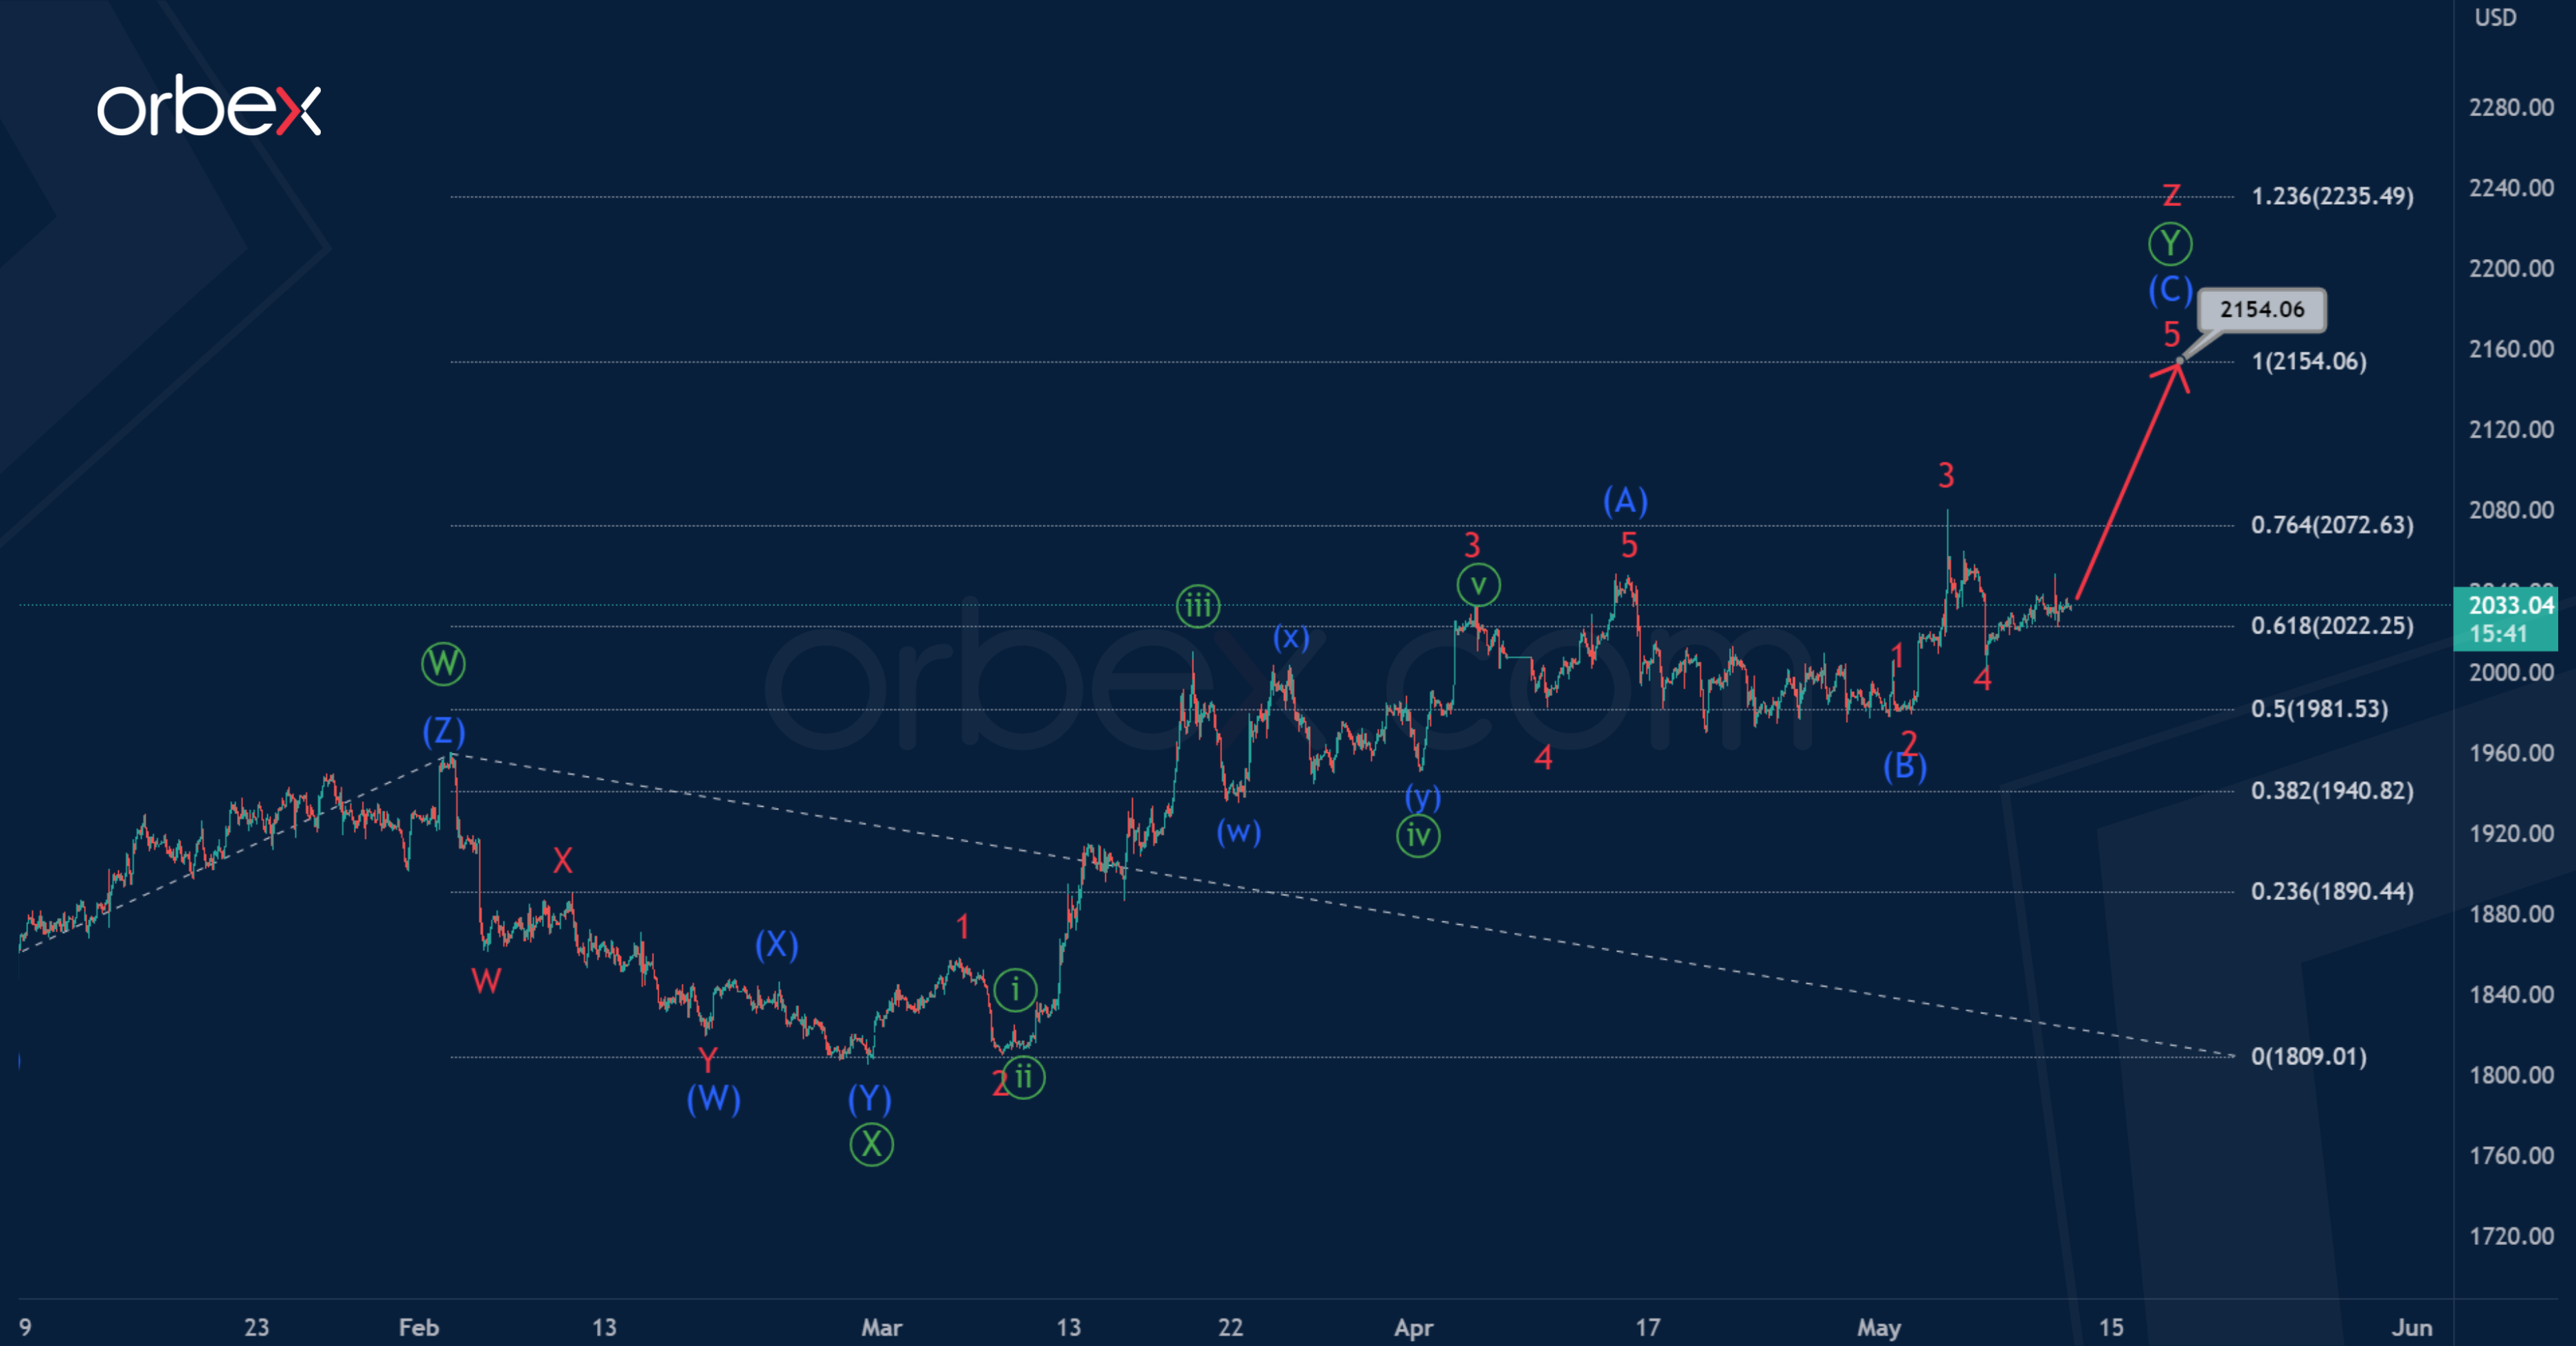
It is assumed that Ⓨ will acquire a standard zigzag shape. Intermediate waves (A) and (B), impulse and correction, are finished. It is likely that in the near future the price will continue to rise in the intermediate impulse (C).
Gold may rise to 2154.06. At that level, primary wave Ⓨ will be at 100% of wave Ⓦ.
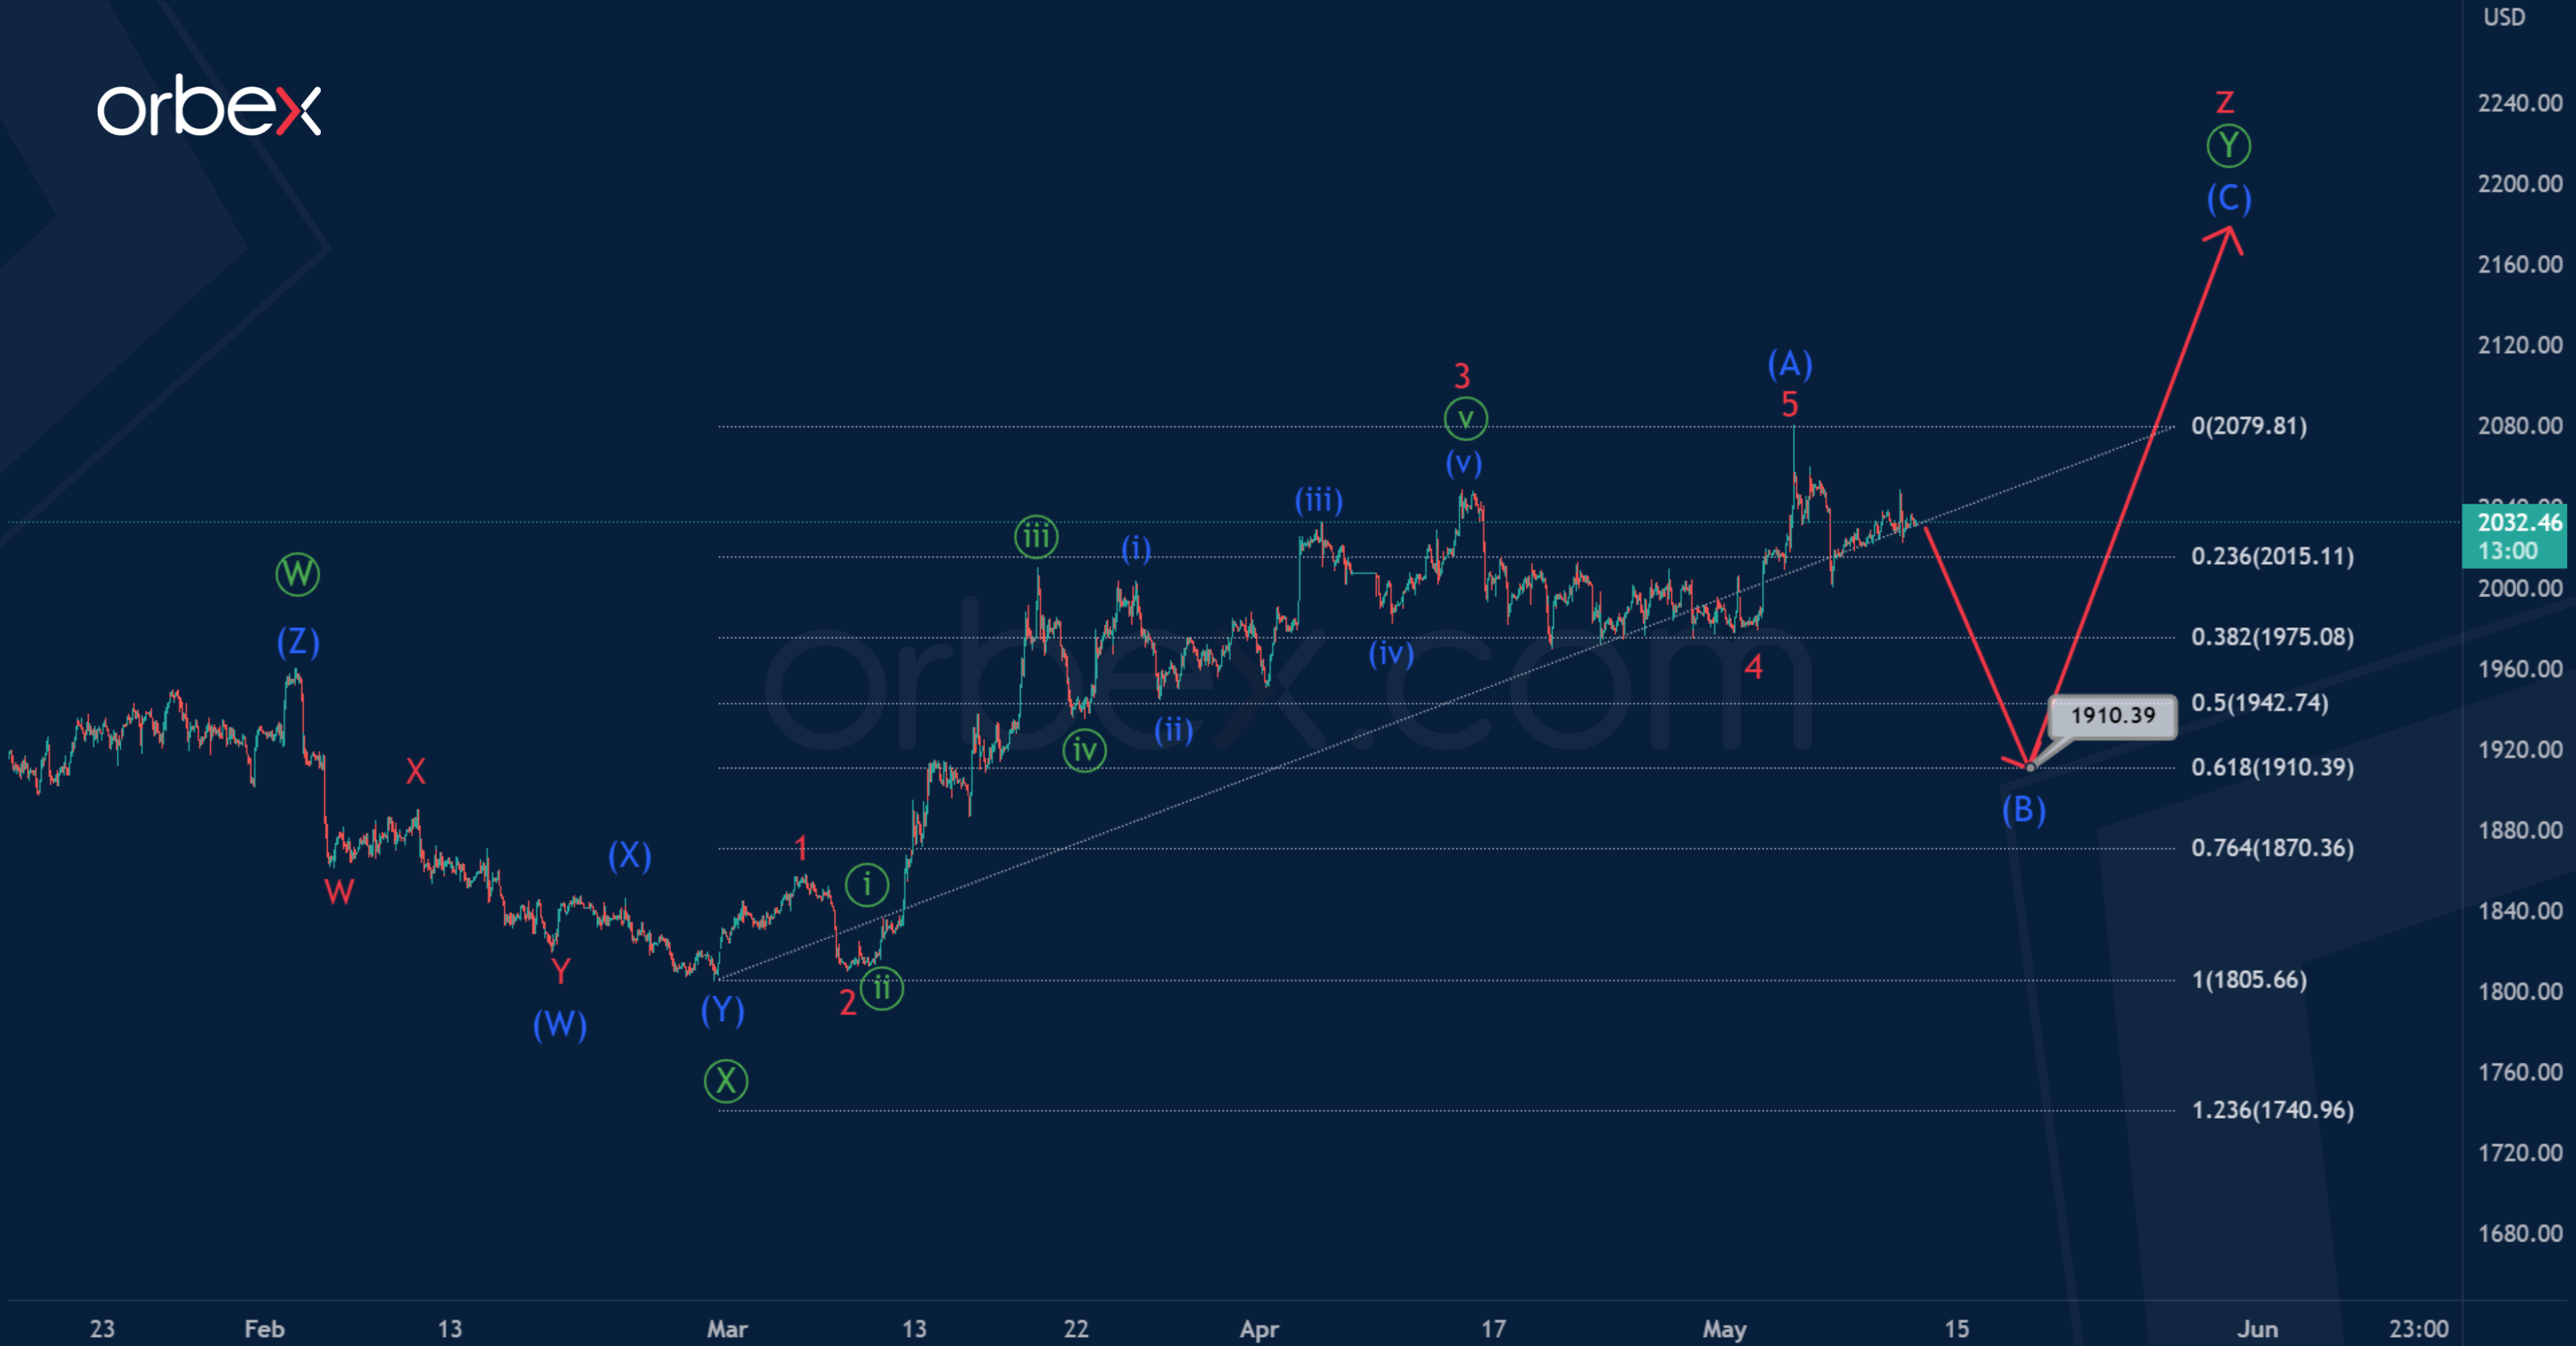
According to the alternative, the impulse wave (A) has recently ended, with a long minor correction 4 having a horizontal structure.
At the moment, we can expect a decline in the price and the development of an intermediate correction (B). It is still difficult to determine which correction model wave (B) will take.
However, it is possible to determine the approximate final of wave (B). At 1910.39, the correction (B) will be at 61.8% of impulse (A). Thus, we can expect a drop to the specified level.
Gold Holds Ground
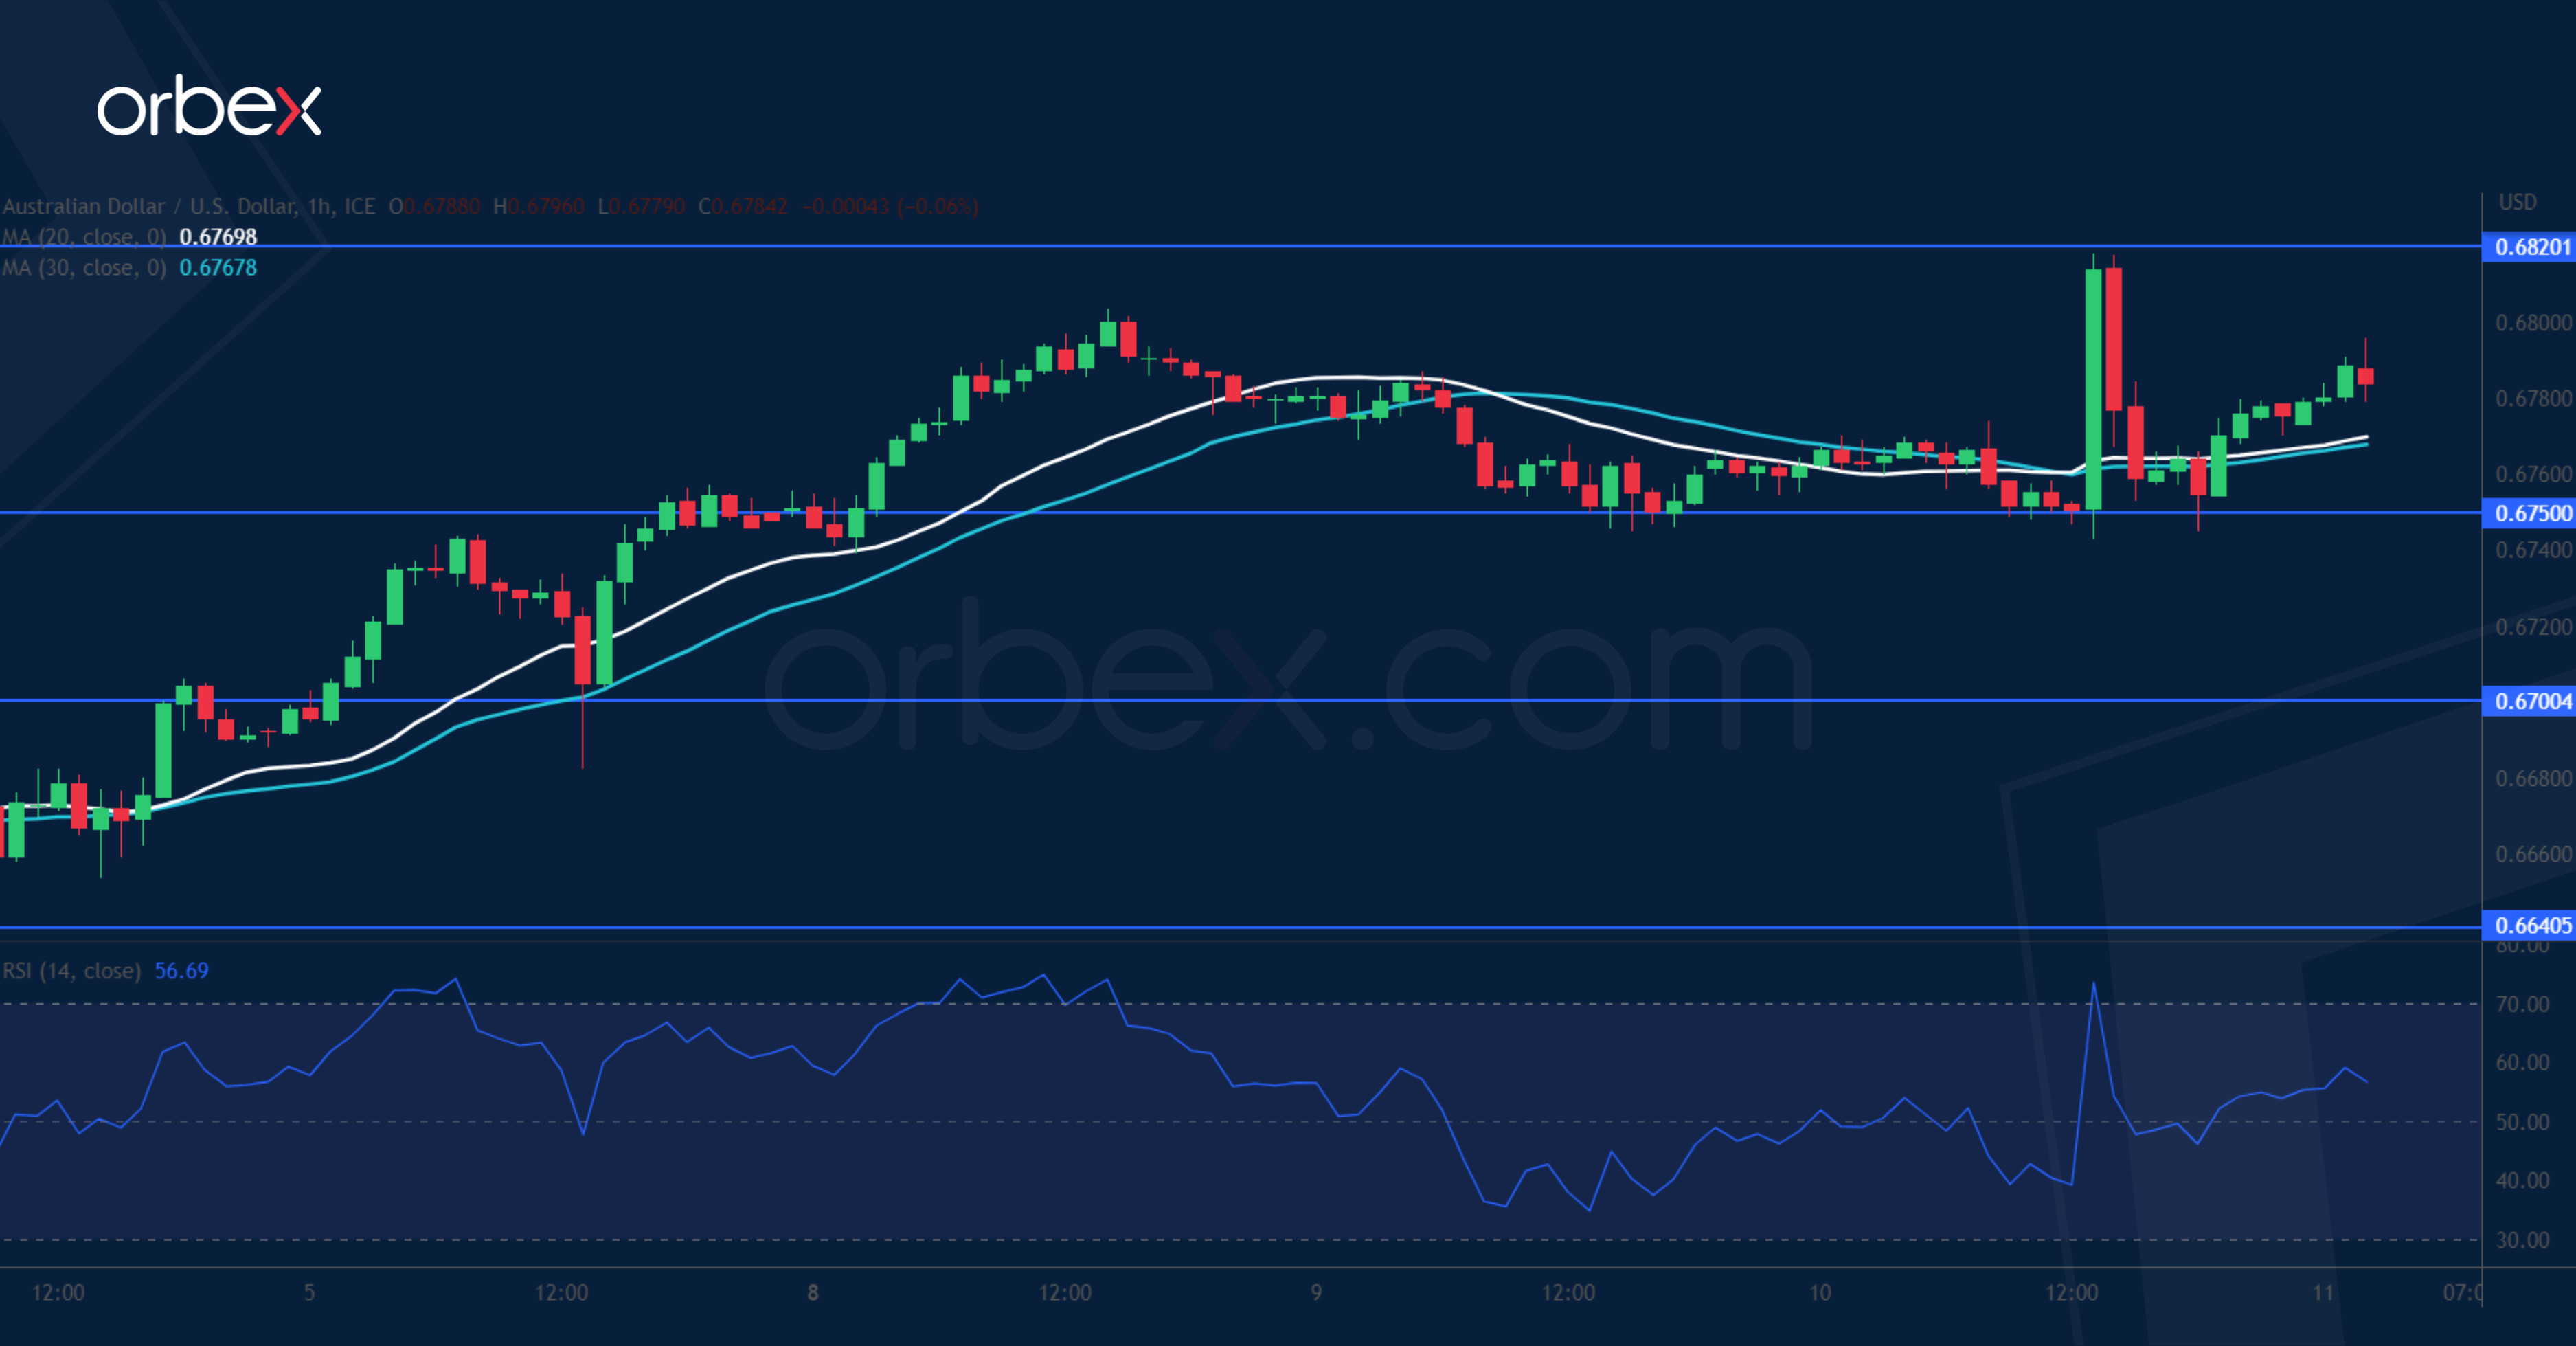
AUD/USD seeks support
The Australian dollar inches higher over accelerating inflation expectations. The selling pressure has eased after the pair cleared the support-turned-resistance at 0.6720. Then a pop above the April high of 0.6800 has prompted more sellers to cover their positions. A close back above 0.6820 would send the pair to 0.6920. The base of the latest momentum at 0.6750 is a fresh support as the aussie consolidates its latest gains. 0.6700 along the 20 and 30-day SMAs is an important support to keep the momentum current intact.
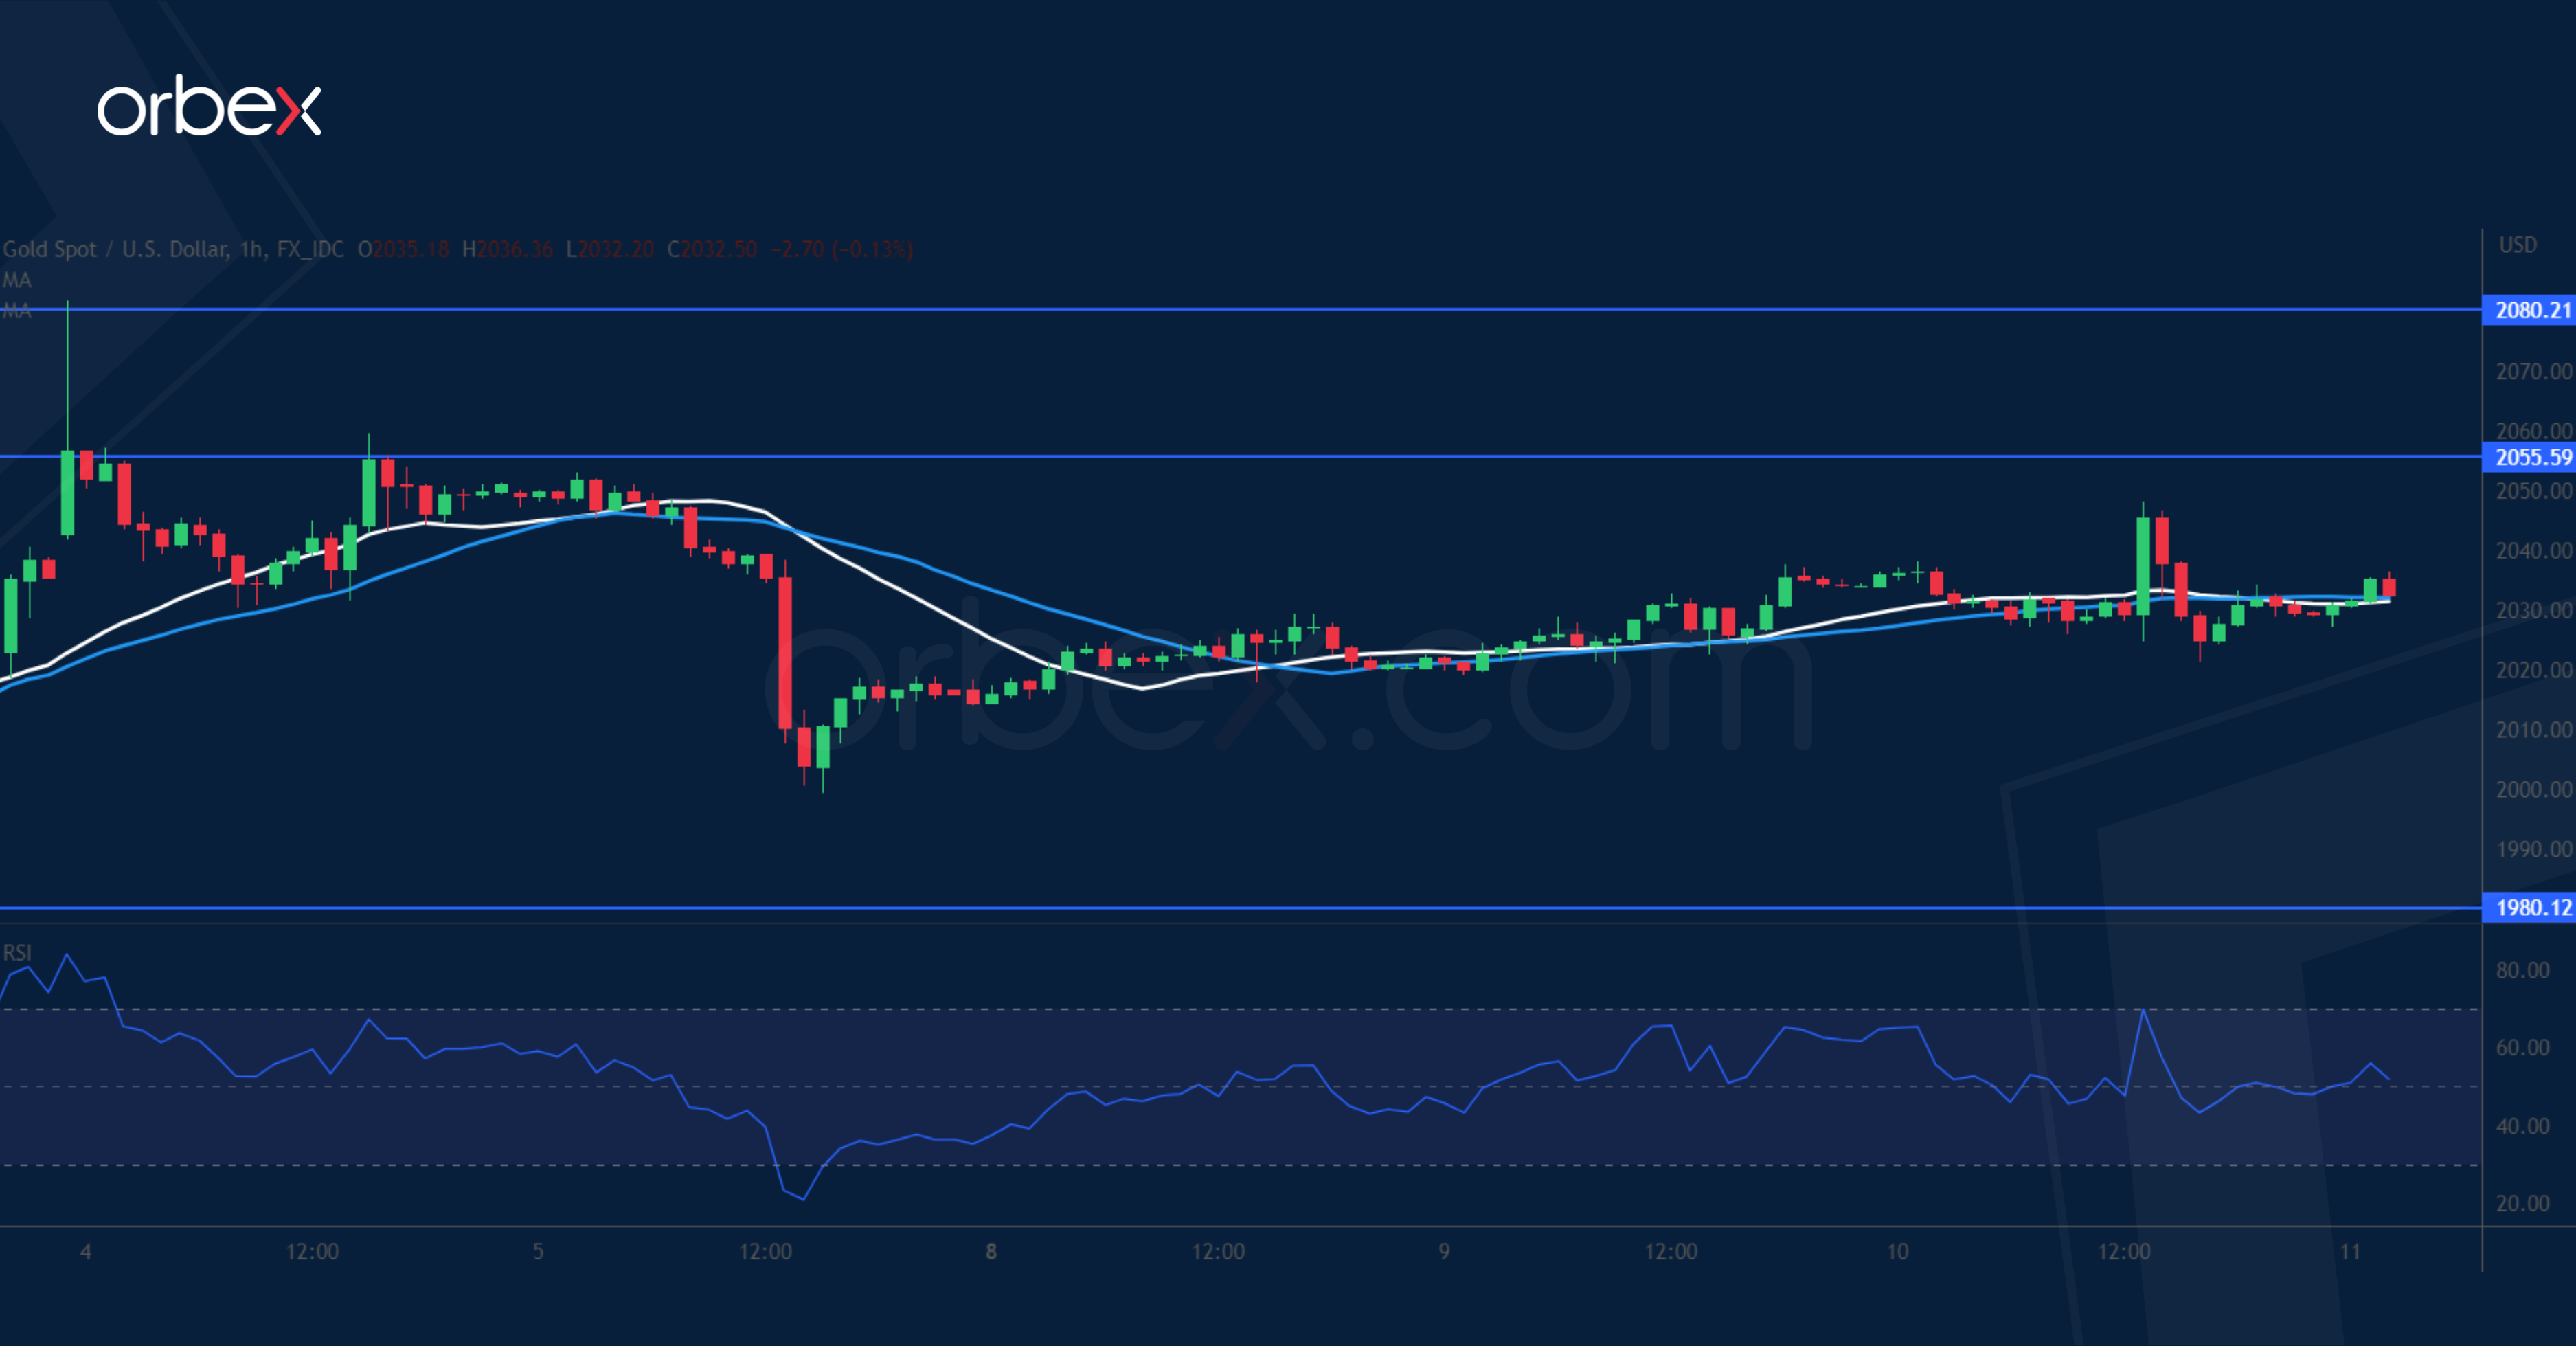
XAU/USD tests resistance
Gold weakens as easing US inflation raises hopes for a pause in the Fed's rate hikes. On the daily chart, the price is seeking to consolidate its gains after a tentative close above August 2020’s peak of 2075. A shooting star pattern showed hesitation in keeping bids at the all-time high level. Zooming into the hourly chart, a drop below the first support of 2010 has dented the impetus, causing some short-term buyers to take profit. 1980 at the base of the recent rally is a critical floor. A close back above 2055 would resume the rally.
US Oil struggles to bounce
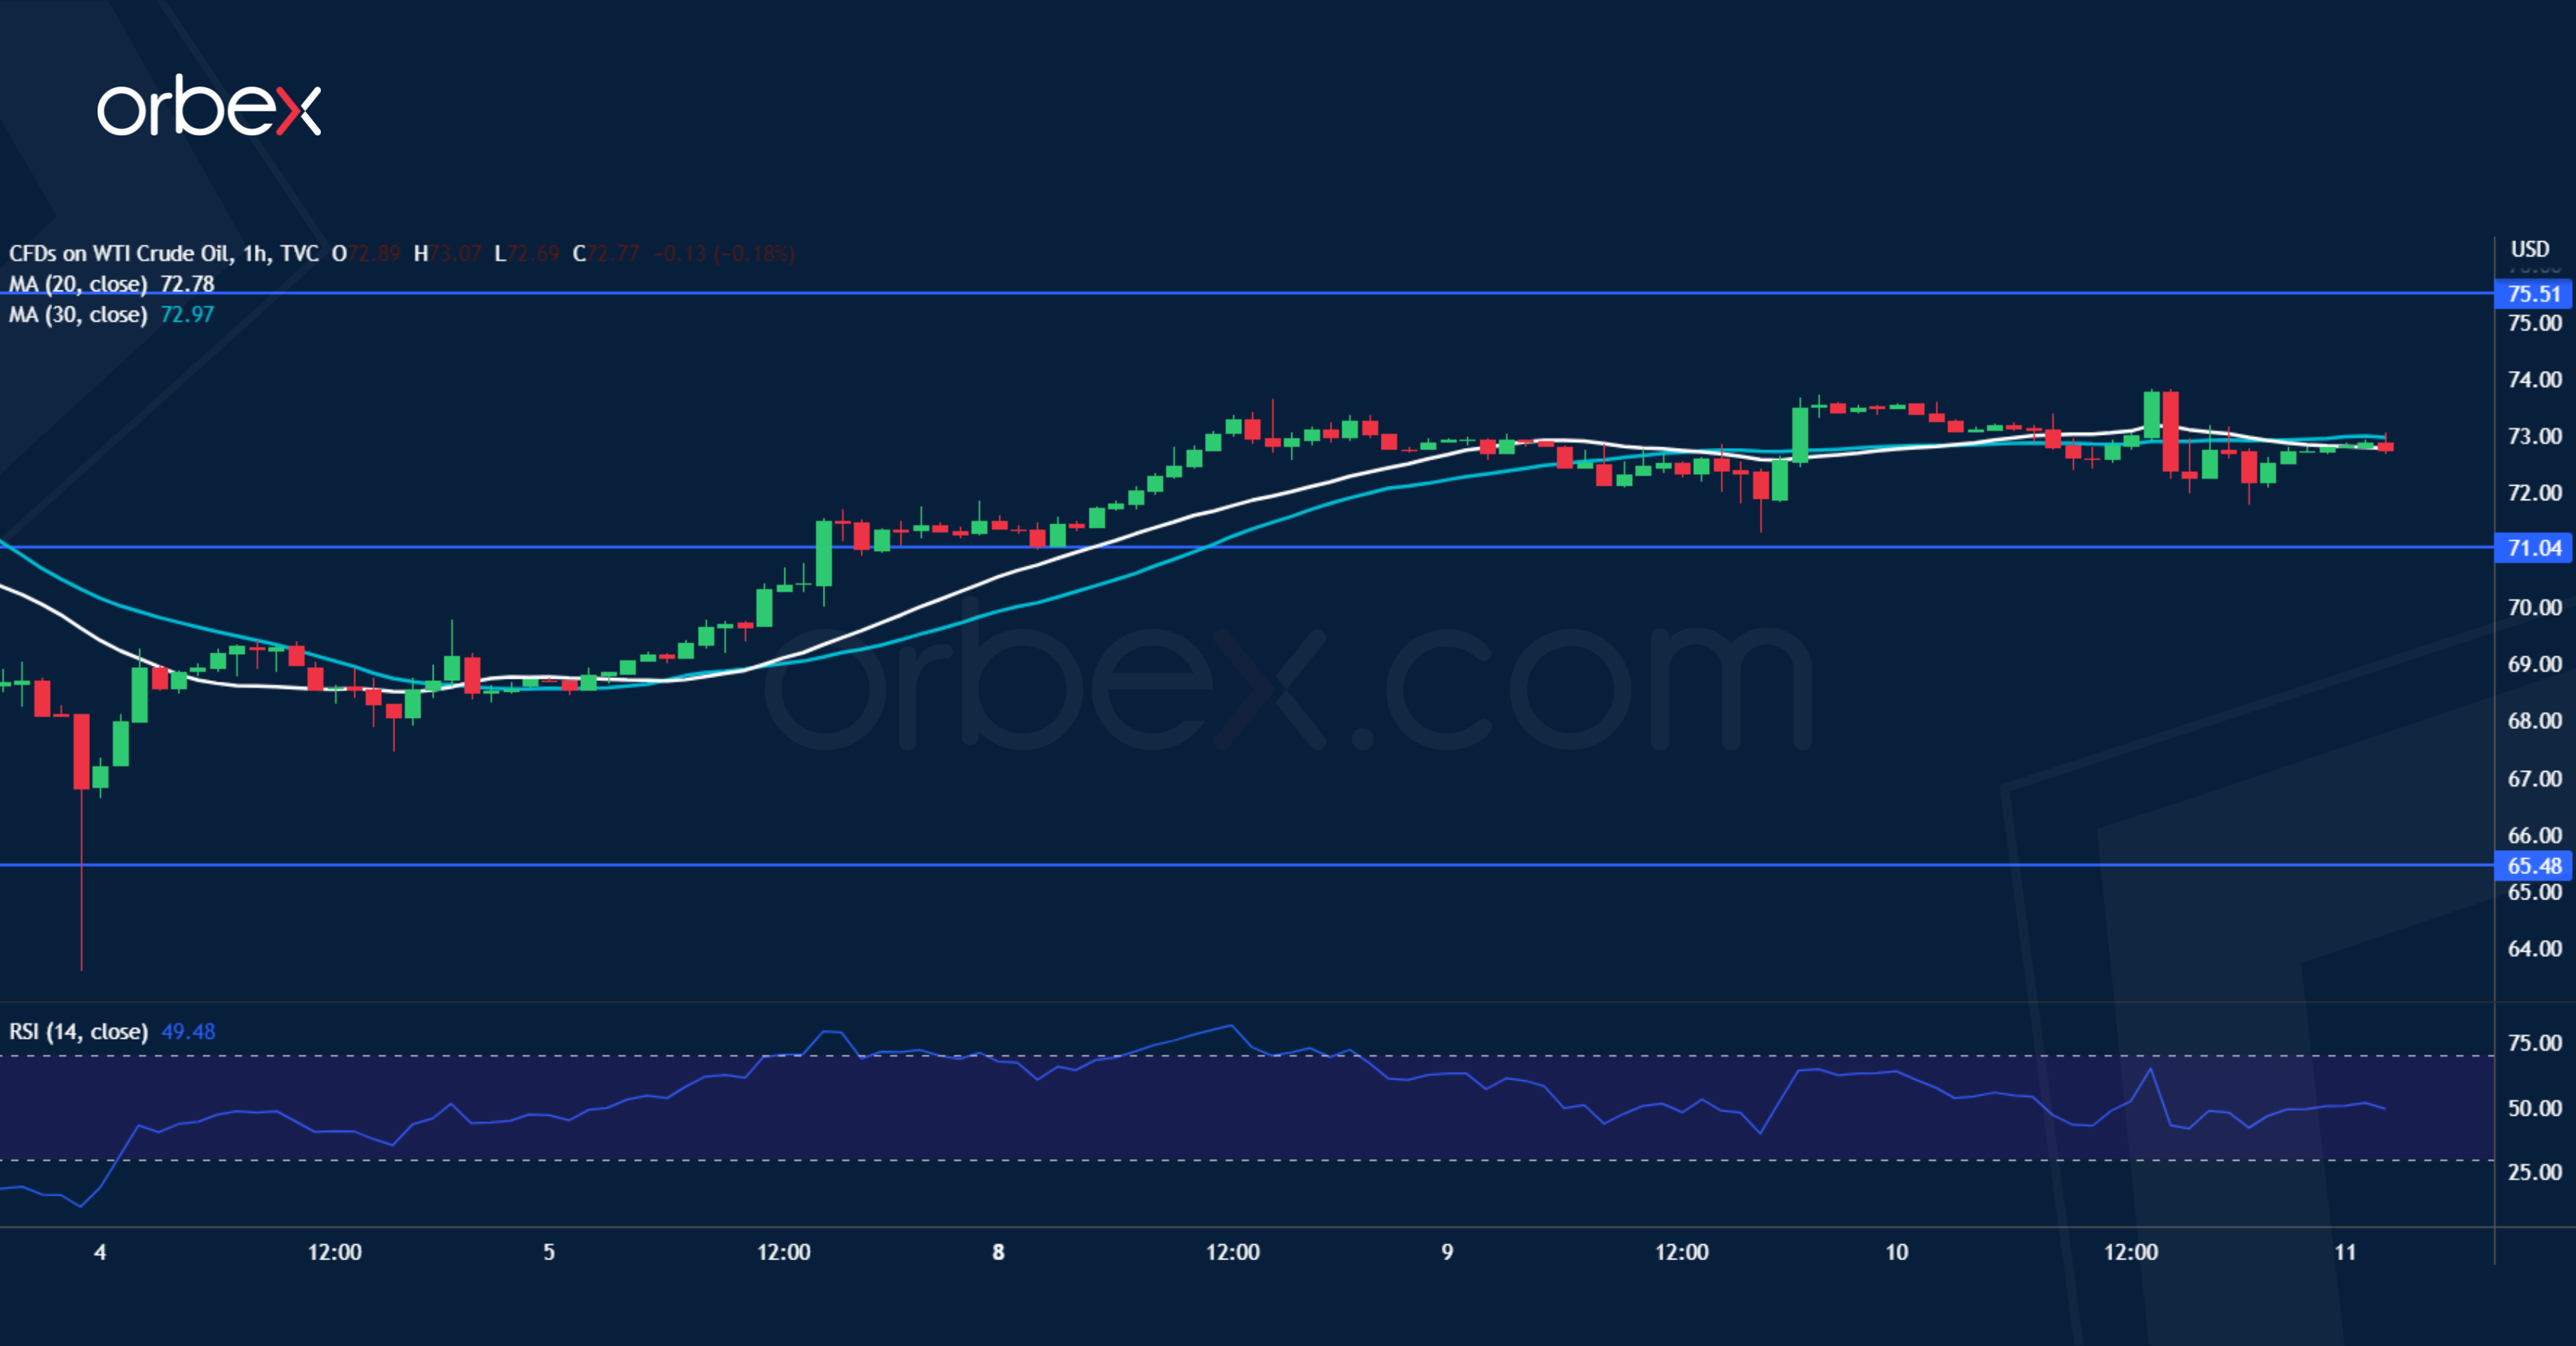
WTI crude slides as a surprise rise in US inventory raises concerns of soft demand. A bearish MA cross on the daily chart is a sign of strong selling interests as the price gave up its recent gains. A long candle wick below the daily support of 65.50 indicated a rejection of the downside after an oversold RSI triggered a ‘buy-the-dips’ behaviour. The supply zone around 75.50 is where the bears would sell into strength due to downward inertia. A fall below 71.00 would expose 65.50 once again, potentially extending losses to 60.00.