
Sample Category Title
EUR/GBP Weekly Outlook
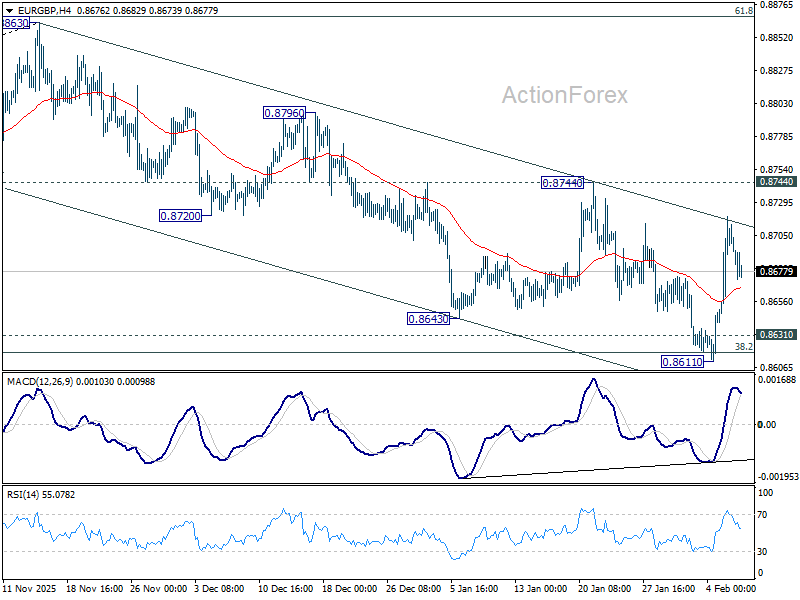
EUR/GBP edged lower to 0.8611 last week but quickly rebounded after drawing support from 0.8631 cluster support (38.2% retracement of 0.8221 to 0.8663 at 0.8618). But upside is limited below 0.8744 resistance so far. Initial bias remains neutral this week first. On the upside, firm break of 0.8744 will argue that fall from 0.8863 has completed as a correction. Further rally should be seen back to retest 0.8863 high. On the downside, sustained break of 0.8618/31 will carry larger bearish implications and turn outlook bearish.
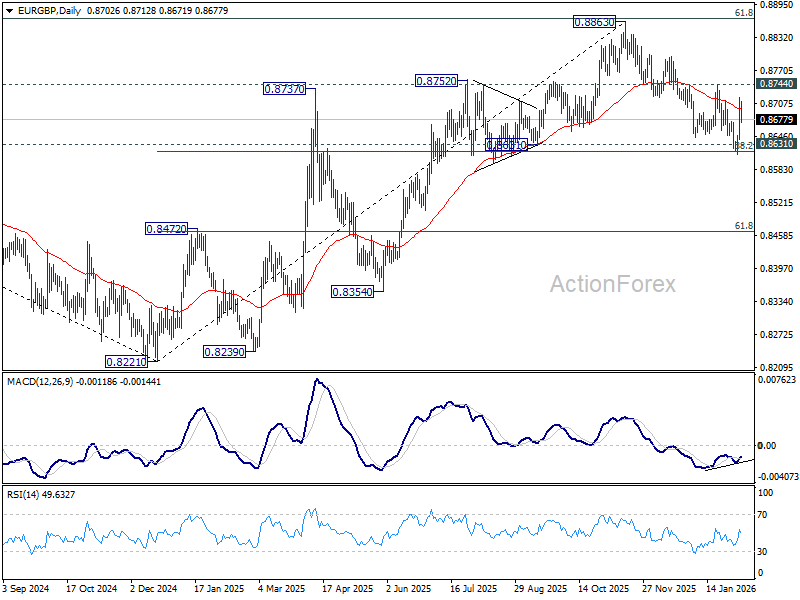
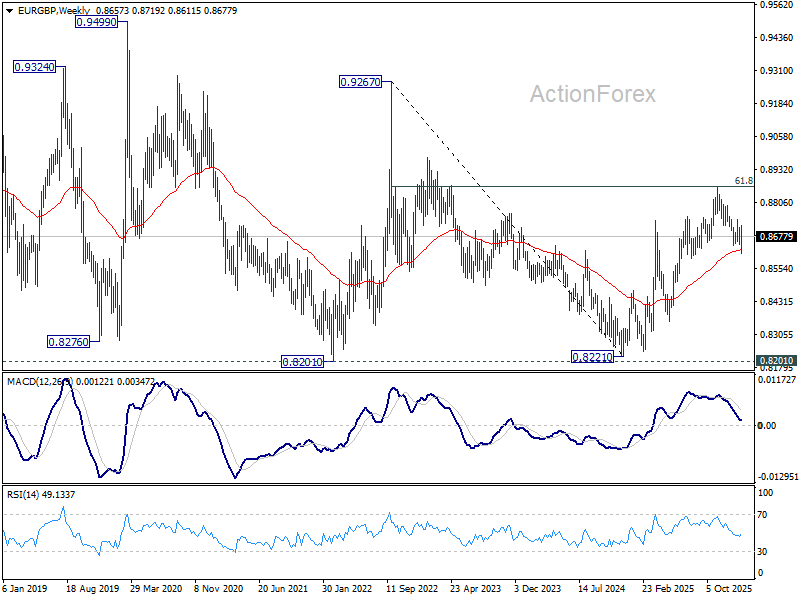
In the bigger picture, rise from 0.8221 medium term bottom (2024 low) is seen as a corrective move. Upside should be limited by 61.8% retracement of 0.9267 to 0.8221 at 0.8867. Sustained trading below 55 W EMA (now at 0.8626) should confirm that this corrective bounce has completed. In this case, deeper fall would be seen back to 0.8201/21 key support zone. However, decisive break of 0.8867 will suggest that EUR/GBP is already reversing whole decline from 0.9267 (2022 high). That should pave the way back to 0.9267.
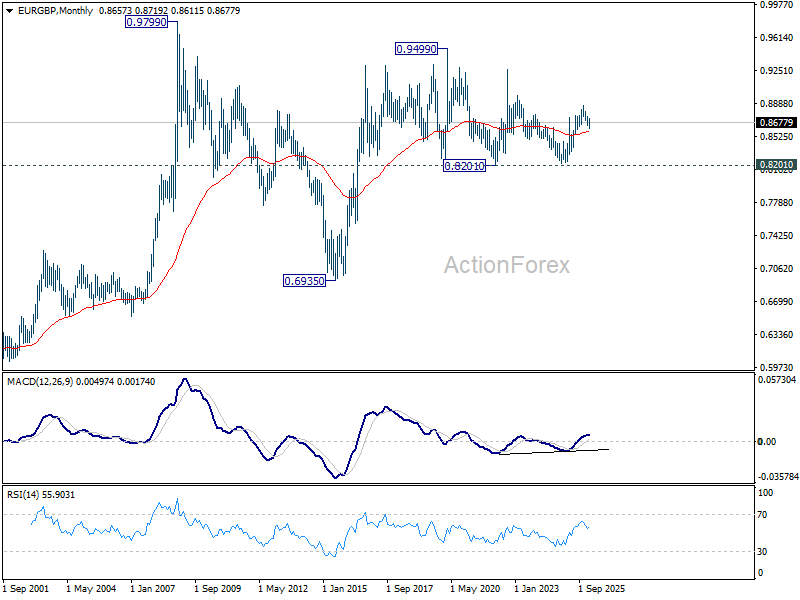
In the long term picture, price action from 0.9499 (2020 high) is seen as part of the long term range pattern from 0.9799 (2008 high). Range trading should continue between 0.8201 and 0.9499, until there is clear signal of imminent breakout.
EUR/AUD Weekly Outlook
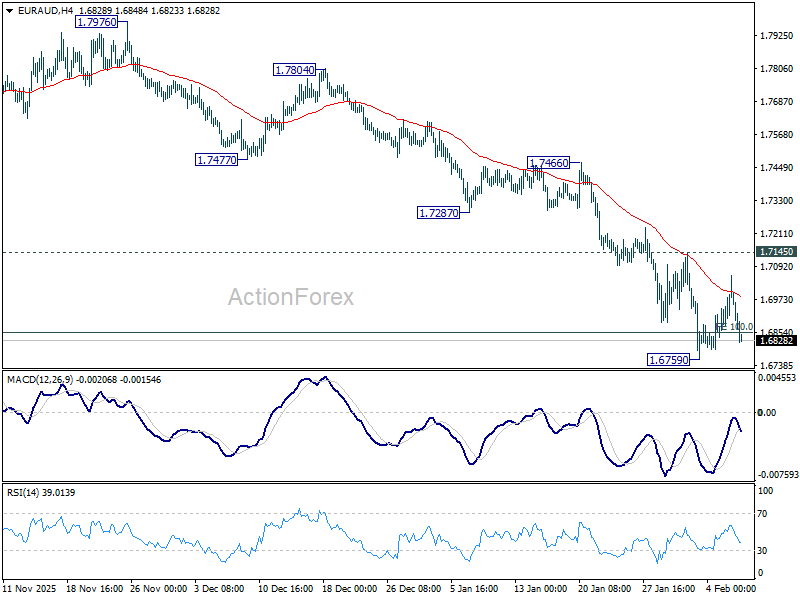
EUR/AUD fell further to 1.6759 last week but recovered after hitting 100% projection of 1.8554 to 1.7245 from 1.8160 at 1.6851. Initial bias remains neutral this week first. Near term outlook will stay bearish as long as 1.7149 resistance holds. On the downside, break of 1.6759 and sustained trading below 1.6851 will extend larger fall to 138.2% projection at 1.6351 next. However, break of 1.7145 will confirm short term bottoming, and turn bias back to the upside for stronger rebound.
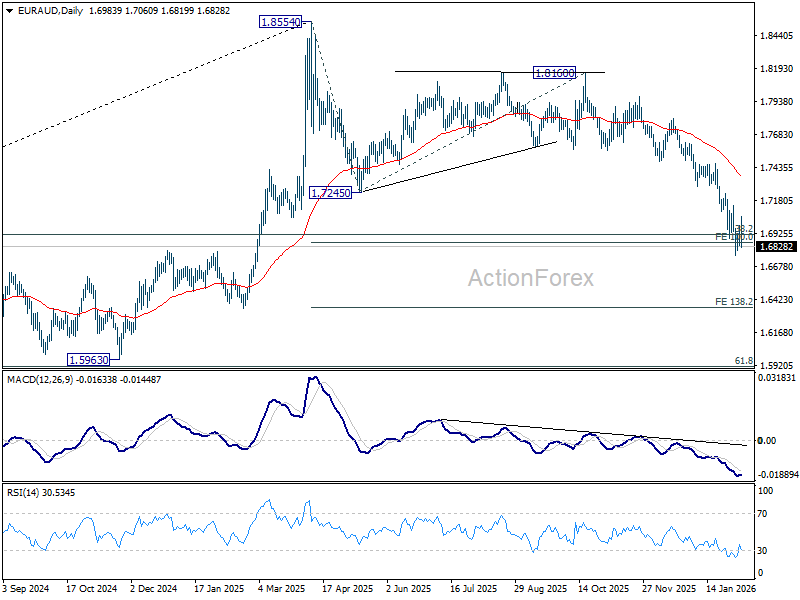
In the bigger picture, fall from 1.8554 medium term top is still in progress. Sustained break of 38.2% retracement of 1.4281 to 1.8554 at 1.6922 will argue that it's already reversing whole up trend from 1.4281 (2022 low). Deeper fall would be seen to 61.8% retracement at 1.5913. For now, risk will stay on the downside as long as 55 D EMA (now at 1.7362) holds even in case of strong rebound.
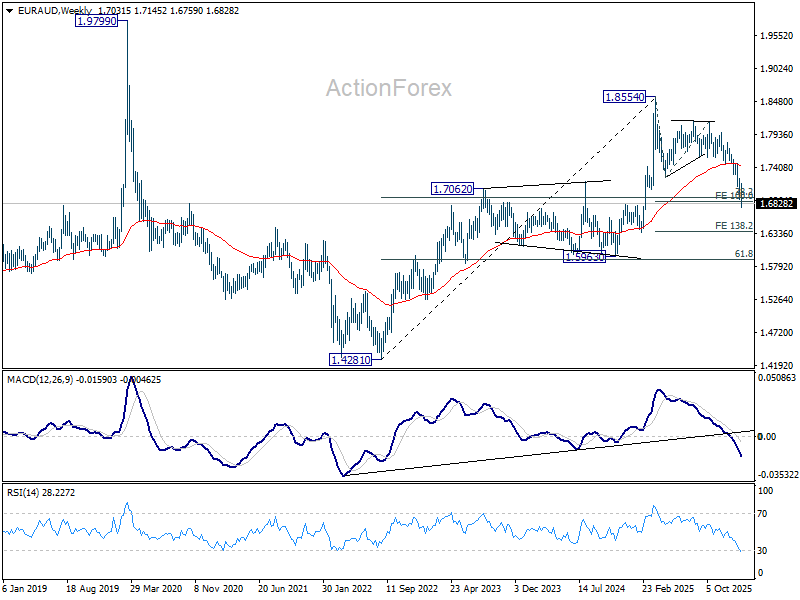
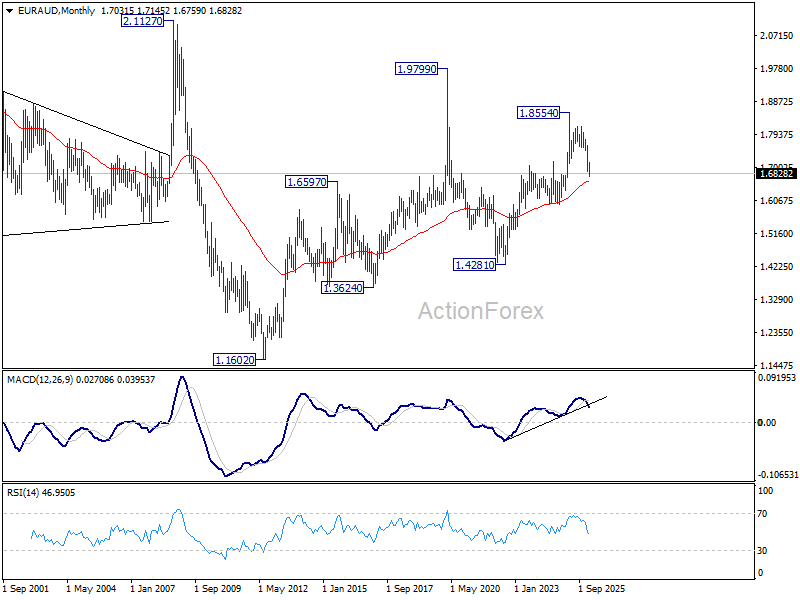
In the longer term picture, rise from 1.4281 is seen as the second leg of the pattern from 1.9799 (2020 high), which is part of the pattern from 2.1127 (2008 high). Current development argue that it has already completed at 1.8554. Sustained trading below 55 M EMA (now at 1.6605) will confirm this bearish case, and pave the way back towards 1.4281.
EUR/CHF Weekly Outlook
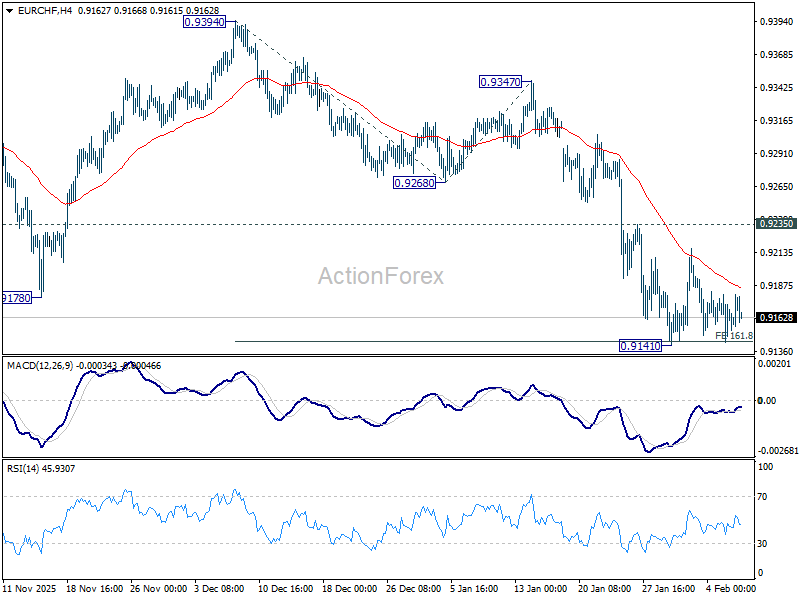
EUR/CHF stayed in consolidations above 0.9141 last week and outlook is unchanged. Initial bias remains neutral this week first. Another recovery cannot be ruled out, but upside should be limited below 0.9235 resistance. On the downside, firm break of 0.9141 will extend larger down trend to 261.8% projection of 0.9394 to 0.9268 from 0.9347 at 0.9143.
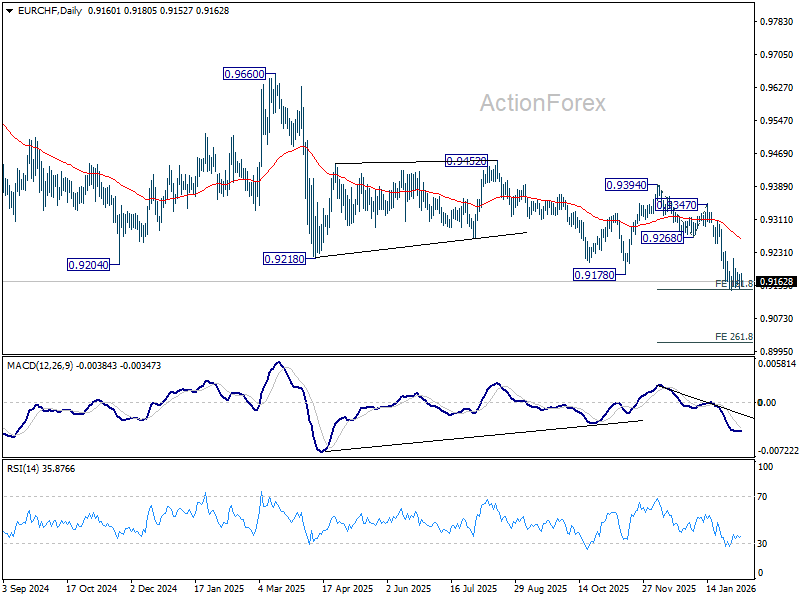
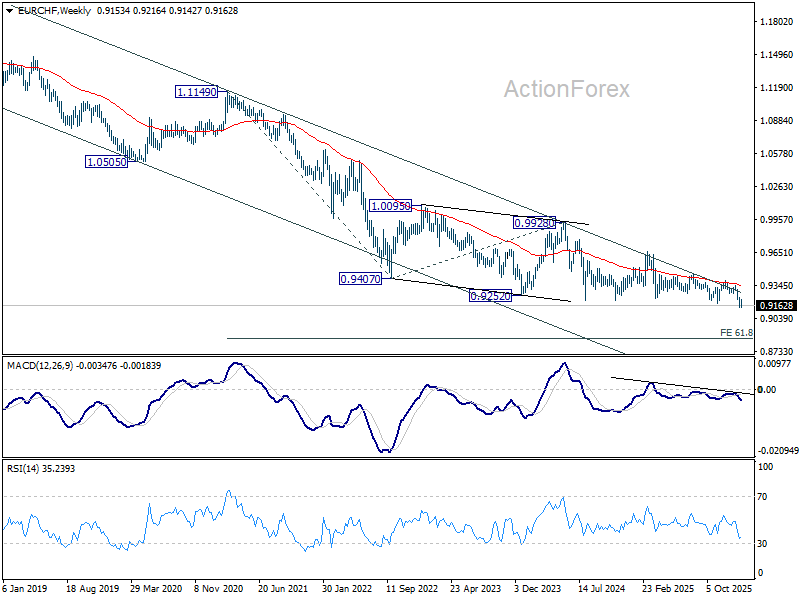
In the bigger picture, down trend from 0.9928 (2024 high) is still in progress with falling 55 W EMA (now at 0.9341) intact. Next target is 61.8% projection of 1.1149 to 0.9407 from 0.9928 at 0.8851. Outlook will stay bearish as long as 0.9394 resistance holds, in case of recovery.
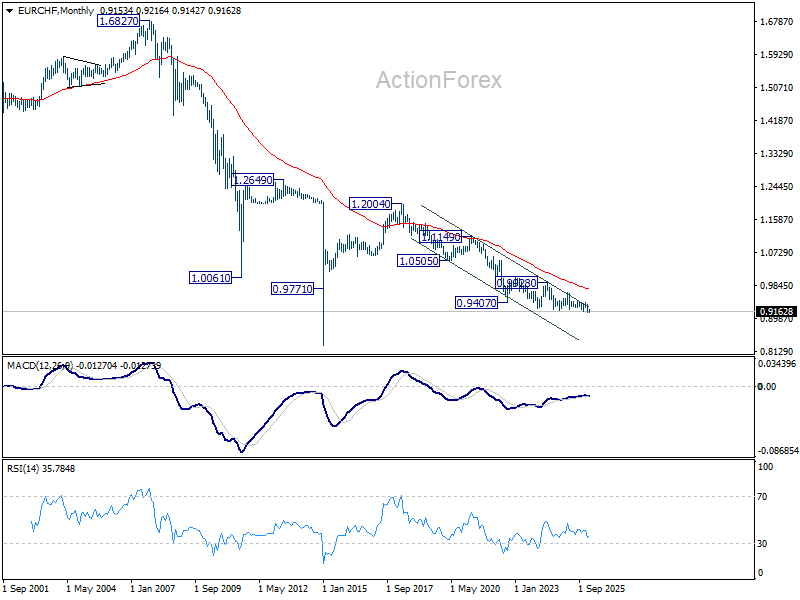
In the long term picture, EUR/CHF is also holding well inside long term falling trend channel. Down trend from 1.2004 (2018 high) is still in progress. Outlook will continue to stay bearish as long as falling 55 M EMA (now at 0.9739) holds.
US NFP and CPI double-decker – Markets Weekly Outlook
- Discover our Weekly Market Outlook, exploring themes and events that forged financial flows throughout the week.
- After a volatile stretch, traders buckle for a heavy-slate of US data.
- Get ready for next week's action by exploring upcoming events across global Markets.
Week in review – Tech, Metals and Cryptos meltdown
It is surprising to conclude a week that hasn't been marked by any crazy geopolitical headline or regime-changing event, yet markets were no less volatile.
After last week's gigantic drop in Metals, a wave of anxiety took traders by surprise, who embarked on a deleveraging journey – As we've seen since October, the previously undefeated Tech/Software sector and Cryptocurrencies are taking a streak of gut punches.
That's the particularity of high-volatility assets – standing at the extreme of the risk spectrum, they get battered a bit more than their more conservative counterparts.
Bitcoin and altcoins were the hardest hit by the recent market developments. The face of the digital asset Market corrected by more than 30% in a matter of three weeks of trading, reaching $60,000 in Thursday evening action. Quite a selloff.
But it seems we are indeed in the age of dip-buying, with prices bouncing back again today, $10,000 higher, and the mood not worsening much from the Thursday dips – Is this a dead cat bounce?
Can't say for sure, as we are in uncharted waters; some previous corrections extended beyond 50%, but participants will gain more certainty as time goes on.
Nasdaq also lost beyond 7%, leading US Indexes to their weekly tumbles before recovering back to 25,000, despite record earnings and CapEx announcements. The latter is what investors could be punishing with AI taking its part in this week's cloudy mood.
Artificial Intelligence is now feared to be causing the latest cracks in the mid-tier employment reports received throughout the week.
The Dow Jones was the star of the show, powered by strong outperformance from the Consumer Defensive, Industrial, and Financial sectors, casually reaching the 50,000 Milestone in the process!
The sudden rise in the Manufacturing PMIs also affected the flows!
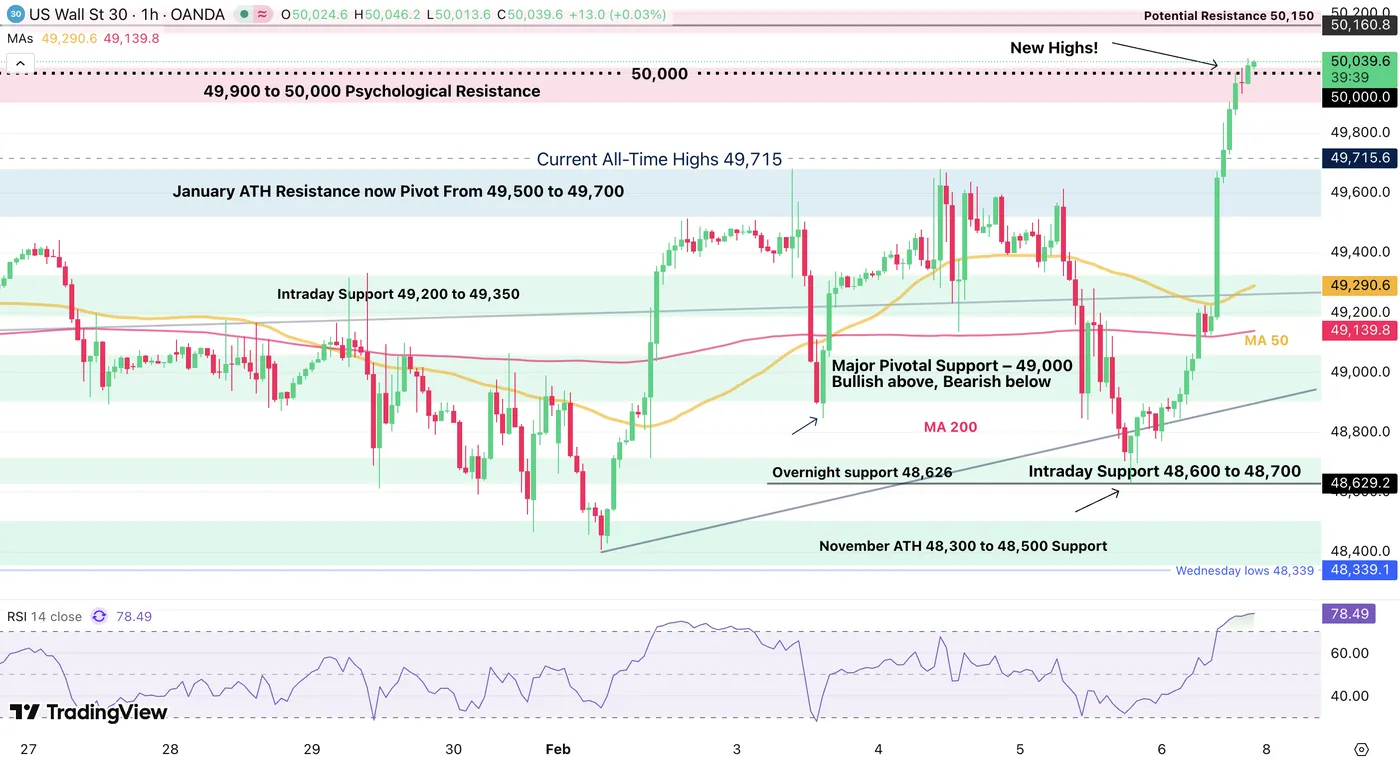
Dow Jones (CFD) 1H Chart – February 6, 2026 – Source: TradingView
It's quite a strong trend in Equities that has developed since the beginning of 2026.
I hope that some investors read our month-old edition on that aspect.
Nevertheless, it isn't like the sky is clear if you take a step back. Except for Energy, Defensive stocks and Emerging Markets breaking out, some rough charts are crippling Participants mood and volatility remains extremely elevated.
And it isn't the investor's best friend.
While US-Iran discussions are currently ongoing (and continuing throughout the weekend), skepticism is high among the two sides.
Conversations were reported to be constructive, yet demands from the US side are strict, and could see resistance from Iran – they rejected US calls to halt uranium enrichment and that's pretty much all we know for now.
A reminder that 30,000 casualties emerged from the Iranian revolts, and the toll could be higher – A very tragic development.
This surely is one of the more anxiety-prone developments for Markets which will need to be tracked closely throughout the weekend and coming weeks.
Weekly Performance across Asset Classes
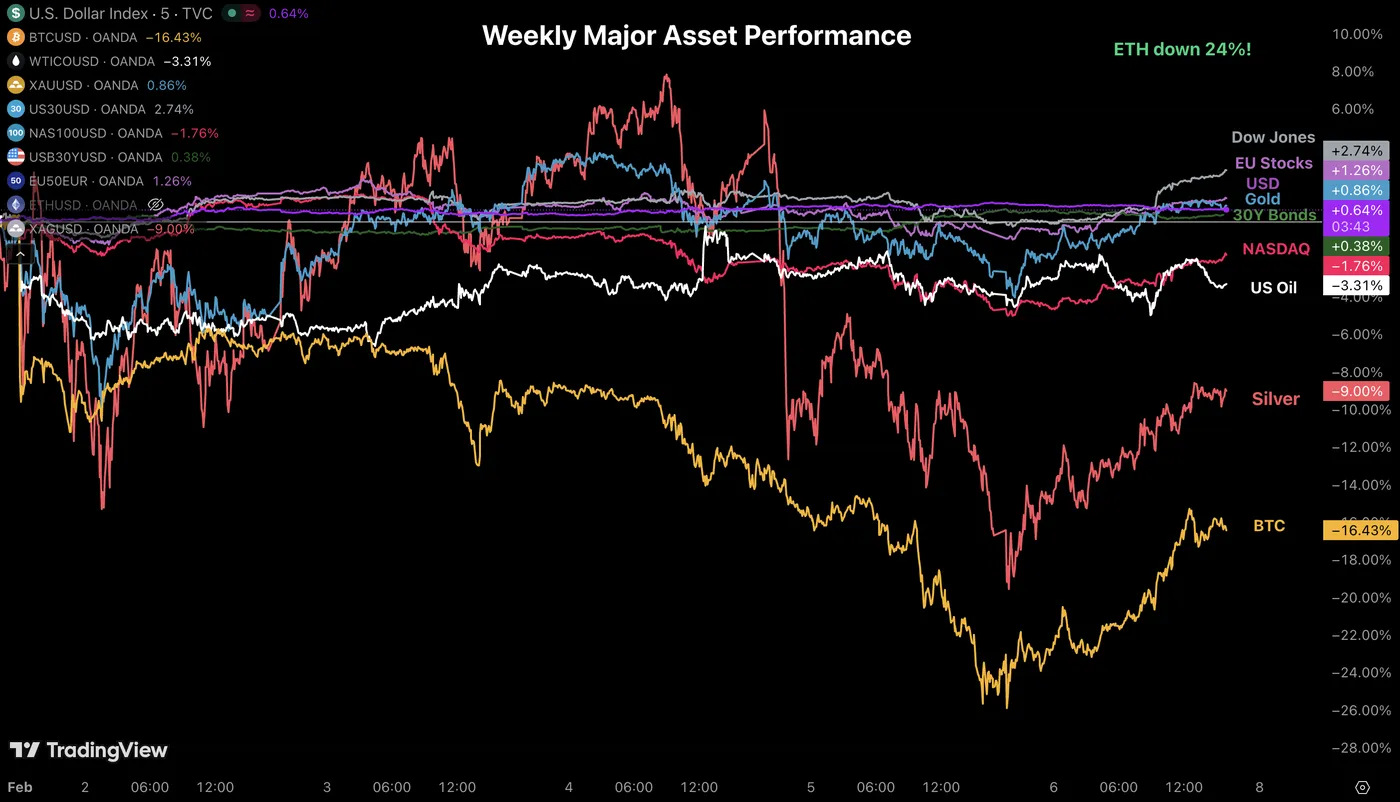
Weekly Asset Performance – February 6, 2026 – Source: TradingView
Metals caught some strays throughout the week but have remained resilient with the uncertainty ahead.
They are only back down to their 2026 starts, so nothing too concerning for now – But expect some more craziness next week with the NFP and CPI reports!
The Week Ahead – High tier US data on the deck
Asia Pacific Markets – Japan Snap elections and China CPI
Next week doesn't hold too many releases for APAC markets but will still have a high influence on Markets.
The main event is the Japanese general elections that will take place on Sunday morning (Saturday evening in North America) and will see whether recent explosions in the Nikkei 225, at the cost of the Yen, will be warranted.
Expect a volatile FX open on Sunday.
China will also publish their monthly CPI data which is an important tracker for the AUD and NZD and can also affect Global equities.
About the New Zealand Dollar, traders will have to check in on Thursday evening for the RBNZ Inflation expectations, a key test after the Kiwi's recent show of strength.
Europe and UK Markets – Swiss Inflation, UK GDP and EU plenary debate
Europe hasn't been subject to much volatility for the past month with traders focusing more on commodities and developments elsewhere.
But with the Swiss Franc getting quite a lift from Market volatility, its look as the main safe-haven currency could get tested next Friday with the CPI release for Switzerland.
Traders will see if they can officially close out negative rates pricing for this year.
The only major data that will be released from the old continent comes from the UK, which releases its GDP data on Thursday and could have a strong influence on the GBP after the more dovish Bank of England meeting!
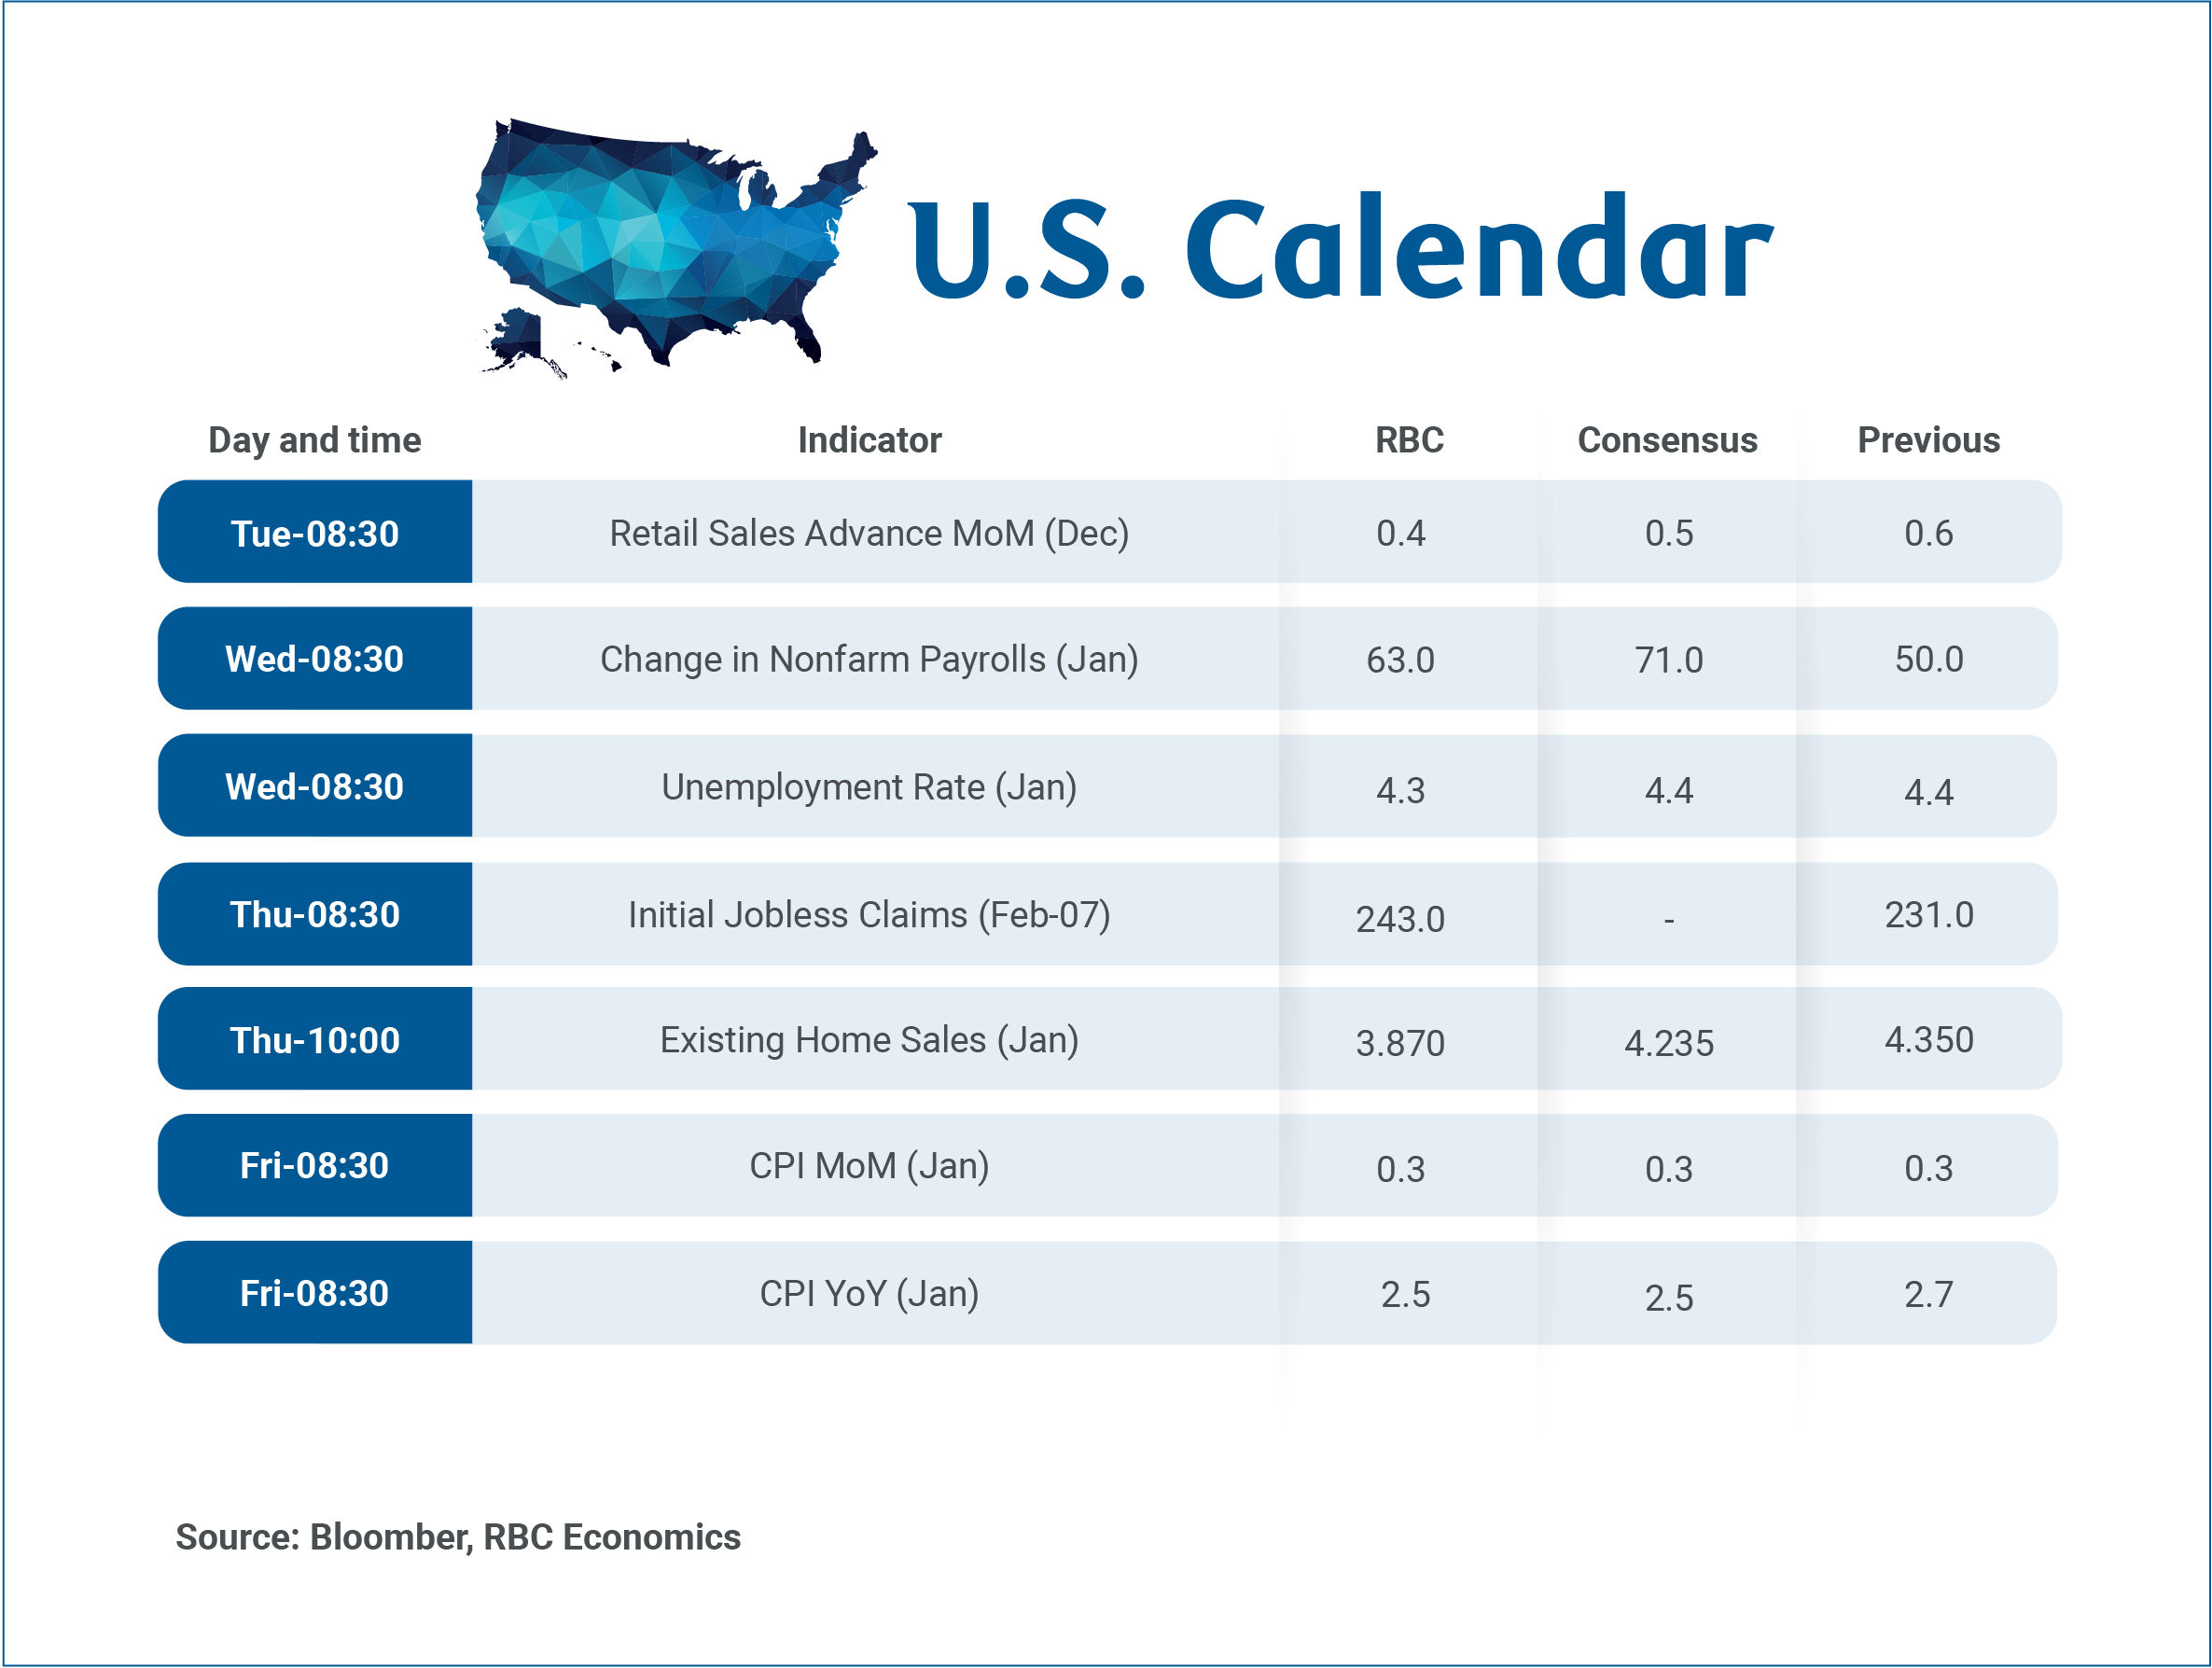
North American Markets – US data triple-whammy: NFP, CPI and Retail Sales
The recently ended partial Shutdown pushed the Non-Farm Payrolls report to this week, and is taking the Market on quite a rocky path ahead.
Monday will bring its wave of Fed speeches, and it is undoubtedly the least-packed session of the week for the US.
Waller's views could become interesting again as he officially got taken off the Federal Reserve Chair list so that he might take a more hawkish or at least neutral tone.
Tuesday will kick off the heavy slate of data week with Retail Sales (exp at 0.5%), but it will only open the door to the larger releases.
Non-Farm Payrolls are scheduled for Wednesday at 8:30 A.M. and should bring further certainty to the US Jobs market after this week’s few warnings.
But participants will only be able to sigh on Friday, depending on whether the US inflation report continues to show some easing.
The CPI is expected to increase by 0.3% m/m.
Keep a close eye on geopolitical developments, particularly those involving the US-Iran talks, as they are likely to continue influencing Commodity and broader Markets.
Next Week's High Tier Economic Events
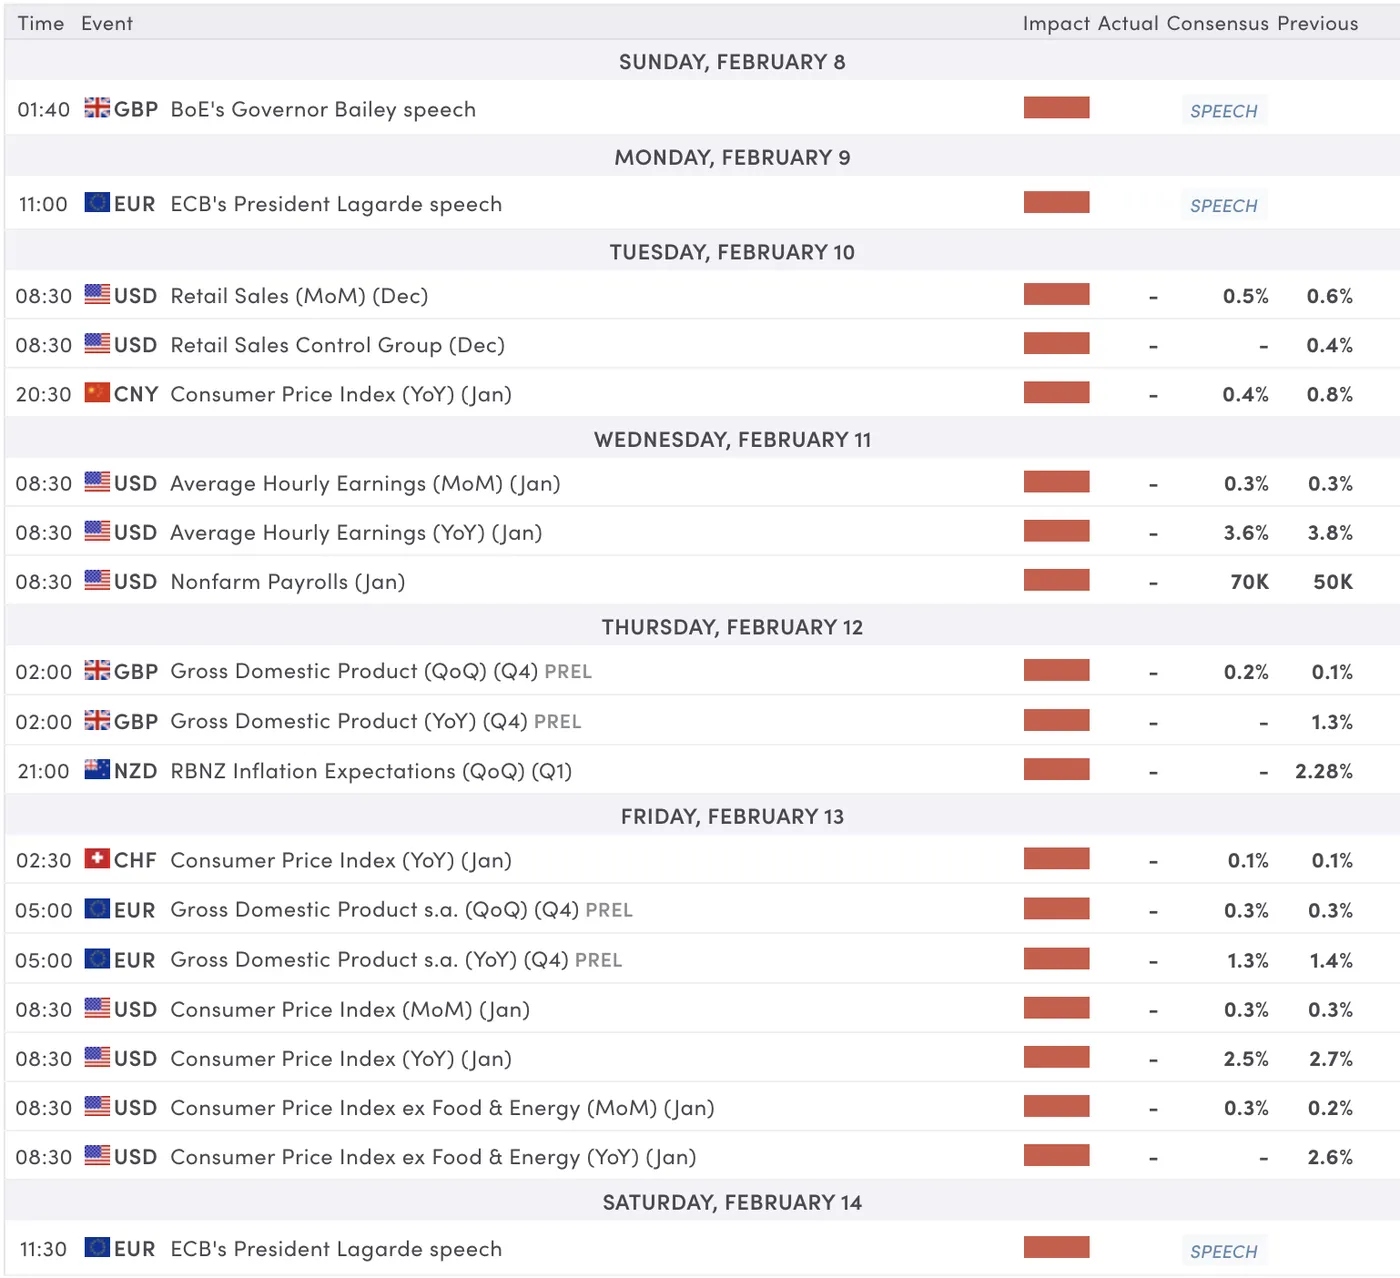
For all market-moving economic releases and events, see the MarketPulse Economic Calendar. (High-tier data only)
Safe Trades and enjoy your weekend!
The Weekly Bottom Line: Shutdown Ended, Labor Market Concerns Linger
Canadian Highlights
- January’s jobs report surprised with a decline in the unemployment rate. However, the details paint a less positive picture, with the economy losing jobs, and a tighter job market driven by an even larger decline in the labour force.
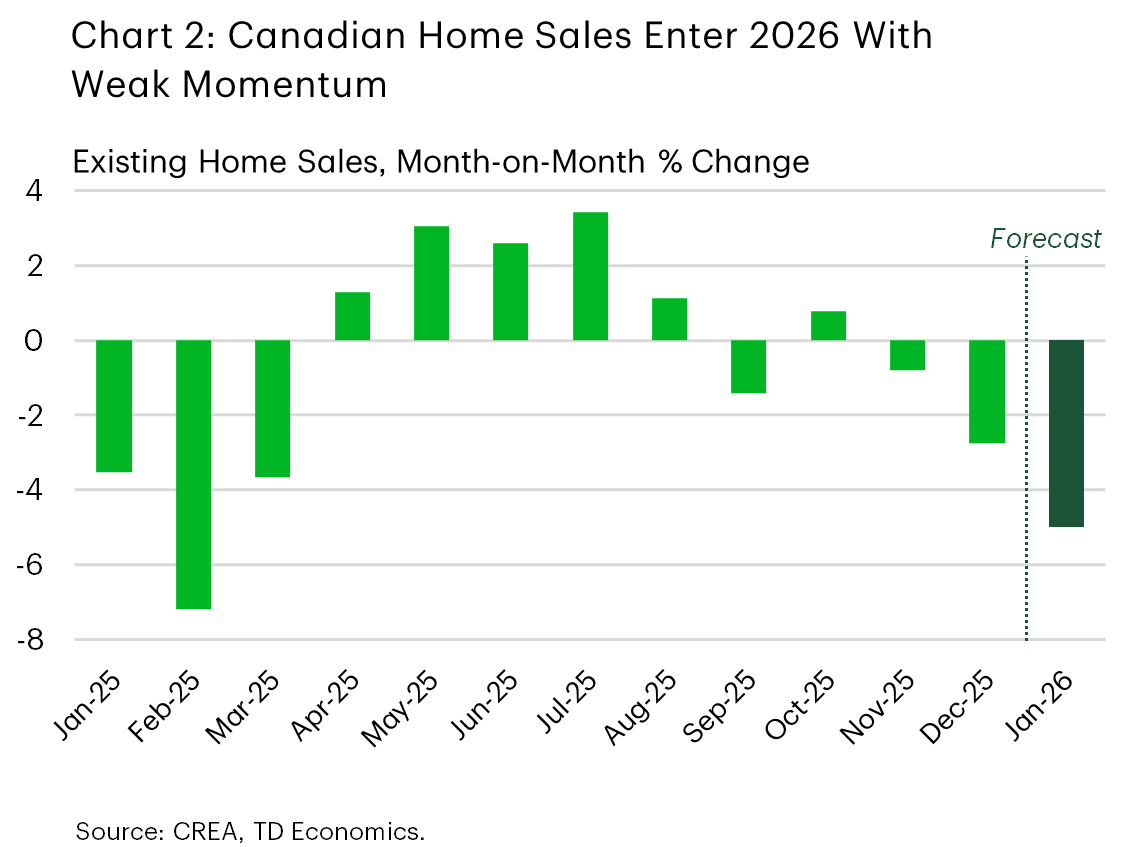
- Preliminary home sales and price growth data for January sent a chill through key Canadian markets, putting the housing market on weak footing to start the year.
- Prime Minister Carney introduced a new plan to reduce emissions from transportation and boost Canada’s EV industry.
U.S. Highlights
- Congress passed legislation to fund most of the government through September, with a 2-week continuing resolution used for the Department of Homeland Security.
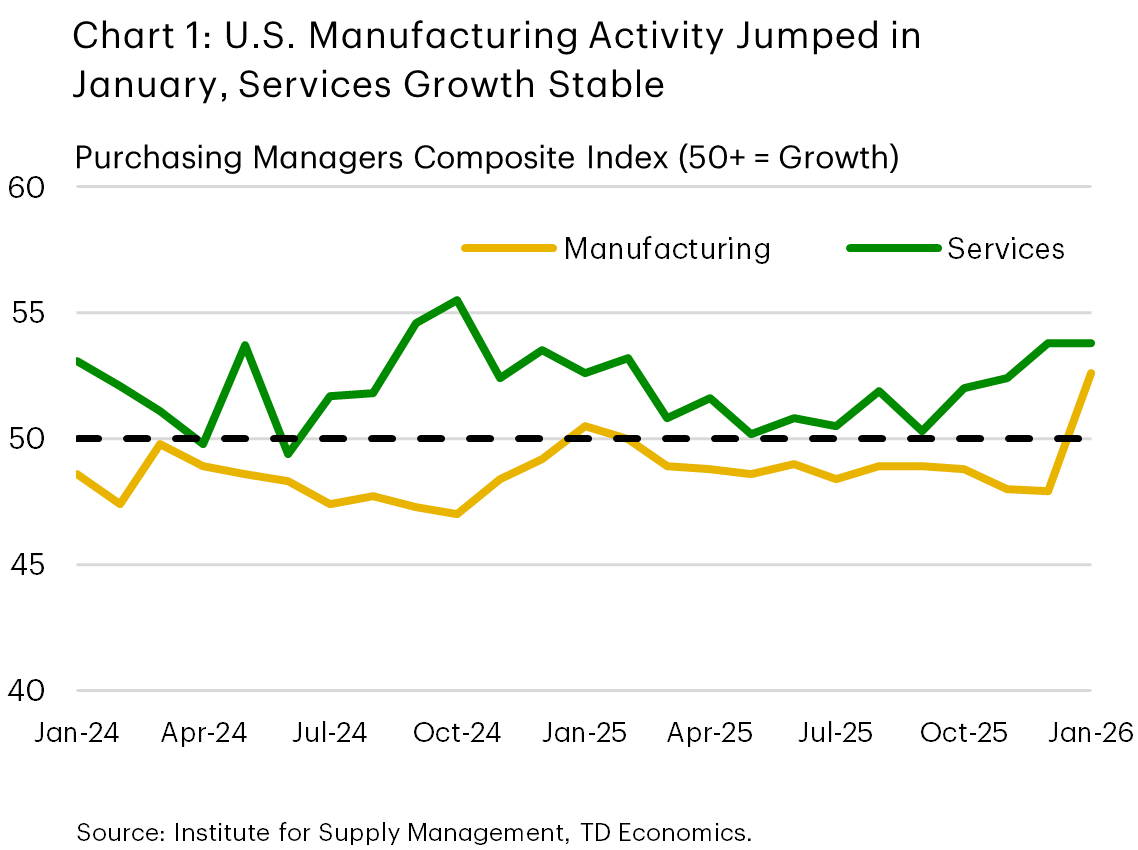
- The ISM Purchasing Managers Index reports showed solid growth in manufacturing and services activity in January, suggesting the economy entered 2026 on a solid footing.
- January data releases for employment and inflation next week will be closely monitored for potential risks related to the Fed’s dual mandate.
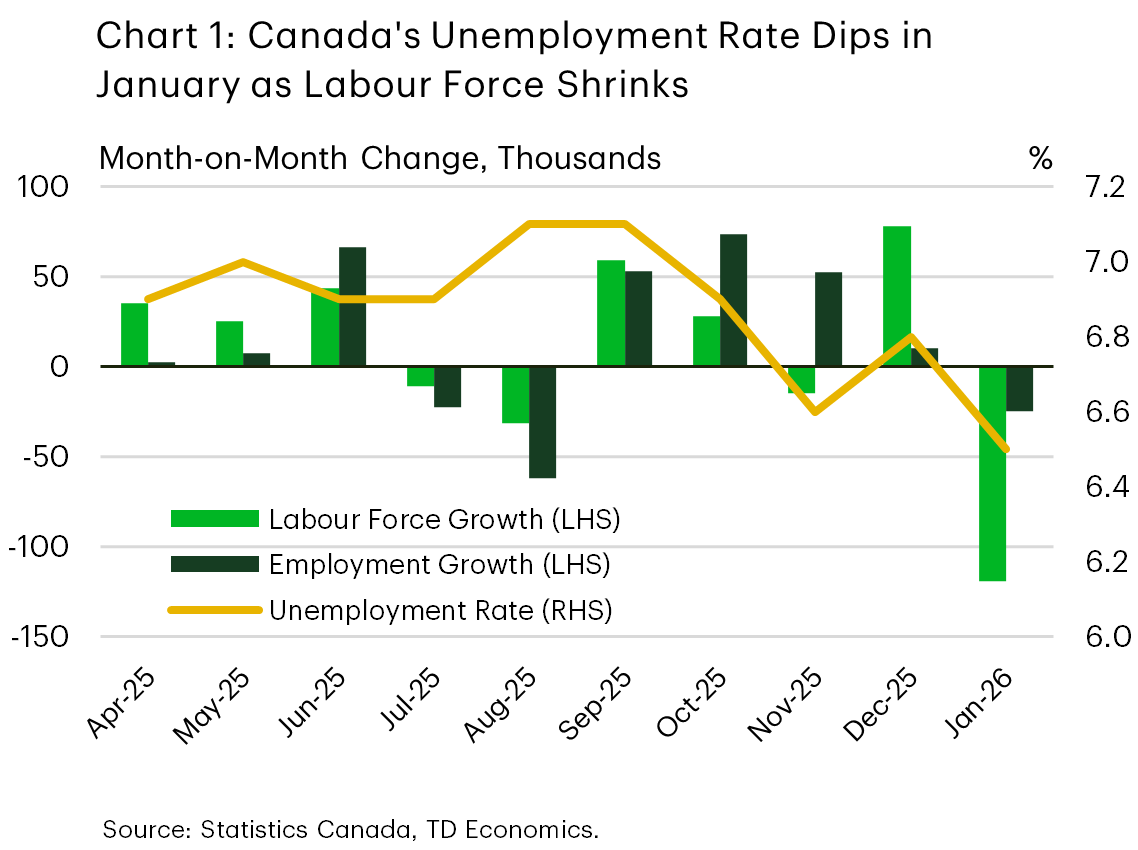
Canada – Labour Market Sending Mixed Signals
Precious metals rebounded early in the week, briefly boosting the TSX before broader market caution pushed the index lower, finishing roughly flat on the week. Canadian government bond yields were less volatile and ended the week mostly unchanged. Meanwhile, the US dollar continued to strengthen, causing the Loonie to fall to 73 cents/USD. The depreciation was limited as Bank of Canada Governor Tiff Macklem dismissed further rate cuts in his first public speech of 2026.
The first jobs report for 2026 was the main economic event this week. January’s jobs numbers were full of surprises. The unemployment rate dropped three ticks to 6.5%, reversing December’s increase. This occurred despite the economy losing 25k jobs in January, since the labour force contracted by a larger 120k people. Large swings in the month-to-month labour force survey numbers are common, but January was the biggest drop in the labour force since early-2021 (Chart 1). With Canada’s population projected to contract this year, the unemployment rate can continue to fall even if Canada is losing jobs.
Zooming out, the Labour Force Survey has notably outperformed its companion payrolls survey, which has given much weaker signals about the health of Canada’s job market. An objective evaluation of both readings likely puts the actual health of the labour market somewhere in the middle. The labour market entered this year on a soft note, but the gradual decline in the unemployment rate suggests that the situation is improving. We recently released a report that combs through several other job market indicators tracked by the Bank of Canada (BoC) to help make sense of some of this discrepancy.
Beyond this week’s labour market report, we have limited data to inform Canada’s early-year economic performance. Preliminary housing figures for January showed double-digit home sales declines in Toronto and Greater Vancouver, with Calgary seeing a slight increase (Chart 2). A wave of new listings eased market conditions, while average prices fell 1–2% month-over-month, continuing recent softness. Overall, Canada’s housing market is set for a subdued year, mirroring our view for tepid overall growth in Canada in 2026. Consumer spending will likely cool and investment remain weak, though government expenditures and improved exports should help offset these trends. We forecast real GDP growth to slow to about 1.0% this year before moderately accelerating to trend-like growth by 2027.
The federal government grabbed attention again this week with a shift in policies related to electric vehicles (EVs). On February 5th, Prime Minister Carney introduced a new plan to reduce emissions from transportation and boost Canada’s EV industry. The main points of the strategy feature stricter emissions rules for vehicles made between 2027 and 2032, aiming for electric vehicles to make up 75% of sales. Additionally, the plan includes a $2.3 billion rebate program for EVs and allocates $1.5 billion toward expanding EV charging stations. Full details can be found in our coverage here.
U.S. – Shutdown Ended, Labor Market Concerns Linger
The first week of February was eventful on several fronts. The partial government shutdown, which began over the weekend, ended on Tuesday as the House managed to pass the requisite spending bills. Funding for the Department of Homeland Security was provided by a 2-week continuing resolution - which expires on February 13th - as both parties continue to negotiate the details of the department’s funding. Despite the positive news, financial markets had a tough week, with the S&P 500 down 0.7% as of the time of writing, owing in part to investor concerns regarding the impact of AI on existing business models.
On the economic data front, the ISM Purchasing Manager Index (PMI) reports showed a substantial uptick in manufacturing activity in January (Chart 1). However, survey respondents noted that this was at least partly owing to post-holiday inventory replenishment and front-loading activity ahead of potential new tariffs on Europe and other nations. The services PMI also pointed to growth in activity in January, although the acceleration recorded in recent months eased. On aggregate, these reports suggest economic activity remained on a solid footing to start the new year.
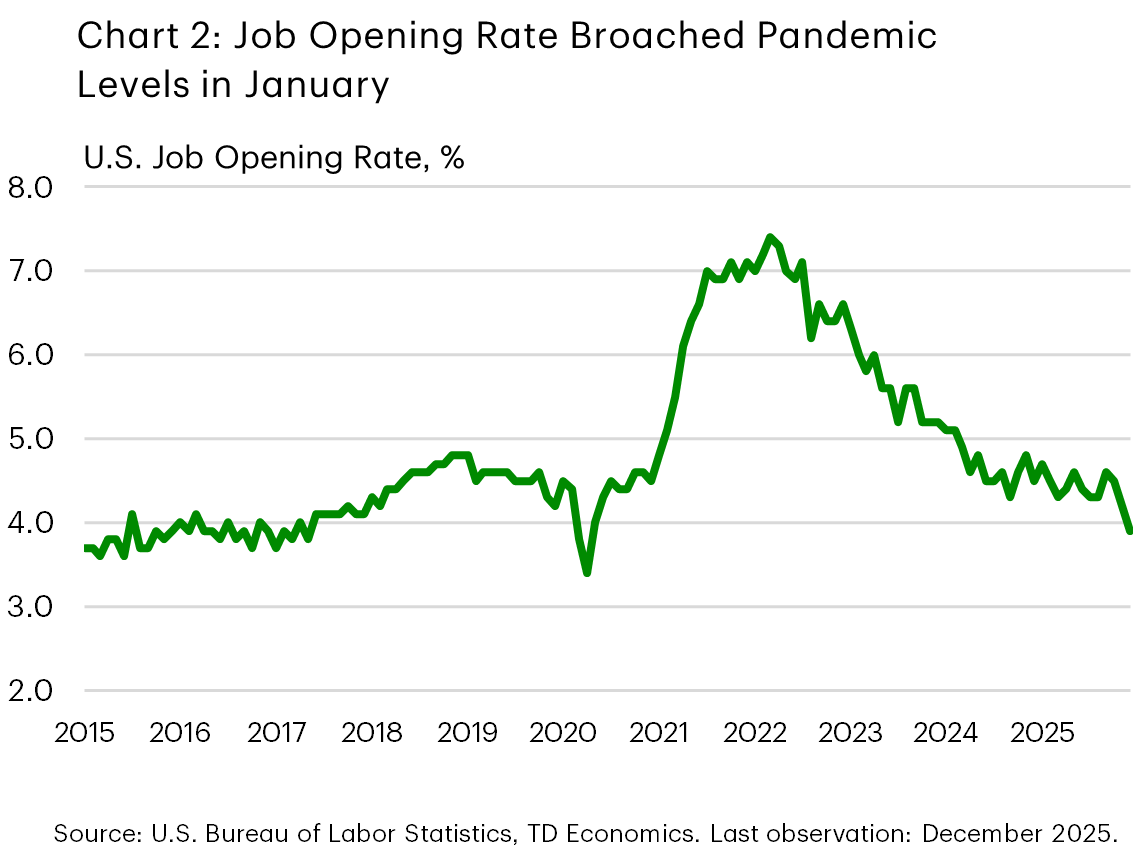
Our ability to see if this translated to the labor market in January was delayed by a week owing to the shutdown, with the Bureau of Labor Statistics pushing the release of the employment report to next Wednesday (originally scheduled for February 6th). However, we did receive the Job Opening & Labor Turnover report on Thursday, which showed a sharp drop in the job opening rate in December (Chart 2), particularly among white-collar sectors. The slowdown in the labor market has been a key concern for the Federal Reserve and provided the main rationale for the three “risk management” rate cuts implemented by the FOMC last year. Next week’s employment report will be watched closely, with a healthy addition of 70k jobs currently expected by consensus forecasters.
Although the next Fed meeting is still six weeks away, the Fed officials we heard from this week - including Atlanta Fed President Bostic, Richmond Fed President Barkin, and Fed Governor Lisa Cook - were broadly consistent in their view of the balance of risks between the Fed’s dual mandate. Most believed that risks to the labor market have eased, and that the persistent deviation of inflation from the 2% target is currently the greater risk. All speakers this week stated that patience was warranted to ensure that recent disinflation progress was sustained, but Governor Cook also noted that the FOMC was cognizant of the lingering risks to the labor market and would respond accordingly to the evolving risk environment.
Core CPI inflation sat at 2.6% in December, but price growth momentum dropped materially in the aftermath of the October government shutdown disruption. Further information will be available with next week’s CPI report for January, which is expected to show a modest drop in core CPI to 2.5%.
Weekly Economic & Financial Commentary: The Labor Market Is Not Out of the Woods
Summary
United States: The Labor Market Is Not Out of the Woods
- Job openings in December slipped roughly 10% year-over-year to their lowest level since September 2020. While business activity picked up in the services and manufacturing sectors, so did price pressures.
- Next week: Retail Sales (Tue.), Employment (Wed.), Existing Home Sales (Thu.), CPI (Fri.)
International: Central Banks Still in the Spotlight
- It was a busy week for foreign central bank announcements, though the only policy move came from Australia, where the RBA delivered a rate hike. The Bank of England, the European Central Bank and Banxico all held rates steady. Outside of central bank developments, Canada’s latest labor market data offered a mixed picture.
- Next week: Japan Labor Cash Earnings (Mon.), U.K. GDP (Thu.)
Topic of the Week: New Year, New Tariffs: January Tariff Developments
- Trade policy dominated headlines again during the first month of 2026. But despite escalatory rhetoric, the U.S. average tariff rate actually nudged down modestly.
U.S. Inflation Center Stage as Food Pressures Persist Across Borders
The coming week is relatively quiet for Canadian economic data releases with no major reports scheduled. As a result, attention will shift to developments south of the border with January’s U.S labour market data on Wednesday and inflation on Friday.
Both releases will be closely watched by the U.S. Federal Reserve ahead of the next interest rate decision in March, but also by the Bank of Canada for implications on Canadian growth and the inflation outlook.
Headline U.S. price growth likely slowed in January, driven by a 3% seasonally adjusted pullback in gasoline prices from December. But, we look for core price growth to remain unchanged at 2.6%—stretching readings above the Fed’s 2% inflation target to almost five years.
Tariff passthrough to consumer prices has been limited so far, but business surveys continue to flag further increases in the pipeline, and core producer price inflation continues to run well above consumer price growth (3.5% in December).
We look for food inflation to hold close to 3%. Measured year-over-year shelter inflation is still above 3% despite being lowered in November and December by a methodological quirk due to the U.S. government shutdown in October that should reverse by April.
Comparing inflation in Canada and the U.S.
There are clearly key differences in the current drivers of inflation in Canada and the U.S. Tariff increases in Canada over the last year have been limited, and business surveys like the BoC’s Business Outlook Survey point to easing business input cost inflation.
But, there are some similarities. Food prices have also been rising sharply in Canada, driven by the lagged impact of what are still relatively high global agricultural commodity prices, and low Canadian cattle inventories. They are adding upward pressure to beef prices rather than tariffs.
Broader U.S. tariffs can still spill over to higher costs for Canadian producers through integrated supply chains, and the BoC has cited restructuring costs to avoid tariffs as a key upside risk to future Canadian inflation.
U.S. jobs should tick higher despite recent indicators
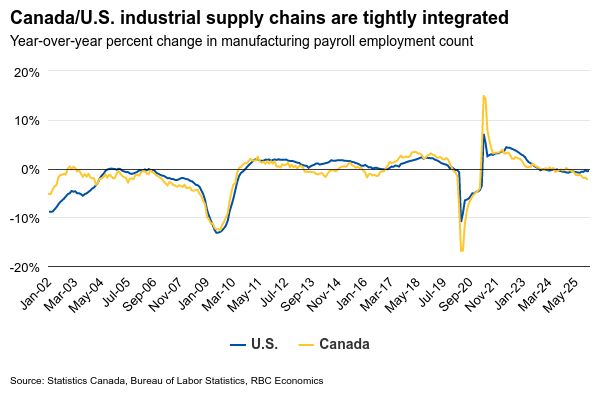
We (and the BoC) will also be closely watching the delayed by the brief government shutdown over the past week (previously scheduled for Feb. 6) U.S. labour market report for signs the market is stabilizing. Particularly, in the manufacturing sector where ties with the Canadian economy are closest, and where employment counts have been steadily falling.
A run of weaker U.S. labour market data over the last week (spike in announced layoffs in January, higher initial jobless claims in the latest week, and a pullback in job openings) are a reminder the U.S. market has softened. But, private sector job openings data (indeed.com) looked better in January, and we continue to expect an 63k increase in overall employment in January.
Summary 2/9 – 2/13
Monday, Feb 9, 2026
| GMT | Ccy | Events | Cons | Prev |
|---|---|---|---|---|
| 23:30 | JPY | Labor Cash Earnings Y/Y Dec | 3.00% | 1.70% |
| 23:50 | JPY | Current Account (JPY) Dec | 2.95T | 3.14T |
| 05:00 | JPY | Eco Watchers Survey: Current Jan | 49.1 | 48.6 |
| 08:00 | CHF | SECO Consumer Climate Q1 | -30 | -31 |
| 09:30 | EUR | Eurozone Sentix Investor Confidence Feb | -0.2 | -1.8 |
| 23:30 | JPY |
| Labor Cash Earnings Y/Y Dec | |
| Consensus | 3.00% |
| Previous | 1.70% |
| 23:50 | JPY |
| Current Account (JPY) Dec | |
| Consensus | 2.95T |
| Previous | 3.14T |
| 05:00 | JPY |
| Eco Watchers Survey: Current Jan | |
| Consensus | 49.1 |
| Previous | 48.6 |
| 08:00 | CHF |
| SECO Consumer Climate Q1 | |
| Consensus | -30 |
| Previous | -31 |
| 09:30 | EUR |
| Eurozone Sentix Investor Confidence Feb | |
| Consensus | -0.2 |
| Previous | -1.8 |
Tuesday, Feb 10, 2026
| GMT | Ccy | Events | Cons | Prev |
|---|---|---|---|---|
| 23:30 | AUD | Westpac Consumer Confidence Feb | -1.70% | |
| 23:50 | JPY | Money Supply M2+CD Y/Y Jan | 1.80% | 1.70% |
| 00:01 | GBP | BRC Retail Sales Monitor Y/Y Jan | 1.20% | 1.00% |
| 00:30 | AUD | NAB Business Confidence Jan | 3 | |
| 00:30 | AUD | NAB Business Conditions Jan | 9 | |
| 11:00 | USD | NFIB Business Optimism Index Jan | 99.9 | 99.5 |
| 13:30 | USD | Retail Sales M/M Dec | 0.40% | 0.60% |
| 13:30 | USD | Retail Sales ex Autos M/M Dec | 0.40% | 0.50% |
| 13:30 | USD | Employment Cost Index Q4 | 0.80% | 0.80% |
| 13:30 | USD | Import Price Index M/M Dec | 0.10% | 0.40% |
| 15:00 | USD | Business Inventories Nov | 0.20% | 0.30% |
| 23:30 | AUD |
| Westpac Consumer Confidence Feb | |
| Consensus | |
| Previous | -1.70% |
| 23:50 | JPY |
| Money Supply M2+CD Y/Y Jan | |
| Consensus | 1.80% |
| Previous | 1.70% |
| 00:01 | GBP |
| BRC Retail Sales Monitor Y/Y Jan | |
| Consensus | 1.20% |
| Previous | 1.00% |
| 00:30 | AUD |
| NAB Business Confidence Jan | |
| Consensus | |
| Previous | 3 |
| 00:30 | AUD |
| NAB Business Conditions Jan | |
| Consensus | |
| Previous | 9 |
| 11:00 | USD |
| NFIB Business Optimism Index Jan | |
| Consensus | 99.9 |
| Previous | 99.5 |
| 13:30 | USD |
| Retail Sales M/M Dec | |
| Consensus | 0.40% |
| Previous | 0.60% |
| 13:30 | USD |
| Retail Sales ex Autos M/M Dec | |
| Consensus | 0.40% |
| Previous | 0.50% |
| 13:30 | USD |
| Employment Cost Index Q4 | |
| Consensus | 0.80% |
| Previous | 0.80% |
| 13:30 | USD |
| Import Price Index M/M Dec | |
| Consensus | 0.10% |
| Previous | 0.40% |
| 15:00 | USD |
| Business Inventories Nov | |
| Consensus | 0.20% |
| Previous | 0.30% |
Wednesday, Feb 11, 2026
| GMT | Ccy | Events | Cons | Prev |
|---|---|---|---|---|
| 01:30 | CNY | CPI Y/Y Jan | 0.40% | 0.80% |
| 01:30 | CNY | PPI Y/Y Jan | -1.50% | -1.90% |
| 13:30 | CAD | Building Permits M/M Dec | 4.90% | -13.10% |
| 13:30 | USD | Nonfarm Payrolls Jan | 66K | 50K |
| 13:30 | USD | Unemployment Rate Jan | 4.40% | 4.40% |
| 13:30 | USD | Average Hourly Earnings M/M Jan | 0.30% | 0.30% |
| 15:30 | USD | Crude Oil Inventories | -0.2M | -3.5M |
| 18:30 | CAD | BOC Summary of Deliberations |
| 01:30 | CNY |
| CPI Y/Y Jan | |
| Consensus | 0.40% |
| Previous | 0.80% |
| 01:30 | CNY |
| PPI Y/Y Jan | |
| Consensus | -1.50% |
| Previous | -1.90% |
| 13:30 | CAD |
| Building Permits M/M Dec | |
| Consensus | 4.90% |
| Previous | -13.10% |
| 13:30 | USD |
| Nonfarm Payrolls Jan | |
| Consensus | 66K |
| Previous | 50K |
| 13:30 | USD |
| Unemployment Rate Jan | |
| Consensus | 4.40% |
| Previous | 4.40% |
| 13:30 | USD |
| Average Hourly Earnings M/M Jan | |
| Consensus | 0.30% |
| Previous | 0.30% |
| 15:30 | USD |
| Crude Oil Inventories | |
| Consensus | -0.2M |
| Previous | -3.5M |
| 18:30 | CAD |
| BOC Summary of Deliberations | |
| Consensus | |
| Previous | |
Thursday, Feb 12, 2026
| GMT | Ccy | Events | Cons | Prev |
|---|---|---|---|---|
| 23:50 | JPY | PPI Y/Y Jan | 2.30% | 2.40% |
| 00:00 | AUD | Consumer Inflation Expectations Feb | 4.60% | |
| 00:01 | GBP | RICS Housing Price Balance Jan | -11% | -14% |
| 07:00 | GBP | GDP M/M Dec | 0.10% | 0.30% |
| 07:00 | GBP | GDP Q/Q Q4 P | 0.20% | 0.10% |
| 07:00 | GBP | Industrial Production M/M Dec | 0.00% | 1.10% |
| 07:00 | GBP | Industrial Production Y/Y Dec | 1.50% | 2.30% |
| 07:00 | GBP | Manufacturing Production Y/Y Dec | -0.10% | 2.10% |
| 07:00 | GBP | Manufacturing Production M/M Dec | 1.80% | 2.10% |
| 07:00 | GBP | Goods Trade Balance (GBP) Dec | -22.0B | -23.7B |
| 13:30 | USD | Initial Jobless Claims (Feb 6) | 222K | 231K |
| 15:00 | USD | Existing Home Sales Jan | 4.25M | 4.35M |
| 15:30 | USD | Natural Gas Storage (Feb 6) | -256B | -360B |
| 23:50 | JPY |
| PPI Y/Y Jan | |
| Consensus | 2.30% |
| Previous | 2.40% |
| 00:00 | AUD |
| Consumer Inflation Expectations Feb | |
| Consensus | |
| Previous | 4.60% |
| 00:01 | GBP |
| RICS Housing Price Balance Jan | |
| Consensus | -11% |
| Previous | -14% |
| 07:00 | GBP |
| GDP M/M Dec | |
| Consensus | 0.10% |
| Previous | 0.30% |
| 07:00 | GBP |
| GDP Q/Q Q4 P | |
| Consensus | 0.20% |
| Previous | 0.10% |
| 07:00 | GBP |
| Industrial Production M/M Dec | |
| Consensus | 0.00% |
| Previous | 1.10% |
| 07:00 | GBP |
| Industrial Production Y/Y Dec | |
| Consensus | 1.50% |
| Previous | 2.30% |
| 07:00 | GBP |
| Manufacturing Production Y/Y Dec | |
| Consensus | -0.10% |
| Previous | 2.10% |
| 07:00 | GBP |
| Manufacturing Production M/M Dec | |
| Consensus | 1.80% |
| Previous | 2.10% |
| 07:00 | GBP |
| Goods Trade Balance (GBP) Dec | |
| Consensus | -22.0B |
| Previous | -23.7B |
| 13:30 | USD |
| Initial Jobless Claims (Feb 6) | |
| Consensus | 222K |
| Previous | 231K |
| 15:00 | USD |
| Existing Home Sales Jan | |
| Consensus | 4.25M |
| Previous | 4.35M |
| 15:30 | USD |
| Natural Gas Storage (Feb 6) | |
| Consensus | -256B |
| Previous | -360B |
Friday, Feb 13, 2026
| GMT | Ccy | Events | Cons | Prev |
|---|---|---|---|---|
| 21:30 | NZD | Business NZ PMI Jan | 56.1 | |
| 07:30 | CHF | CPI M/M Jan | 0.00% | 0.00% |
| 07:30 | CHF | CPI Y/Y Jan | 0.10% | 0.10% |
| 10:00 | EUR | Eurozone Trade Balance (EUR) Dec | 10.2B | 10.7B |
| 10:00 | EUR | Eurozone GDP Q/Q Q4 P | 0.30% | 0.30% |
| 13:30 | USD | CPI M/M Jan | 0.30% | 0.30% |
| 13:30 | USD | CPI Y/Y Jan | 2.50% | 2.70% |
| 13:30 | USD | CPI Core M/M Jan | 0.30% | 0.20% |
| 13:30 | USD | CPI Core Y/Y Jan | 2.50% | 2.60% |
| 21:30 | NZD |
| Business NZ PMI Jan | |
| Consensus | |
| Previous | 56.1 |
| 07:30 | CHF |
| CPI M/M Jan | |
| Consensus | 0.00% |
| Previous | 0.00% |
| 07:30 | CHF |
| CPI Y/Y Jan | |
| Consensus | 0.10% |
| Previous | 0.10% |
| 10:00 | EUR |
| Eurozone Trade Balance (EUR) Dec | |
| Consensus | 10.2B |
| Previous | 10.7B |
| 10:00 | EUR |
| Eurozone GDP Q/Q Q4 P | |
| Consensus | 0.30% |
| Previous | 0.30% |
| 13:30 | USD |
| CPI M/M Jan | |
| Consensus | 0.30% |
| Previous | 0.30% |
| 13:30 | USD |
| CPI Y/Y Jan | |
| Consensus | 2.50% |
| Previous | 2.70% |
| 13:30 | USD |
| CPI Core M/M Jan | |
| Consensus | 0.30% |
| Previous | 0.20% |
| 13:30 | USD |
| CPI Core Y/Y Jan | |
| Consensus | 2.50% |
| Previous | 2.60% |
Dollar Index (DXY) Tests 98.00 But Shows Signs of Weakness Ahead of NFP
- The US Dollar bounced higher after Warsh's nomination but is showing signs of stalling.
- Recent labor data previews (JOLTS, Claims) showed unexpected weakness.
- Dollar Index Technical Analysis ahead of Non-Farm Payrolls.
Markets have a lot to digest in recent trading, with geopolitics, the new Fed Chair nomination, earnings season, tech selloffs, and growing fears that AI-driven productivity gains could translate into fewer jobs.
This dynamic sat at the core of yesterday’s volatility. Equity indices moved in a one-way slide, cryptocurrencies crumbled, and even metals stumbled as a global deleveraging of Debasement Trades unfolded.
Two underdogs decided to make their comebacks: the US dollar and US Treasuries, both of which had recently been sidelined as capital chased the shine of precious metals.
Since the Trump-Dollar episode — when comments praising a “great” value of the dollar amid the post-Greenland mini-crisis helped push the greenback to four-year lows — the dollar has staged a strong rebound against most FX peers.
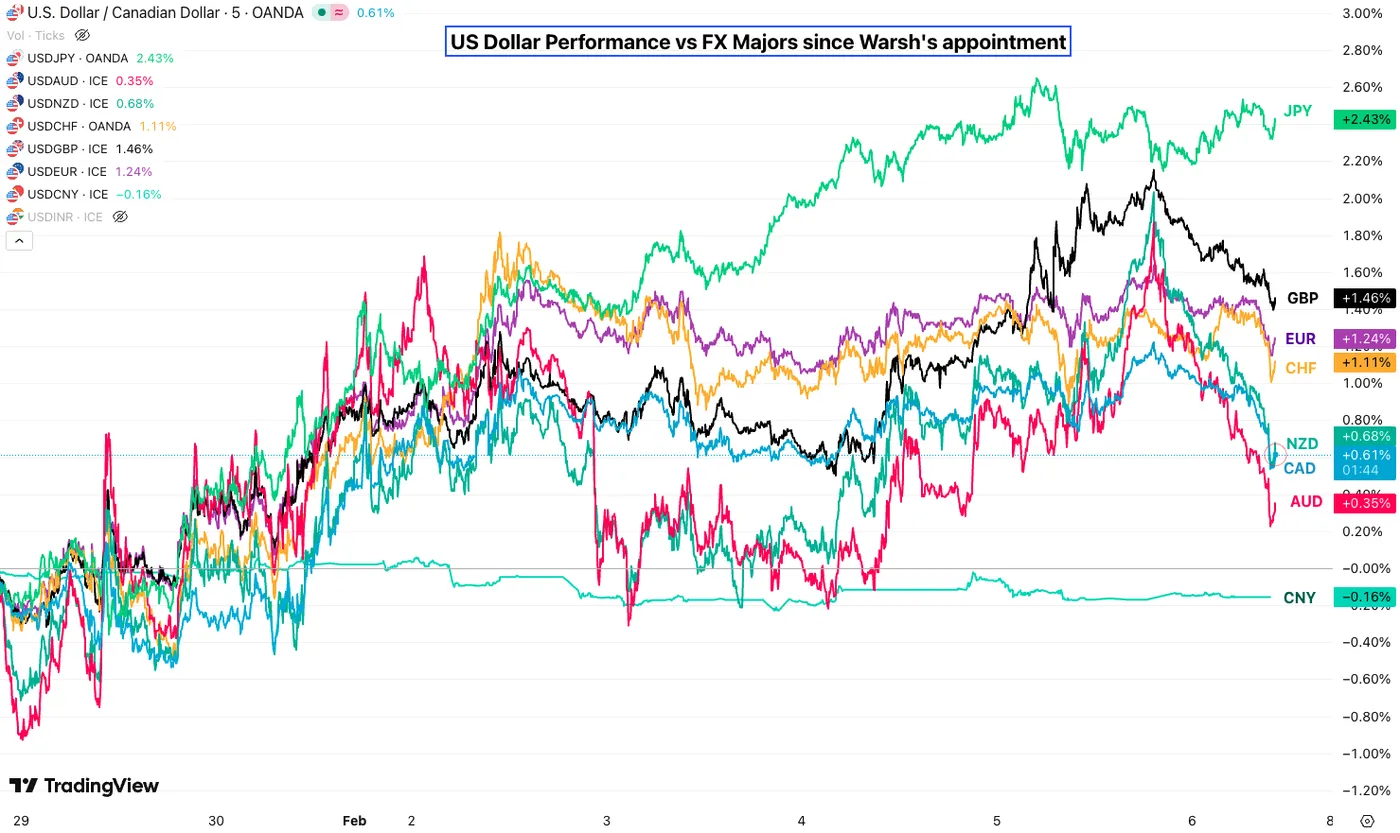
US Dollar Performance against other FX Majors since Warsh's appointment – Source: TradingView
But yesterday’s rally may now be facing a test.
After labor data improved following October’s scare, markets grew more comfortable with the idea that US employment conditions were stabilizing, if not rebounding, as jobless claims trended lower through December and January.
This week, however, brought fresh warning signs.
Initial claims surprised to the upside, JOLTS pointed to a sharply tighter job-openings market, and the Challenger layoffs report revived uneasy comparisons with 2009.
Risk-off flows and broad deleveraging fueled a bid in the dollar, but traders are now bracing for a softer Non-Farm Payrolls report.
A few basis points of rate cuts have already been repriced, with clarity expected on Wednesday when the delayed NFP is finally released.
All of this could point to a daily top in the Dollar Index.
We’ll dive into an in-depth technical analysis of DXY to assess whether — absent any fresh geopolitical shock, with US-Iran talks still ongoing — the dollar is set to keep falling, or if Kevin Warsh’s nomination has genuinely altered the broader trend.
Dollar Index (DXY) Multi-Timeframe Analysis
Daily Chart
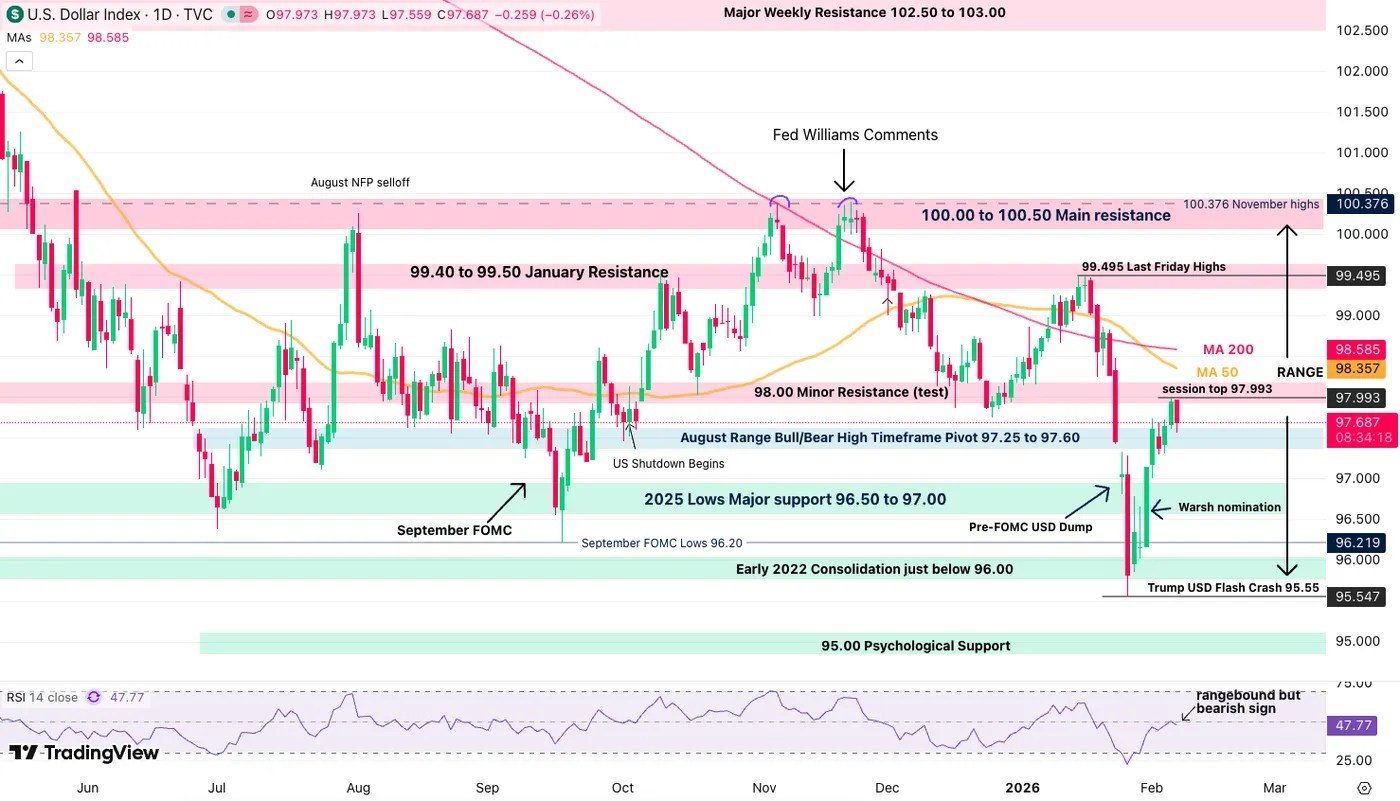
Dollar Index (DXY) Daily Chart. February 6, 2026 – Source: TradingView
The Dollar really embarked into quite a reversal after the FOMC (as was highlighted in our previous analysis) but is now facing the test of the key 98.00 Level.
Despite all the talks of dedollarization and such, the USD has maintained a volatile but rangebound picture since July 2025 between 96.00 and 100.00.
Some new lows were attained against some major pairs like AUD/USD or even EUR/USD, but the dollar selloff has been much more local and contained since.
Despite the larger directionless trend, in-range analysis helps to guide decision making and relative strength to know.
When prices stall at the middle of a range, it implies that the trend could be shifting.
As seen with the Daily RSI taking a turn at the neutral line, and bulls not able to breach the 98.00 Mid-range level, weakness could be expected ahead.
Let's take a closer look.
4H Chart and Technical Levels
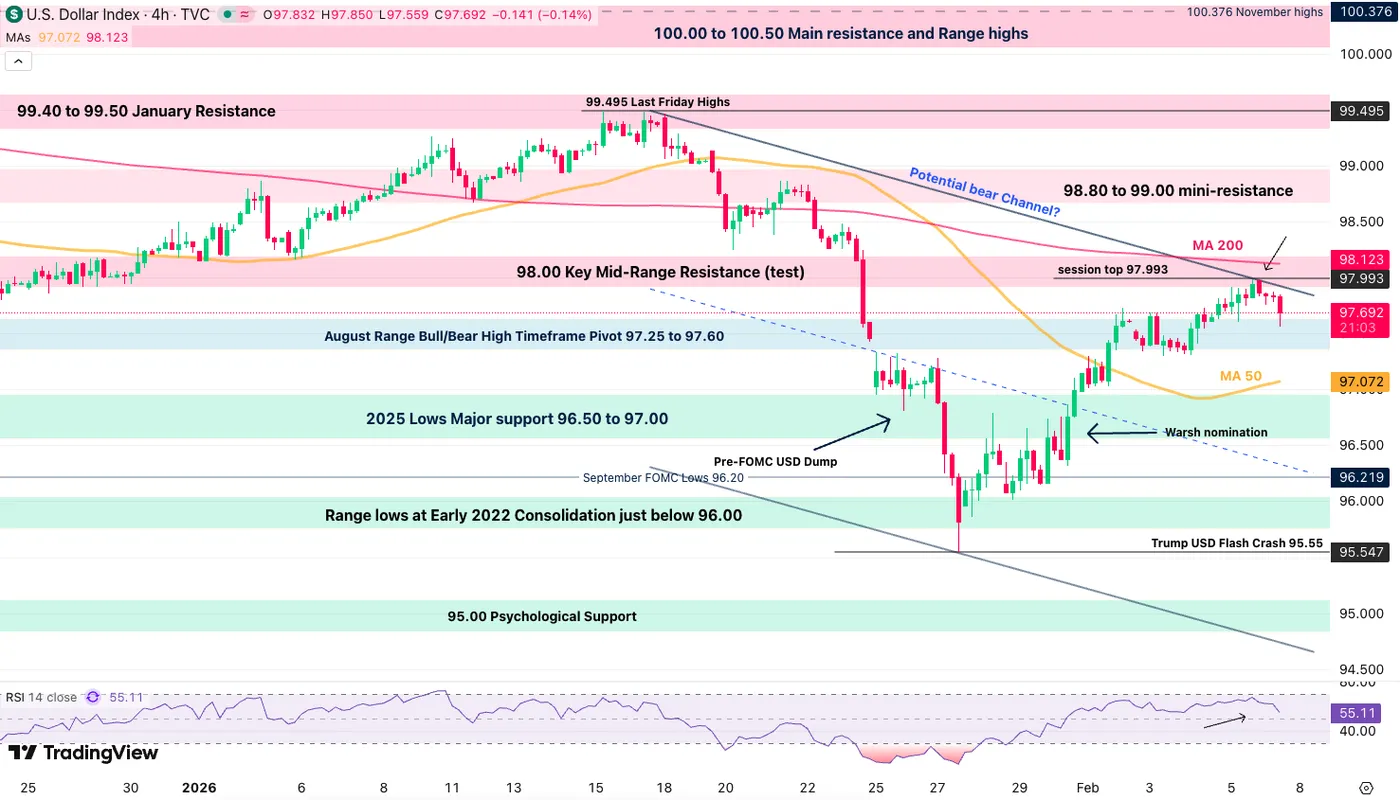
Dollar Index (DXY) 4H Chart. February 6, 2026 – Source: TradingView
Looking closer, we spot how resilient the 98.00 resistance will prove for the current rebound, particularly as early indications of a bear channel formation are showing up.
(Keep in mind that a swift sweep to the upside on any Iran turmoil could change the picture and would need further analysis).
An intermediate range could also be shaping up between 97.00 to 98.00, levels which acted as magnets throughout the past 6-months – Reactions to the 4H 50-period moving average (97.017) will be very important.
- On the session, USD shorts against FX majors could make sense until the 97.00 handle. Pre-weekend risk could warrant position closure.
Levels to place on your DXY charts:
Resistance Levels
- 98.00 Key Mid-Range Resistance (test, mini-range highs)
- Session Highs 97.993
- Mini-resistance 98.80 to 99.00
- 99.40 to 99.50 January Resistance
- 100.376 November highs
Support Levels
- August and mini-range Pivot 97.25 to 97.60
- 2025 Lows Major support 96.50 to 97.00 (mini-range lows, 4H 50-MA)
- Early 2022 Consolidation just below 96.00
- Trump USD Flash Crash 95.55
- 95.00 Main psychologic support
1H Chart
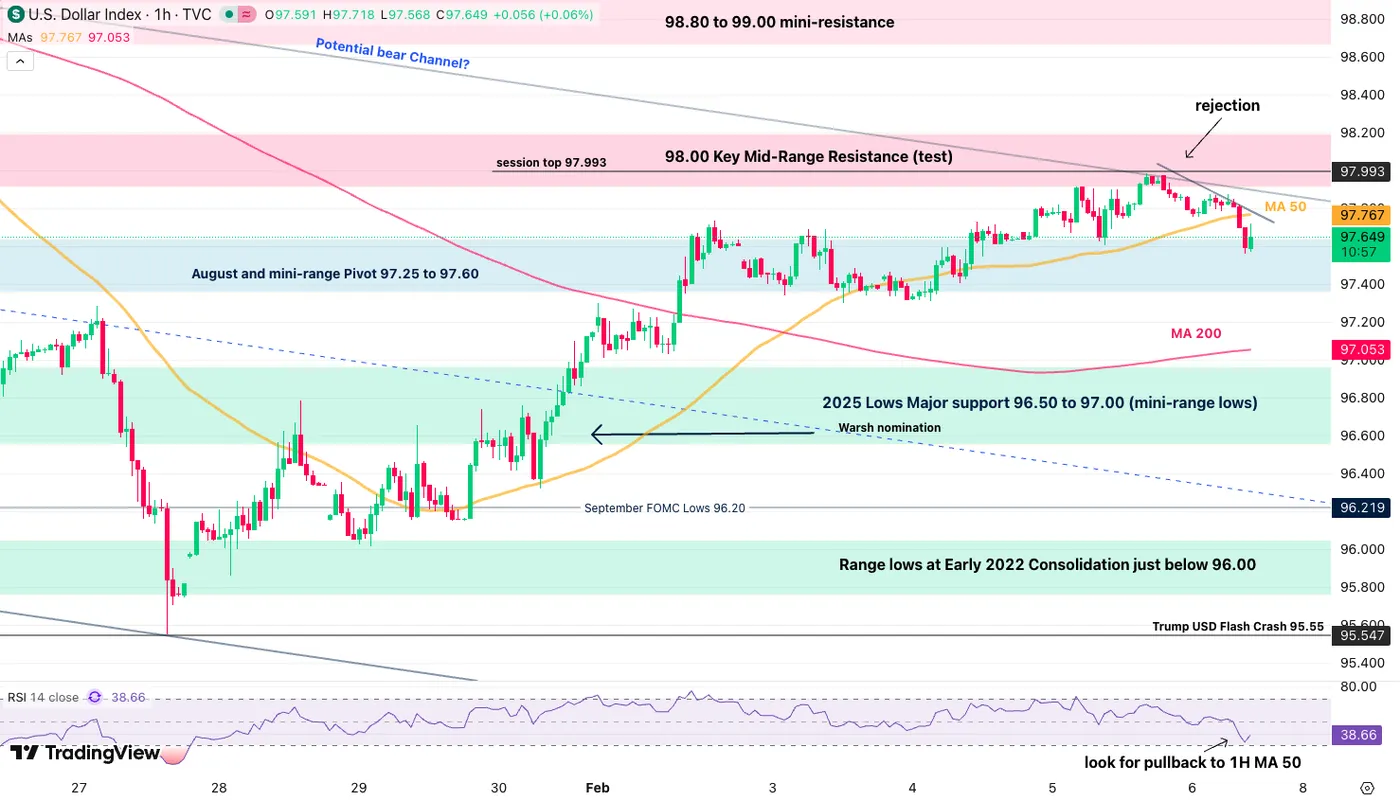
Dollar Index (DXY) 1H Chart. February 6, 2026 – Source: TradingView
Looking at reactions, the US Dollar is getting rejected from reaching the resistance zone. However, oversold RSI conditions could point to an imminent retest of its 1H 50-period MA (97.76) before potentially correcting.
If prices get there, the 97.00 level will be very essential for the times to come:
- Rebounding there would take out the potential bear channel (seen on the 4H timeframe)
- Breaking the level hints at a retest of the Trump-USD Lows (95.55)
- Any sudden flash above 98.00 (candle close above and high volume) hints at geopolitical tensions worsening.
Safe Trades!
Gold Fixing Trade Deficit, But Only on Paper
Summary
Soaring gold prices and heavy overseas demand have pushed large volumes of physical gold out of the U.S., mechanically narrowing the trade deficit. But don’t mistake this for an economic improvement.
Gold transfers reflect asset reallocation under geopolitical stress, not real economic activity, which is why the Bureau of Economic Analysis largely strips it out of GDP. When gold is excluded, the trade deficit looks worse than the headline suggests.
All That Glitters Is Not Growth
From 2000 through 2020, the spot price of gold averaged less than $1,000 per ounce. In 2020, gold broke above $2,000 for the first time. By March 2025 it crossed $3,000, by October it surpassed $4,000, and today gold is trading near $5,000 per ounce.
Gold and other precious metals are now at- or near-record highs as investors and central banks seek protection from geopolitical risk, policy uncertainty, and declining real interest rates. Offering forward‑looking price guidance is outside the scope of this report. The boneyard of economists who have tried to forecast gold prices is already crowded enough without adding ours to the pile.
What matters for understanding gold right now is not the price forecast, but the composition of demand. The appetite for gold is increasingly being driven by large institutional buyers and ETFs, as well as by overseas investors. Some crypto‑related firms are also purchasing physical gold to back gold‑linked tokens.1 As a result, substantial quantities of gold are being shipped out of the United States.
This surge in precious-metals exports has mechanically narrowed the U.S. trade deficit. Under normal circumstances, a narrowing trade deficit would be supportive of measured GDP growth. In this case, however, appearances are misleading.
The reason is straightforward: most gold moving across borders reflects asset reallocation, not real economic activity. Non‑monetary gold trade does not represent the production of new goods or services, so it does not meaningfully contribute to GDP. Consequently, the recent “gold rush” will not show up as stronger economic growth, even though it is having a visible impact on headline trade statistics.
This distinction matters because it underscores why the apparent “normalization” in the trade deficit is anything but.
Why Gold Trade Is Largely Excluded From GDP
The Bureau of Economic Analysis (BEA) is tasked with measuring economic production, not the reshuffling of existing assets. Gold generally serves one of two purposes: it is either used as an input into production (for example, jewelry or electronics), or it is held as a store of value (bullion, bars, and coins). The bulk of gold crossing borders lately falls squarely into the second category (Figure 1).
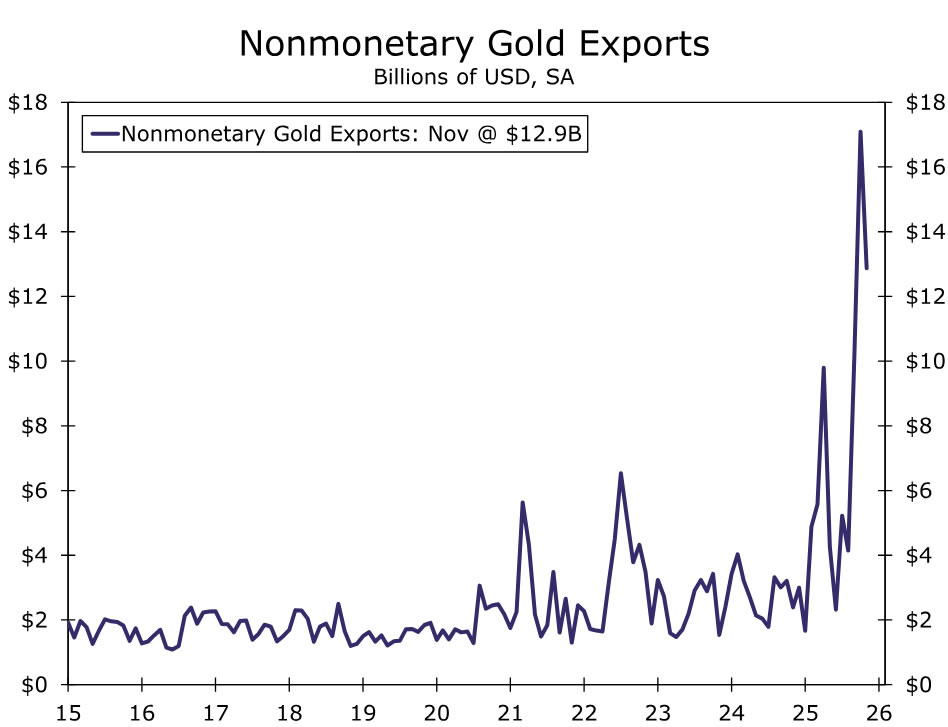
Because most non‑monetary gold trade represents investment flows rather than production, the BEA strips gold imports and exports out of GDP. Instead of relying on volatile trade flows, the BEA uses a simpler proxy for gold net exports: domestic gold production minus industrial use.2 Under normal conditions, this adjustment is small enough to go unnoticed. When gold trading surges, however, the wedge between headline trade data and GDP‑relevant activity can become large.
That is precisely what is happening now. Large swings in gold imports and exports are distorting the trade numbers without signaling any meaningful change in underlying economic activity.
What the Latest Trade Data Show
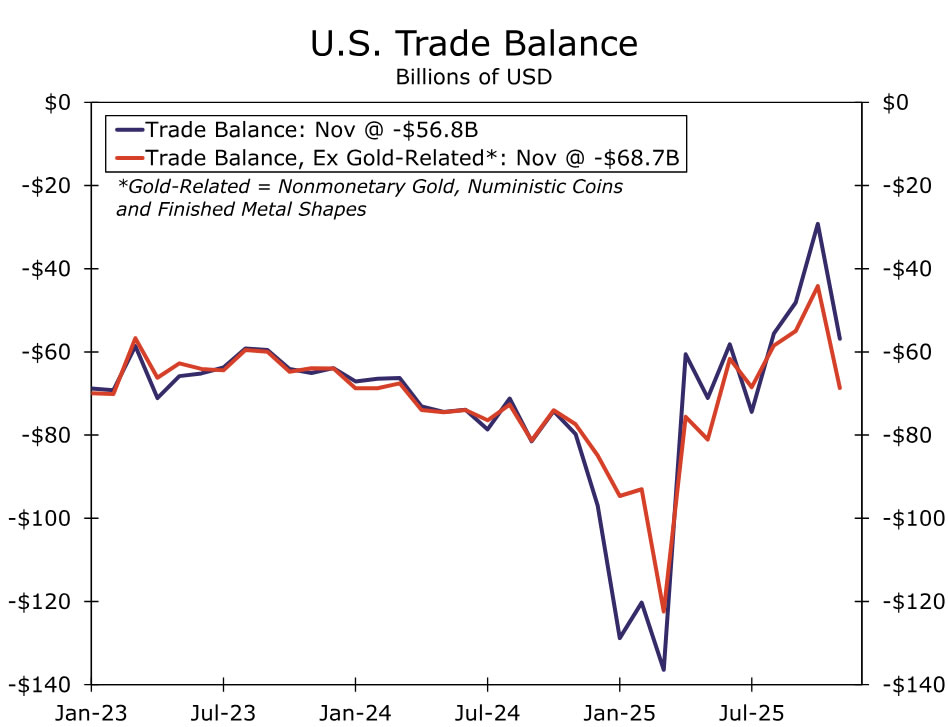
If non-monetary gold—along with a small handful of other investment‑driven categories—is excluded from both exports and imports, the trade deficit is actually wider than headline figures suggest by almost $12 billion (Figure 2).3 The gold trade has been masking ongoing imbalances rather than resolving them. A similar dynamic was at play in late 2024/early 2025, when imports of finished metal shapes surged ahead of expected tariff increases.
Two components are almost entirely responsible for the surge in gold exports today: bullion (unmarked or minimally processed gold) and gold bars.
Bullion exports have been running at more than twice their typical volume. Over the past three months, an average of roughly 75 metric tons of gold bullion has left the United States each month, compared with a post‑pandemic monthly average closer to 30 metric tons. While this series has always been volatile, recent outflows have clustered near the upper end of the historical range.
The move in gold bars has been far more dramatic. For several years through mid‑2025, gold bar exports averaged just 0.5 metric tons per month. That changed abruptly in late summer. Gold bar exports surged to approximately 11 metric tons in September—a more than sixteen‑fold increase—before jumping again to over 50 metric tons in October. Exports then collapsed back toward trend in November.
When combined with soaring prices, these volume swings become even more striking in dollar terms. A sixteen‑fold increase in the physical quantity of gold bars exported in September translated into roughly a twenty‑fold increase in their dollar value. In other words, the volatility in gold exports reflects not just higher prices, but unusually large movements of physical metal out of the country.
Bottom Line
Gold’s role in the recent trade data is a reminder that not all cross‑border flows are created equal. Capital moving to shelter looks very different from goods moving to market, even if both pass through the same statistical tables. The BEA’s treatment of non‑monetary gold is not a technical footnote—it is a recognition of that fundamental distinction.
For readers of the data, the takeaway is simple but important: a narrower trade deficit driven by gold exports is not evidence of renewed economic strength. It is evidence of caution. And in moments like this, separating signal from shine matters more than ever.
Endnotes
1 - Reuters and Bloomberg both quote interviews with Paolo Ardonio, the CEO of Tether, about adding several tons of physical gold to its storage sites in Switzerland.
2 - See "How Are Exports and Imports of Nonomonetary Gold Treated in BEA's National Economic Accounts?" for more detail.
3 - The BEA BOP-basis category of non-monetary gold adds the census-basis categories of non-monetary gold (end-use code 12260 for exports and 14270 for imports), numismatic coins (end use 41300), and finished metal shapes (end use 12300 for exports, 15200 for imports) and then a separate BOP adjustment for gold transactions not captured by the Customs Protection Bureau. Note, this last category is not something we proxy in our gold-adjusted trade balance in Figure 2.