Sample Category Title
EUR/USD Faces Major Breakout Resistance at 1.1075
Key Highlights
- EUR/USD is facing strong resistance near 1.1075.
- A major bullish trend line is forming with support near 1.0990 on the 4-hour chart.
- GBP/USD surged above the 1.2500 and 1.2520 resistance levels.
- The US ISM Manufacturing PMI could rise from 46.3 to 46.6 in April 2023.
EUR/USD Technical Analysis
The Euro made another attempt to clear the 1.1075 resistance against the US Dollar. However, EUR/USD struggled to stay above 1.1075 and corrected gains.
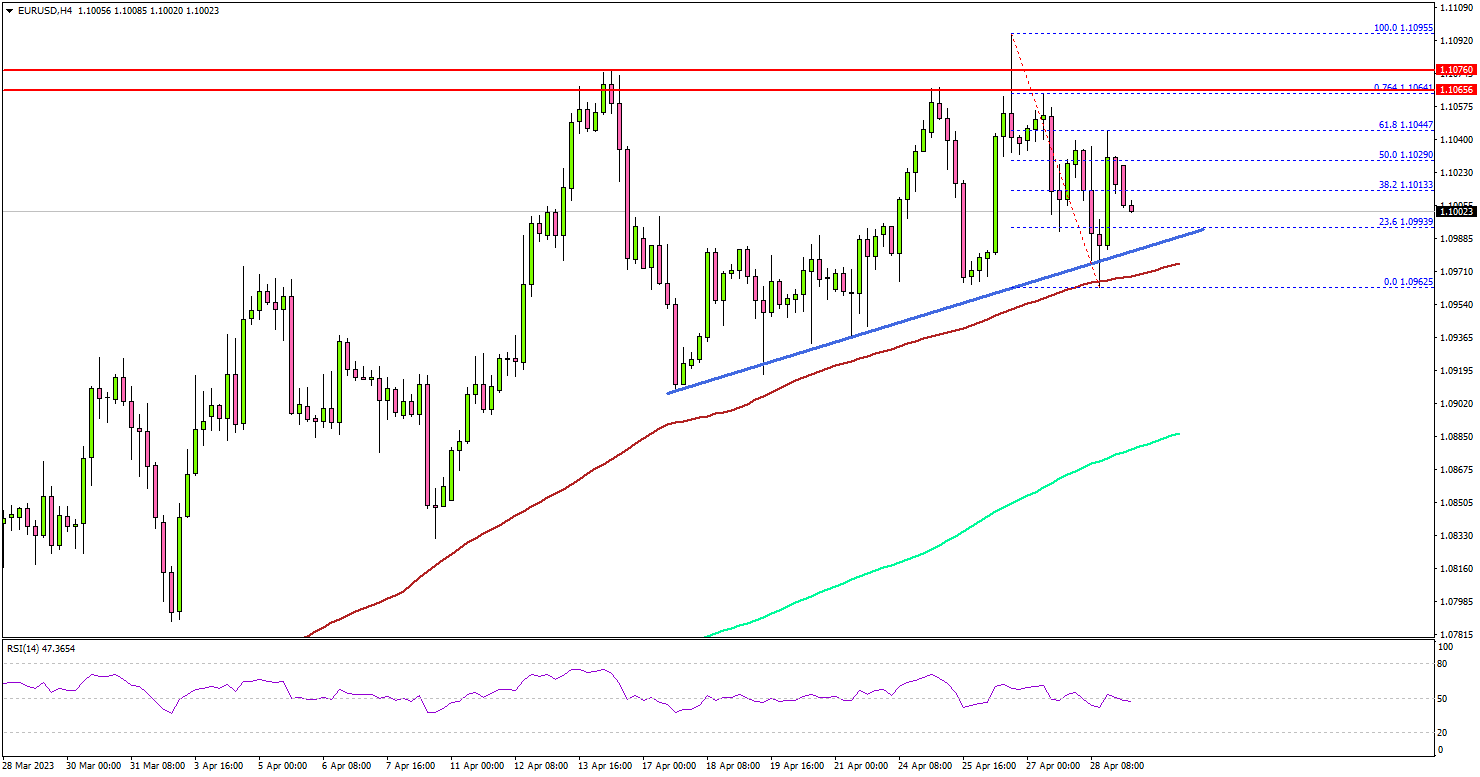
Looking at the 4-hour chart, the pair traded as high as 1.1095 before it corrected lower. There was a move below the 1.1020 support but the pair remained stable above the 100 simple moving average (red, 4 hours) and the 200 simple moving average (green, 4 hours).
The pair is now consolidating near the 1.1020 zone. Immediate resistance on the upside is near the 1.1050 level. The main breakout resistance is still near the 1.1075 level.
A clear upside break and close above the 1.1075 resistance might start a strong increase. The next key resistance is near the 1.1120 zone. Any more gains might send the pair toward 1.1200.
On the downside, there is major support near 1.1000 and the 100 simple moving average (red, 4 hours). There is also a major bullish trend line forming with support near 1.0990 on the same chart.
The next major support sits near the 1.0965 level, below which the pair might accelerate lower. In the stated case, EUR/USD could visit the 1.0920 support zone.
Looking at GBP/USD, the pair gained bullish momentum and was able to trade to a new multi-week high above the 1.2540 resistance.
Economic Releases
- US ISM Manufacturing PMI for April 2023 – Forecast 46.6, versus 46.3 previous.
Nikkei 225 index Wave Analysis
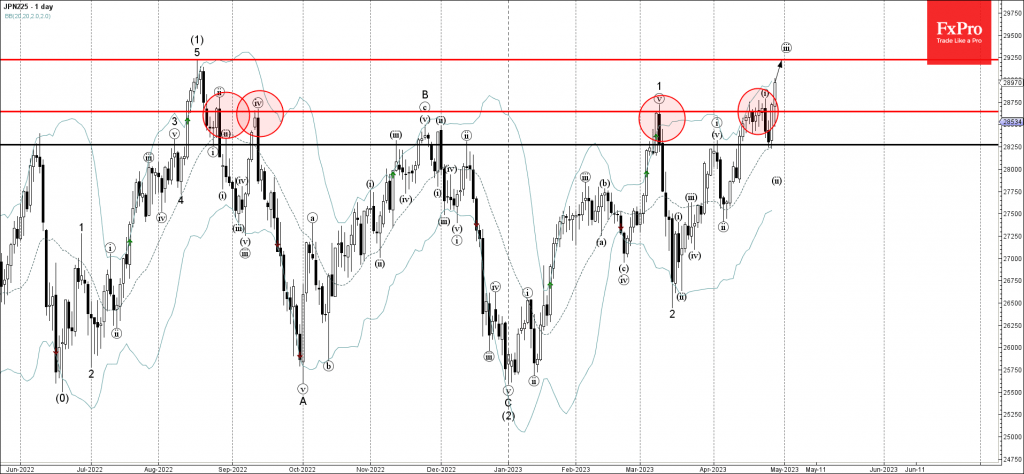
Nikkei 225 broke resistance level 28645.00
Likely to rise to resistance level 29250.00
Nikkei 225 index rising sharply after the price broke above the resistance level 28645.00 (which has been reversing the price from the end of August).
The breakout of the resistance level 28645.00 continues the active short-term impulse wave (iii), which belongs to the higher impulse waves 3 and (3).
Nikkei 225 index can be expected to rise further toward the next resistance level 29250.00 (target price for the completion of the active impulse wave (iii)).
EURGBP Wave Analysis
- EURGBP under bearish pressure
- Likely to fall to support level 0.8740
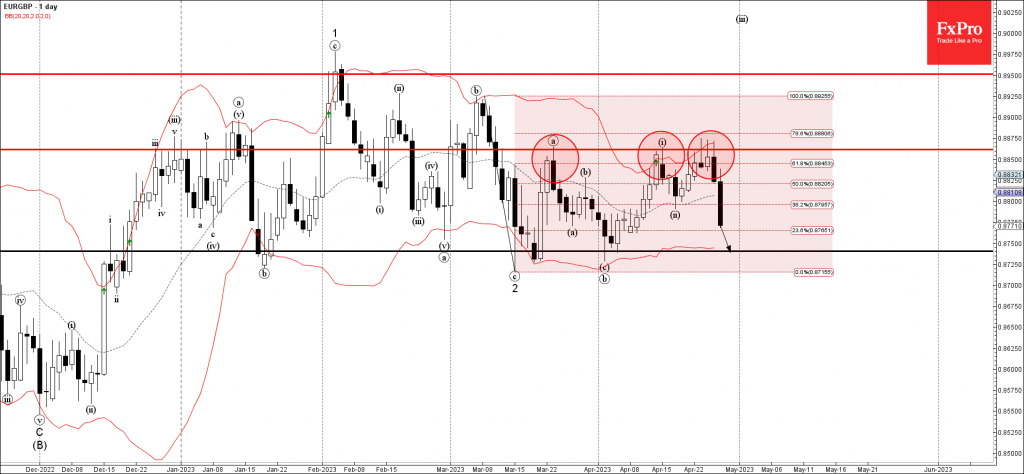
EURGBP falling strongly after the price reversed down from the key resistance level 0.8860 (which has been reversing the price from March) standing near the upper daily Bollinger Band.
The downward reversal from the resistance level 0.8860 created the daily candlesticks reversal pattern Bearish Engulfing.
EURGBP can be expected to fall further toward the next support level 0.8740 (which has been reversing the price from January).
GBPAUD Wave Analysis
- GBPAUD under bullish pressure
- Likely to rise to resistance level 1.9200
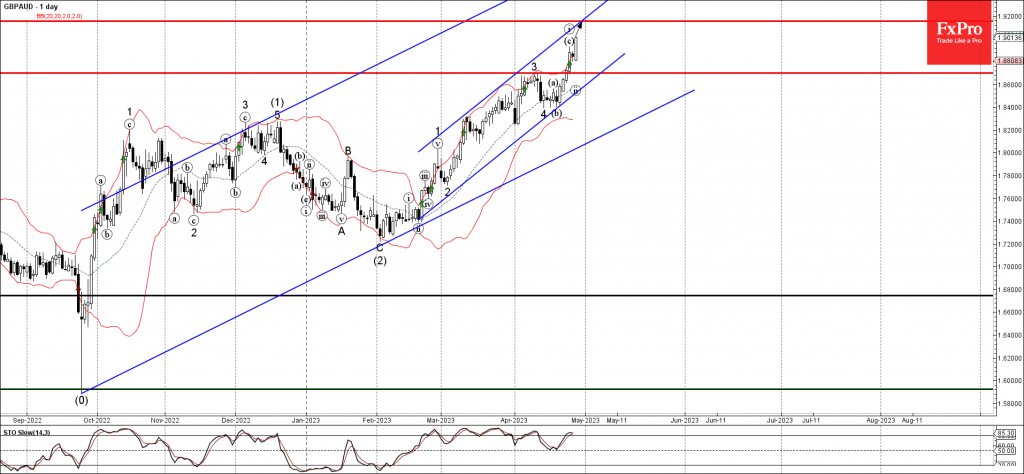
GBPAUD under the bullish pressure after the price broke the resistance level 1.8700 (which stopped the previous impulse wave 3 at the start of April).
The breakout of the resistance level 1.8700 accelerated the active minor impulse wave 5 from the middle of this month.
Given the prevailing daily uptrend, GBPAUD can be expected to rise further toward the next resistance level 1.9200 (intersecting with the daily up channel from February).
EUR/USD Weekly Outlook
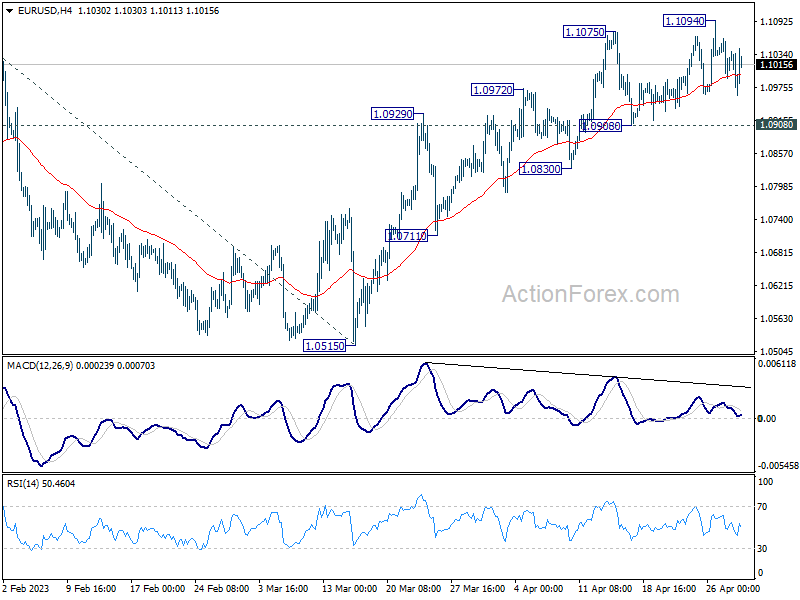
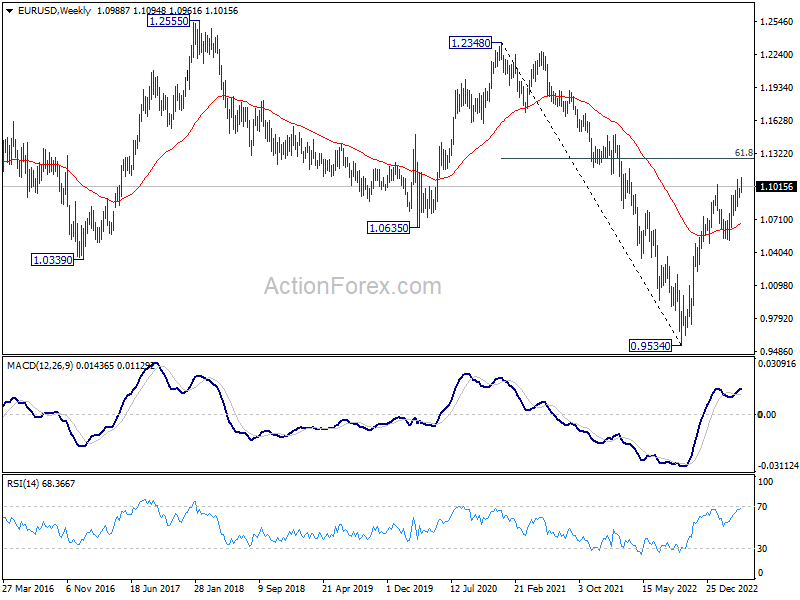
EUR/USD edged higher to 1.1094 last week but retreated again. Initial bias stays neutral this week first. Further rally is expected as long as 1.0908 support holds. Break of 1.1094 will resume larger up trend to 1.1273 fibonacci level. Break there will target 61.8% projection of 0.9534 to 1.1032 from 1.0515 at 1.1441 However, considering bearish divergence condition in 4H MACD, break of 1.0908 support will indicate short term topping and turn bias back to the downside.
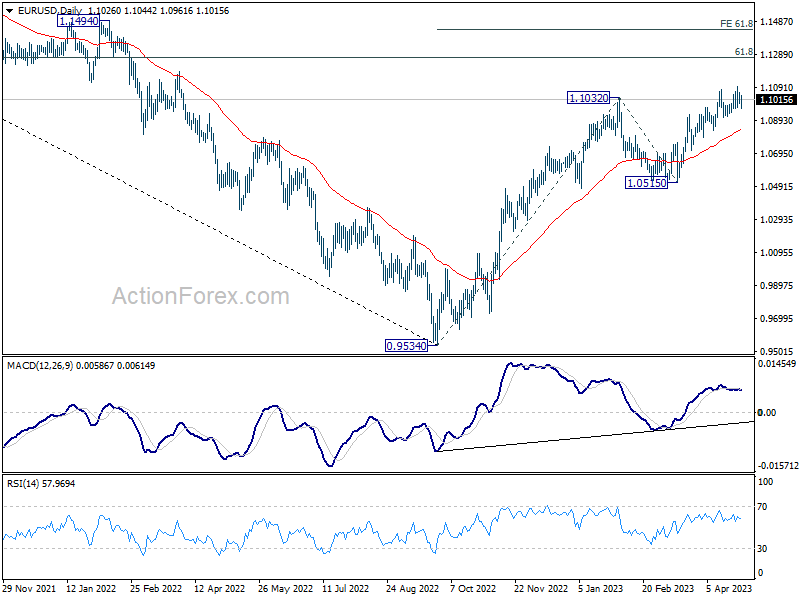
In the bigger picture, rise from 0.9534 (2022 low) is in progress for 61.8% retracement of 1.2348 (2021 high) to 0.9534 at 1.1273. Sustained break there will solidify the case of bullish trend reversal and target 1.2348 resistance next (2021 high). This will now remain the favored case as long as 1.0515 support holds, even in case of deeper pull back.
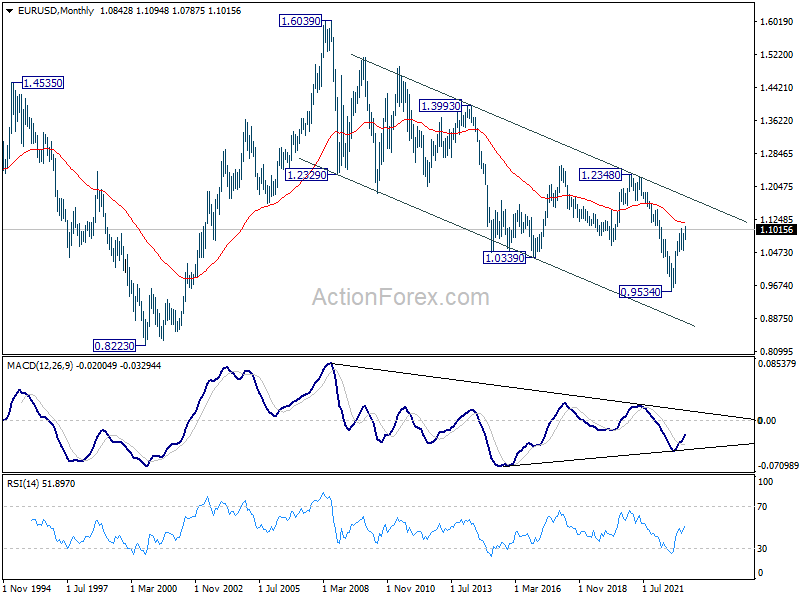
In the long term picture, while it's still early to call for long term trend reversal at this point, the strong break of 1.0635 support turned resistance (2020 low) should at least turn outlook neutral. Focus is now on 55 M EMA (now at 1.1166). Rejection by this EMA will revive long term bearishness. However, sustained break above here will be an indication underlying bullishness and target 1.2348 resistance next.
USD/JPY Weekly Outlook
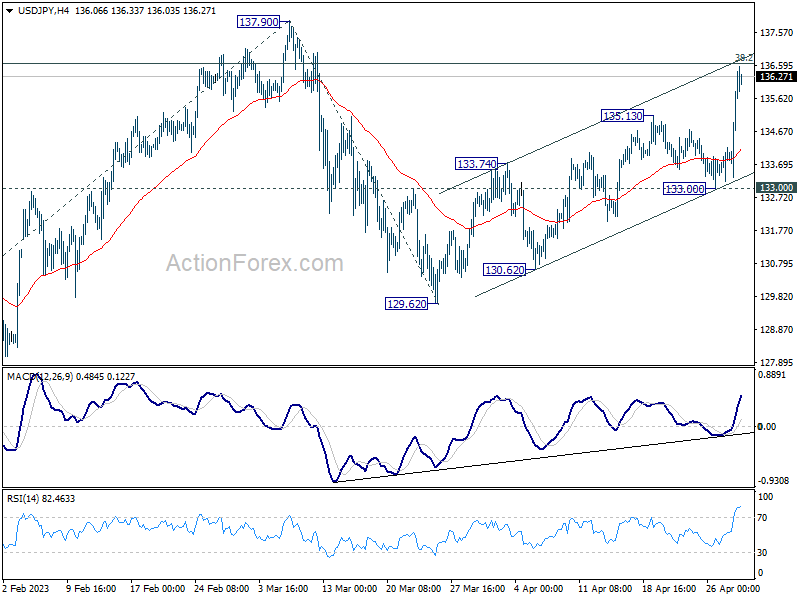
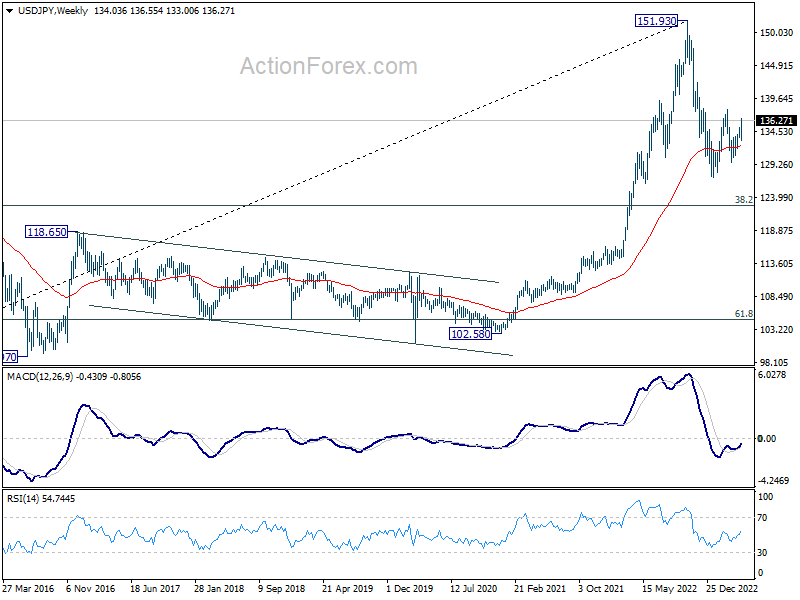
USD/JPY's rise from 129.62 resumed last week and accelerated to as high as 136.55. Initial bias stays on the upside for 137.90 resistance. Firm break there will resume whole rebound from 127.20, and target 100% projection of 127.20 to 137.90 from 129.62 at 140.32. For now, further rally will remain in favor as long as 133.00 support holds, in case of retreat.
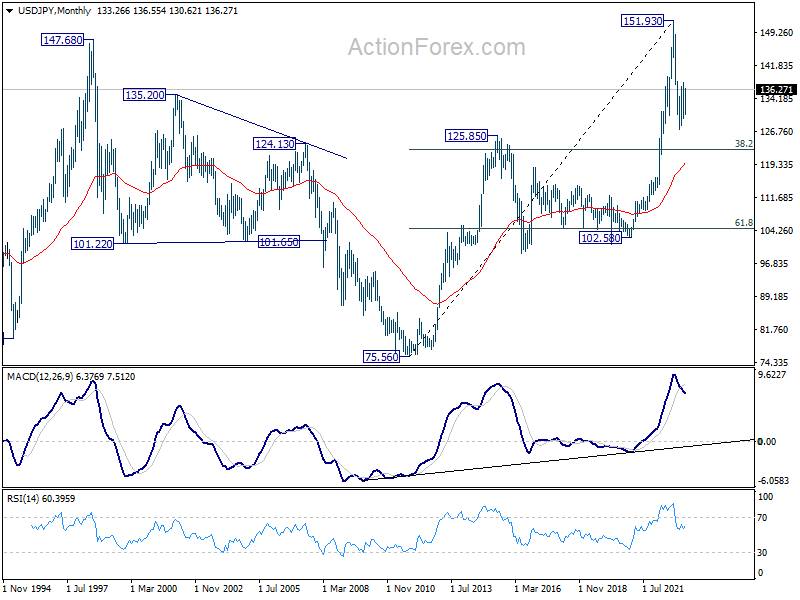
In the bigger picture, price actions from 151.93 high are currently seen as a corrective pattern to the long term up trend. The first leg should have completed at 127.20. Rebound from there is seen as the second leg. Sustained break of 31.8% retracement of 151.93 to 127.20 at 136.34 will bring stronger rebound to 61.8% retracement at 142.48. Meanwhile, break of 129.62 will argue that the third leg is starting through 127.20 low.
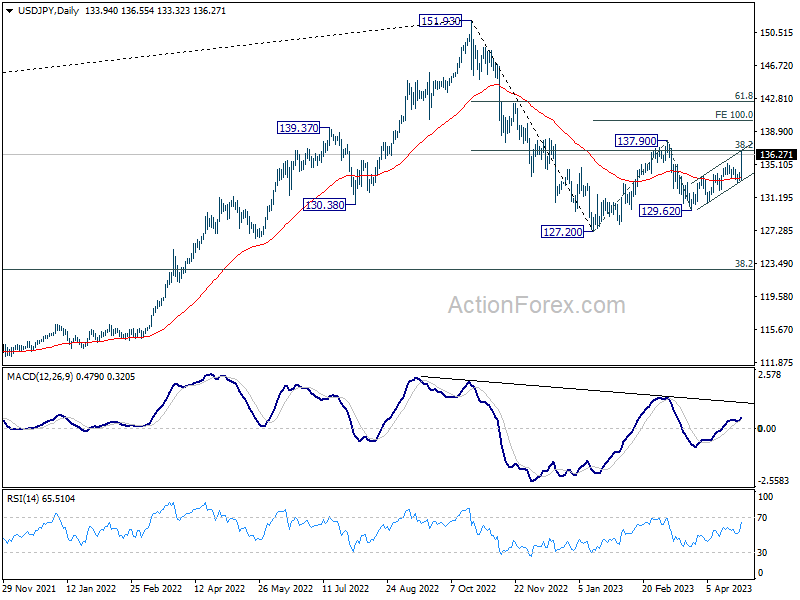
In the long term picture, price action from 151.93 is seen as developing into a corrective pattern to up trend from 75.56 (2011 low). While deeper decline cannot be ruled out, downside should be contained by 38.2% retracement of 75.56 to 151.93 at 122.75.
GBP/USD Weekly Outlook
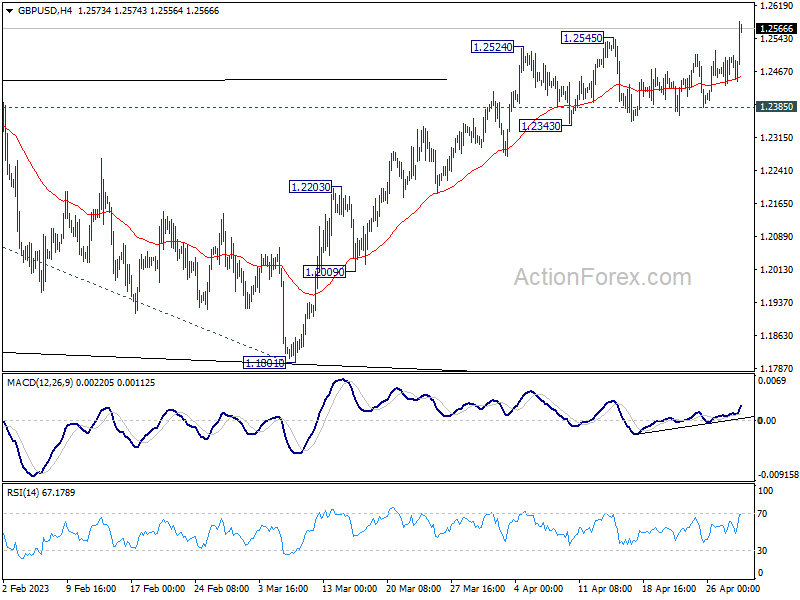
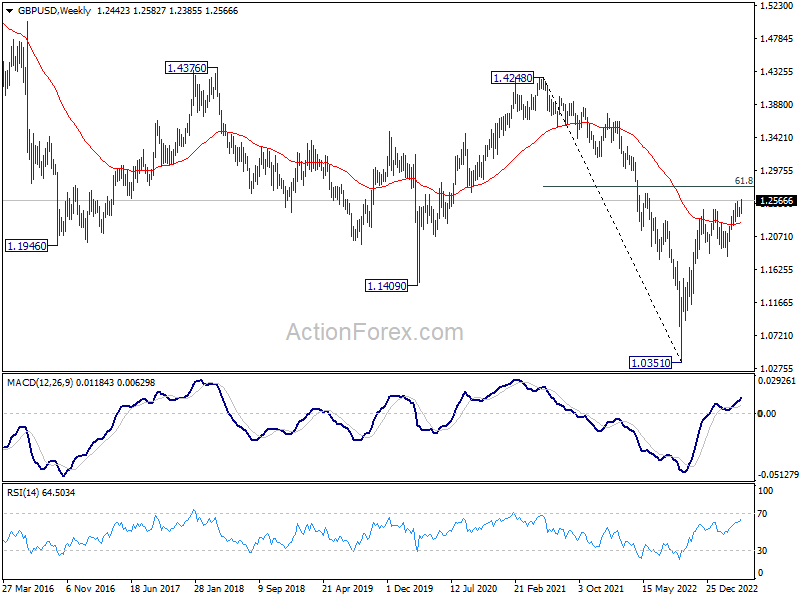
GBP/USD's up trend resumed by breaking through 1.2545 last week. Initial bias remains on the upside this week. Next target is 1.2759 fibonacci level first. Firm break there will target 61.8% projection of 1.0351 to 1.2445 from 1.1801 at 1.3095. For now, outlook will remain bullish as long as 1.2385 support holds, in case of retreat.
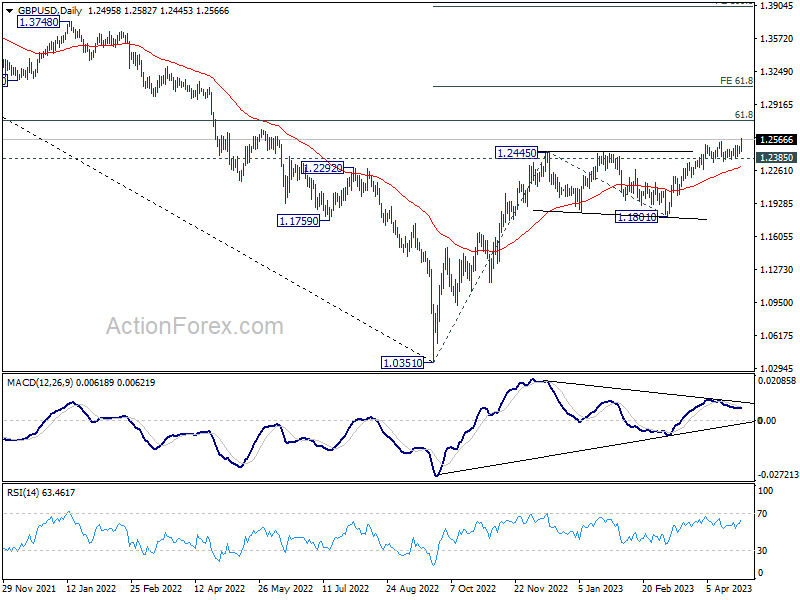
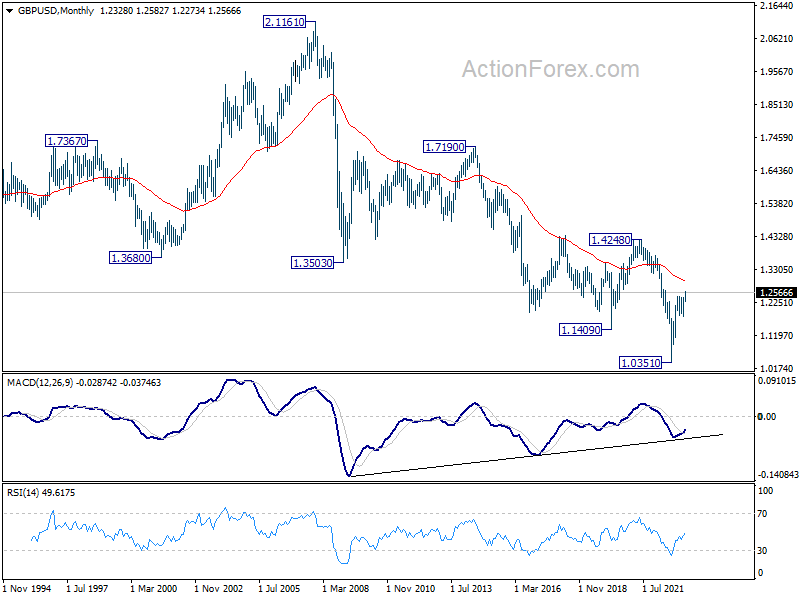
In the bigger picture, the rise from 1.0351 medium term term bottom (2022 low) is in progress for 61.8% retracement of 1.4248 (2021 high) to 1.0351 at 1.2759. Sustained break there will add to the case of long term bullish trend reversal. Further break of 61.8% projection of 1.0351 to 1.2445 from 1.1801 at 1.3095 could prompt upside acceleration to 100% projection at 1.3895. For now, this will remain the favored case as long as 1.1801 support holds, even in case of deep pull back.
In the long term picture, while the rise from 1.0351 (2022 low) has been strong, there is no clear indicate of long term trend reversal yet. As long as 1.4248 resistance holds (2021 high), long term outlook will remain neutral at best.
USD/CHF Weekly Outlook
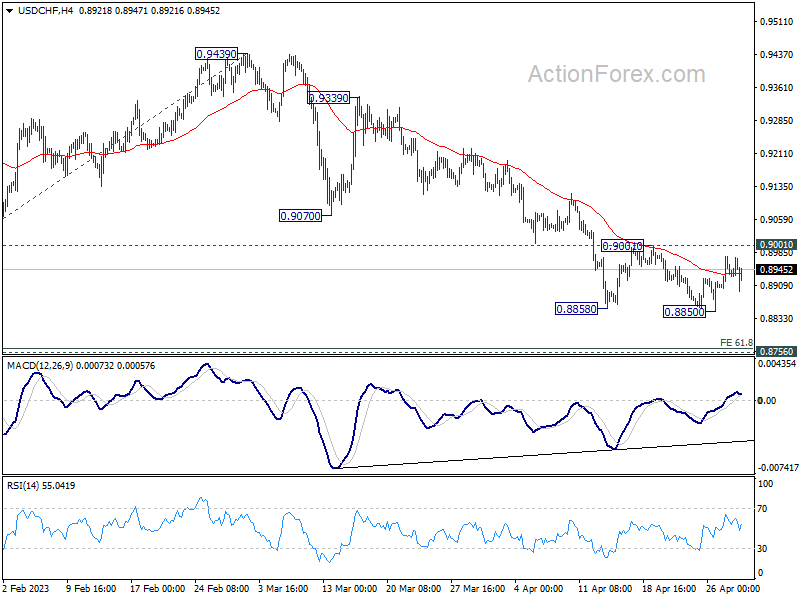
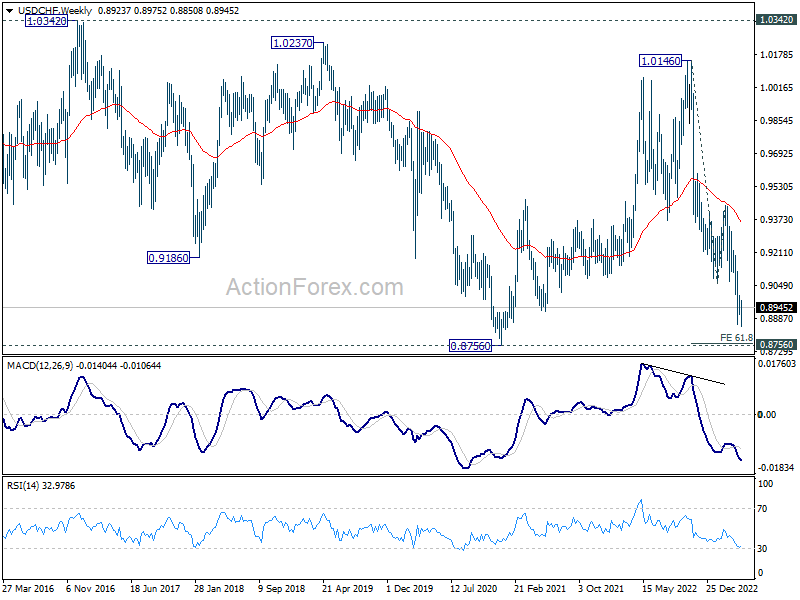
USD/CHF recovered after edging lower to 0.8850, but stays below 0.9001 resistance. Initial bias remains neutral this week first. On the upside, decisive break of 0.9001 resistance should confirm short term bottoming at 0.8850. Intraday bias will be back on the upside 55 D EMA (now at 0.9113). Sustained break there will be a strong sign of bullish reversal. On the downside, break of 0.8850 will resume larger fall from 1.0146, to 61.8% projection of 1.0146 to 0.9058 from 0.9439 at 0.8767, which is close to 0.8756 long term support. Strong support is expected there to bring rebound, at least on first attempt.
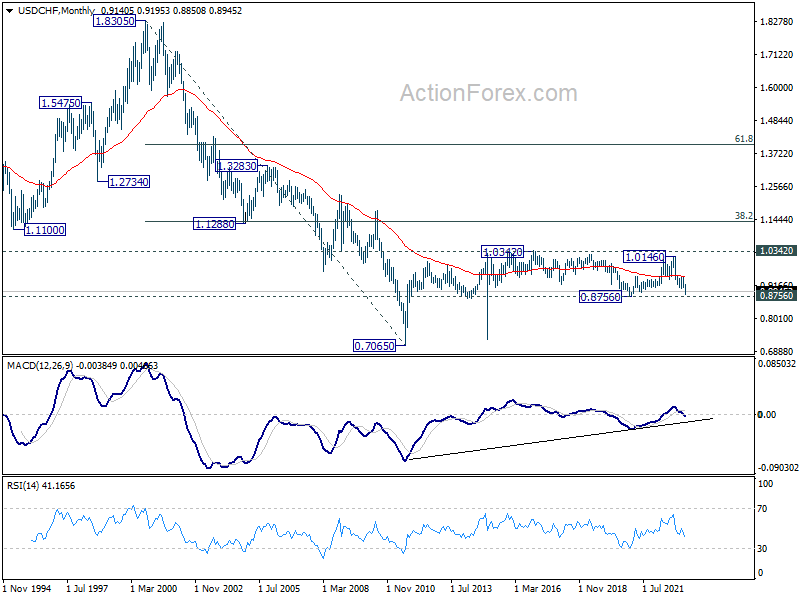
In the bigger picture, fall from 1.1046 (2022 high) is in progress for 0.8756 support (2021 low). But overall, this fall is still seen as a leg in the long term range pattern from 1.0342 (2016 high). So, downside should be contained by 0.8756 to bring reversal. Sustained break of 0.9058 support turned resistance will be the first sign of medium term bottoming. However, decisive break of 0.8756 will carry larger bearish implications.
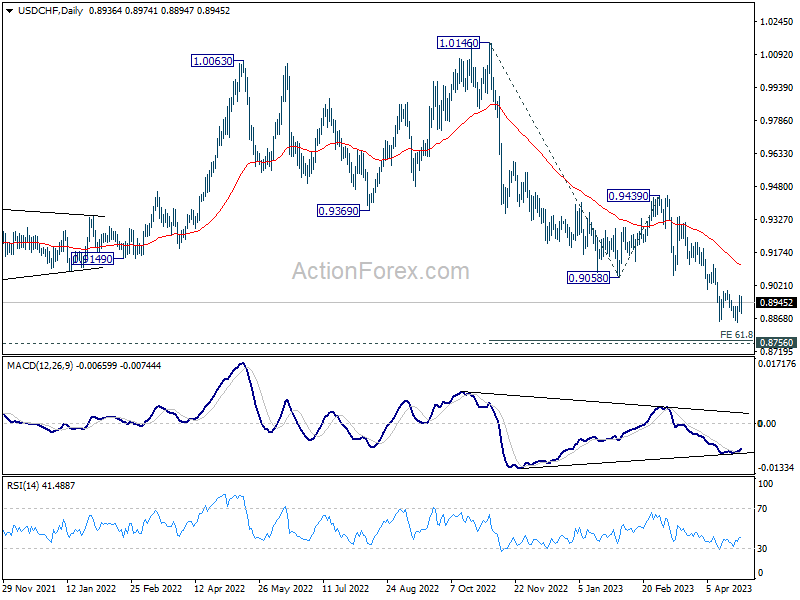
In the long term picture, long term sideway pattern from 1.0342 (2016 high) is expected to continue between 0.8756/1.0342. However, sustained break of 0.8756 will open up deeper fall back towards 0.7065 (2011 low).
AUD/USD Weekly Report
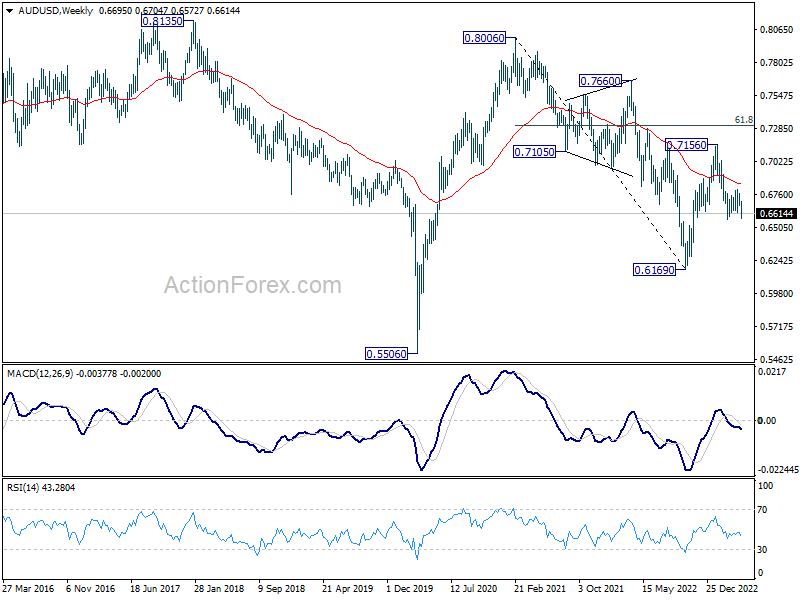
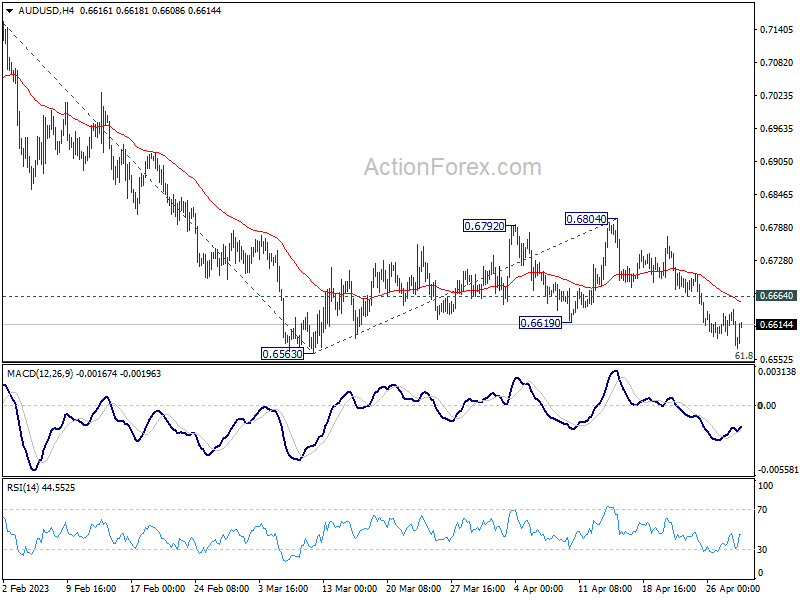
AUD/USD's decline and break of 0.6619 last week argues that corrective pattern from 0.6563 has completed at 0.6804. Further decline is in favor this week as long as 0.6664 resistance holds. Firm break of 0.6563 will resume larger decline from 0.7156, and bring deeper decline through 0.6546 fibonacci level to 61.8% projection of 0.7156 to 0.6563 from 0.6804 at 0.6438 next. On the upside, break 0.6664 minor resistance will turn bias to the upside to extend the consolidation pattern with another rising leg.
In the bigger picture, as long as 61.8% retracement of 0.6169 to 0.7156 at 0.6546 holds, the decline from 0.7156 is seen as a correction to rally from 0.6169 (2022 low) only. Another rise should still be seen through 0.7156 at a later stage. However, sustained break of 0.6546 will raise the chance of long term down trend resumption through 0.6169 low.
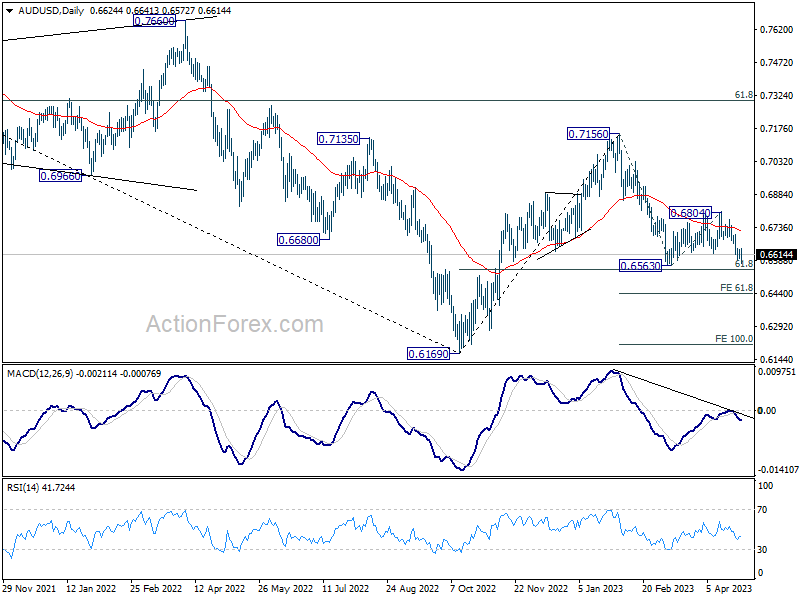
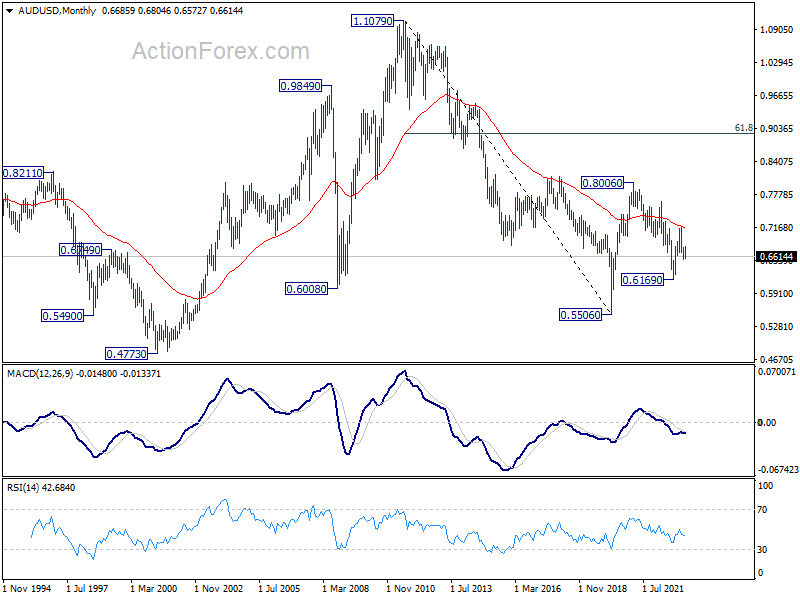
In the long term picture, initial rejection by 55 M EMA (now at 0.7145) retains long term bearishness. That is, down trend from 1.1079 (2011 high) could still resume through 0.5506 (2020 low) on resumption.