Sample Category Title
AUDUSD Set for Third Bearish Monthly Close
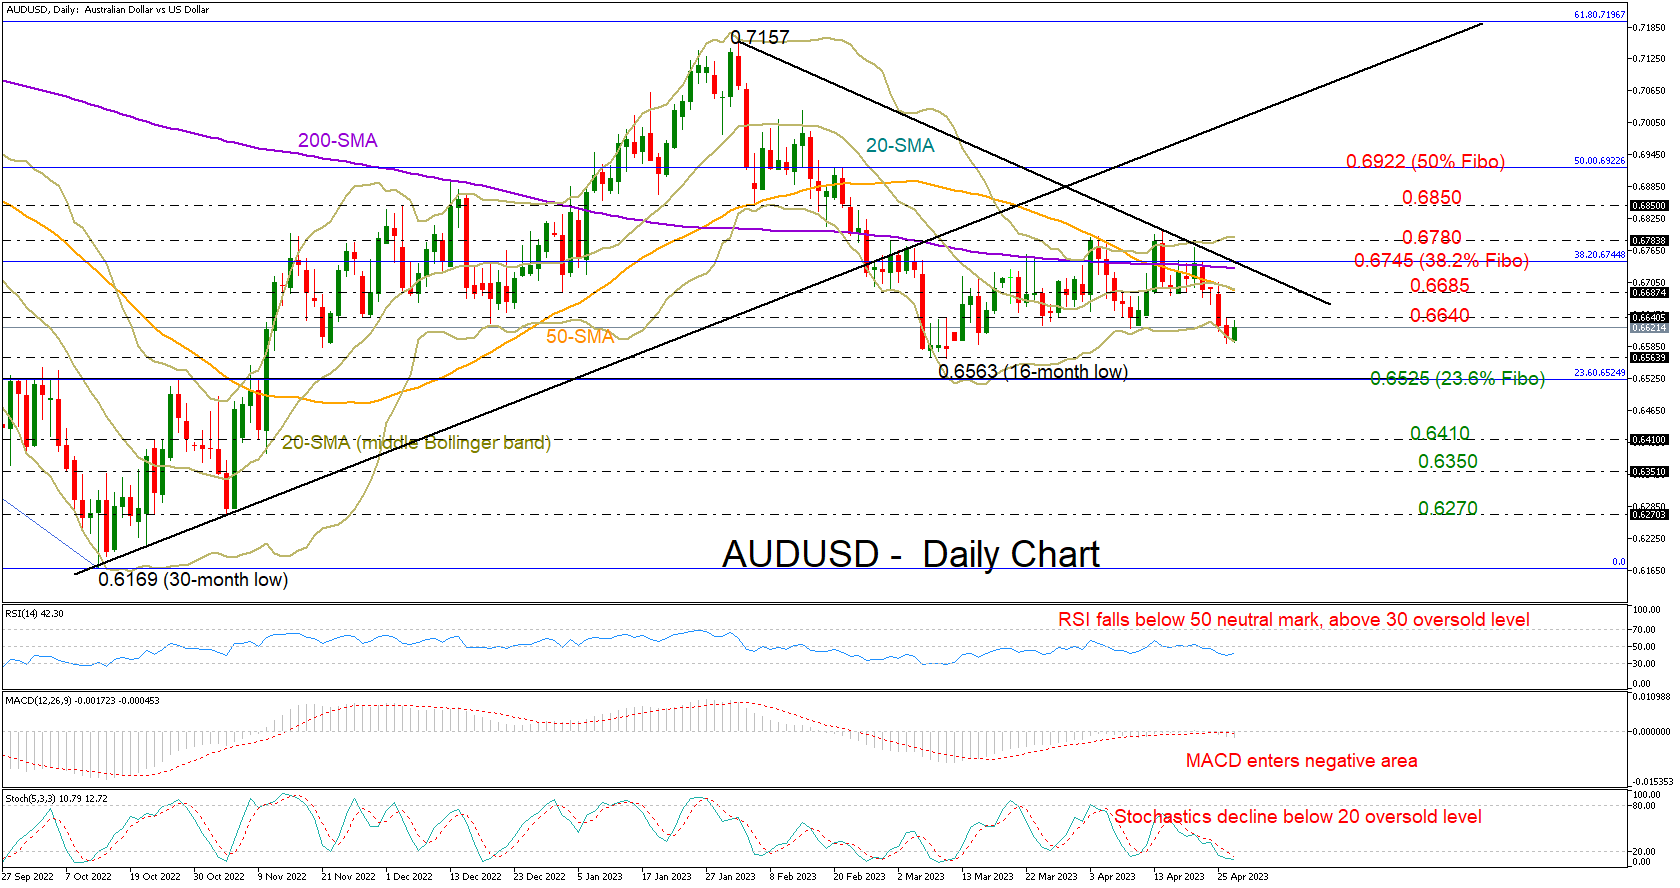
AUDUSD is set for its third negative monthly close after failing to pierce through the 0.6800 level. The focus is currently on the March low of 0.6563 as the short-term outlook is looking blurry.
The pair could not successfully climb above its 200-day simple moving average (SMA), with the 38.2% Fibonacci retracement level of the April-October 2022 downtrend triggering this week’s downfall to 0.6590. Notably, the 50-day SMA crossed back below the 200-day SMA, diminishing hopes for an uptrend resumption.
In momentum indicators, the MACD is decelerating in the negative region and below its red signal line, flagging more losses ahead. Likewise, the RSI has dived into the bearish region, adding to the discouraging signals. Yet, some consolidation cannot be excluded as the stochastic oscillator is already within the oversold region, while the price itself is trading around the lower Bollinger band.
In the bearish scenario, where the sell-off expands below the March low of 0.6563, the 23.6% Fibonacci of 0.6525 could immediately come to the rescue, preventing a sharp decline towards the 0.6410 handle. Should the latter give way, some congestion could emerge around 0.6350 before the door opens for the key 0.6270 support zone.
If buying interest rises above Wednesday’s bar of 0.6640, the next obstacle could be the 50-day SMA at 0.6685. Not far above, the 200-day SMA and the tentative descending trendline from February’s peak could be a bigger challenge. In the case that the bulls claim that territory, driving above the 0.6780 resistance too, then the recovery might flourish towards the 0.6850 mark.
Summing up, AUDUSD seems to be exposed to more downside according to the technical picture. Nevertheless, traders may wait for a break below 0.6563-0.6525 or above 0.6800 to direct the market accordingly.
AUD/USD: Price Movement May Accelerate in Bearish Impulse Five
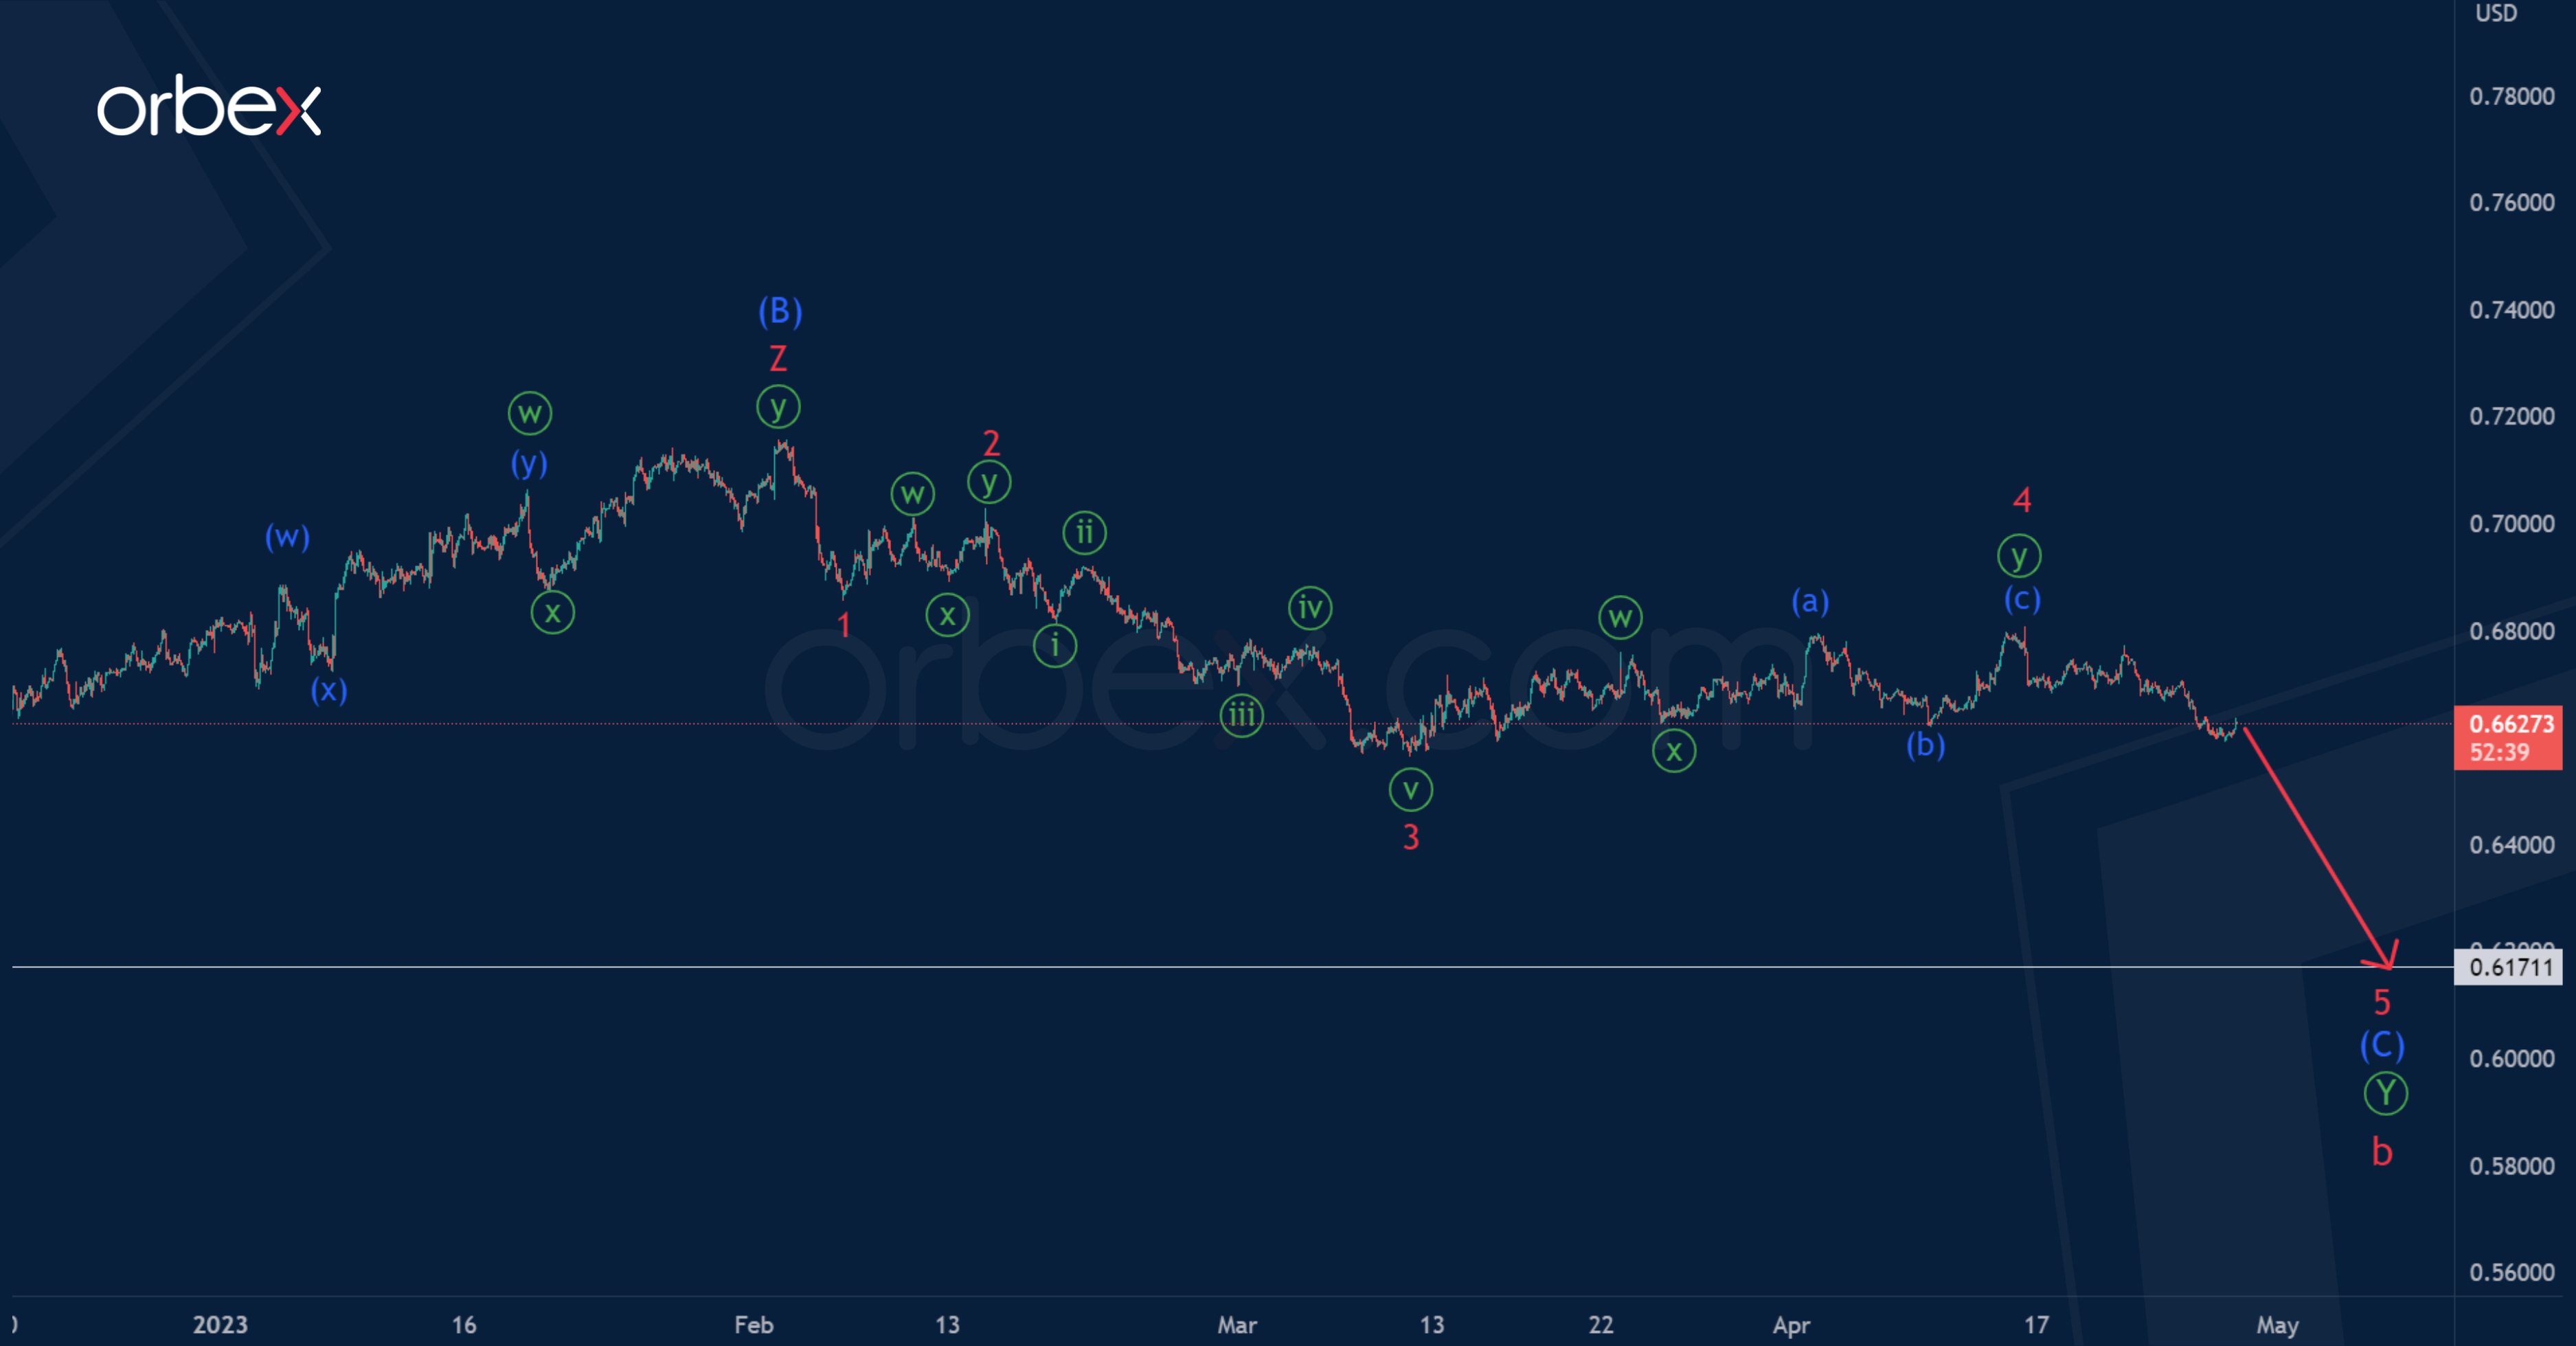
In the long term, AUDUSD seems to be forming a large cycle correction b. This correction has the structure of a primary double zigzag Ⓦ-Ⓧ-Ⓨ.
Inside the actionary wave Ⓨ, two parts can be completed, i.e., the impulse (A) and the intermediate correction (B) in the form of a triple zigzag W-X-Y-X-Z.
At the time of writing, an impulse (C) can be built, consisting of minor sub-waves 1-2-3-4-5.
There is a high probability that the impulse (C) will end at the minimum of 0.617, which was marked by the impulse wave (A).
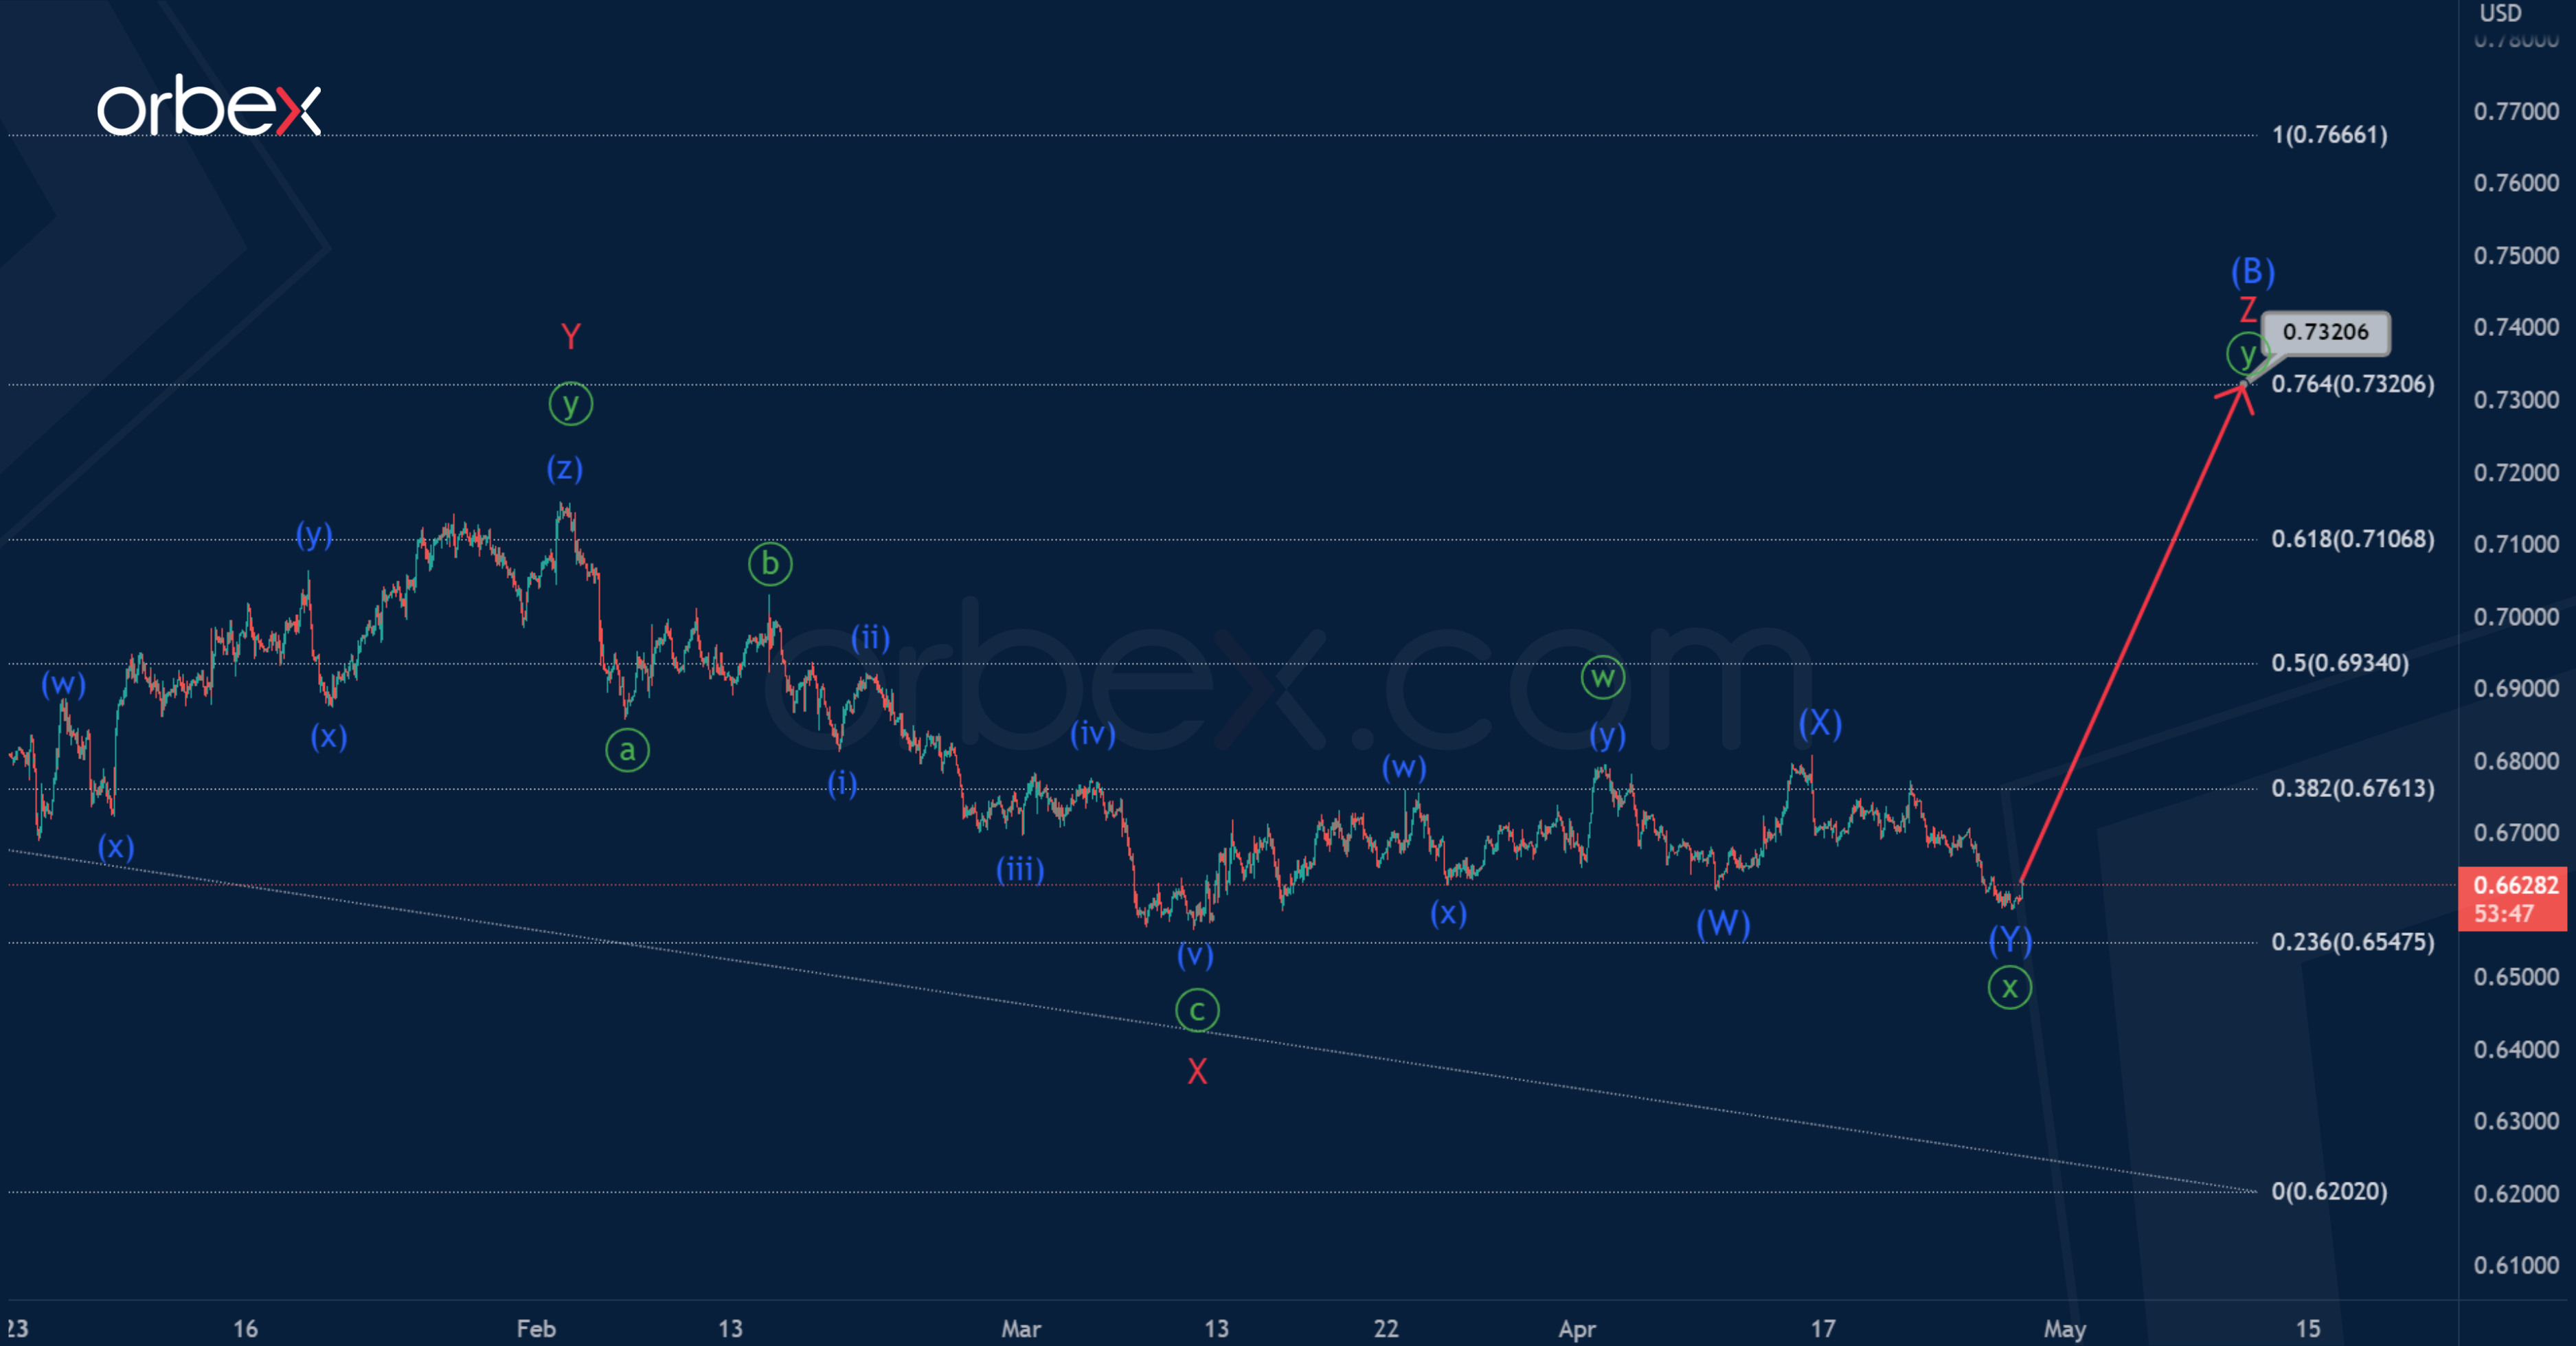
The alternative chart shows an incomplete intermediate correction (B).
The indicated correction (B) has a complex internal structure of the triple zigzag W-X-Y-X-Z, as in the first scenario, but its end is expected at a higher level.
It is assumed that in the last section we see the construction of a minor wave Z. This wave may end in the form of a minute double zigzag near 0.732.
At the level of 0.732, correction (B) will be at 76.4% of impulse (A).
EUR/USD Daily Outlook
Daily Pivots: (S1) 1.0972; (P) 1.1034; (R1) 1.1100; More...
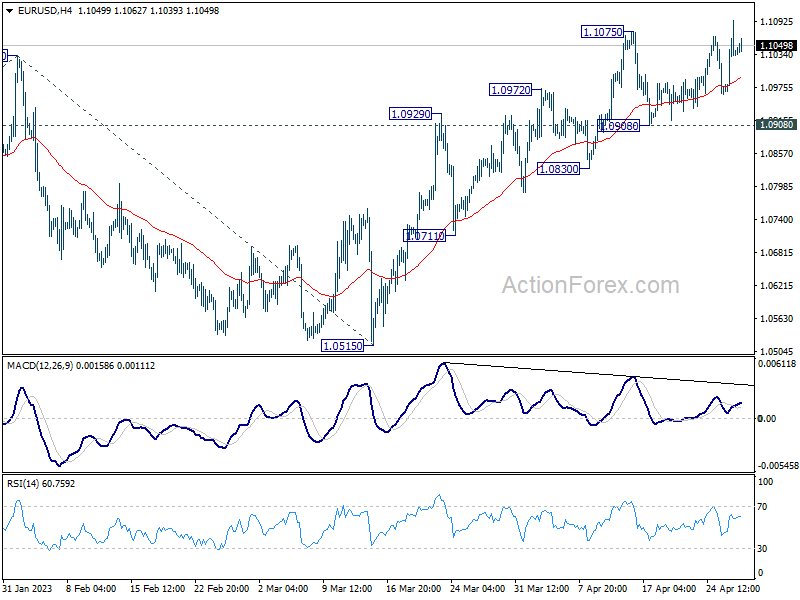
Breach of f1.1075 suggests that EUR/USD's whole rally from 0.9543 is resuming. Intraday bias is now on the upside for 1.1273 fibonacci level. Break there will target 61.8% projection of 0.9534 to 1.1032 from 1.0515 at 1.1441. Meanwhile, outlook will remain bullish as long as 1.0908 support holds, in case of another retreat.
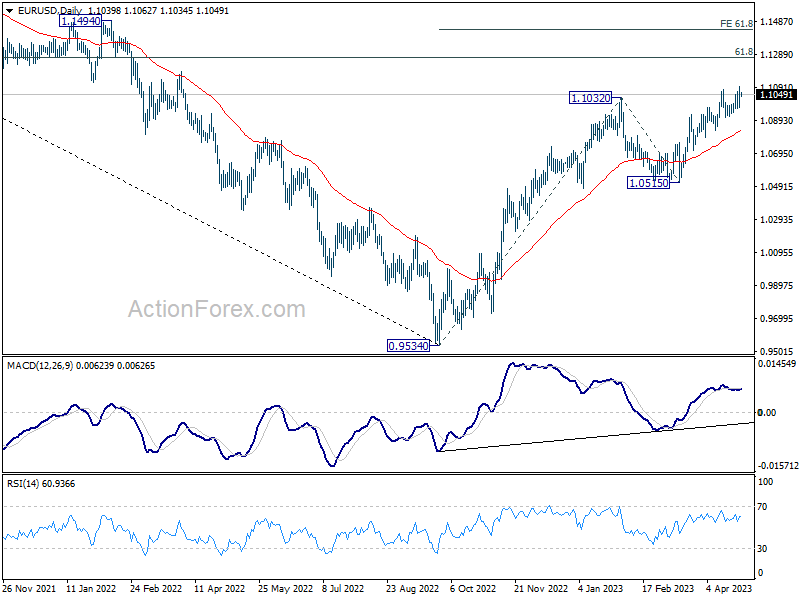
In the bigger picture, rise from 0.9534 (2022 low) is in progress for 61.8% retracement of 1.2348 (2021 high) to 0.9534 at 1.1273. Sustained break there will solidify the case of bullish trend reversal and target 1.2348 resistance next (2021 high). This will now remain the favored case as long as 1.0515 support holds, even in case of deeper pull back.
USD/JPY Daily Outlook
Daily Pivots: (S1) 133.13; (P) 133.55; (R1) 134.07; More...
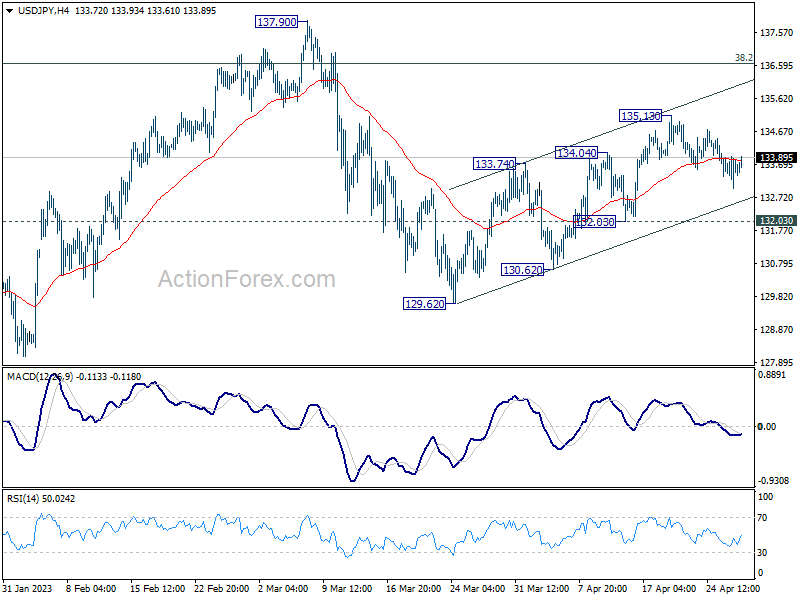
Intraday bias in USD/JPY remains neutral and outlook is unchanged. Further rally is expected as long as 132.03 support holds. On the upside, break of 135.13 will resume the choppy rebound from 129.62 towards 137.90 resistance next. However, break of 132.03 will argue that the rebound has completed already and turn bias back to the downside for 129.62 and below.
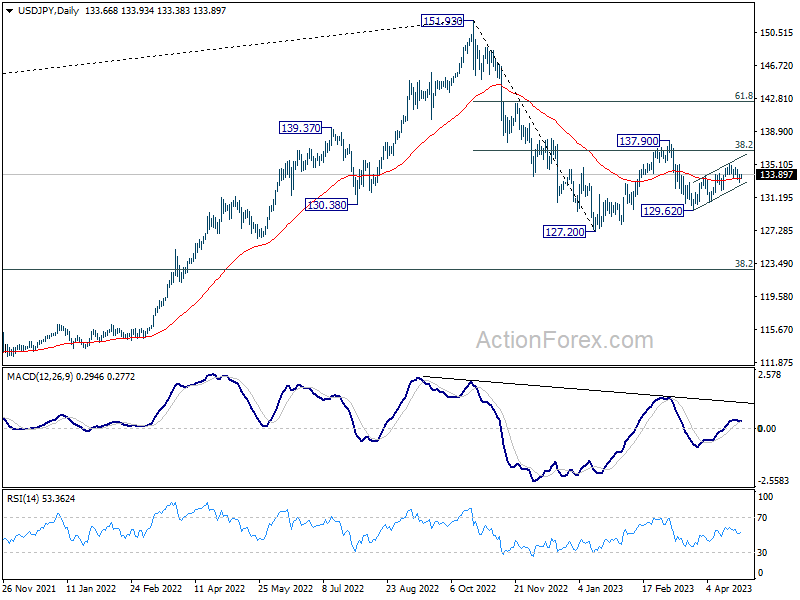
In the bigger picture, corrective pattern from 127.20 might be extending. But after all, down trend from 151.93 is expected to resume at a later stage. Break of 127.20 will resume this down trend and target 61.8% projection of 151.93 to 127.20 from 137.90 at 122.61. This will now be the favored case as long as 137.90 resistance holds.
GBP/USD Daily Outlook
Daily Pivots: (S1) 1.2409; (P) 1.2462; (R1) 1.2521; More...
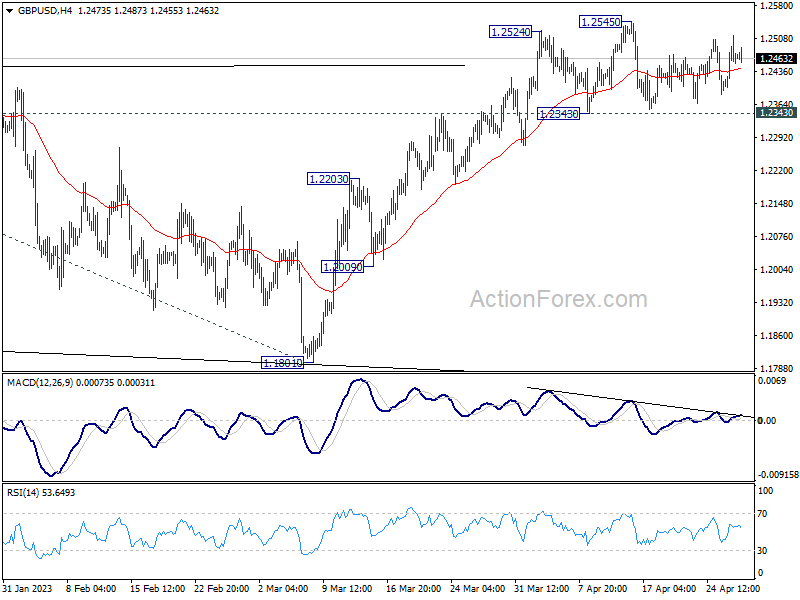
No change in GBP/USD's outlook as sideway trading continues Outlook stays bullish with 1.2343 support intact. On the upside, above 1.2545 will target 1.2759 fibonacci level first. Firm break there will target 61.8% projection of 1.0351 to 1.2445 from 1.1801 at 1.3095. However, considering bearish divergence condition in 4H MACD, firm break of 1.2343 will confirm short term topping, and turn bias back to the downside for deeper pullback.
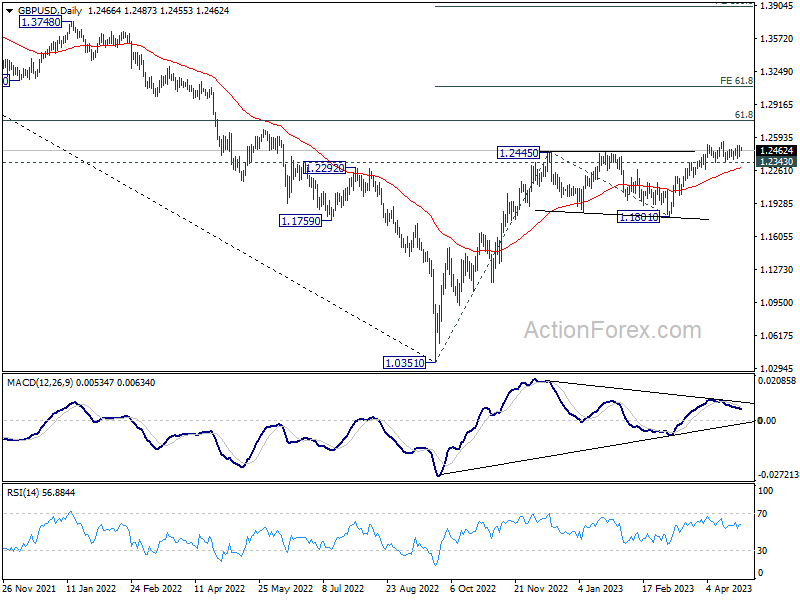
In the bigger picture, the rise from 1.0351 medium term term bottom (2022 low) is in progress for 61.8% retracement of 1.4248 (2021 high) to 1.0351 at 1.2759. Sustained break there will add to the case of long term bullish trend reversal. Further break of 61.8% projection of 1.0351 to 1.2445 from 1.1801 at 1.3095 could prompt upside acceleration to 100% projection at 1.3895. For now, this will remain the favored case as long as 1.1801 support holds, even in case of deep pull back.
USD/CHF Daily Outlook
Daily Pivots: (S1) 0.8869; (P) 0.8897; (R1) 0.8943; More...
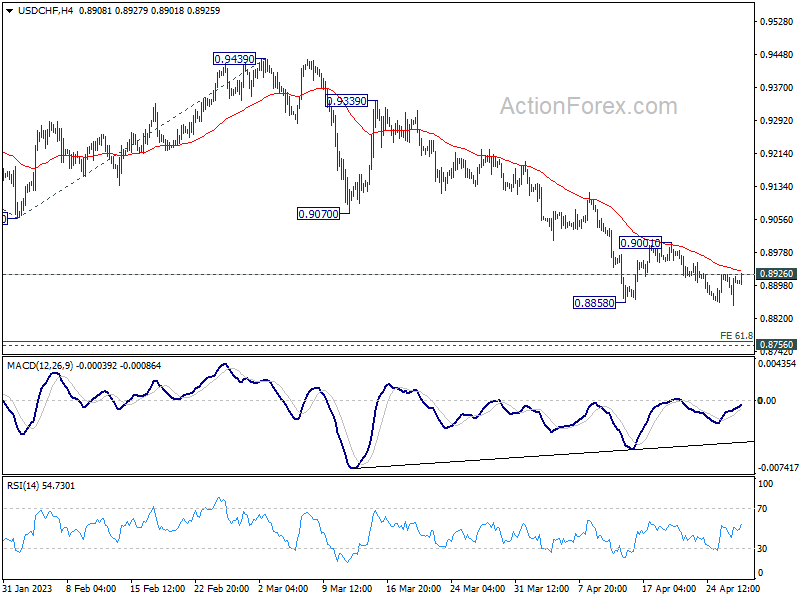
Intraday bias in USD/CHF is turned neutral again first with breach of 0.8926 minor resistance. On the downside, another decline through 0.8858 will resume the whole fall from 1.0146 to 61.8% projection of 1.0146 to 0.9058 from 0.9439 at 0.8767, which is close to 0.8756 long term support. Strong support is expected there to bring rebound, at least on first attempt. On the upside, break of 0.9001 should confirm short term bottoming.
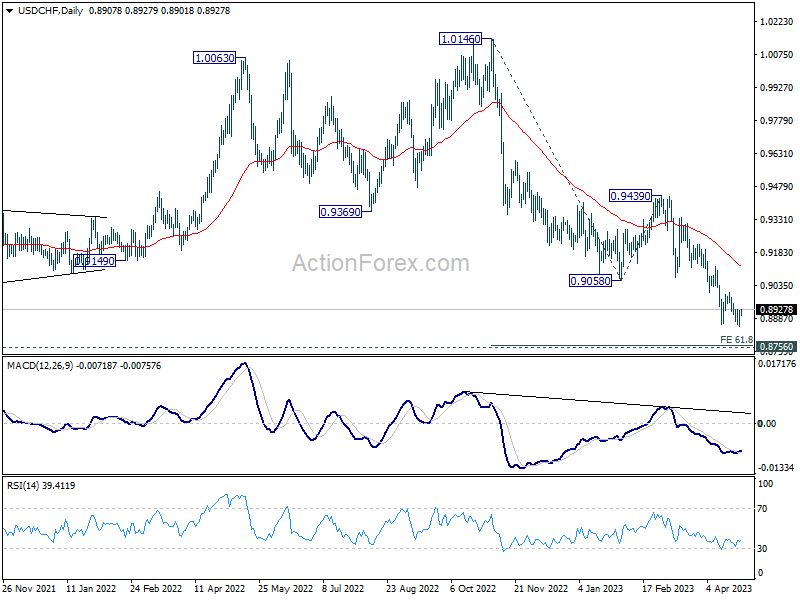
In the bigger picture, fall from 1.1046 (2022 high) is in progress for 0.8756 support (2021 low). But overall, this fall is still seen as a leg in the long term range pattern from 1.0342 (2016 high). So, downside should be contained by 0.8756 to bring reversal. Sustained break of 0.9058 support turned resistance will be the first sign of medium term bottoming. However, decisive break of 0.8756 will carry larger bearish implications.
AUD/USD Daily Report
Daily Pivots: (S1) 0.6584; (P) 0.6611; (R1) 0.6631; More...
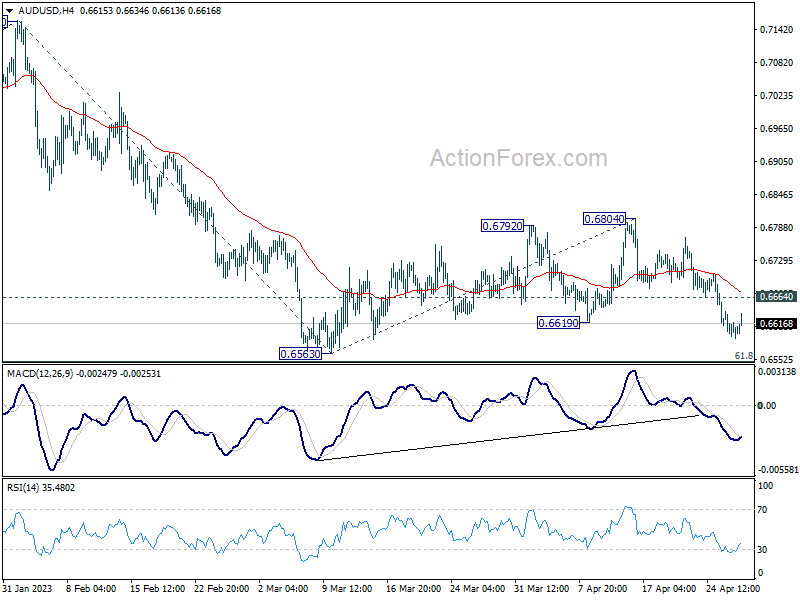
Intraday bias in AUD/USD remains on the downside despite some loss of downside momentum. Consolidation pattern from 0.6563 should have completed at 0.6804, and larger decline from 0.7156 is ready to resume. Firm break of 0.6563 will bring deeper decline through 0.6546 fibonacci level to 61.8% projection of 0.7156 to 0.6563 from 0.6804 at 0.6438 next. On the upside, though, above 0.6664 minor resistance will delay the bearish case and turn intraday bias neutral first.
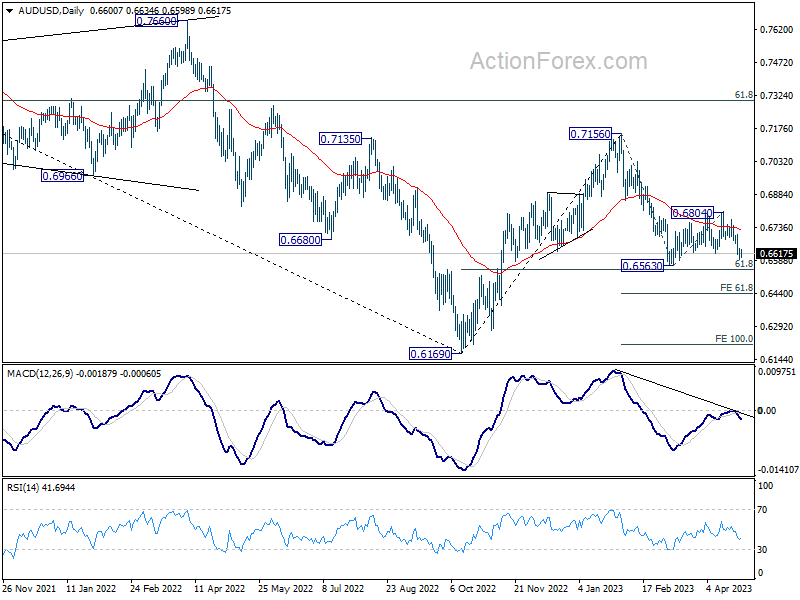
In the bigger picture, as long as 61.8% retracement of 0.6169 to 0.7156 at 0.6546 holds, the decline from 0.7156 is seen as a correction to rally from 0.6169 (2022 low) only. Another rise should still be seen through 0.7156 at a later stage. However, sustained break of 0.6546 will raise the chance of long term down trend resumption through 0.6169 low.
USD/CAD Daily Outlook
Daily Pivots: (S1) 1.3607; (P) 1.3629; (R1) 1.3658; More....
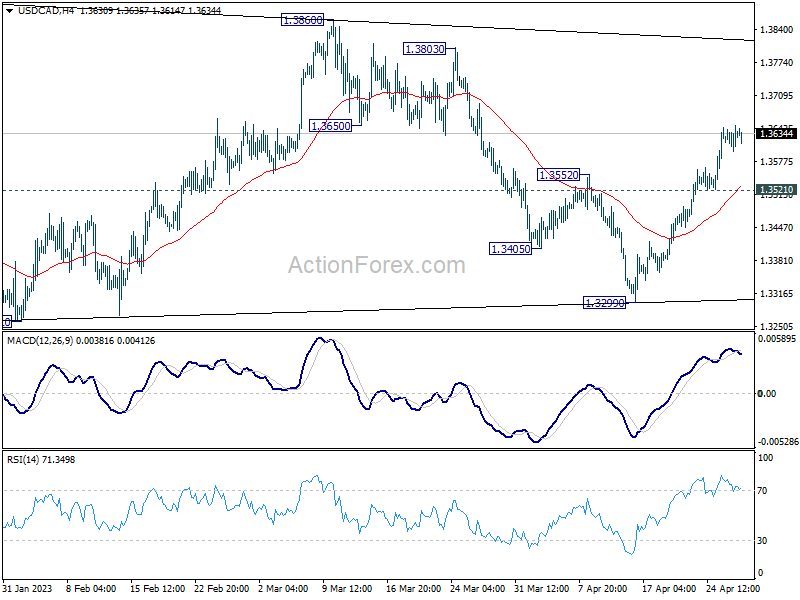
Intraday bias in USD/CAD remains on the upside despite some loss of upside momentum. As note before, the correction pattern from 1.3976 could have completed with three waves to 1.3299. Further rally should be seen to 1.3860/3976 resistance zone. Decisive break there will resume larger up trend. On the downside, below 1.3521 minor support will delay the bullish case and turn intraday bias neutral first.
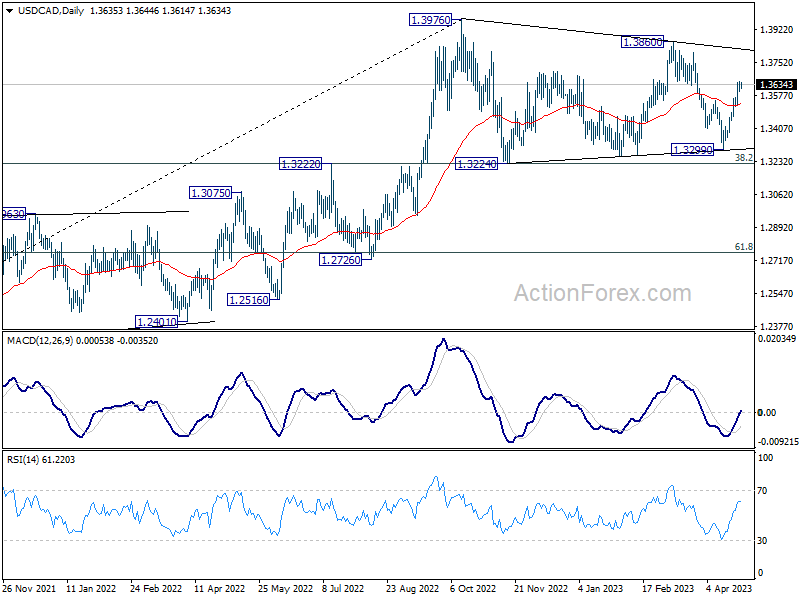
In the bigger picture, the up trend from 1.2005 (2021 low) is still in progress. Break of 1.3976 will confirm resumption and target 61.8% projection of 1.2401 to 1.3976 from 1.3261 at 1.4234. Firm break there will pave the way to long term resistance zone at 1.4667/89 (2016, 2020 highs). On the downside, sustained break of 55 W EMA (now at 1.3302) is needed to confirm medium term topping. Otherwise, outlook will remain bullish even in case of deep pull back.
GBP/JPY Daily Outlook
Daily Pivots: (S1) 165.86; (P) 166.44; (R1) 167.23; More...
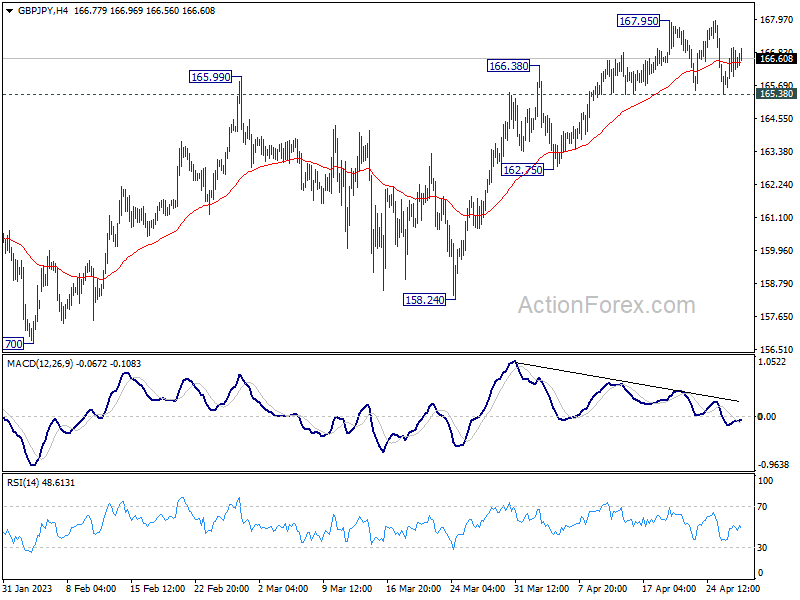
Range trading continues in GBP/JPY and intraday bias stays neutral first. Further rally is expected as long as 165.38 support holds. On the upside, break of 167.95 will resume the rebound from 155.33 to 169.26 resistance. However, firm break of 165.38 will argue that the corrective pattern from 172.11 is starting another falling leg. Intraday bias will be back on the downside for 162.75 support and below.
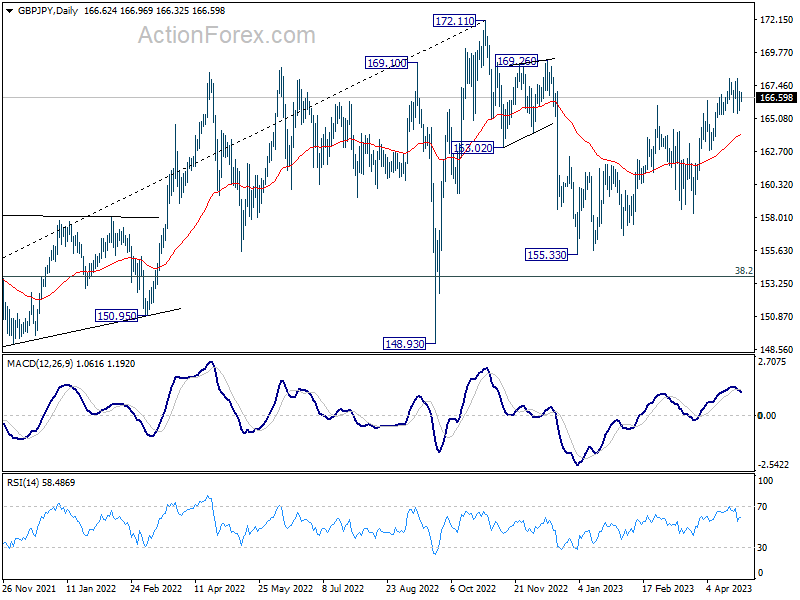
In the bigger picture, as long as 38.2% retracement of 123.94 (2020 low) to 172.11 (2022 high) at 153.70 holds, medium term bullishness is retained. That is, larger up trend from 123.94 (2020 low) is still in progress. Break of 172.11 high to resume such up trend is expected at a later stage.
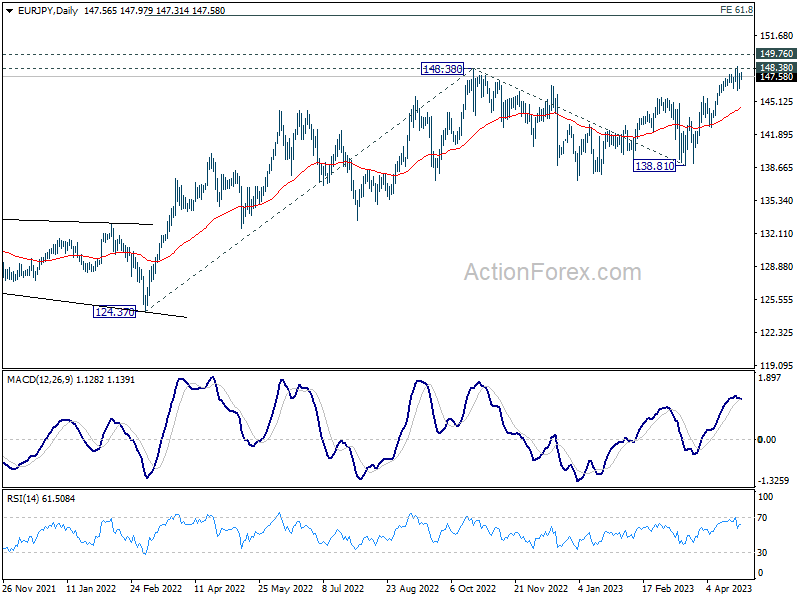
EUR/JPY Daily Outlook
Daily Pivots: (S1) 146.71; (P) 147.31; (R1) 148.17; More....
Intraday bias in EUR/JPY remains neutral for the moment. On the upside, decisive break of 148.38 will resume larger up trend, and next target will be 149.76 long term resistance. However, sustained trading below 146.39 will indicate rejection by 148.38, and bring deeper fall to extend the corrective pattern from there.
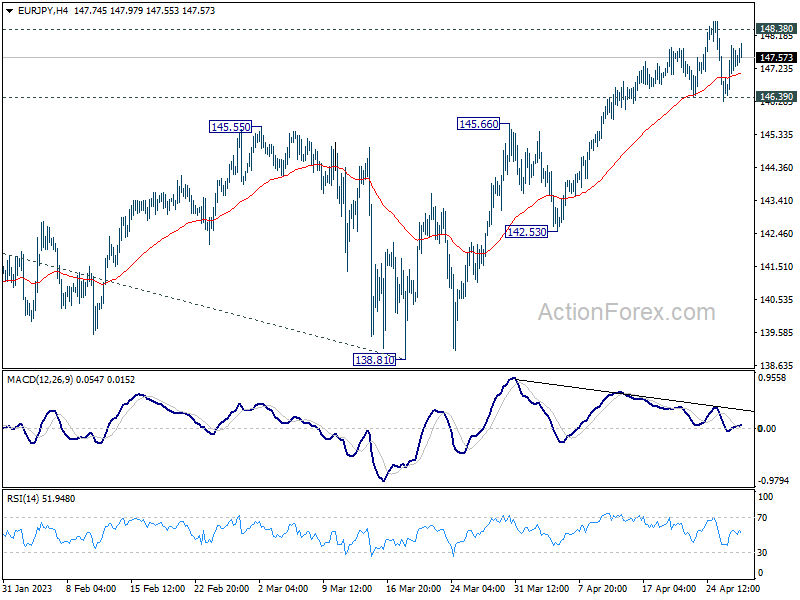
In the bigger picture, as long as 55 W EMA (now at 140.70) holds, larger up trend from 114.42 (2020 low) is still in progress for 149.76 long term resistance (2014 high). Decisive break there will resume long term up trend from 94.11 (2012 low). Next target is 61.8% projection of 124.37 to 148.38 from 138.81 at 153.64.