

Sample Category Title
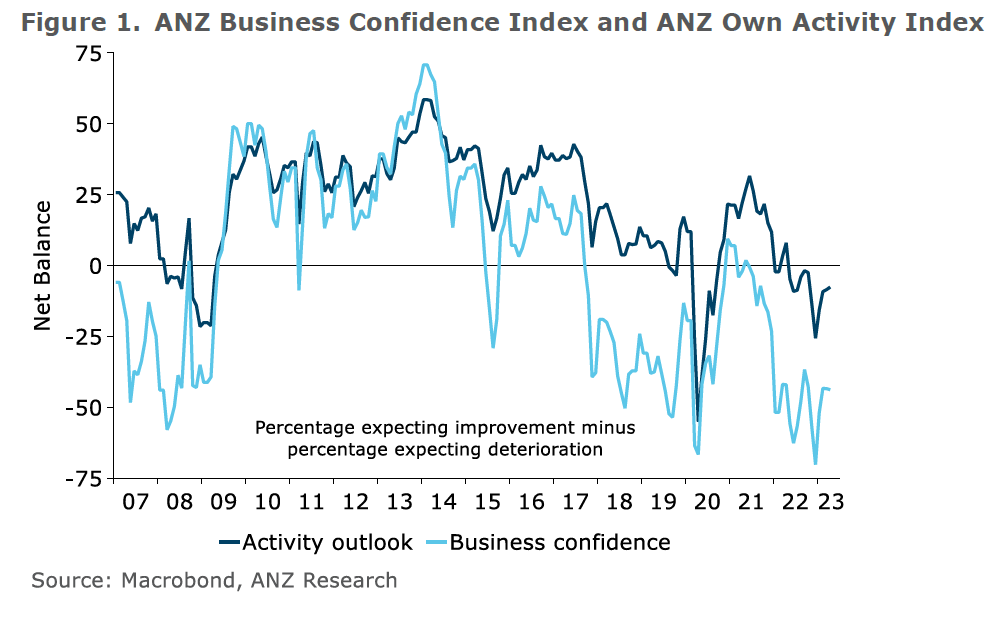
NZ ANZ business confidence dropped slightly, inflation expectation lowest since Mar 2022
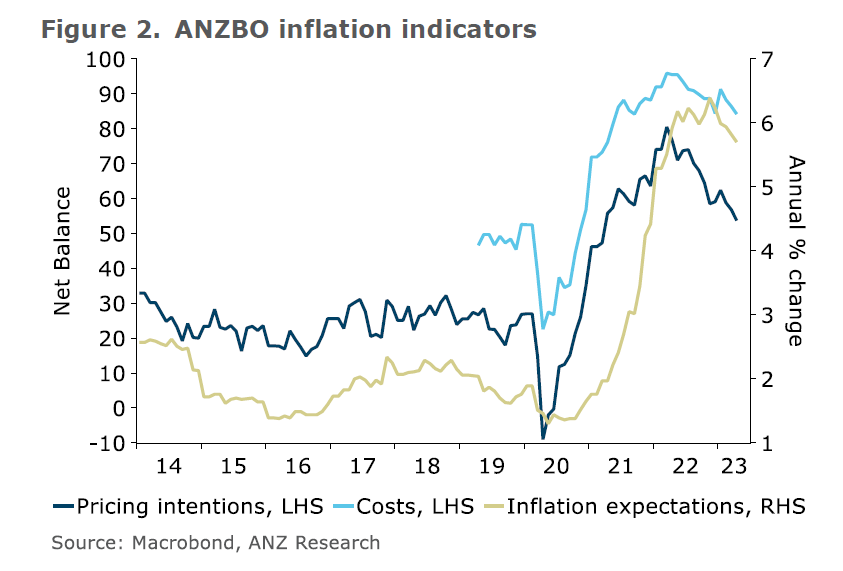
New Zealand ANZ Business Confidence index decrease slightly in April, dipping from -43.4 to -43.8. On the other hand, Own Activity Outlook improved from -8.5 to -7.6. A closer look at the details reveals that export intentions jumped from -8.9 to -1.5, while investment intentions remained unchanged at -6.8. Employment intentions rose from -4.6 to -2.4, and pricing intentions fell from 56.8 to 53.7. Cost expectations dropped from 86.4 to 84.2, and profit expectations declined from -33.9 to -37.7.
Inflation expectations decreased from 5.82 to 5.70, reaching the lowest level since March 2022. ANZ observed that the overall decline in inflation signals is consistent with RBNZ gradually gaining traction. However, the situation is far from resolved, as the proportion of firms experiencing high costs and intending to raise prices remains "problematically high".
ANZ added: "The RBNZ will be encouraged to see the ongoing fall in the inflation indicators in the survey. While there's still a way to go, inflation is set to continue easing over the year ahead, as they and we are forecasting.
"It's important to note that the data does not represent a 'surprise' for the RBNZ; rather, it's what they will be expecting to see if their forecasts are to come to fruition, with the OCR able to top out shortly.
"There are risks on both sides: inflation could get "stuck" north of the target band, or global markets could deliver a side-swipe, for example. But the overall message from this month's survey is "on track."
AUD/USD Turns Red Below 0.6650, US GDP Next
Key Highlights
- AUD/USD gained bearish momentum below 0.6700.
- It traded below a major contracting triangle with support near 0.6675 on the 4-hour chart.
- EUR/USD climbed higher and traded to a new monthly high.
- The US Gross Domestic Product could grow 2% in Q1 2023 (Preliminary).
AUD/USD Technical Analysis
The Aussie Dollar started a major decline from well above 0.6700 against the US Dollar. AUD/USD traded below the 0.6680 support to move into a bearish zone.
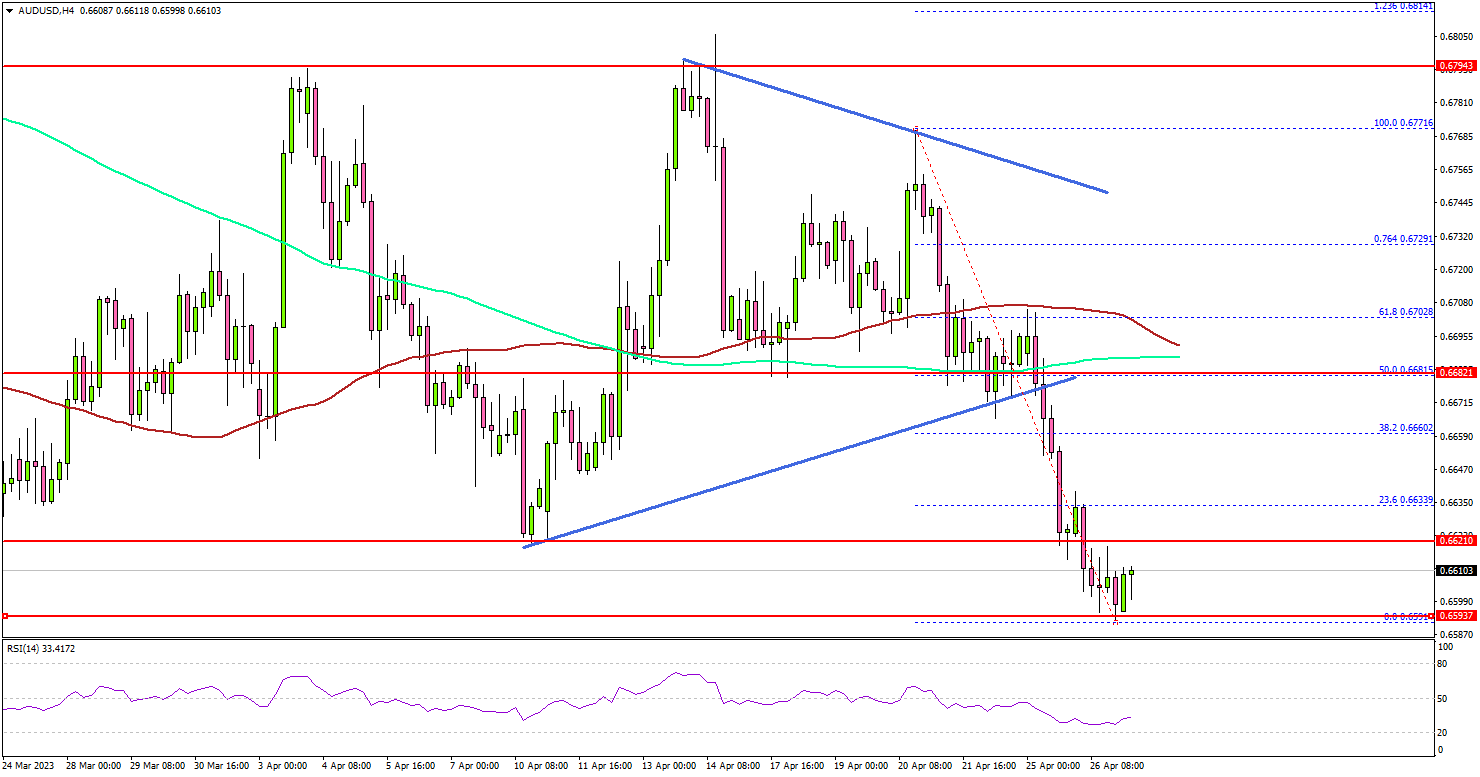
Looking at the 4-hour chart, the pair traded below a major contracting triangle with support near 0.6675. It opened the doors for more losses below 0.6660, the 100 simple moving average (red, 4 hours), and the 200 simple moving average (green, 4 hours).
It tested the 0.6600 support zone and started a consolidation phase. Immediate resistance on the upside is near the 0.6625 level.
The first major resistance is near the 0.6640 level. The main hurdle is now forming near the 0.6680 level and the 100 simple moving average (red, 4 hours). A clear upside break and close above the 0.6680 resistance might send the pair toward 0.6740.
The next key resistance is near the 0.6760 zone. Any more gains might send the pair toward 0.6800. On the downside, there is major support near 0.6580.
The next major support sits near the 0.6550 level, below which the pair might accelerate lower. In the stated case, AUD/USD could visit the 0.6500 support zone.
Looking at EUR/USD, the pair started a fresh increase above the 1.105 level and even spiked to a new monthly high.
Economic Releases
- US Gross Domestic Product Q1 2023 (Preliminary) – Forecast 2% versus previous 2.6%.
- US Initial Jobless Claims - Forecast 248K, versus 245K previous.
AUDJPY Resumes Lower in 7th Swing of Elliott Wave Double Three
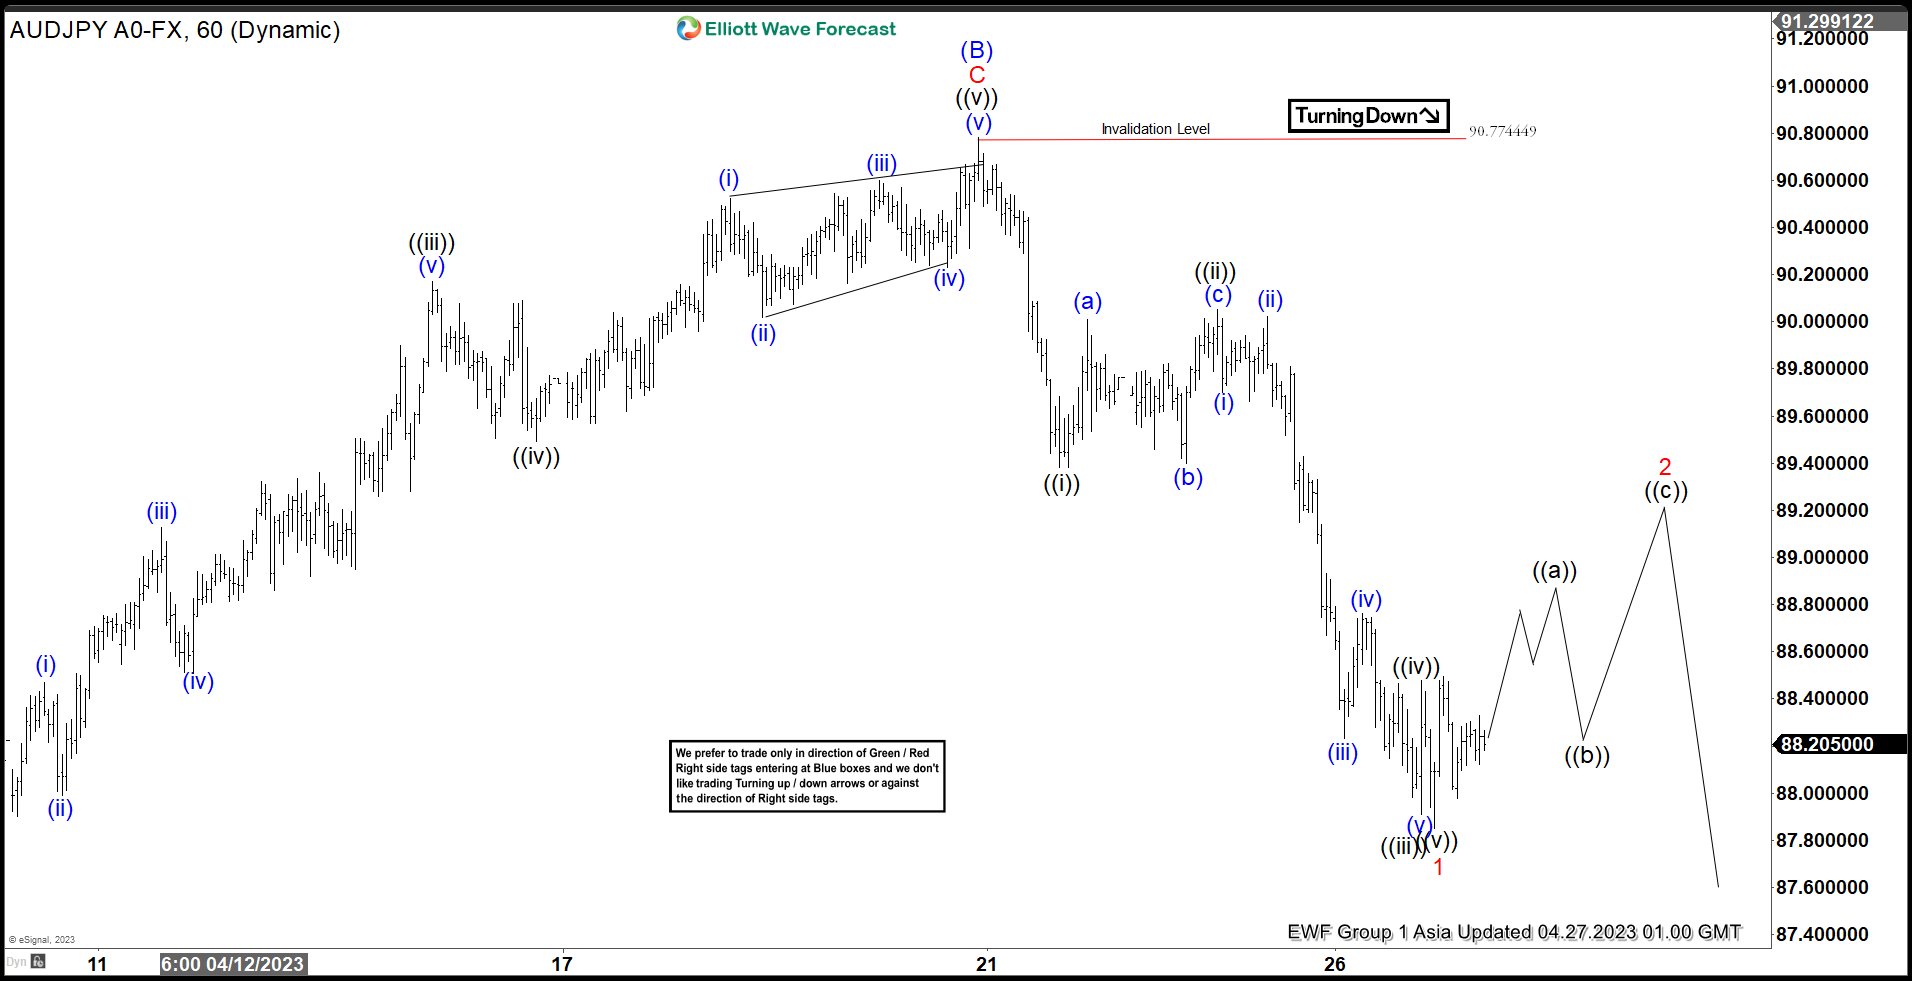
The decline from 9.13.2022 high in $AUDJPY shows a 5 swing Elliott wave sequence suggesting further downside is likely. Near term, rally from 3.24.2023 low ended in 3 swing at 90.77. We labelled the rally as wave (B) as 1 hour chart below shows. Internal subdivision of the rally from 3.24.2023 low unfolded as a zigzag. Up from there, wave A ended at 90.168 and pullback in wave B ended at 87.59. Wave C higher ended at 90.77 which completed wave (B).
Wave (C) lower is now in progress with internal subdivision as a 5 waves. Down from wave (B), wave ((i)) ended at 89.38 and rally in wave ((ii)) ended at 90.05. Down from there, wave (i) ended at 89.7 and rally in wave (ii) ended at 90.02. Pair resumes lower in wave (iii) towards 88.23, and rally in wave (iv) ended at 88.76. Final leg wave (v) ended at 87.91 which completed wave ((iii)). Wave ((iv)) rally ended at 88.478. Final leg wave ((v)) ended at 87.85 which completed wave 1. Wave 2 rally is now in progress to correct cycle from 4.20.2023 high in 3, 7, or 11 swing before the decline resumes. Near term, as far as pivot at 90.77 high stays intact, expect rally to fail in 3, 7, 11 swing for further downside.
AUDJPY 60 Minute Elliott Wave Chart
AUDJPY Elliott Wave Video
https://www.youtube.com/watch?v=QVF-MkIWgIE
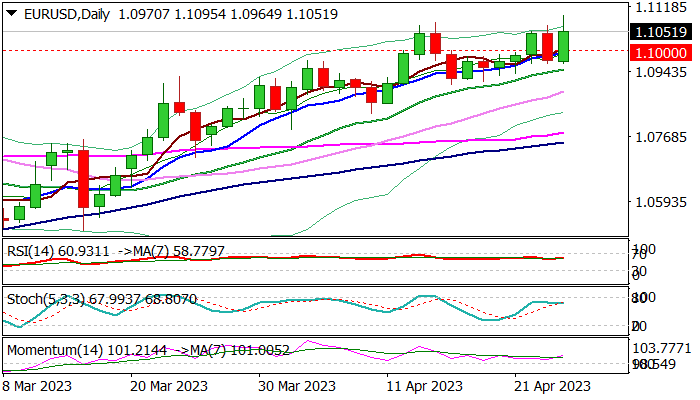
EUR/USD: Bulls Return to Play and Hit New 2023 High
The Euro was sharply up on Wednesday, advancing over 1% until early US session, on weaker dollar and better than expected German economic data, which so far offset fragile risk sentiment on renewed concerns about the US banking sector, after shares of troubled First Republic Bank extended sharp fall into second consecutive day.
Fresh rally returned above 1.10 level and hit new 2023 high today (1.1095), reversing a negative signal from Tuesday’s bearish engulfing, into bullish signal, as bulls fully reversed previous day’s nearly 0.7% drop and on track to form bullish engulfing candlestick pattern today.
Bullish technical studies contribute to brightening near-term outlook, though sustained break above former top at 1.1075 (Apr 14) is needed to signal bullish continuation.
Dips on partial profit-taking after today’s strong bullish acceleration, should stay above psychological 1.10 support (reinforced by rising daily Tenkan-sen) to keep bulls in play.
Break of 1.1075/95 tops would open way for extension of the second leg of larger uptrend from 0.9535 (2022 low) and expose targets at 1.1184 (31 Mar 2022 top) and 1.1223 (Fibo 61.8% of 1.2266/0.9535 downtrend.
Res: 1.1075; 1.1095; 1.1184; 1.1223
Sup: 1.1000; 1.0964; 1.0950; 1.0909
Sunset Market Commentary
Markets
European bond markets started the day still on a solid footing (gap open), betting we’ll see a continuation of yesterday’s trends even as overnight news flow was extremely thin. They soon lost dash though, morphing into sideways trading afterwards. German yield currently lose 6.5 (bps) at the front end and gain slightly at the very long end. US yields are 1.6 bps (30-yr) to 3.1 bps (3-yr) lower. Main European stock markets cede up to 1%, but are also off worst intraday levels. Key US indices are back in positive territory following yesterday short-lived First Republic scare. EUR/USD resumed its uptrend with the pair in a technical acceleration moving beyond the YTD highs in the 1.1070/75 area. First resistance stands at 1.1274 (62% retracement on drop between early 2021 and September 2022). Less liquid crosses like EUR/AUD, EUR/NZD and EUR/CAD are showing similar technical accelerations. EUR/GBP gains are more contained with the pair rising from 0.8842 to 0.8872. Eco data were few and failed to give any meaningful direction. Headline US durable goods orders rose more than expected in March (3.2% M/M) but were diluted by non-defense aircraft orders. Capital goods shipments non-defense ex-aircraft (proxy for investments in GDP calculations) fell 0.4% M/M following a downwardly revised -0.4% M/M in February. German May consumer confidence unexpectedly increased from -29.3 to -25.7 (vs -28 expected), the highest level since April 2022. The German government raised its 2023 GDP forecast from 0.2% in January (and -0.4% in October) to 0.4%. Next year, the government expects growth to accelerate to 1.6%, economy minister Habeck said (from 1.8% in January). Inflation forecasts stand at 5.9% this year (from 6.9% in 2022) and 2.7% in 2024.
Focus now turns to GDP and inflation numbers to released tomorrow and especially on Friday. Tomorrow we’ll see Belgian inflation and US Q1 GDP figures. Friday starts with April Tokyo inflation and the Bank of Japan policy meeting, but the focal point will be French/Spanish/German inflation numbers and to a lesser extent EMU Q1 GDP. The US eco calendar contains March PCE deflators, Q1 employment cost index and Chicago PMI. The data won’t derail Fed plans to lift policy rates by 25 bps next week, but could make or break our base case for a 50 bps ECB hike.
News & Views
Sweden’s central bank jacked up rates by 50 bps to 3.5% today. The increase was necessary to bring back inflation back to the 2% target. Both headline and underlying price pressures eased in March but did so (much) less than the Riksbank anticipated in its February Monetary Policy report. Inflation forecasts as a result were revised upwards, from 5.5% to 5.9% this year and from 1.9% to 2.3% in 2024. Growth this year should be less worse than previously thought (-0.7% vs -1.1%) but 2024 growth momentum was reduced to 0.2% (vs 0.9%). The Riksbank projected another 25 bps rate hike in either June or September to 3.75%. The Swedish krone was disappointed. It hoped for something more, if only because the weak currency (officially) became matter of concern to the central bank since February. It barely left the multiyear lows since then. The fact that two members out of six voted for a smaller hike and a shallower rate path didn’t help either. EUR/SEK retested the 2020/2023 highs around 10.40 after the decision. Swedish swap yields, already down going into the policy outcome, extended declines to almost 15 bps at the front end of the curve.
The European Commission today unveiled proposals to revise the current rules on public spending. These have been suspended in the wake of the Covid and then energy crisis but are set to return next year. Deficit and public-debt limits remain at the familiar 3% and 60% of GDP but individual member states are given greater ownership of their debt-reduction plans. They are required to set out plans with fiscal targets, measures to address imbalances, priority reforms and investments over at least four years. Debt burdens of countries in excess of the 60% threshold will have to be lower by the end of the plan period than at the start while excessive deficits should be reduced at a minimum pace of 0.5% of GDP annually. Some elements of the plan require unanimous member state approval, meaning negotiations could last for months. Germany already expressed concerns about “debt reduction à la carte”.
USD/CHF Mid-Day Outlook
Daily Pivots: (S1) 0.8878; (P) 0.8903; (R1) 0.8945; More...
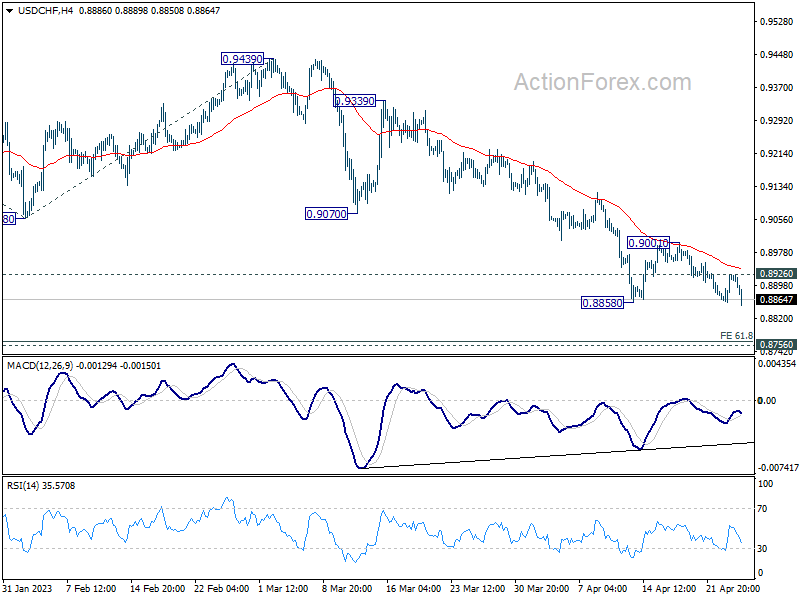
Breach of 0.8858 support indicates resumption of recent down trend in USD/CHF. Intraday bias is back on the downside. Current fall from 1.0146 should target 1.0146 to 61.8% projection of 1.0146 to 0.9058 from 0.9439 at 0.8767, which is close to 0.8756 long term support. Strong support is expected there to bring rebound, at least on first attempt. On the upside, above 0.8926 minor resistance will turn intraday bias neutral first. Further break of 0.9001 should confirm short term bottoming.
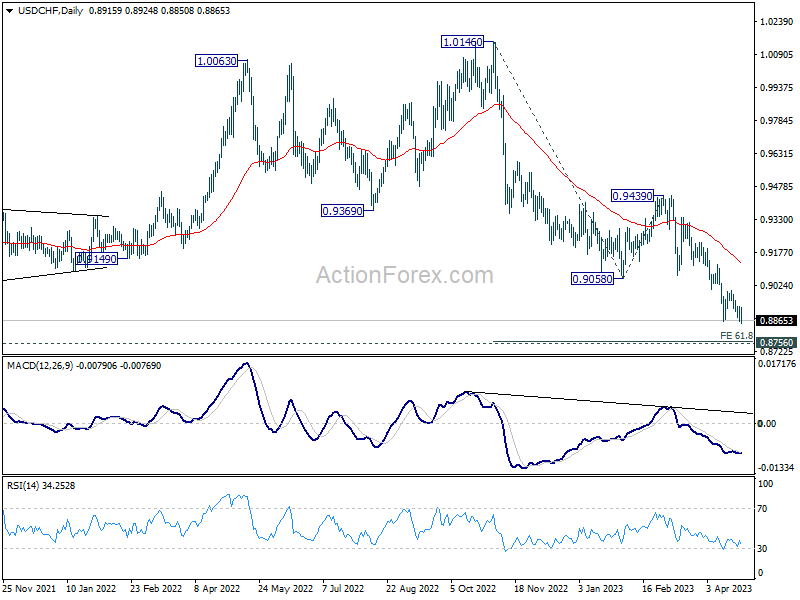
In the bigger picture, fall from 1.1046 (2022 high) is in progress for 0.8756 support (2021 low). But overall, this fall is still seen as a leg in the long term range pattern from 1.0342 (2016 high). So, downside should be contained by 0.8756 to bring reversal. Sustained break of 0.9058 support turned resistance will be the first sign of medium term bottoming. However, decisive break of 0.8756 will carry larger bearish implications.
USD/JPY Mid-Day Outlook
Daily Pivots: (S1) 133.24; (P) 133.85; (R1) 134.33; More...
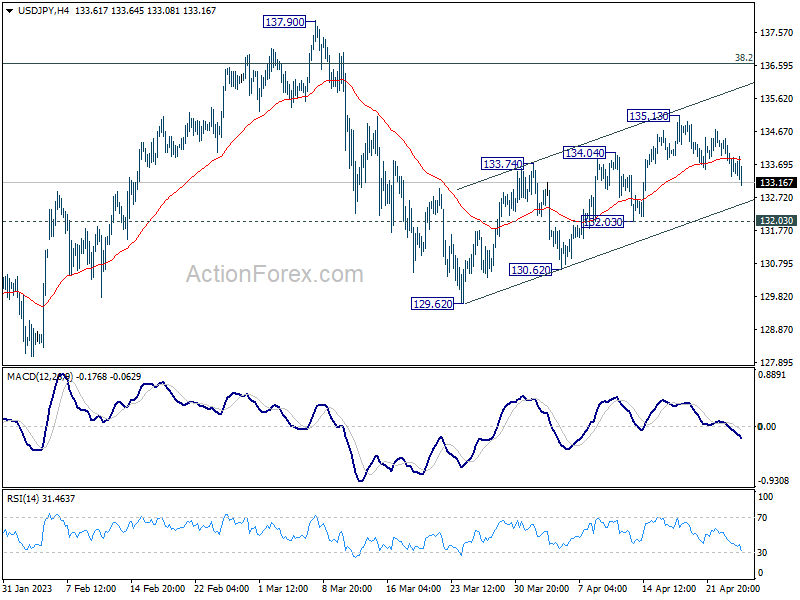
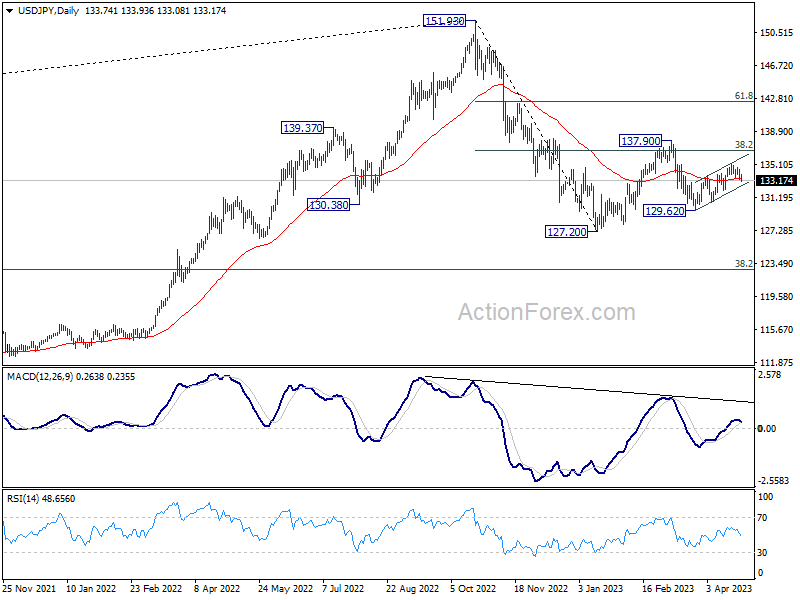
USD/JPY's pull back from 135.13 extends lower today, but stays well above 132.03 support. Intraday bias remains neutral first. Further rally is expected as long as 132.03 support holds. On the upside, break of 135.13 will resume the choppy rebound from 129.62 towards 137.90 resistance next. However, break of 132.03 will argue that the rebound has completed already and turn bias back to the downside for 129.62 and below.
In the bigger picture, corrective pattern from 127.20 might be extending. But after all, down trend from 151.93 is expected to resume at a later stage. Break of 127.20 will resume this down trend and target 61.8% projection of 151.93 to 127.20 from 137.90 at 122.61. This will now be the favored case as long as 137.90 resistance holds.
GBP/USD Mid-Day Outlook
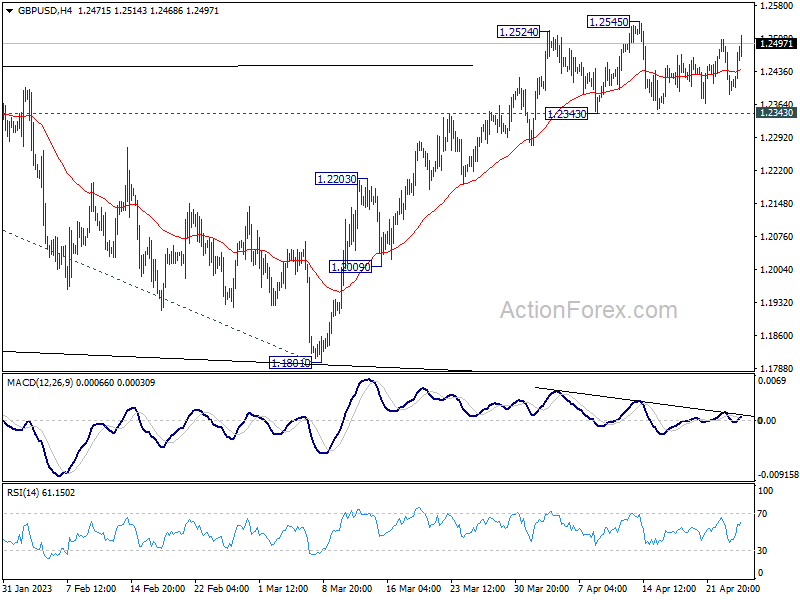
Daily Pivots: (S1) 1.2362; (P) 1.2435; (R1) 1.2482; More...
While GBP/USD's is still bounded in range below 1.2545 resistance, outlook stays bullish with 1.2343 support intact. On the upside, above 1.2545 will target 1.2759 fibonacci level first. Firm break there will target 61.8% projection of 1.0351 to 1.2445 from 1.1801 at 1.3095. However, considering bearish divergence condition in 4H MACD, firm break of 1.2343 will confirm short term topping, and turn bias back to the downside for deeper pullback.
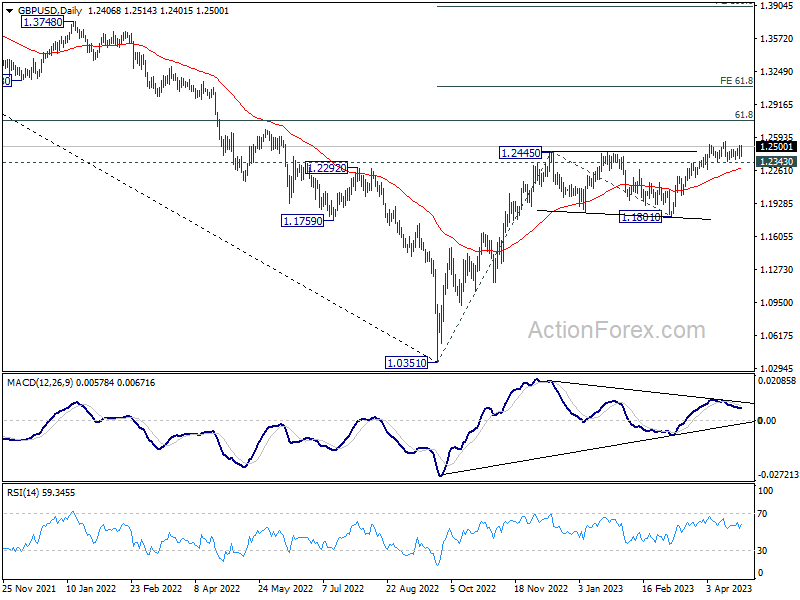
In the bigger picture, the rise from 1.0351 medium term term bottom (2022 low) is in progress for 61.8% retracement of 1.4248 (2021 high) to 1.0351 at 1.2759. Sustained break there will add to the case of long term bullish trend reversal. Further break of 61.8% projection of 1.0351 to 1.2445 from 1.1801 at 1.3095 could prompt upside acceleration to 100% projection at 1.3895. For now, this will remain the favored case as long as 1.1801 support holds, even in case of deep pull back.
Nasdaq (NQ) Buyers Can Appear Soon According to Elliott Wave
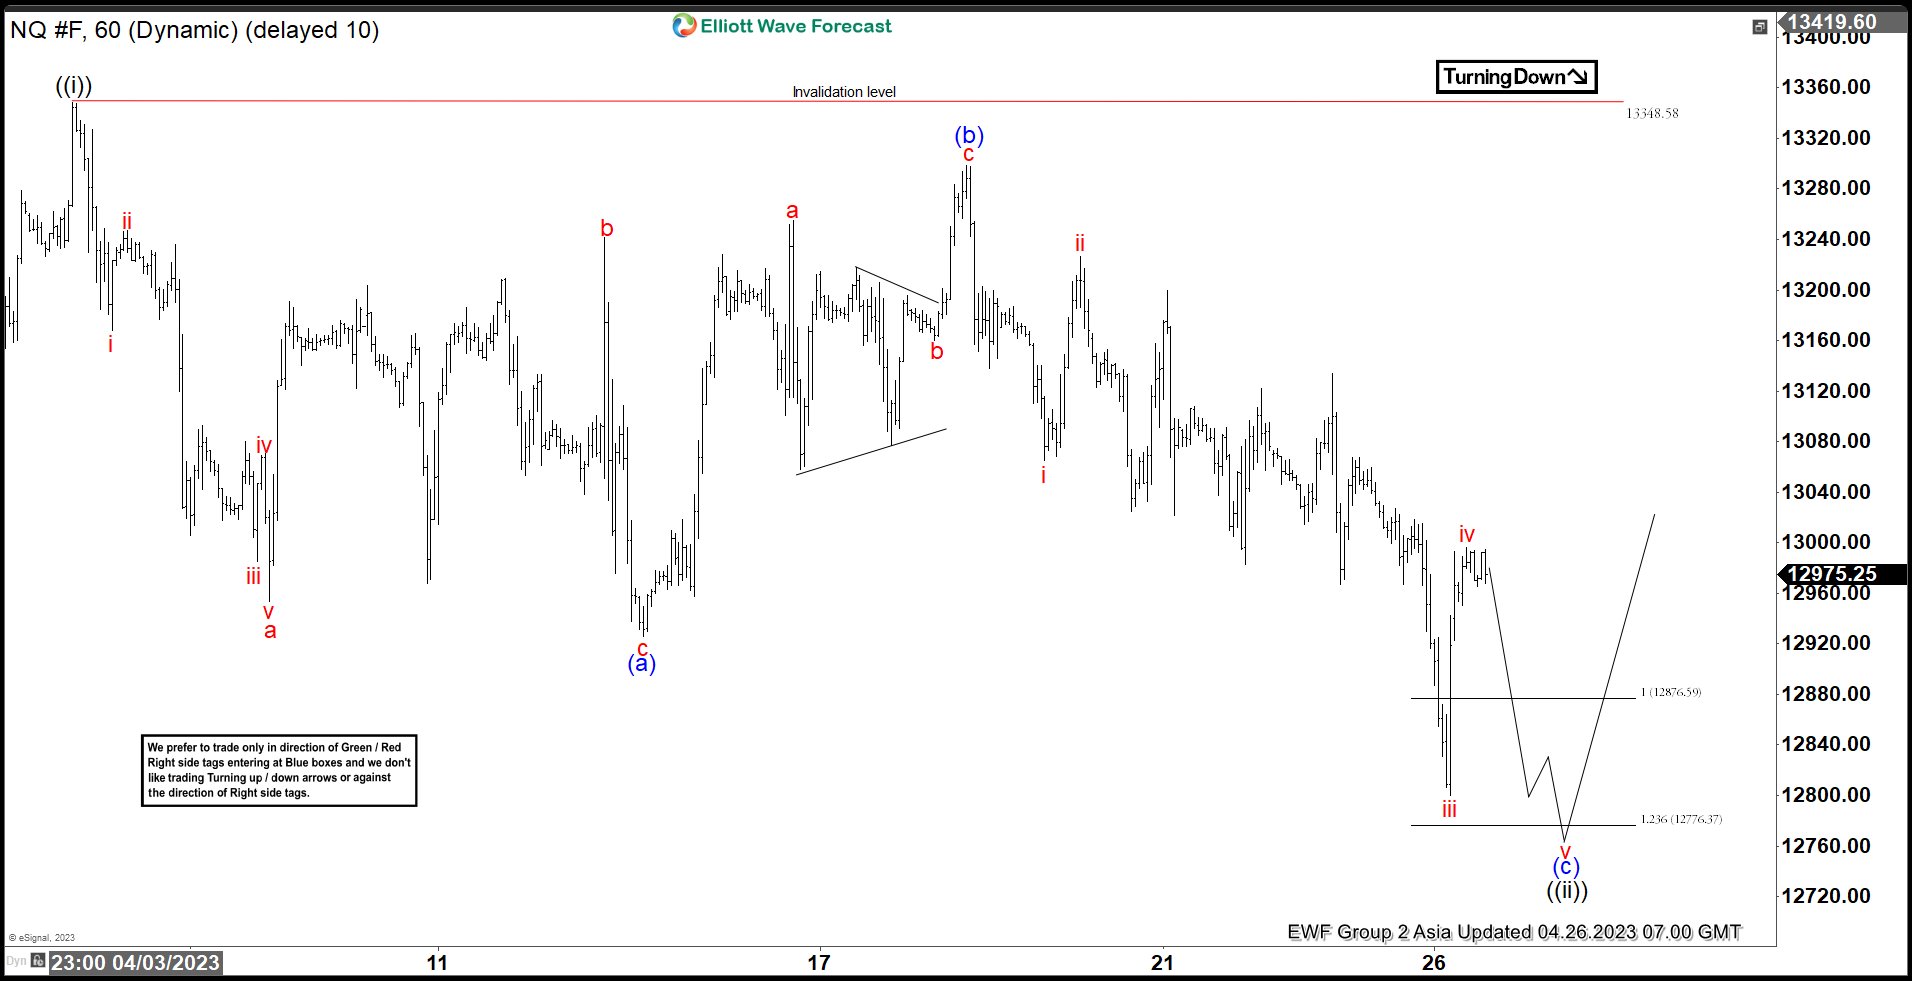
Short Term Elliott Wave in Nasdaq (NQ) suggests the Index is cycle from 3.13.2023 low ended in wave ((1)) at 13349.37 as the 1 hour chart below shows. Wave ((ii)) pullback is currently in progress to correct cycle from 3.13.2023 low. Internal subdivision of wave ((ii)) is unfolding as a double three Elliott Wave structure.
Down from wave ((i)), wave a ended at 12953.25 and wave b ended at 13241.75. Wave c lower ended at 12925.50 which completed wave (a) in higher degree. Wave (b) rally ended at 13298.75 with internal subdivision as a zigzag. Up from wave (a), wave a ended at 13255 and dips in wave b ended at 13160.25. Wave c ended at 13297.75 which completed wave (b). Wave (c) lower is in progress as 5 waves. Down from wave (b), wave i ended at 13065 and rally in wave ii ended at 13226.75. Wave iii ended at 12800. Expect wave iv to end soon and Index to turn lower in wave v to complete wave (c) of ((ii)). Potential target for wave (c) of ((ii)) is 100% – 161.8% Fibonacci extension of wave (a) which comes at 12614.1 – 12876.5.
NQ 60 Minute Elliott Wave Chart
Nasdaq Elliott Wave Video
https://www.youtube.com/watch?v=aJVUCAKTqEY