

Sample Category Title
LTCUSD Analysis: Inverted Hammer Pattern Is above $84.29
Bulls were able to take control of the market last week, and after touching a low of $84.29 on 26 April, the price started to correct upwards against the US Dollar.
There is an inverted hammer pattern above the $84.29 handle on the H1 timeframe. It signifies the end of a bearish phase and the start of a bullish phase in the market.
The momentum indicator is back over zero in the H1 timeframe, indicating a bullish trend. There is also an upside gap located in the 15-minutes timeframe, which indicates the bullish nature of the market. We can see the formation of the Doji candle in the D1 timeframe, indicating the neutral tone of the market.
Also, Litecoin is trading below its 100-hour simple moving average, 200-hour exponential moving average, and pivot level of $91.57.
The relative strength index is at 53.164, indicating a neural demand for Litecoin and the shift towards the consolidation zone in the markets.
Litecoin remains above some of the moving averages, which is a bullish signal at the current market level of $88.33.
The CCI is signaling neutral market conditions, which means that the price is expected to move in a narrow range in the short term.
The short-term outlook for Litecoin has turned mildly bullish.
- Some of the technical indicators are bullish.
- Litecoin bullish reversal is seen above the $84.39 level.
- The RSI is neutral.
- The average true range indicates high market volatility.
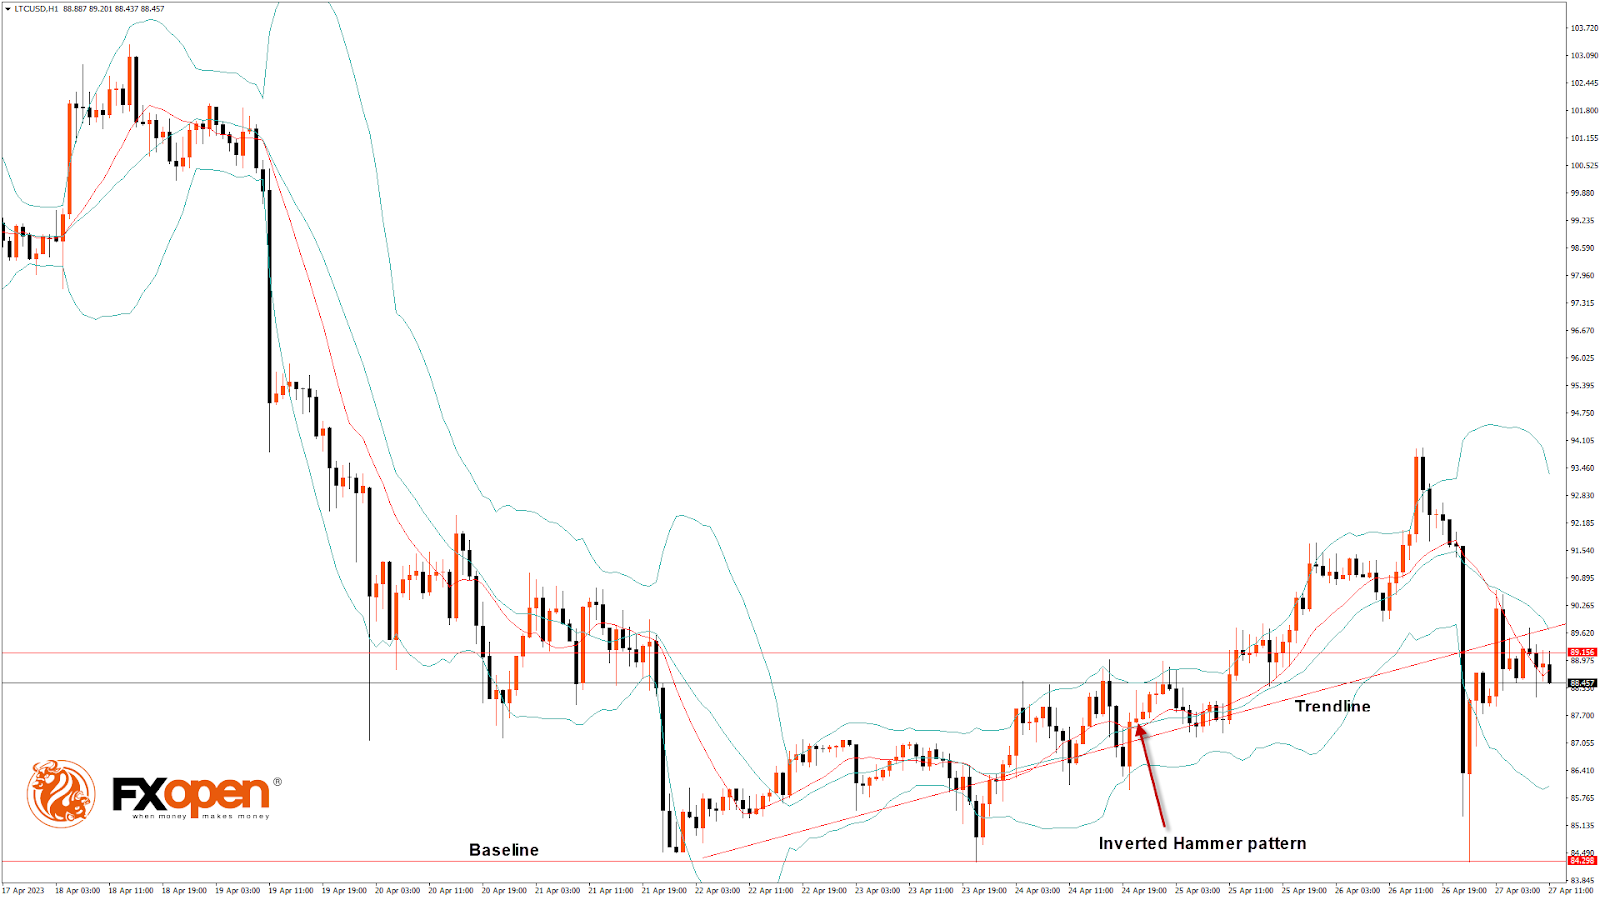
Litecoin Bullish Reversal is seen above $84.29
Litecoin continues to move in a mild bullish momentum after its recent decline below the $85.00 level.
As the prices are now moving into a narrow range, we can expect some bullish moves after the price crosses the $90.00 handle.
Some of the technical indicators are also giving a neutral tone present in the markets.
LTCUSD is about to break its classic resistance level of 89.41 and Fibonacci resistance level of 90.35, after which the path towards $95 will get cleared.
Litecoin faces resistance at $93.77, which is a 50% retracement from a 4-week High/Low, and at $96.43, at which the price crosses the 9-day moving average.
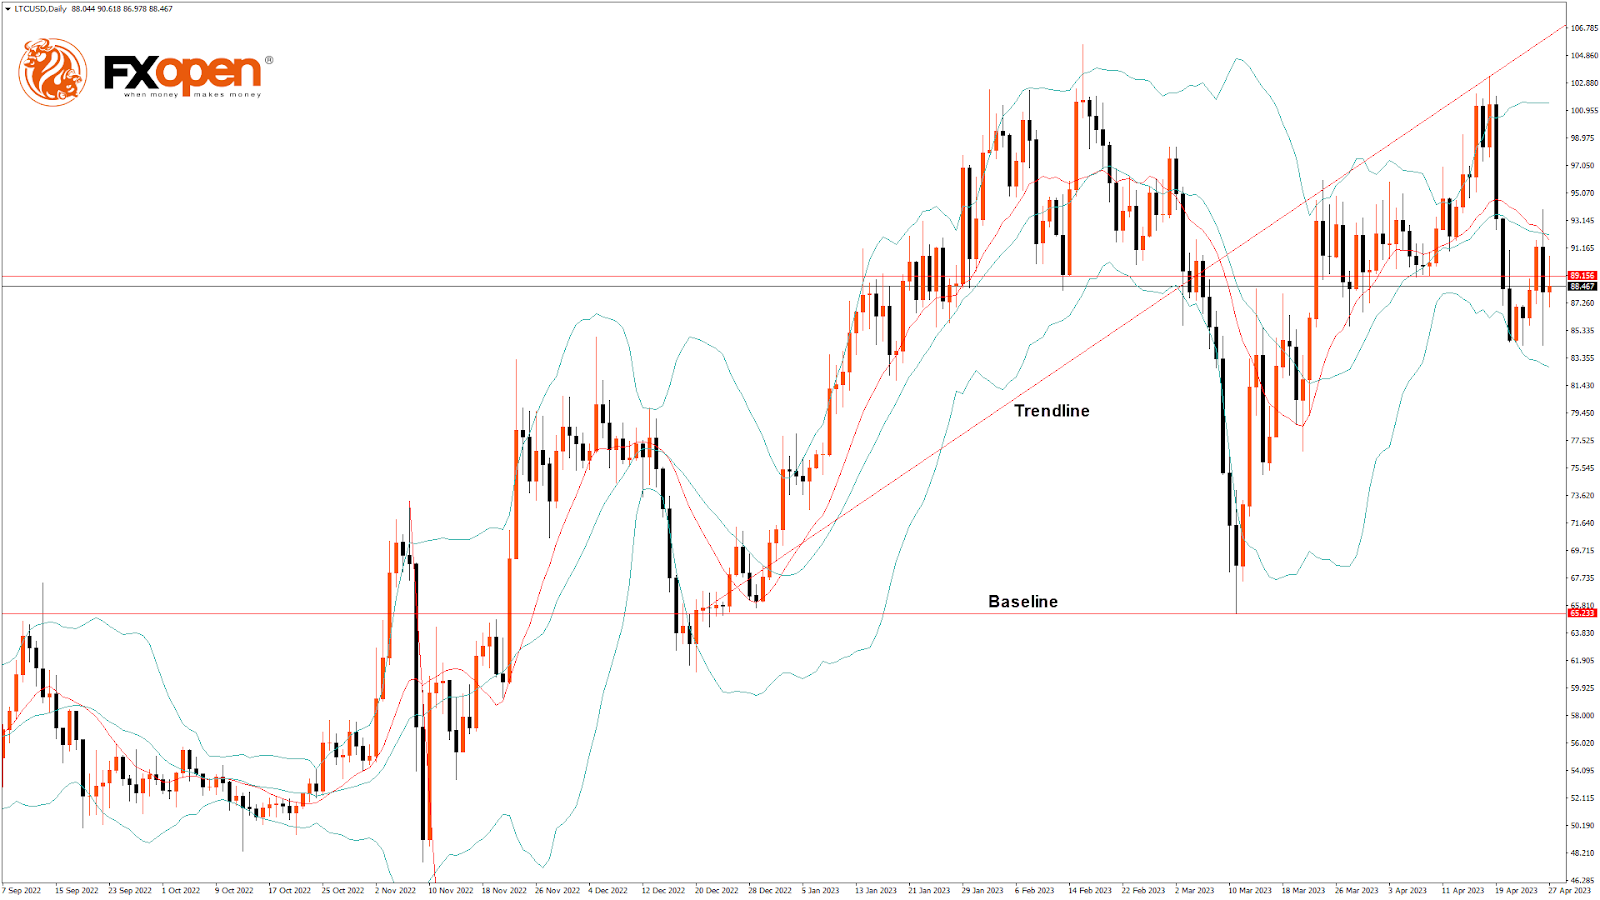
The Week Ahead
Litecoin has entered a consolidation zone, and further resistance levels are $90 and $95.
Most technical indicators are signaling bullish sentiment in the market.
Litecoin should stay above the important support level of $83.56, which is a 3-10 day MACD, and at $80.7, which is a 38.2% retracement from a 13-week low.
The short-term outlook for Litecoin has turned mildly bullish, the medium-term outlook is bullish, and the long-term outlook is neutral at present market conditions.
The weekly projection is $95, with a consolidation zone of $92.
ETHUSD Analysis: The Morning Star Pattern above $1,786
Bulls were able to take control of the market, and after touching a low of $1,786 on 26 April, the ETH/USD pair is showing bullish momentum, touching a high of $1,938 today in the early Asian trading session.
ETHUSD is under mild bullish pressure after its decline below the $1,800 handle due to improved investor sentiment and support seen at lower levels.
The morning star pattern is above the $1,786 handle on the H1 timeframe. It's a bullish pattern, which signifies the end of a bearish phase.
The price is above the Ichimoku cloud in the 15-minutes timeframe.
ETH is back above the pivot point, indicating the bullish pressure in the market.
The relative strength index is at 57.13, indicating a strong demand for Ether and a continuation of the buying pressure in the market.
The STOCHRSI is giving neutral, meaning that the price is expected to enter into a consolidation zone in the short-term range.
We also detected the formation of the bullish trend reversal pattern with the 50-period moving average in the 15-minutes timeframe.
Most of the technical indicators are bullish. Most moving averages are bullish at the current market level of $1,885.
ETH is now trading above the 200-hour simple and 200-hour exponential moving averages.
- ETH bullish reversal is seen above the $1,786 mark.
- The short-term range is expected to be mildly bullish.
- The average true range indicates high market volatility.
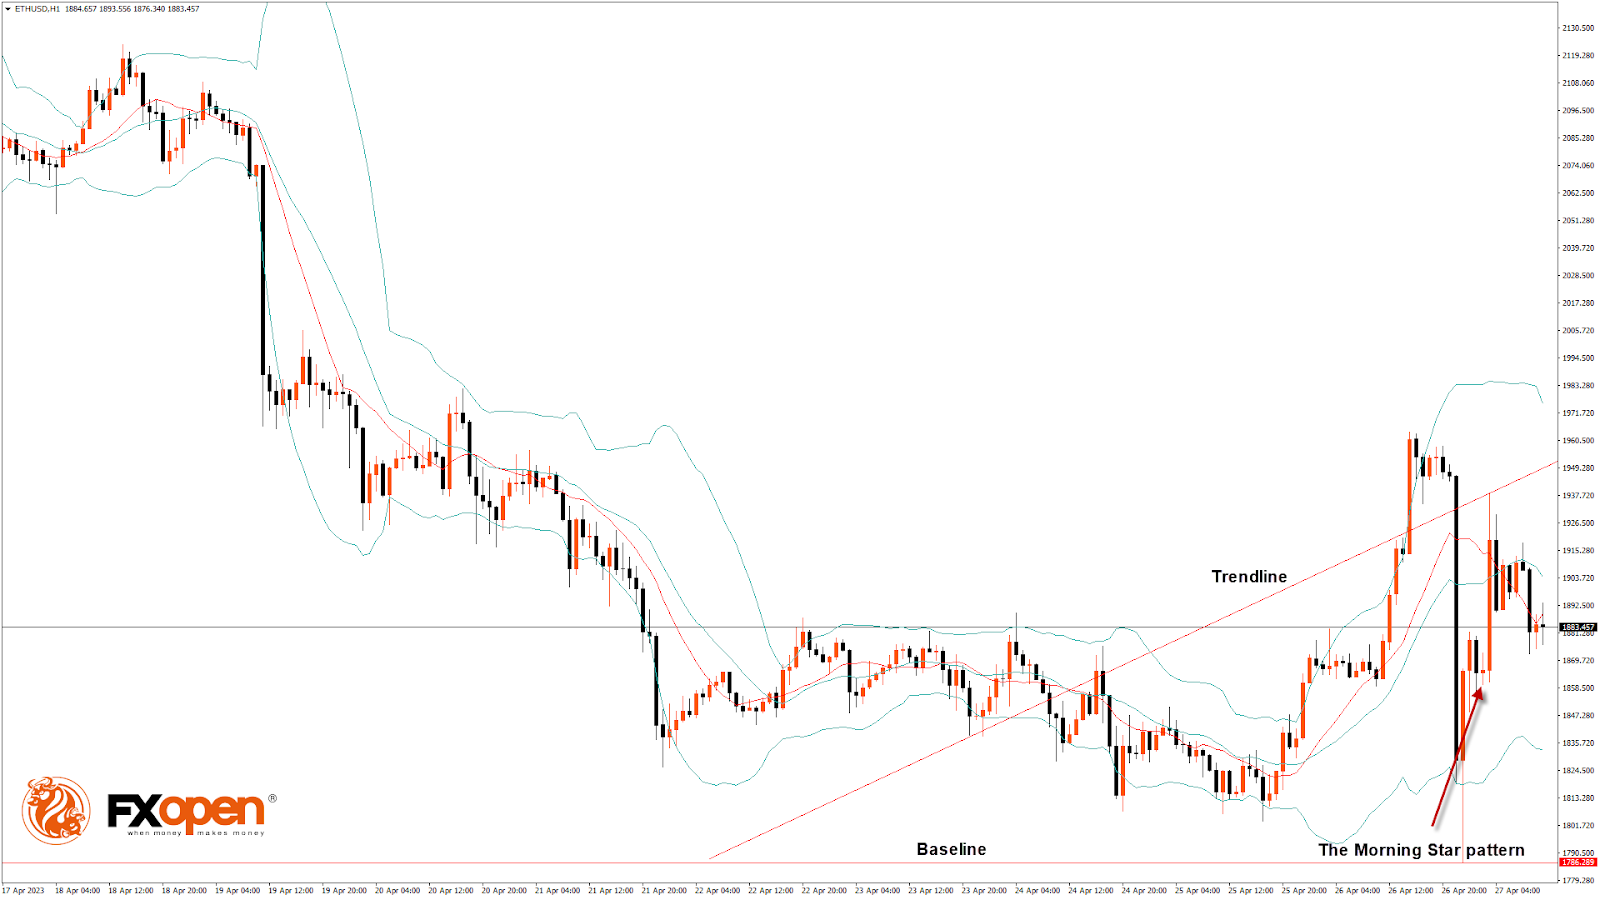
ETH Bullish Reversal Is above $1,786
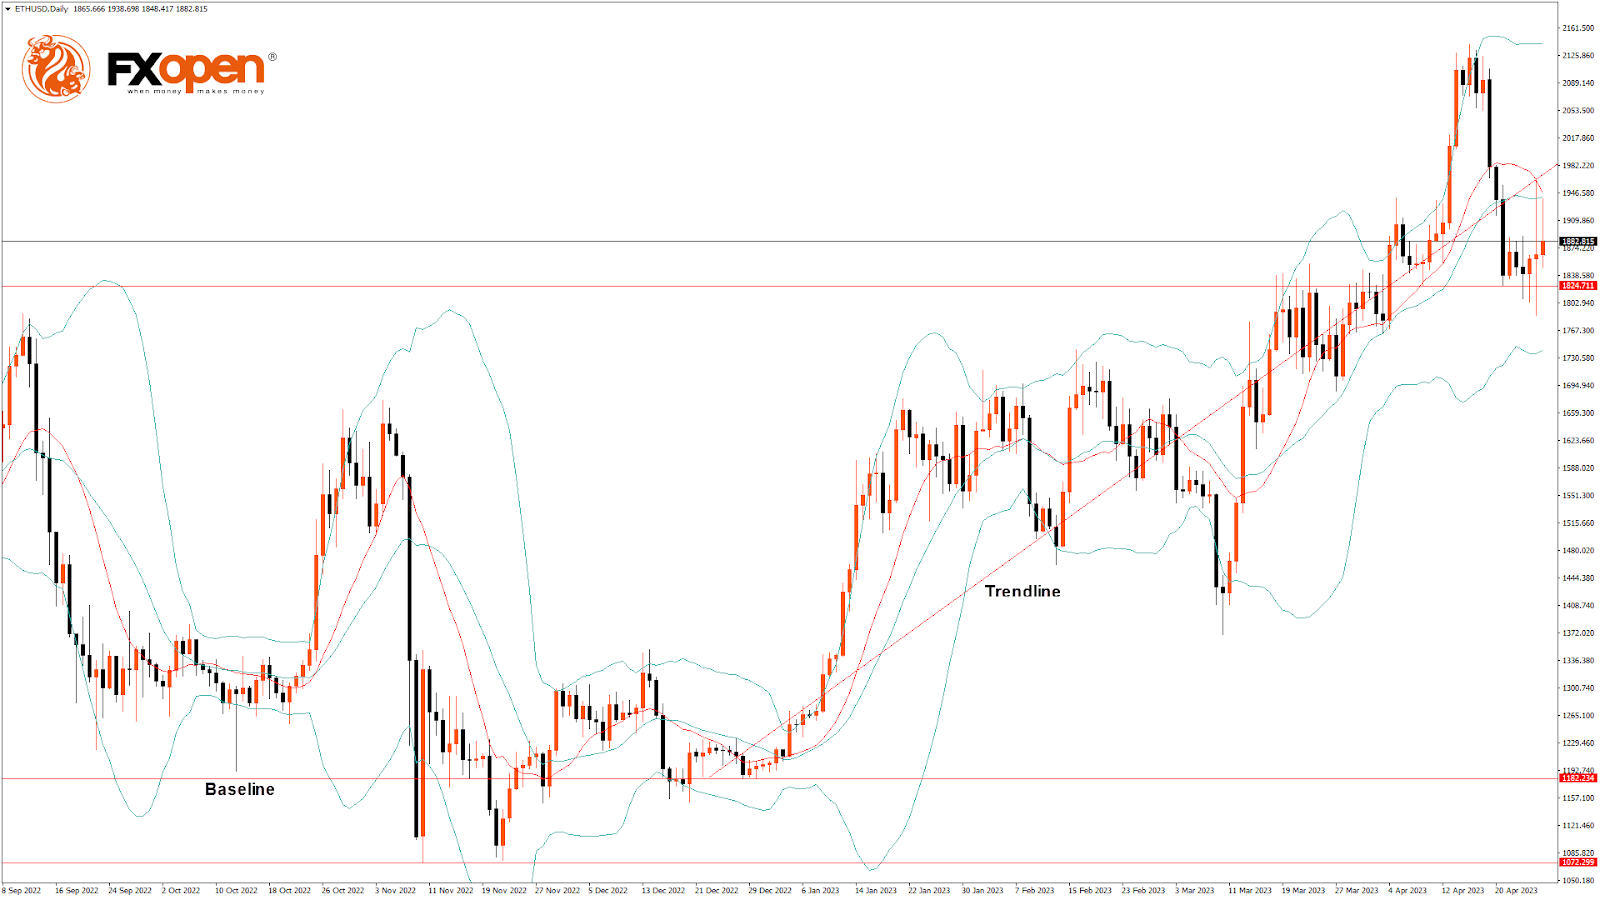
On the daily chart, ETH is trading just above its pivot level of $1,874 and is moving into a mild bullish channel. The price is about to break its classic resistance level of $1,955 and its Fibonacci resistance level of $2,044; supports are $1,808 and $1,845.
The key support levels to watch are $1,845, which is a 38.2% retracement from the 13-week high, and $1,862, which is a 14-3 daily raw stochastic at 20.
The Week Ahead
ETH continues to correct higher above $1,800, which indicates the bullish momentum, and is expected to move towards the $1,900 level in the medium-term range in the H1 timeframe.
We see a short-term bullish trend line forming from $1,786 towards the $1,954 level.
There is a minor bullish trend line with the resistance at $1,971, which is a 38.2% retracement from a 4-week high.
The immediate short-term outlook for ETH has turned mildly bullish, the medium-term outlook has turned bullish, and the long-term outlook is neutral in present market conditions.
The resistance zone is at $2,034, which is a 14-3 day raw stochastic at 70, and at $2,106, at which the price crosses the 9-day moving average.
The weekly outlook is $2,000 with a consolidation zone of $1,900.
BTCUSD Spikes Upwards after Hitting 50-day SMA
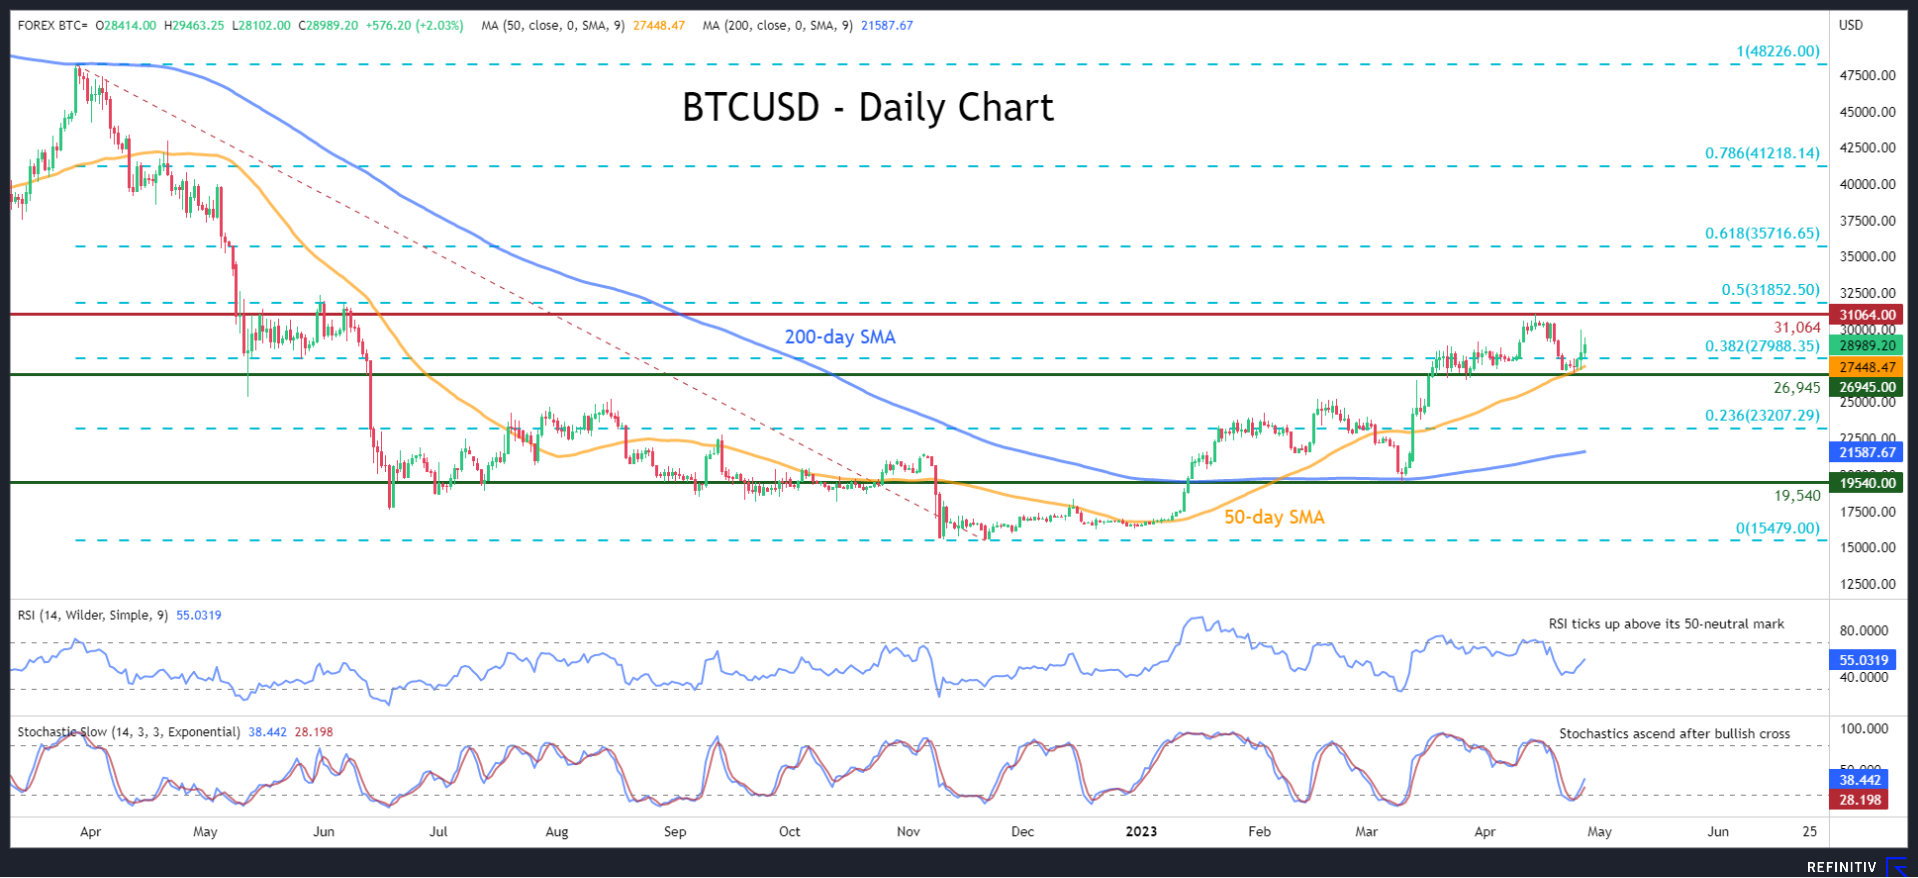
BTCUSD (Bitcoin) experienced a pullback after its 2023 surge peaked at the 10-month high of 31,064 in mid-April. However, the price has bounced back again after the 50-day simple moving average (SMA) curbed its retreat.
The momentum indicators currently suggest that buyers have re-gained the upper hand. Specifically, the RSI is pointing upwards above its 50-neutral mark, while the stochastic oscillator is ascending after posting a bullish cross in the 20-oversold zone.
Should the recent advance extend above the 30,000 psychological mark, the 10-month peak of 31,064 could be the first barrier for the bulls to clear. Surpassing that zone, the price may challenge 31,852, which is the 50.0% Fibonacci retracement of the 48,226-15,479 downtrend. A break above that zone could open the door for the 61.8% Fibo of 35,716.
Alternatively, if the price reverses lower again, the 38.2% Fibo of 27,988 might act as the first line of defence. Should that floor collapse, the bears could aim for the April low of 26,945. Failing to halt there, Bitcoin could descend towards the 23.6% Fibo of 23,207.
In brief, despite the recent downside correction from its multi-month high, Bitcoin has regained some ground after finding strong support at the 50-day SMA. For the technical picture to improve even further, the price must initially jump above the 30,000 psychological region before it posts a fresh higher high.
Bitcoin Hits the Resistance But Does Not Give Up
Market Picture
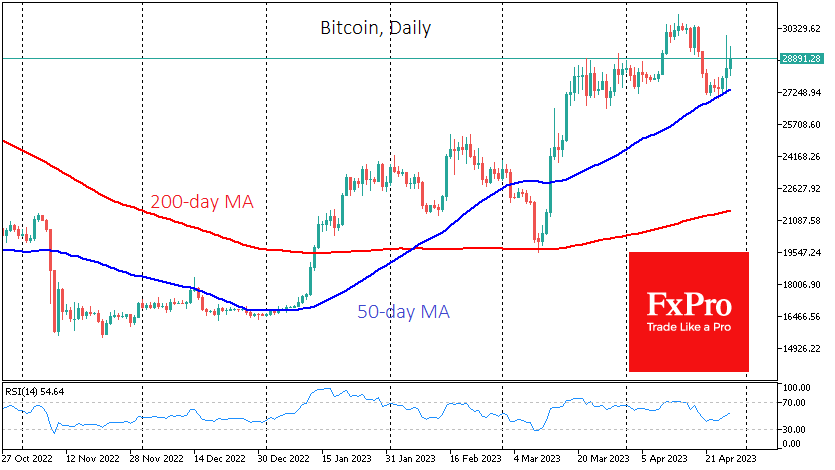
Bitcoin’s rally accelerated late Wednesday after hitting $29K but ran into strong resistance as it approached $30K (the level passed on some exchanges). The inability to break above this level triggered a massive wave of capitulation. It quickly, but not for long, pushed the price back to $27K, the price at the start of the week. By Thursday morning, buying prevailed again, returning the price to $29K.
On a broader picture, the bulls have managed to push the price above the 50-day moving average, which is pointing up from $27K on Monday to $27.4K. At the end of March, the market bought Bitcoin near this level. In other words, we have strong indications that the first cryptocurrency maintains its uptrend.
Financial news is also helping the buying. The rally comes on the heels of reports of the stock collapse of troubled First Republic Bank, which was bailed out in March. Another bout of capital preservation fears has brought attention back to crypto.
News Background
BitMEX co-founder Arthur Hayes said that with the “broken banking system”, investing in cryptocurrencies would help people protect themselves against the risk of losing money. He says, “Those who believe in traditional finance will inevitably suffer losses”.
Twitter analyst TechDev believes Bitcoin is in the early stages of a parabolic rally as the technical picture now resembles the bull market of 2015 when BTC went from less than $200 to $20,000 in two years.
Cryptocurrencies have evolved from “rebellious instruments” to a mainstream asset class, according to the UK’s Financial Conduct Authority (FCA). However, the agency expressed concern that organised crime could use crypto.
The CFTC intends to go to Congress with a proposal to remove the anonymity of crypto-assets and introduce digital identification of owners, said Commissioner Christy Goldsmith Romero.
WTI Oil: Bears to Pause for Consolidation after a Heavy Losses
Bears are taking a breather in early Thursday’s trading after a strong fall in past two days (down 5.5%), as oil prices were deflated by growing fears of US recession and strong rise in Russian oil exports, which hit the highest since 2019.
Russia increased production to meet strong rise in demand from India and China which offset the impact from the recent surprise decision of OPED+ group to further cut the output.
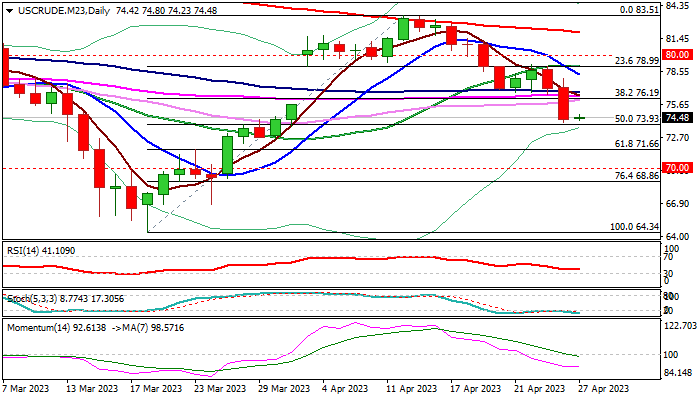
Oli price came under increased pressure after loss of pivotal supports at $80 and $79.00, with fresh acceleration lower, turning technical studies on daily chart to bearish setup and adding to negative near-term outlook.
Bears found a temporary footstep at $73.93 Fibo support (50% retracement of $64.34/$83.51 rally) and ahead of the top of thick daily cloud at $73.49, with oversold conditions suggesting a pause in the latest bear-leg from $79.15 (Apr 24 lower top).
With fundamentals remaining negative for oil, technical buying on partial profit-taking, may keep bears on hold for consolidation / mild correction.
Solid barriers at $76.19/73 (broken Fibo 38.2% / 100DMA) should ideally cap, with stronger upticks not to exceed falling 10DMA ($78.29) to keep bears in play.
Fresh bears also filled the gap of Apr 3, adding to negative signals, although firm break of $73.93 level is needed to confirm the signal and open way for attack at next targets at $71.66 (Fibo 61.8% of $64.34/$83.51) and $70.00 (psychological).
The WTI contract is also on track for the second consecutive weekly loss, which contributes to negative near-term structure.
Res: 74.80; 75.69; 76.19; 76.73.
Sup: 73.93; 73.49; 72.18; 71.66.
XAU/USD: Gold Probes Through $2000 Barrier as Uncertainty Boosts Safe-haven Demand
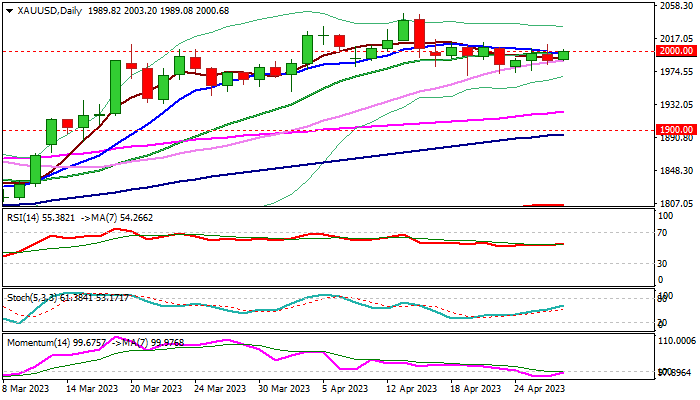
Gold remains constructive and probing again through $2000 level on Thursday, lifted by fresh risk aversion on renewed US banking system stress.
Fresh action by the US House of Representatives to raise the government’s $31.4 trillion debt ceiling, aims to help banking sector, as government is so far unlikely to intervene in rescue of First Republic Bank, which was the latest addition to the list of the US banks in troubles.
Growing uncertainty sparked risk aversion and boosted demand for safe-haven gold, brightening its near-term outlook.
Sustained break above $2000 barrier (psychological / Fibo 38.2% of $2048/$1969) after repeated failures in past two days, would generate fresh bullish signal and make renewed bulls more comfortable, as daily studies are still mixed (north-heading 14-d momentum is still in the negative territory).
This will open way for extension a gradual ascend in past four days towards pivotal barriers at $2015/18 (lower platform / Fibo 61.8%) break of which would signal an end of corrective phase ($2048/$1969) and unmask key resistances at $2032/48 (Apr 5/13 tops).
Caution on repeated failure to clearly break $2000 barrier which would still keep the downside vulnerable.
Res: 2009; 2015; 2018; 2032.
Sup: 1988; 1983; 1976; 1969.
AUD/USD Stems the Bleeding
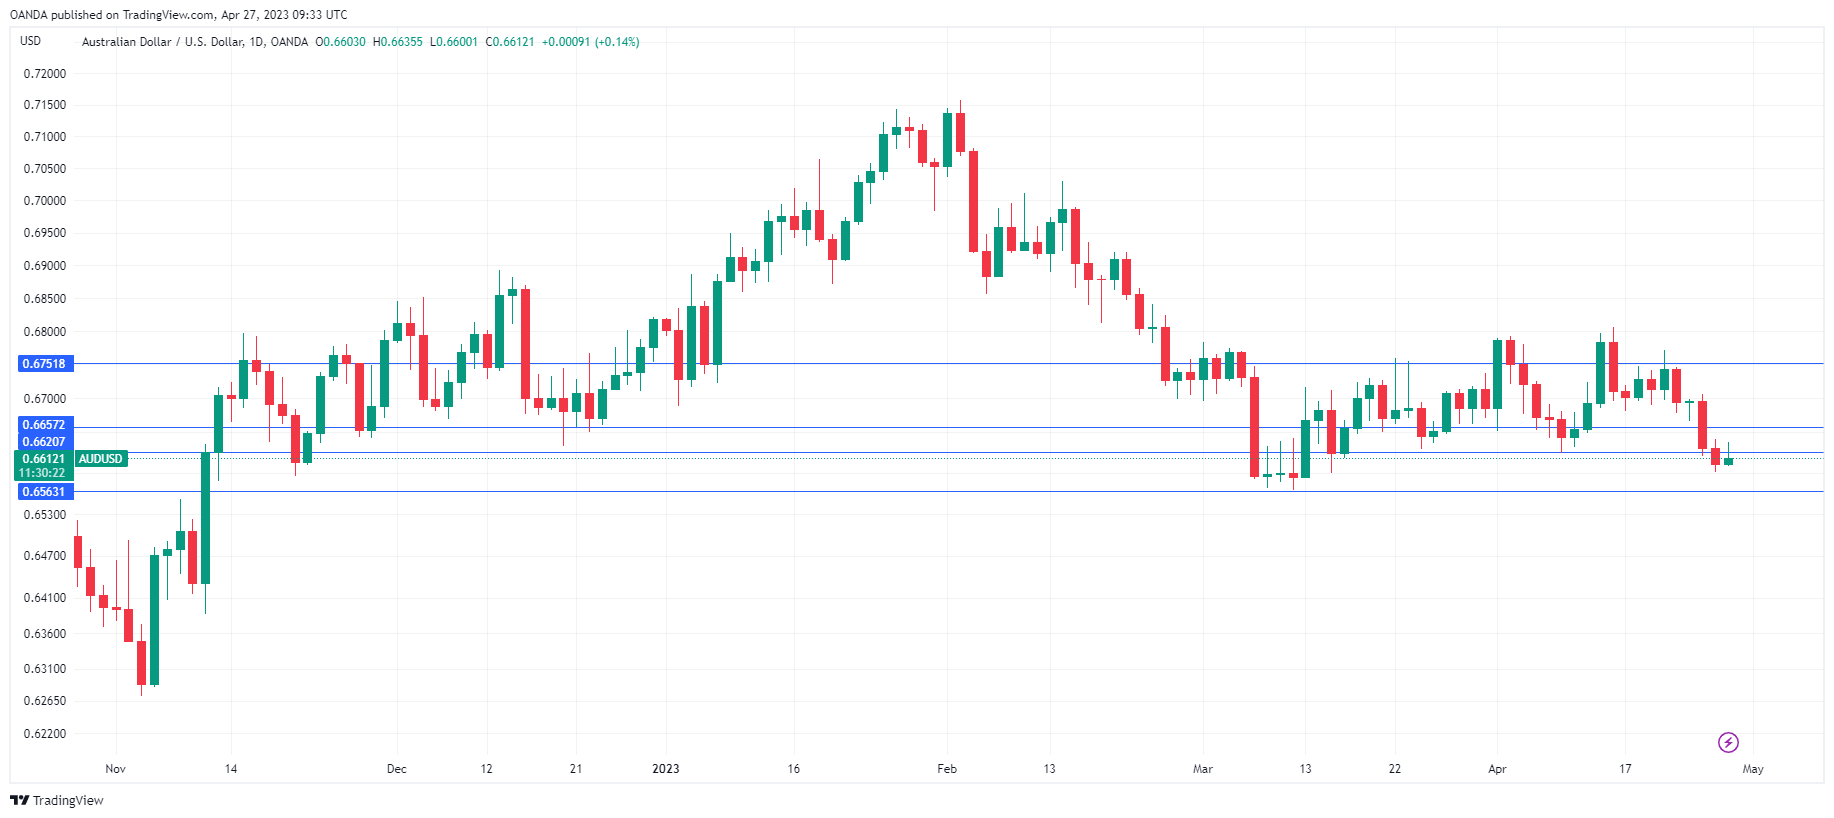
AUD/USD is trading at 0.6606, down 0.31%. Earlier, AUD/USD fell to a low of 0.6595, its lowest level since March 15th.
Australian inflation heads south
Australia’s inflation levels have been falling and the downward trend continued in the first quarter. The headline figure slowed to 7.0%, down from 7.8% in Q4 and a notch above the market consensus of 6.9%. On a quarterly basis, headline CPI from 1.9% to 1.3%, versus the market consensus of 1.4%. The monthly CPI for March fell from 6.8% to 6.1%, below the estimate of 6.6%.
Core CPI, which is considered a more reliable gauge of inflation trends, headed lower and beat the estimates, falling from 6.9% to 6.6% y/y (7.2% est.). On a quarterly basis, core CPI dropped to 1.2%, down from 1.7% and below the estimate of 1.4%.
The key takeaway from these positive numbers is that they appear to have cemented another rate pause at the May 2nd meeting. The odds of a pause have risen from 83% prior to the inflation report to 100% at present. It looks safe to say that inflation has peaked, although the cautious RBA is unlikely to use the “P” word just yet. At the same time, it is premature to declare victory in the inflation battle, with headline inflation and the core rate running more than three times the RBA’s target band of 2-3%. Despite the market’s confidence in another pause, some economists feel that the RBA remains concerned that the high core rate could fuel a price wage spiral if it doesn’t tighten further.
First Republic’s shares sink
AUD/USD is also under pressure as the banking crisis is back in the headlines. First Republic Bank shares fell by 50% after the Bank’s earnings report showed that deposits plunged by 40% in the first quarter. Risk sentiment has fallen as First Republic’s future very survival is at stake, and if banking jitters worsen, the US dollar could continue to climb higher.
AUD/USD Technical
- AUD/USD tested resistance at 0.6620 earlier today. The next resistance line is 0.6714
- 0.6572 and 0.6459 are providing support
USD/JPY – Yen Eyes Tokyo CPI, US GDP
- Tokyo Core CPI expected to remain unchanged at 3.2%
- US to release unemployment claims and GDP
- BoJ’s 2-day meeting begins today
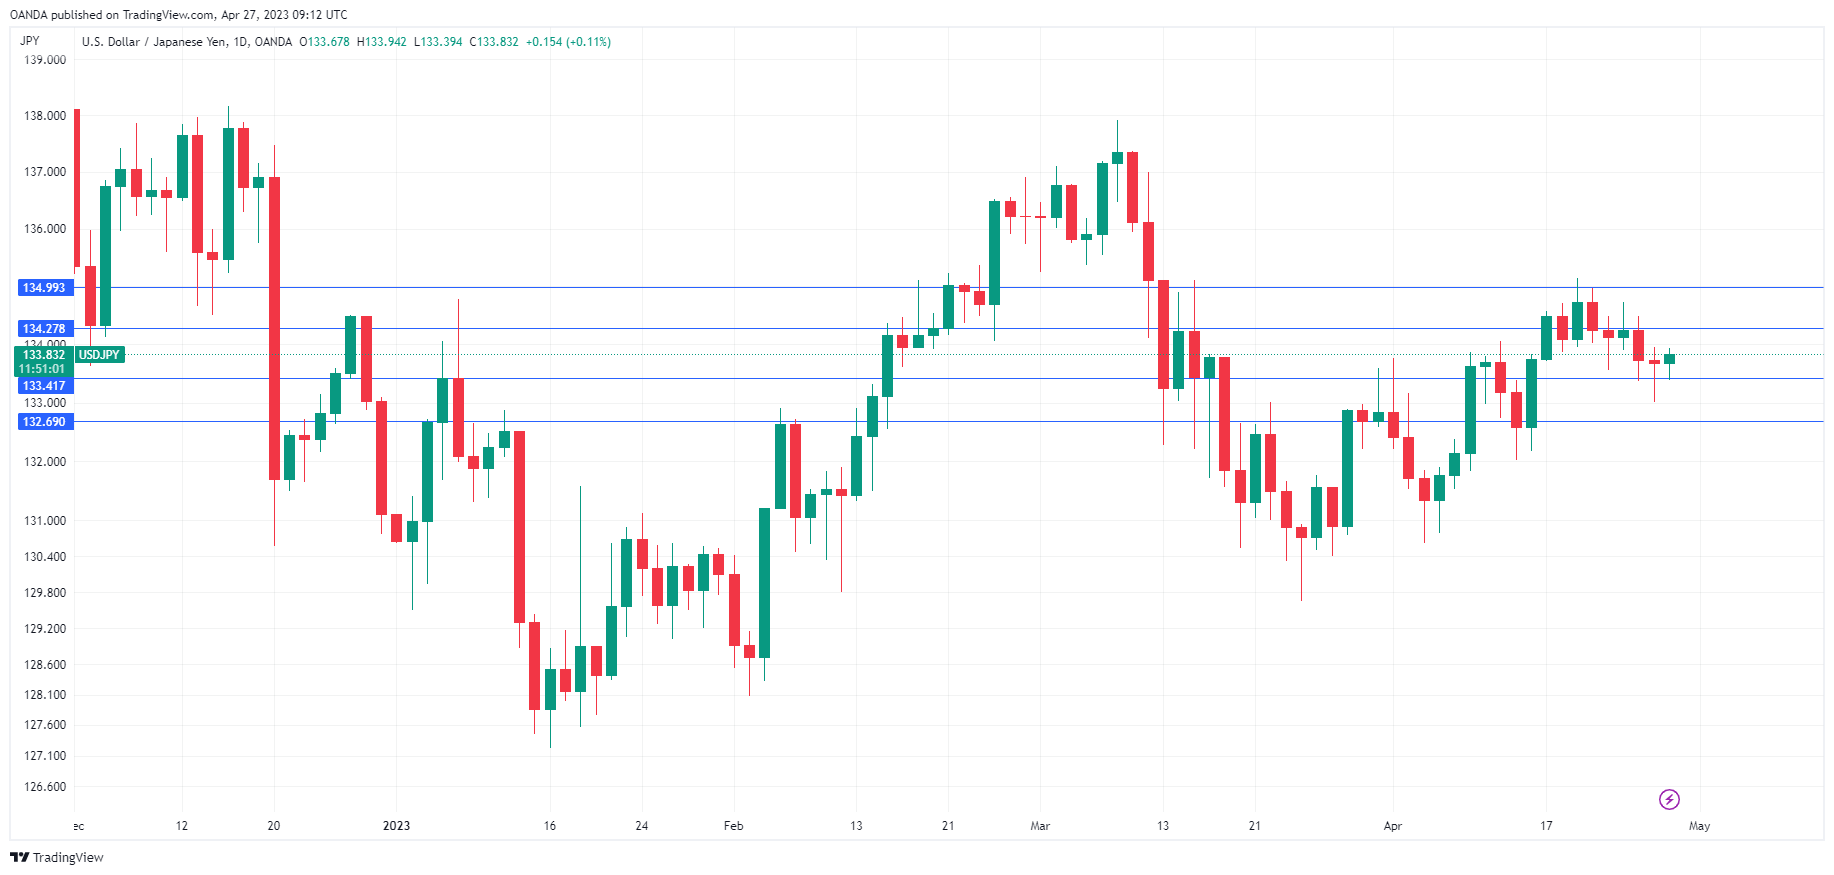
USD/JPY is trading quietly at 133.84, up 0.13% on the day. The yen’s lack of movement could change today with a host of key releases. Japan will release Tokyo Core CPI, while the US publishes Preliminary GDP for the first quarter and unemployment claims. Japan releases Tokyo Core CPI for April early on Friday, which is expected to remain steady at 3.2%.
Will BoJ meeting bring more of the same?
Japan’s inflation is running around 3%, a dream for most central banks but a headache for the Bank of Japan. There has been pressure on the BoJ to tighten policy as inflation remains above the target of 2%. Japan has experienced decades of deflation and the massive stimulus programme was meant to stimulate the economy. Inflation has moved higher, but former BoJ Governor Kuroda insisted that the central bank would not consider tightening until it was convinced that inflation was sustainable, which required stronger wage growth.
New BoJ Governor Ueda has toed the party line so far, but left open the possibility of tightening if wage growth and inflation climb faster than expected. All signs point to the BoJ maintaining its policy settings when it wraps up its 2-day meeting on Friday, but the central bank has surprised the markets in a big way before, and the markets will be following the meeting closely.
In the US, unemployment claims have moved higher for four straight weeks and come in above the estimate each time. The upward trend is expected to continue, with claims expected to rise to 248,000, up from 245,000. The labor market remains strong, but the upswing could signal cracks in what has been a robust US labour market. Preliminary GDP for the fourth quarter is expected to drop to 2.0% y/y, down from 2.6% in Q4.
USD/JPY Technical
- USD/JPY tested support at 133.41 earlier in the day. The next support line is 132.69
- 134.27 and 134.99 are the next resistance lines
Eurozone economic sentiment up slightly to 99.3, third month of sideways movement
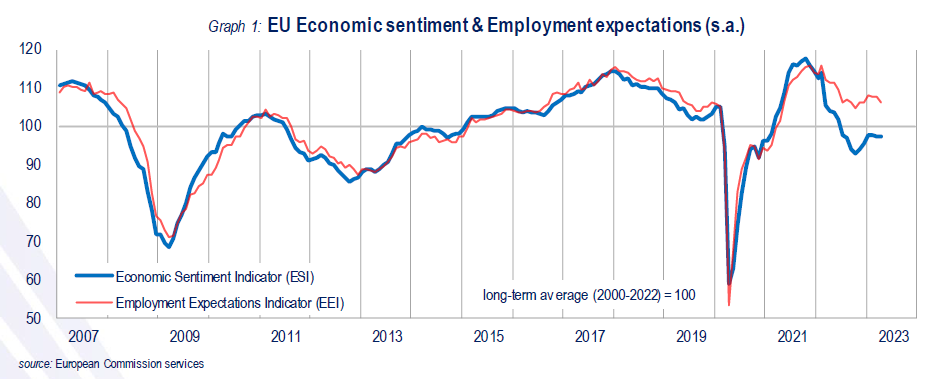
Eurozone Economic Sentiment Indicator ticked up from 99.2 to 99.3 in April, below expectation of 99.9. This is the third month of a general sideways movement of the indicator. Industry confidence dropped from -0.5 to -2.6. Services confidence rose from 9.6 to 10.5. Consumer confidence rose from -19.1 to -17.5. Retail trade confidence rose from -1.5 to -1.0. Construction confidence was unchanged at 1.0. Employment Expectation Indicator dropped from 108.9 to 107.4. Economic Uncertainty Indicator dropped from 22.4 to 22.2.
EU ESI was unchanged at 97.3. Employment Expectation Indicator dropped from 107.5 to 106.1. Economic Uncertainty Indicator dropped from 22.1 to 21.8. Amongst the largest EU economies, the ESI improved in Spain (+3.7) and, to a lesser extent, in Poland (+1.1) and Germany (+0.8). While sentiment edged up also in Italy (+0.3), it deteriorated in the Netherlands (-1.6) and, particularly, in France (-4.2).
Gold Has Not Lost Its Glitter
- Conflicting macro news flow has capped gold in a short-term range-bound movement.
- 1-year rolling uptrend of gold versus most major fiat currencies remains intact.
- Lower 10-year US Treasury real yield may provide an impetus for gold bulls.
The recent movement in the price of gold has started to falter from its recent 52-week high of US$2,048 per ounce reached on 13 April 2023. So far, it has staged a pull-back of -3.8% to hit a recent low of US$1,969 and faced a bit of a struggle to trade above $2,010 which is also around its 20-day moving average.
There are a couple of reasons to explain the recent bout of short-term lackluster range-bound movement. Firstly, the current pull-back in gold from its US$2,048 recent high has taken shape right below the prior significant all-time high peaks of US$2,075 (7 Aug 2020) and US$2,070 (8 Mar 2022) which translates to lingering fear in the mindset of market participants that a failed third attempt to break above its prior significant peaks may lead to a potential major downside reversal for gold.
Secondly, conflicting macro news flow; the positive narratives that support bullish bias on gold such as heightened geopolitical risks that arise from the economic realm (US-China High Tech War, ramped-up discussions on de-dollarization and deglobalization) and ongoing territorial disputes between Russia and Ukraine plus more recent frequent “outbursts exchanges” between US and China officials on the status of Taiwan’s sovereignty.
On the flip side, the negative narrative will be a switch of demand from safe-haven assets such as gold to risk-on assets when the dovish Fed pivot materializes to kickstart a fresh interest rate cut cycle as soon as July based on expectations from interest rates futures.
Aside from these conflicting factors, other insightful elements are worth highlighting that may impact the prices of gold in the short to medium term.
Gold has continued to trend higher against most fiat currencies & XAU/USD plays a catch-up
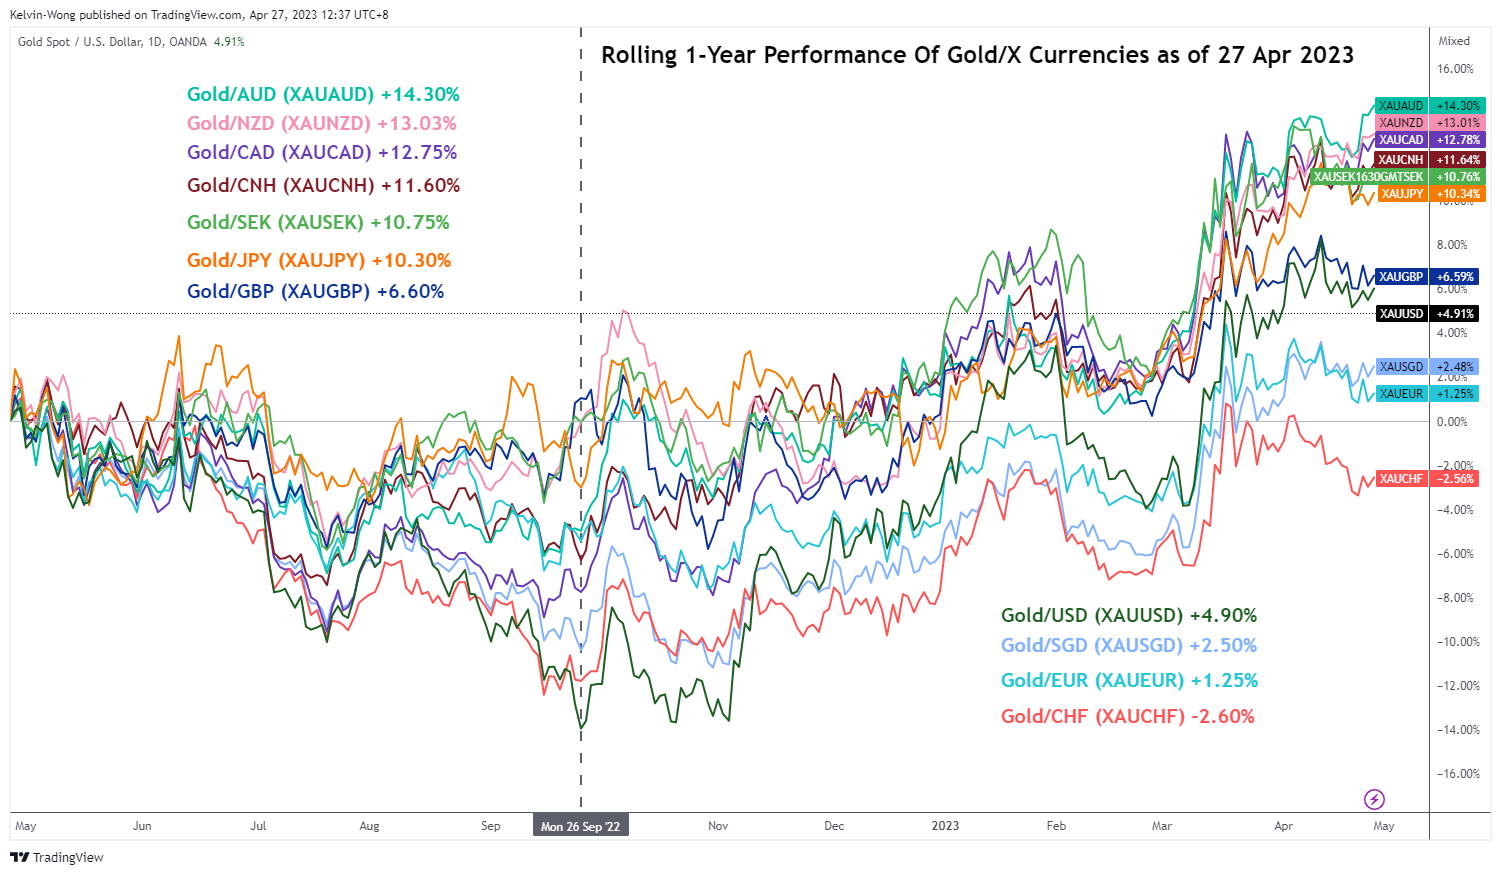
Fig 1: Gold vs. fiat currencies 1-year rolling performances as of 27 Apr 2023 (Source: TradingView, click to enlarge chart)
The performance of gold against other currencies such as JPY, AUD, CAD, NZD, and SEK) has led other XAU pairs and trended higher since the end of September 2022. Interestingly, one of the laggards, gold against USD (XAU/USD) has started to play catch-up since early March 2023 and recorded a rolling 1-year gain of +4.90% as of 27 April 2023.
If one has a staunch belief in the principle of “trend-following”, follow the major trend as they will advocate.
A further fall in US 10-year Treasury real yield may have a positive impact on gold
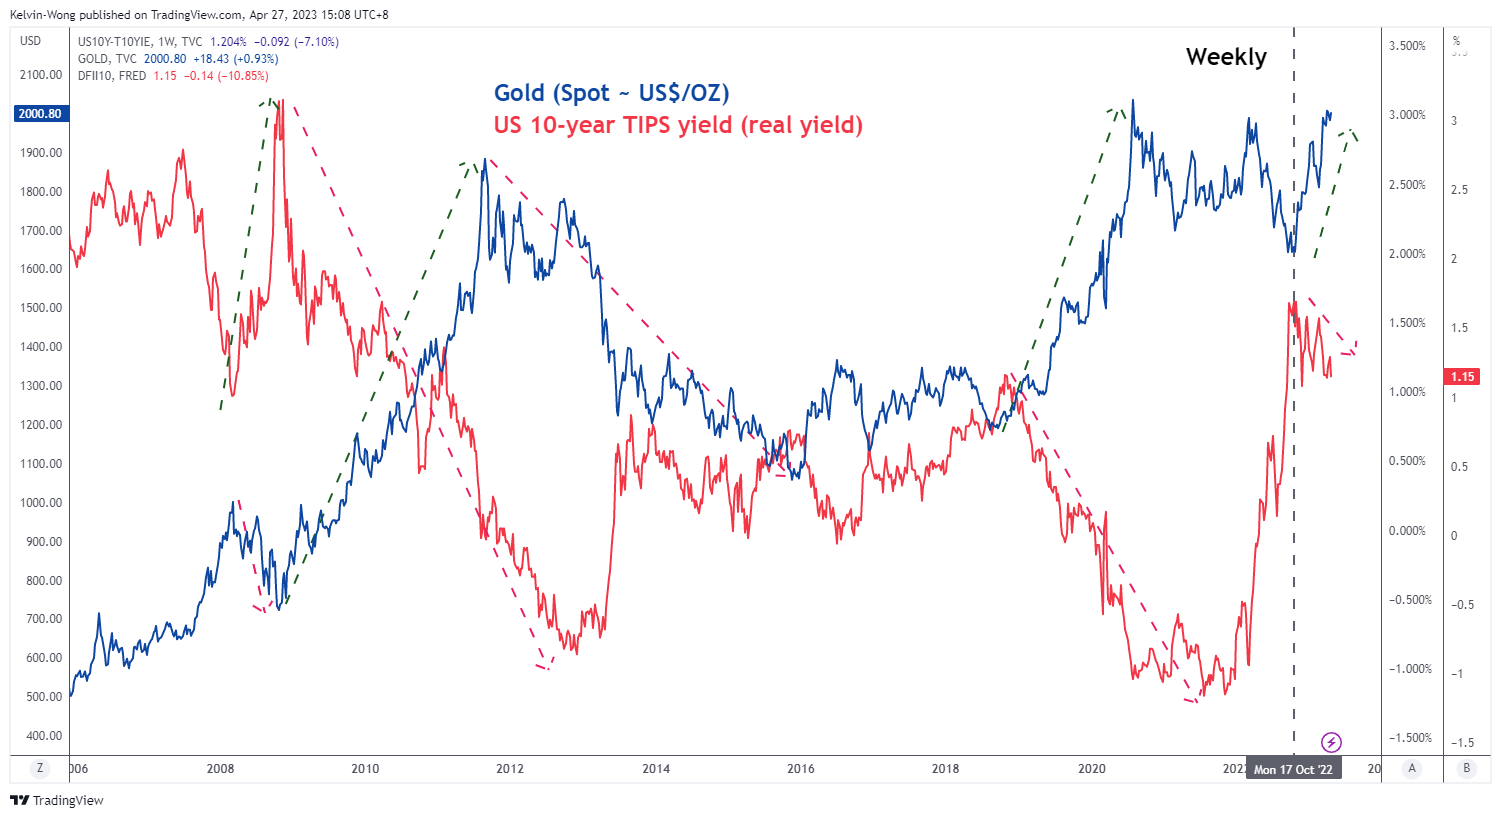
Fig 2: Correlation between Gold & US 10-YR Treasury real yield as of 27 Apr 2023 (Source: TradingView, click to enlarge chart)
Gold is a zero-yield asset as it does not generate recurring streams of cash inflows such as dividends and coupon payments from investing in equities and bonds respectively. Hence, if one establishes a long position in gold and held for some time, there will be opportunity costs incurred such as interest income forgone on coupon payments if invested in bonds. Hence, a higher bond yield translates to a higher opportunity cost for holding gold.
Based on a general correlation analysis since 2007 on the movement of a longer-term 10-year US Treasury real yield (excluding inflation effects) derived from the market price of the 10-year US Treasury inflation-protected securities with the price of spot gold (US$ per ounce), it has shown that prior significant up moves in gold have coincided with declines in the 10-year US Treasury real yield and vice versa when the real yield rallied.
Since Oct 2022, the 10-year US Treasury real yield has continued to inch lower and traced out a series of “lower highs” which in turn may support a further potential up move in gold.
Gold (XAU/USD) Technical Analysis – major uptrend intact, eyeing a retest at 2,075 all-time high
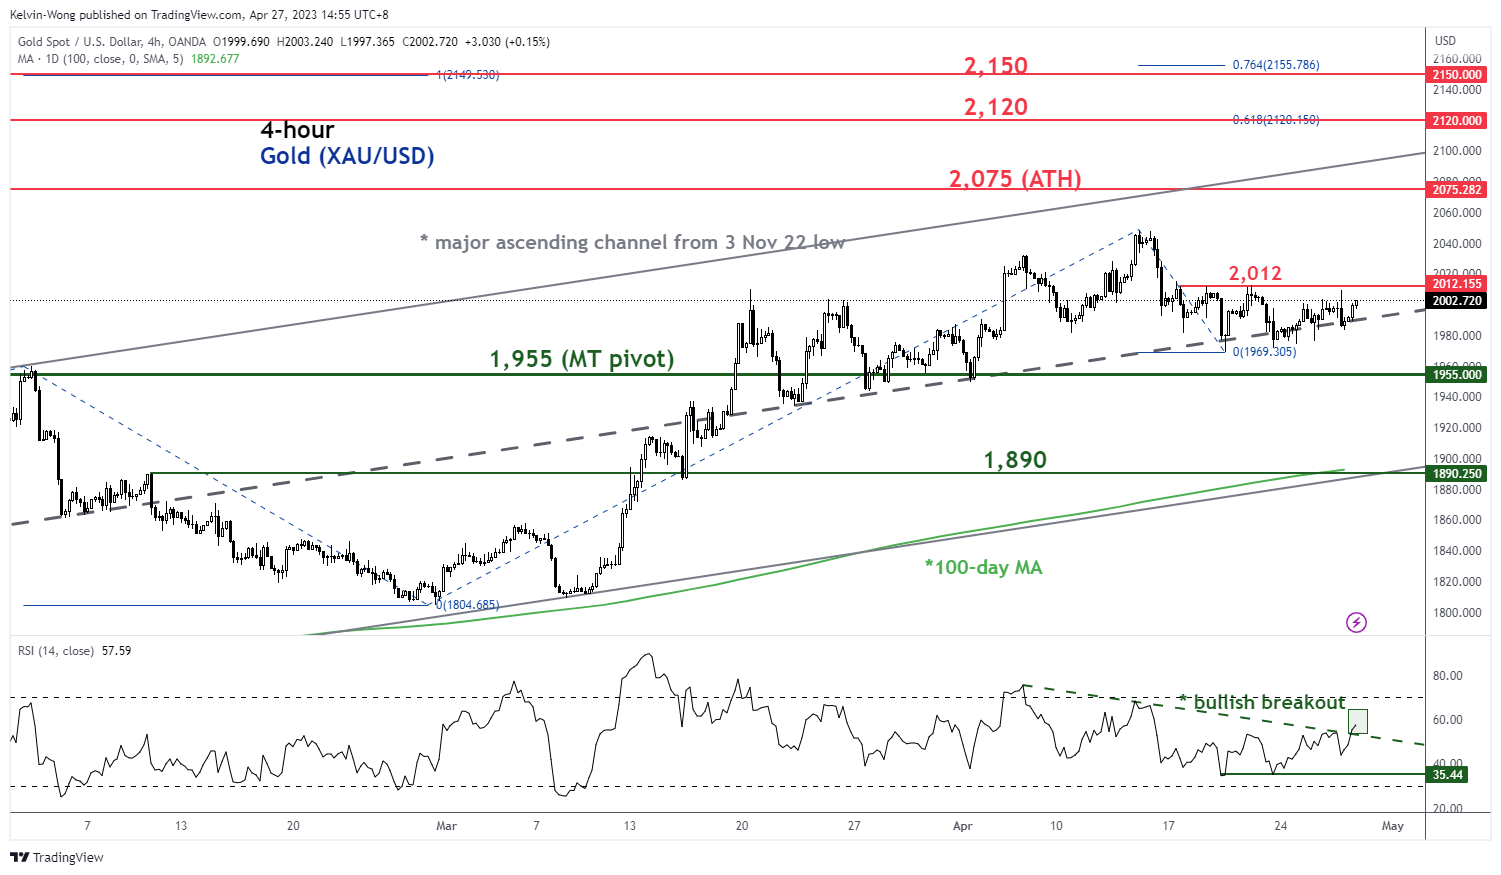
Fig 3: Gold (XAU/USD) trend as of 27 Apr 2023 (Source: TradingView, click to enlarge chart)
The recent -3.9% pull-back in gold (XAU/USD) from its 13 April 2023 high of 2,048 has managed to stall at the median line of the major ascending channel in place since the 3 November 2022 low.
The 4-hour RSI oscillator has just managed to stage a bullish breakout from its former corresponding descending resistance at the 55% level and has yet to reach its overbought region of above 70% which suggests a potential revival of short to medium-term upside momentum.
If the 1,955 key medium-term pivotal support holds and a break above the 2,012 intermediate resistance, XAU/USD may see a retest on its current all-time level of 2,075 printed on 7 August 2020. A clearance above 2,075 sees the next resistance coming in at 2,120 (upper boundary of the ascending channel & a key Fibonacci expansion level).
However, a break with a 4-hour close below 1,955 negates the bullish tone to expose the next support at 1,890 (100-day moving average & the lower boundary of the ascending channel).