

Sample Category Title
EUR/AUD Daily Outlook
Daily Pivots: (S1) 1.6573; (P) 1.6680; (R1) 1.6824; More...
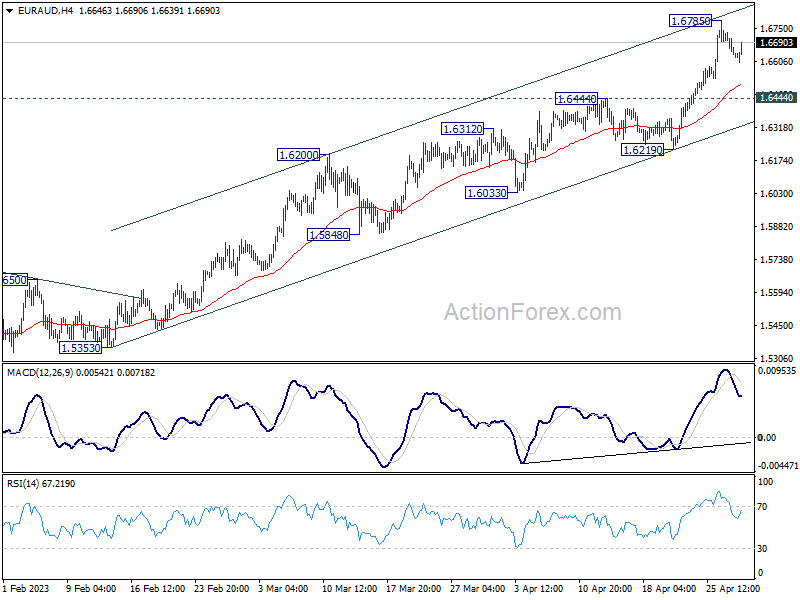
Intraday bias in EUR/AUD remains neutral for consolidation below 1.6785. Downside of retreat should be contained by 1.6444 resistance turned support to bring rally resumption. On the upside, break of 1.6785 will resume larger up trend to 100% projection of 1.4281 to 1.5976 from 1.5254 at 1.6949.
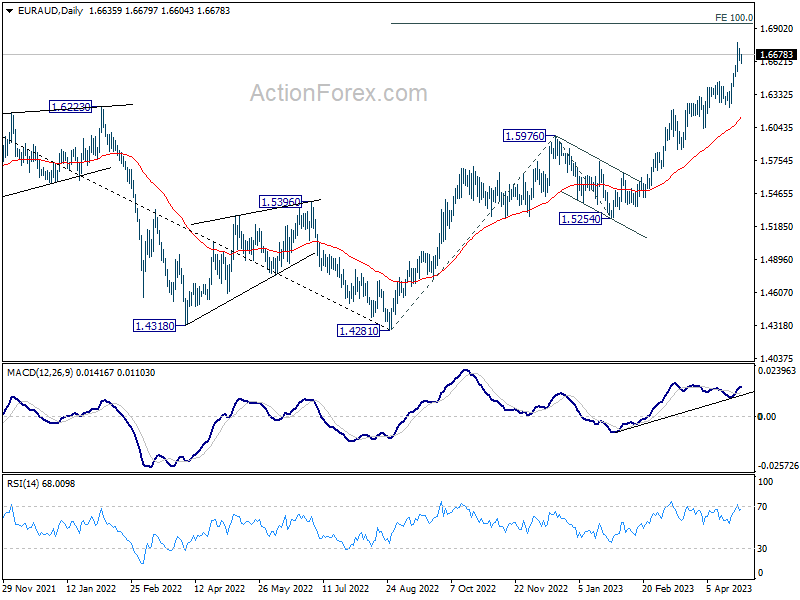
In the bigger picture, the solid break of 1.6389/6434 cluster resistance (38.2% retracement of 1.9799 to 1.4281 at 1.6389) argues that whole down trend from 1.9799 (2020 high) has completed at 1.4281 (2022 low). Further rise should be seen to 61.8% retracement at 1.7691 next. For now, outlook will stay bullish as long as 1.5976 resistance turned support holds, even in case of deep pull back.
EUR/CHF Daily Outlook
Daily Pivots: (S1) 0.9839; (P) 0.9859; (R1) 0.9885; More...
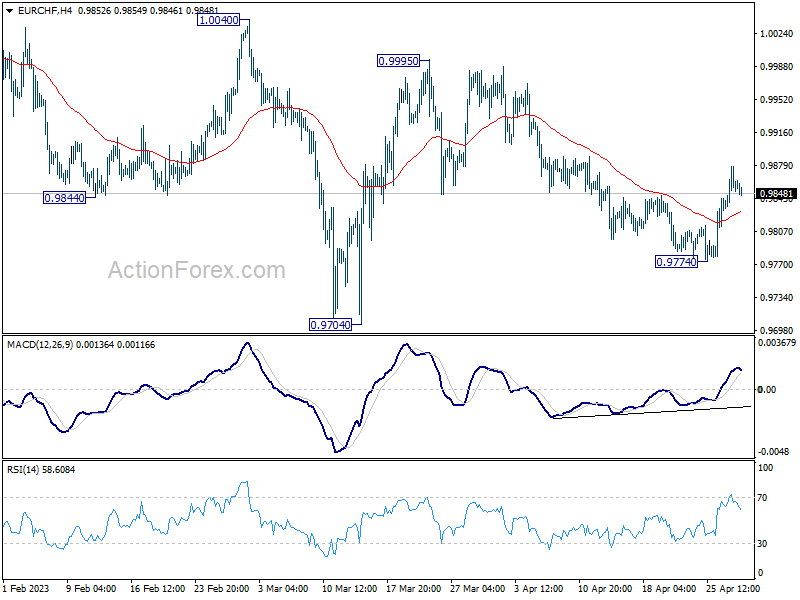
Intraday bias in EUR/CHF stays on the upside at this point. Decline form 0.9995 should have completed at 0.9774 already, well ahead of 0.9704 low. Current development also revives the case that whole correction from 1.0095 has completed at 0.9704. Sustained trading above 55 D EMA (now at 0.9875) will affirm this bullish case, and target 0.9995 resistance next.
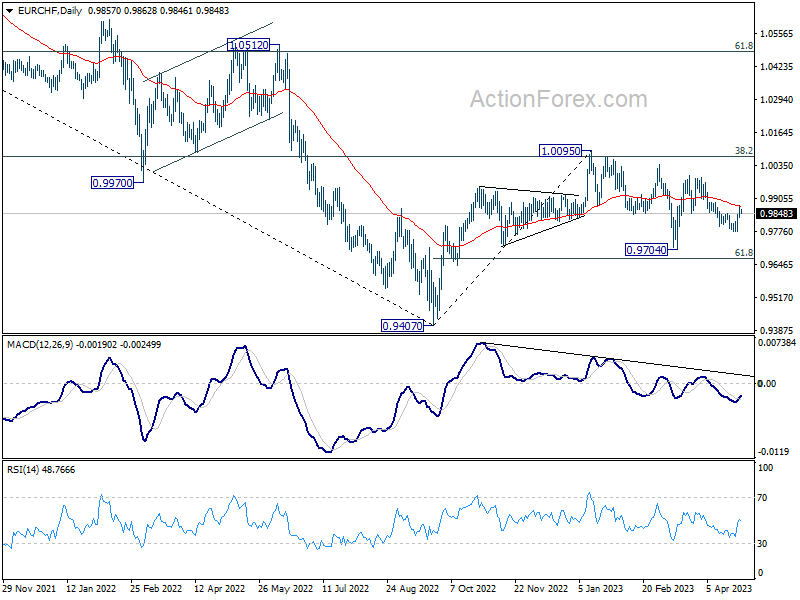
In the bigger picture, prior rejection by 55 W EMA (now at 0.9989) and 38.2% retracement of 1.1149 to 0.9407 at 1.0072 suggests that medium term outlook is staying bearish. That is, down trend from 1.2004 is not completed yet and is in favor to resume through 0.9407 at a later stage. However, decisive break of 1.0095 resistance will raise the chance of bullish trend reversal. Rise from 0.9407 should then target 1.0505 cluster resistance (2020 low at 1.0505, 61.8% retracement of 1.1149 to 0.9407 at 1.1484).
EUR/JPY Daily Outlook
Daily Pivots: (S1) 147.27; (P) 147.63; (R1) 148.11; More....
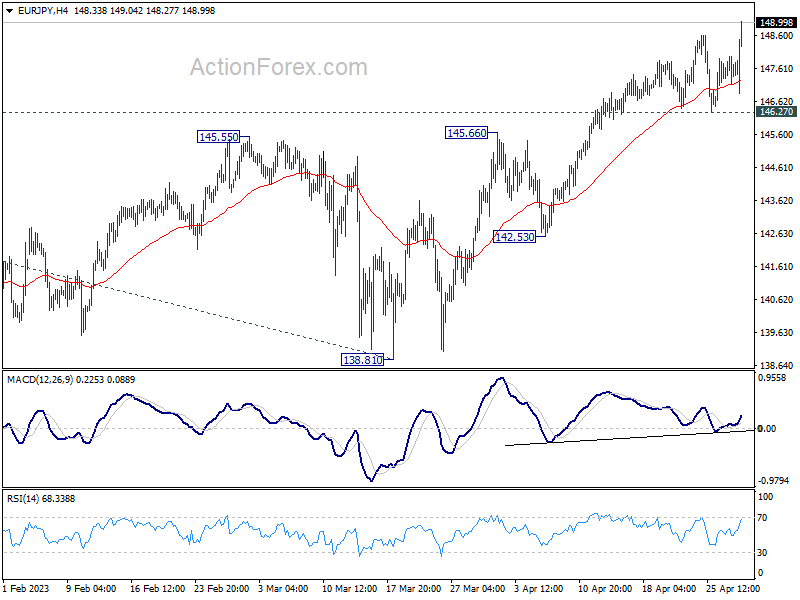
EUR/JPY's rally finally resumes and the break of 148.38 resistance should now confirms resumption of larger up trend. Intraday bias is back on the upside for 149.76 long term resistance next. Break will target 153.64 projection level. Meanwhile, outlook will now stay bullish as long as 146.27 support holds, in case of retreat.
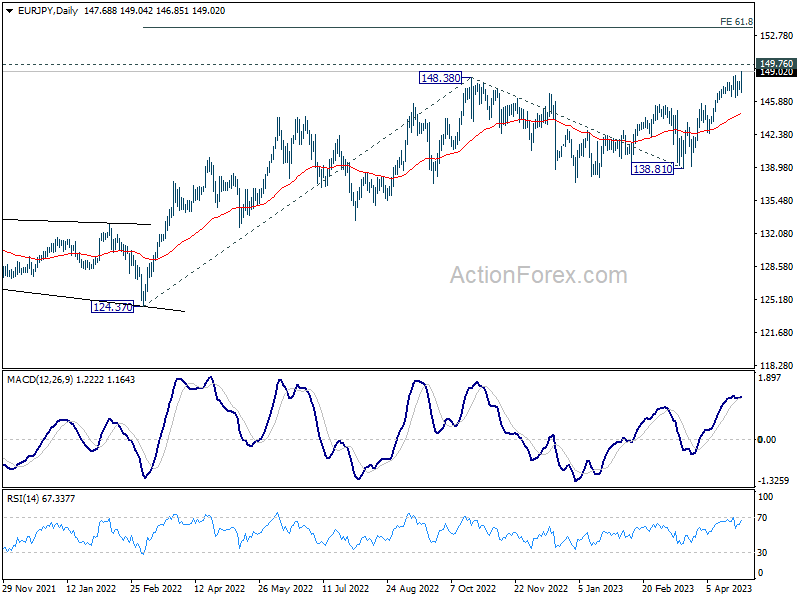
In the bigger picture, as long as 55 W EMA (now at 140.70) holds, larger up trend from 114.42 (2020 low) is still in progress for 149.76 long term resistance (2014 high). Decisive break there will resume long term up trend from 94.11 (2012 low). Next target is 61.8% projection of 124.37 to 148.38 from 138.81 at 153.64. This will remain the favored case as long as 138.81 support holds.
Bank of Japan Left Key Parameters of Policy Unchanged But Changed Forward Guidance
Markets
US Q1 GDP figures came in as somewhat of a shocker for those betting that it will soon be back to lower rates for the Fed after delivering a final 25 bps rate hike next week. For the first time in over a month, markets reacted to underlying dynamics rather than to headline weakness. Quarterly annualized growth of 1.1% came in below consensus (1.9% Q/Qa) but the key consumption component accelerated to a 2-y high of 3.7% Q/Qa. Importantly, there was a very big drag from inventories with business investments being the only real weak point. Core PCE deflators accelerated unexpectedly from 4.4% Q/Q to 4.9% Q/Q, the fastest since Q1 2022. So the data suggest that the US economy remains more resilient, inflation more stubborn and so far signs of the feared credit crunch are absent. In turn, these could result in some hawkish linings in the Fed statement and Powell’s press conference next week which will go against current market positioning (rate cuts later this year). March income and spending data and the Q1 employment cost index are likely the centerpieces at today’s US eco calendar and will be interpreted in a same way as US GDP numbers yesterday. Monthly PCE deflators (March) can be derived after yesterday’s quarterly number with the April Chicago PMI likely to play second fiddle as well.
US Treasuries underperformed German Bunds. US yields closed 4.8 bps (30-yr) to 11.9 bps (2-yr) higher. The US 2-yr and 10-yr yields respectively closed above 4% and 3.5%. Changes on the German curve ranged between +4.2 bps (30-yr) and +6.5 bps (3-yr). US stock markets rallied 1.57% (Dow) to 2.43% (Nasdaq). Yesterday’s data were strong enough to put aside imminent recession fears, but not strong enough to prompt the Fed into an extra rate hike for example in June. The US dollar loved the immediate interest rate response with EUR/USD diving from 1.1050 to 1.10, but the greenback struggled with positive risk sentiment during the US session and with the same dilemma as stocks. For EUR/USD to end the week below 1.10, it will probably need to come via a weaker euro (not our base case). Today’s EMU calendar eyes attractive with Q1 GDP figures, but also national inflation numbers in Germany, France and Spain. Especially the direction of core inflation will be closely watched and could be decisive in tilting the odds (currently 80-20) to either a 25 bps or a 50 bps ECB rate hike next week. We stick with our 50 bps rate hike call on grounds of trends in core and wage inflation, the still relatively low current interest rate level, a resilient economy and tight labour market and backed by several ECB members putting the possibility on the table. Apart from the April EMU CPI number, the ECB’s Q1 credit and lending survey will be released as well next week ahead of Thursday’s policy meeting.
News Headlines
In the first meeting presided by the new Governor Ueda, the Bank of Japan left the key parameters of its policy unchanged but changed its forward guidance. The short-term policy rate remains at -0.1%. The BOJ in its Yield Curve Control policy will continue to buy an unlimited amount of government bonds to keep the 10-y government bond yield at around 0%, with a tolerance band for the yield to deviate by 50 bps plus or minus the target level. In its forward guidance, the BOJ deleted the reference to the impact of Covid 19. It also didn’t repeat that ’it expects short- and long term policy interest rates to remain at their present or lower levels’. The guidance now reads: ‘The bank will continue to maintain stability of financing, mainly for firms, and financial markets, and will not hesitate to add easing measures if necessary’. The BoJ also announced to conduct a broad-perspective review of monetary policy as this policy over the previous 25 year has resulted in various easing measures that have interacted with and influenced with areas of Japan’s economic activity, prices and the financial sector. The BOJ indicates a planned time for the review of around one to one and a half years. The Japanese 10-y government yield dropped from 0.485% to 0.43% after the BOJ policy announcement. The yen weakened with USD/JPY trading near 134.75 rising from the 134 area. Before the announcement of the BOJ policy decision, Tokyo April CPI figures printed again stronger than expected with the headline rising from 3.3% Y/Y to 3.5% Y/Y. Core inflation (ex food and energy) even accelerated from 3.4% to 3.8%. Other data series showed better than expected March retail sales (0.6% M/M and 7.2% Y/Y) and above consensus March production data (0.8% M/M and -0.7% Y/Y).The jobless rate on the other hand rose to 2.8% from 2.6%, but the participation rate also improved from 62.1% to 62.6%.
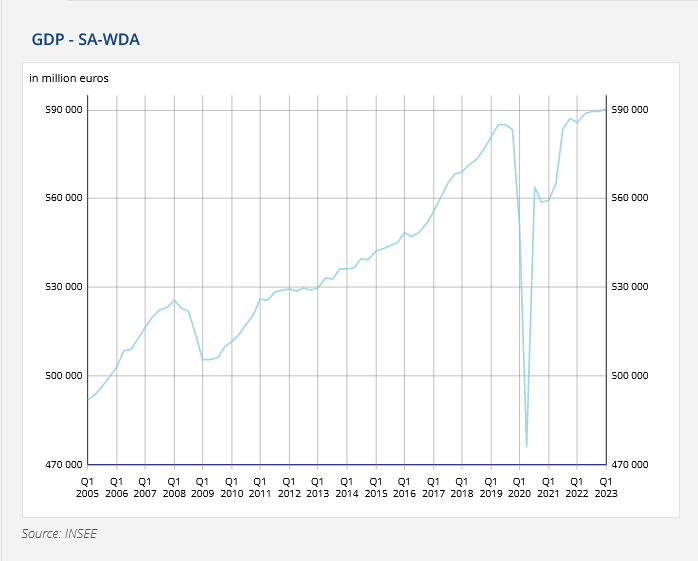
France’s Q1 GDP sees modest growth of 0.2% qoq
France's Q1 GDP growth came in at a modest 0.2% qoq, slightly outperforming market expectations of 0.1% qoq.
Final domestic demand (excluding inventories) contributed negatively to GDP growth, albeit less so than in the previous quarter (-0.1 points in Q1 2023 after -0.4 points). This was due to household consumption stabilizing (0.0% after -1.0%), while gross fixed capital formation (GFCF) experienced a minor decline (-0.2% after 0.0%).
In contrast, foreign trade provided a positive contribution to GDP growth (+0.6 points after +0.2 points). Imports decreased this quarter (-0.6% after +0.1%), while exports remained strong (+1.1% after +0.9%).
Lastly, the contribution of inventory changes to GDP growth was negative this quarter (-0.3 points after +0.2 points in Q4 2022).
BoJ: Maintained Ultra-Easy Policy But Scrapped Forward Guidance
- No change on key policy short-term interest rate and limits of the Yield Curve Control programme.
- Scrapped forward guidance to maintain the interest rate at current or lower levels
- Need one and half-year to conduct a review of monetary policy guidance.
- USD/JPY and Nikkei 225 rallied; watch the 135.30 key short-term resistance on USD/JPY.
The Bank of Japan has maintained its key policy short-term policy interest rate as expected at -0.10% and kept the limits of its Yield Curve Control (YCC) program on the 10-year Japanese Government Bond (JGB) yield unchanged at 0.50% on either side of the 0% target.
Here are a couple of key highlights
BoJ removed forward guidance that pledged to keep key policy interest rates at current or lower levels and highlighted that it will need one to one and half-year to conduct a review of monetary policy guidance.
The latest BoJ quarter outlook report has indicated that the risk to inflation (price) outlook is skewed to the upside in the fiscal year 2023 but skewed to the downside later in the fiscal year 2025, inflationary expectations have moved sideways after heightening, Japan’s economy is likely to recover moderately after under pressure from past rises in raw materials.
In addition, the outlook report has mentioned that wage negotiations for the fiscal year 2023 are expected to see higher wave growth than last year, inflation (price) may deviate downward if wages do not strengthen as expected, mentioned that consumer inflation is likely to slow below 2% toward the middle of the fiscal year 2023 with Japan’s GDP output gap to turn positive around the same period.
New BoJ’s key median economic data forecasts
FY 2023 Core CPI at 1.8% year-on-year versus 1.6% previously
FY 2023 Core-Core CPI at 2.5% year-on-year versus 1.8% previously
FY 2024 Core CPI at 2.0 % year-on-year versus 1.8% previously
FY 2023 Core-Core CPI at 1.7% year-on-year versus 1.6% previously
FY 2023 Real GDP at 1.4% year-on-year versus 1.7% previously
FY 2024 Real GDP at 1.2% year-on-year versus 1.1% previously
In a nutshell, FY 2023 and 2024 inflation forecasts have been upgraded from the previous report while economic growth (real GDP) is being revised down for FY 203.
USD/JPY & Nikkei 225 moved higher ex-post BoJ decision
The USD/JPY has rallied by 1.2% (160 pips) from today’s current intraday low of 133.33 to print an intraday high of 134.94 at this time of the writing; still below a key pivotal resistance of 135.30.
In addition, the benchmark Nikkei 225 recorded an intraday gain of 0.8% to hover at a five-day high of 28,806.
What’s in the mind of BoJ’s new governor Ueda
It seems that Ueda is trying to be a “hedger” to prevent any disruptive movement in the global financial markets that increased cross-assets volatility significantly given that there are several potential risk-off shocks such as the ongoing US debt ceiling partisan squabbles that may lead to failure to extend the debt ceiling this summer’s deadline.
The key point to note is that prior “everlasting” forward guidance of keeping BoJ’s key interest rate at a negative level has been scrapped coupled with projections upgrade on Japan’s inflation (core and core-core) for both FY 2023 and FY 2024 which suggests that Ueda may be laying down the groundwork via baby steps for monetary policy normalization.
Perhaps, a change may come after summer when the US debt ceiling fiasco may be resolved and waiting for more clarity for a pause on the Fed’s current interest rate hiking cycle.
Technical Outlook and Review
DXY:
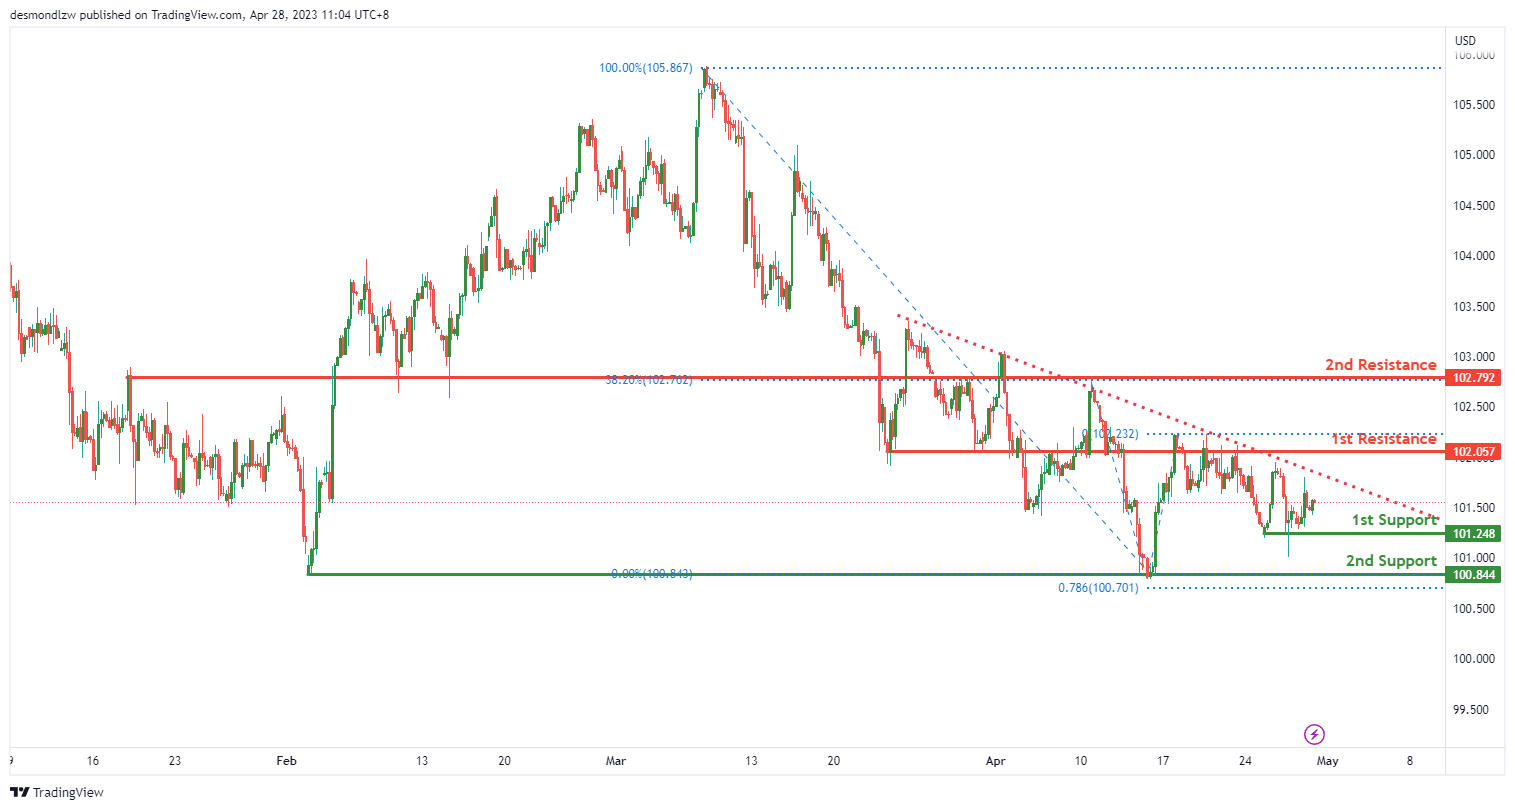
The DXY chart is currently experiencing a bearish momentum. The price is below a major descending trend line, suggesting that bearish momentum is on the cards. Additionally, the price is testing a descending trend line which acts as resistance.
Given the bearish momentum, price could potentially make a bearish continuation towards the 1st support at 101.24. This support level is a multi-swing low support and has previously acted as a strong level of support.
If price were to break the 1st support, the next level of support it could drop to is the 2nd support at 100.84. This support level is also a multi-swing low support and has a 78.60% Fibonacci projection lining up with it, making it an important level to watch.
On the other hand, if the price were to reverse and move upwards, it could encounter the 1st resistance at 102.05. This resistance level is an overlap resistance and could potentially act as a strong level of resistance.
If price were to break the 1st resistance, it could rise further towards the 2nd resistance at 102.79. This resistance level is also an overlap resistance and has a 38.20% Fibonacci retracement lining up with it, making it an important level to watch.
EUR/USD:
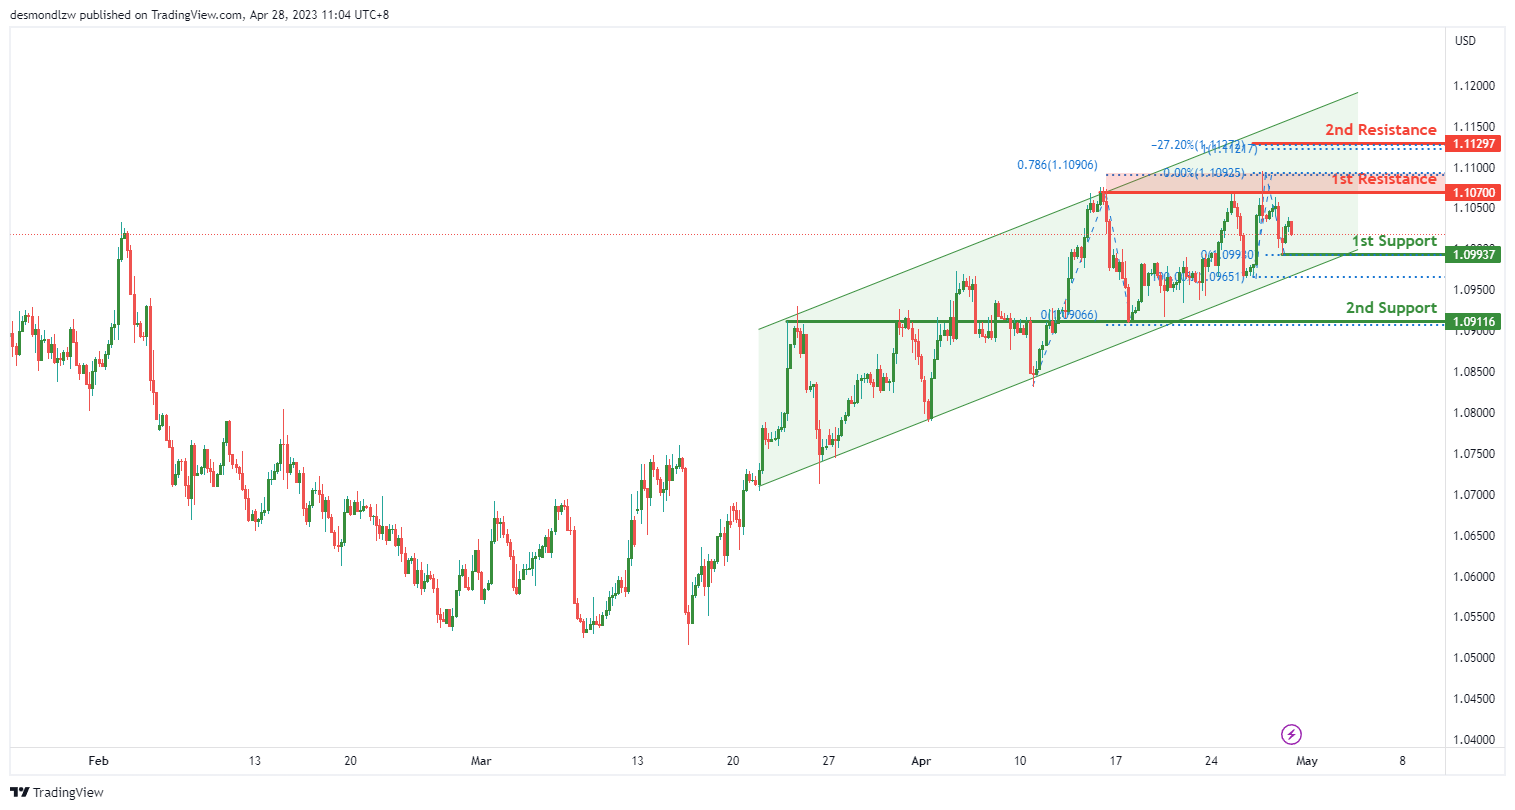
The EUR/USD chart is currently experiencing a bullish momentum. The price is in a bullish ascending channel, which suggests that price might continue to rise because of its bullish momentum.
Given the bullish momentum, price could potentially make a bullish continuation towards the 1st resistance at 1.1070. This resistance level is an overlap resistance and has a 78.60% Fibonacci projection lining up with it, making it an important level to watch.
If the price were to break the 1st resistance, it could rise towards the 2nd resistance at 1.1129. This resistance level has a -27% Fibonacci expansion lining up with it, making it an important level to watch.
On the other hand, if the price were to reverse and move downwards, it could encounter support at the 1st support at 1.0993. This support level is a swing low support and has previously acted as a strong level of support.
If price were to break the 1st support, the next level of support it could drop to is the 2nd support at 1.0911. This support level is also an overlap support, making it an important level to watch.
GBP/USD:
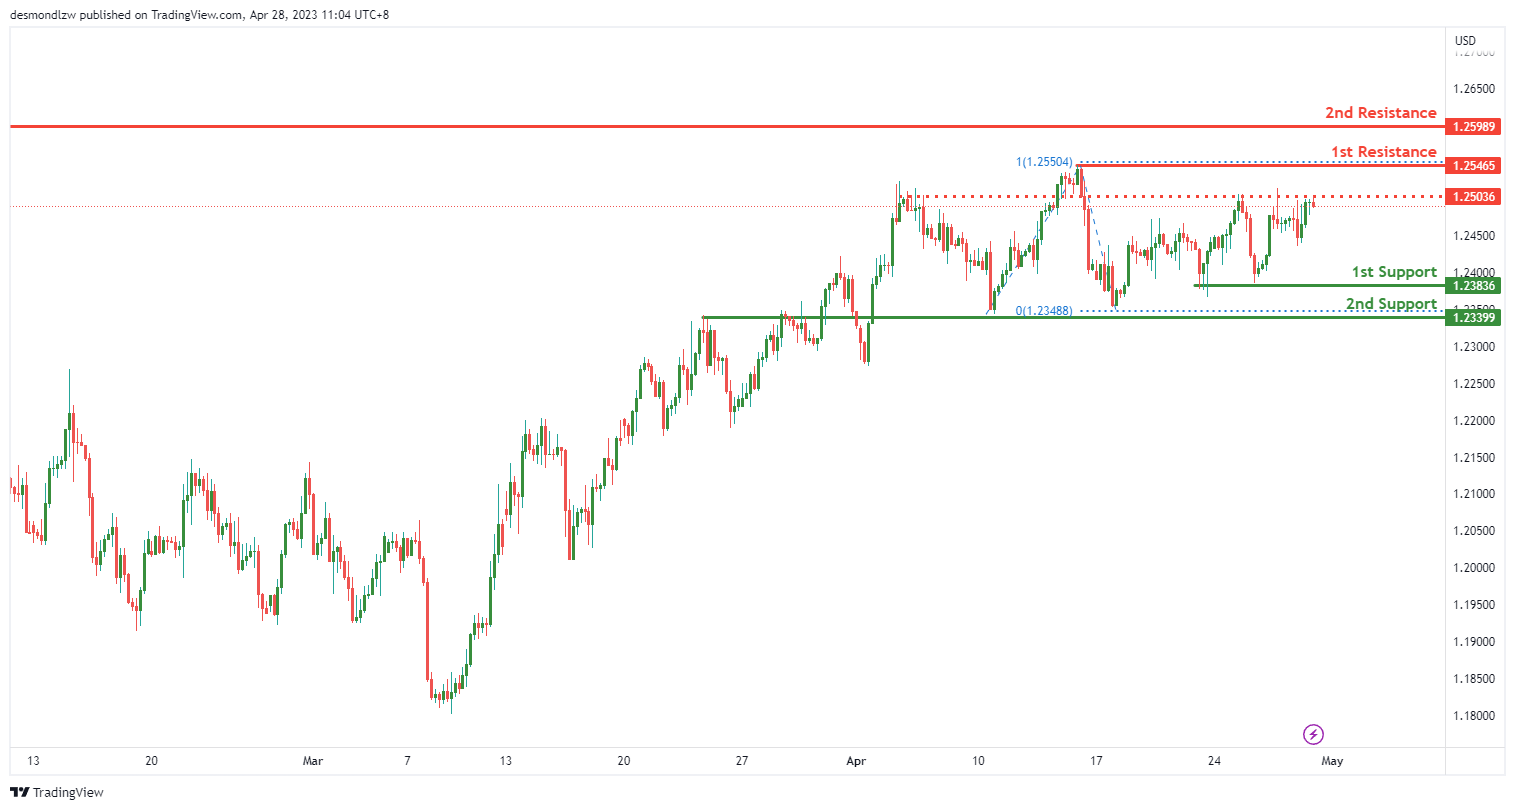
The GBP/USD chart is currently experiencing a bullish momentum. The price is showing signs of strength, and this bullish momentum could potentially lead to a continuation towards the 1st resistance at 1.2546.
If the price were to break the 1st resistance, it could rise further towards the 2nd resistance at 1.2598. This resistance level is a swing high resistance and could potentially act as a strong level of resistance.
On the other hand, if the price were to reverse and move downwards, it could encounter support at the 1st support at 1.2383. This support level is an overlap support and has previously acted as a strong level of support.
If price were to break the 1st support, the next level of support it could drop to is the 2nd support at 1.2339. This support level is also an overlap support, making it an important level to watch.
Additionally, there is an intermediate resistance at 1.2503 between where the price is now and the 1st resistance. If price were to break this intermediate resistance, it could trigger a strong bullish acceleration towards the 1st resistance.
USD/CHF:
The USD/CHF chart is currently experiencing a bearish momentum. The price is below a major descending trend line, suggesting that bearish momentum is on the cards. Additionally, the price is testing a descending trend line which acts as resistance.
Given the bearish momentum, price could potentially make a bearish reaction off the 1st resistance at 0.8960 and drop towards the 1st support at 0.8859. This support level is a multi-swing low support and has previously acted as a strong level of support.
If price were to break the 1st support, the next level of support it could drop to is the 2nd support at 0.8763. This support level is a swing low support and has previously acted as a strong level of support.
On the other hand, if the price were to reverse and move upwards, it could encounter resistance at the 1st resistance at 0.8960. This resistance level is an overlap resistance and could potentially act as a strong level of resistance.
If price were to break the 1st resistance, it could rise towards the 2nd resistance at 0.9006. This resistance level is also an overlap resistance and could potentially act as a strong level of resistance.
USD/JPY:
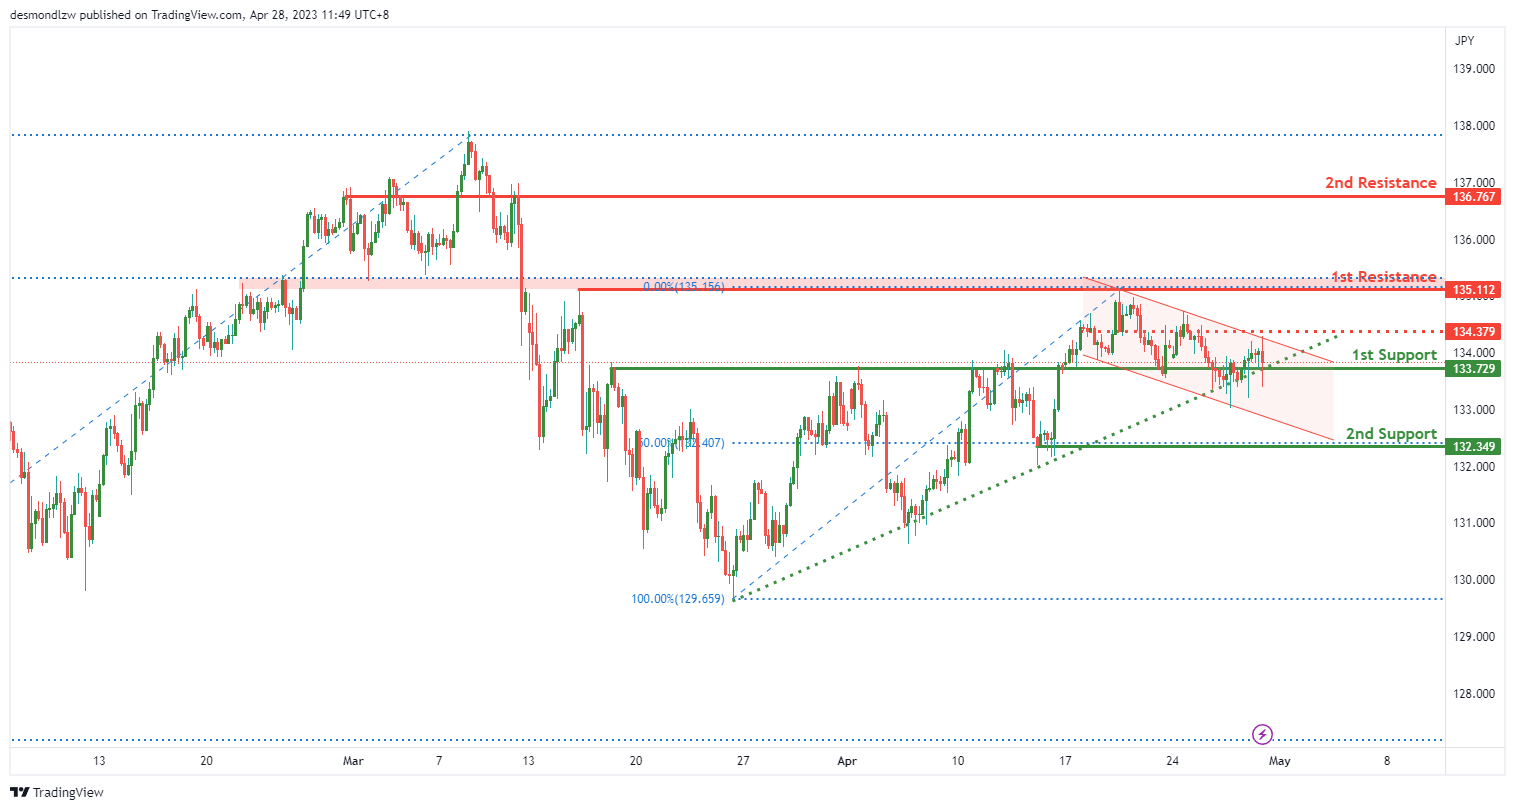
The USD/JPY chart is currently experiencing a bearish momentum. Although the price is above a major ascending trend line, it is also within a bearish descending channel which suggests that price might continue to go lower due to its bearish momentum.
If the price were to break below the ascending trendline, it could potentially drop towards the 1st support at 133.72. Given the bearish momentum, price could potentially make a bearish break off the 1st support and drop towards the 2nd support at 132.34. This support level is a multi-swing low support and has a 50% Fibonacci retracement lining up with it, making it an important level to watch.
If price were to break the 1st resistance at 135.11, it could rise towards the 2nd resistance at 136.76. This resistance level is an overlap resistance and could potentially act as a strong level of resistance.
On the other hand, if the price were to reverse and move downwards, it could encounter resistance at the intermediate resistance at 134.37. This resistance level is an overlap resistance and could potentially act as a strong level of resistance.
If price were to break the intermediate resistance, it could trigger a strong bullish acceleration towards the 1st resistance at 135.11.
AUD/USD:
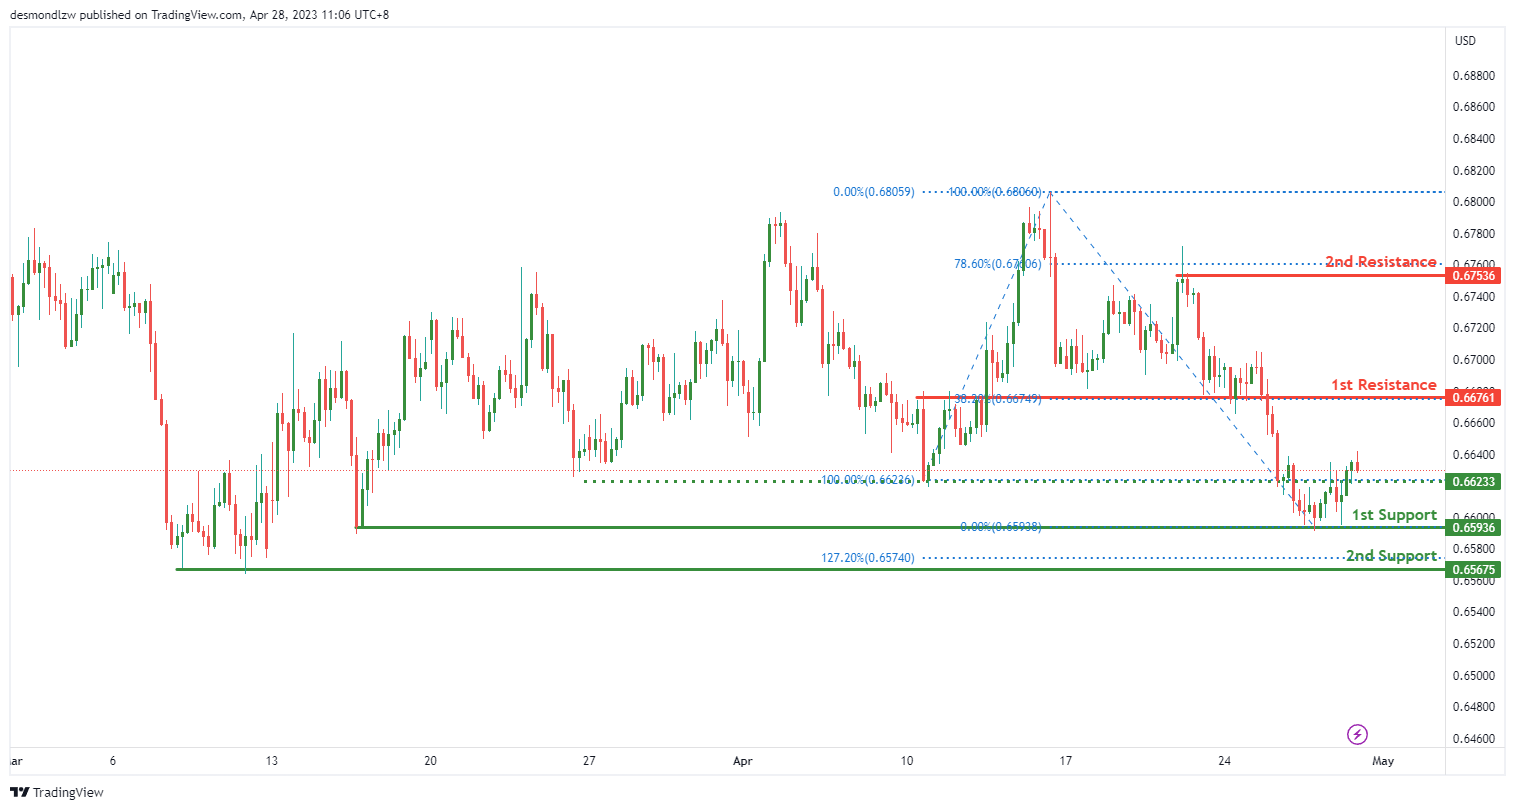
The AUD/USD chart is currently displaying strong bullish momentum, with potential for a bullish continuation towards the 1st resistance level of 0.6676. As of writing, the price is trading at 0.6643, which is above the Ichimoku cloud, indicating a bullish momentum.
There are two strong support levels identified on the chart. The first support level is at 0.6593, which is a multi-swing low support. This level has been tested multiple times in the past and has held up well, making it a good support level for potential price bounces. The second support level is at 0.6567, which is another multi-swing low support and a 127.20% Fibonacci Expansion. If the price were to drop below the first support level, this second support level could provide a good bounce point for prices to reverse back up.
In terms of resistance levels, there are two strong levels to watch out for. The first resistance level is at 0.6676, which is a pullback resistance and coincides with a 38.20% Fibonacci retracement. This resistance level is a good point to look out for potential price reversal. If the price were to break above this resistance level, it could signal a strong bullish momentum, potentially pushing prices up to the second resistance level at 0.6753. This level is a swing high resistance and a 78.60% Fibonacci retracement.
There is also an intermediate support level at 0.6623, which is an overlap support. This level could provide a good bounce point for prices if they were to drop between the current price and the first support level at 0.6593.
NZD/USD:
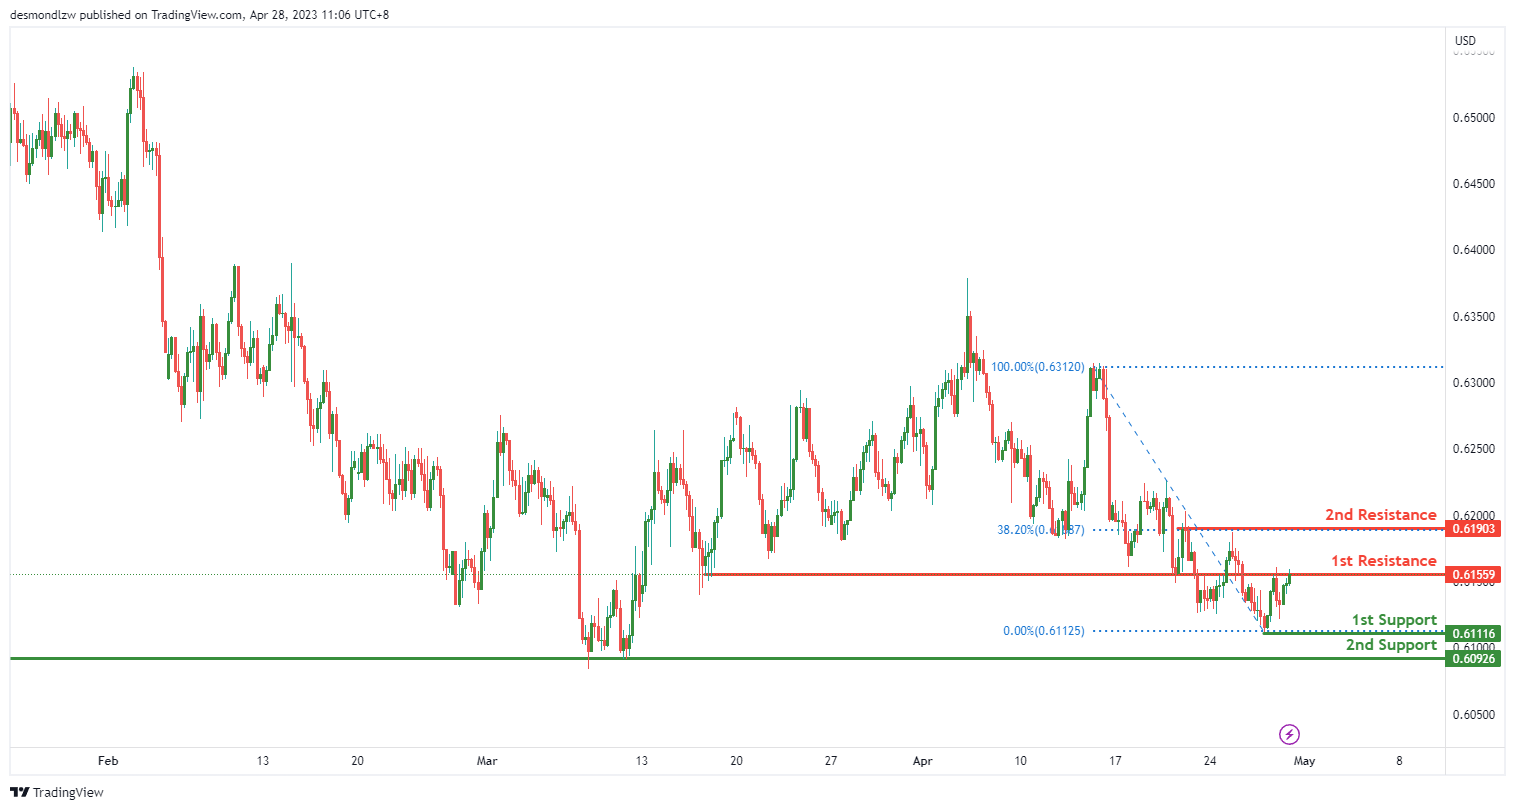
The NZD/USD chart is currently displaying strong bearish momentum, with potential for a bearish reaction off the first resistance level of 0.6155 and a potential drop towards the first support level of 0.6111. As of writing, the price is trading at 0.6133, which is below the Ichimoku cloud, indicating a bearish momentum.
There are two strong support levels identified on the chart. The first support level is at 0.6111, which is a swing low support. This level has been tested multiple times in the past and has held up well, making it a good support level for potential price bounces. The second support level is at 0.6092, which is another multi-swing low support. If the price were to drop below the first support level, this second support level could provide a good bounce point for prices to reverse back up.
In terms of resistance levels, there are two strong levels to watch out for. The first resistance level is at 0.6155, which is an overlap resistance. This resistance level coincides with the 38.20% Fibonacci retracement and could provide a good point to look out for potential price reversals. If the price were to break above this resistance level, it could signal a shift in momentum towards the bullish side, potentially pushing prices up to the second resistance level at 0.6190. This level is a multi-swing high resistance and another 38.20% Fibonacci retracement.
USD/CAD:
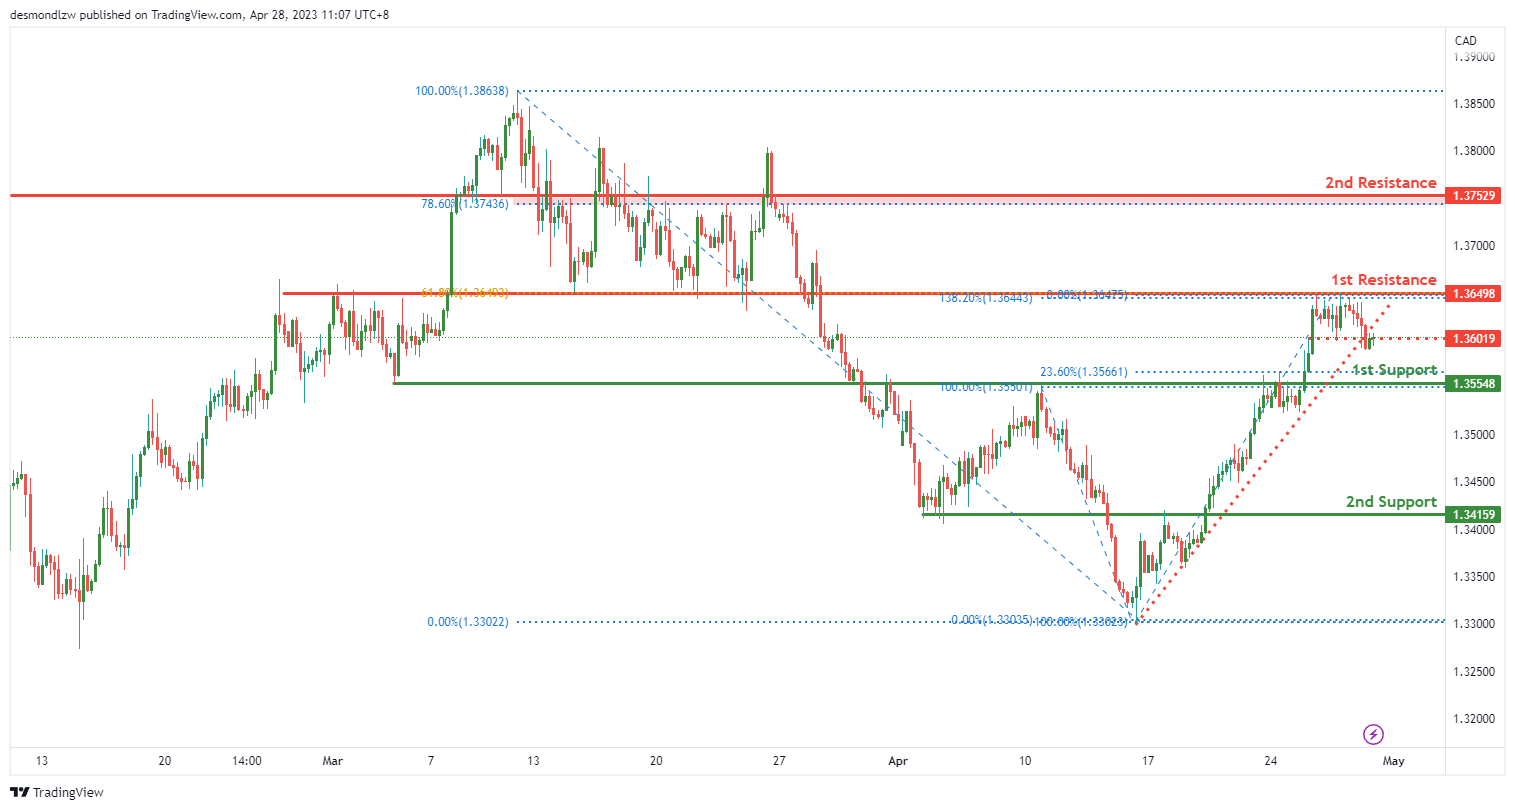
The USD/CAD chart is currently displaying strong bearish momentum, triggered by the break below an ascending support line. As of writing, the price is trading at 1.3567, which is below the Ichimoku cloud, indicating a bearish momentum.
There are two strong support levels identified on the chart. The first support level is at 1.3554, which is a pullback support and coincides with a 38.20% Fibonacci retracement. This support level is a good point to look out for potential price bounces. The second support level is at 1.3415, which is another pullback support. If the price were to drop below the first support level, this second support level could provide a good bounce point for prices to reverse back up.
In terms of resistance levels, there are two strong levels to watch out for. The first resistance level is at 1.3649, which is an overlap resistance and coincides with a 61.80% Fibonacci retracement. This resistance level could provide a good point to look out for potential price reversals. If the price were to break above this resistance level, it could signal a shift in momentum towards the bullish side, potentially pushing prices up to the second resistance level at 1.3752. This level is an overlap resistance and a 78.60% Fibonacci retracement.
There is also an intermediate resistance level at 1.3601, which is a pullback resistance. This level could provide a good point for prices to reverse back down towards the support levels.
DJ30:
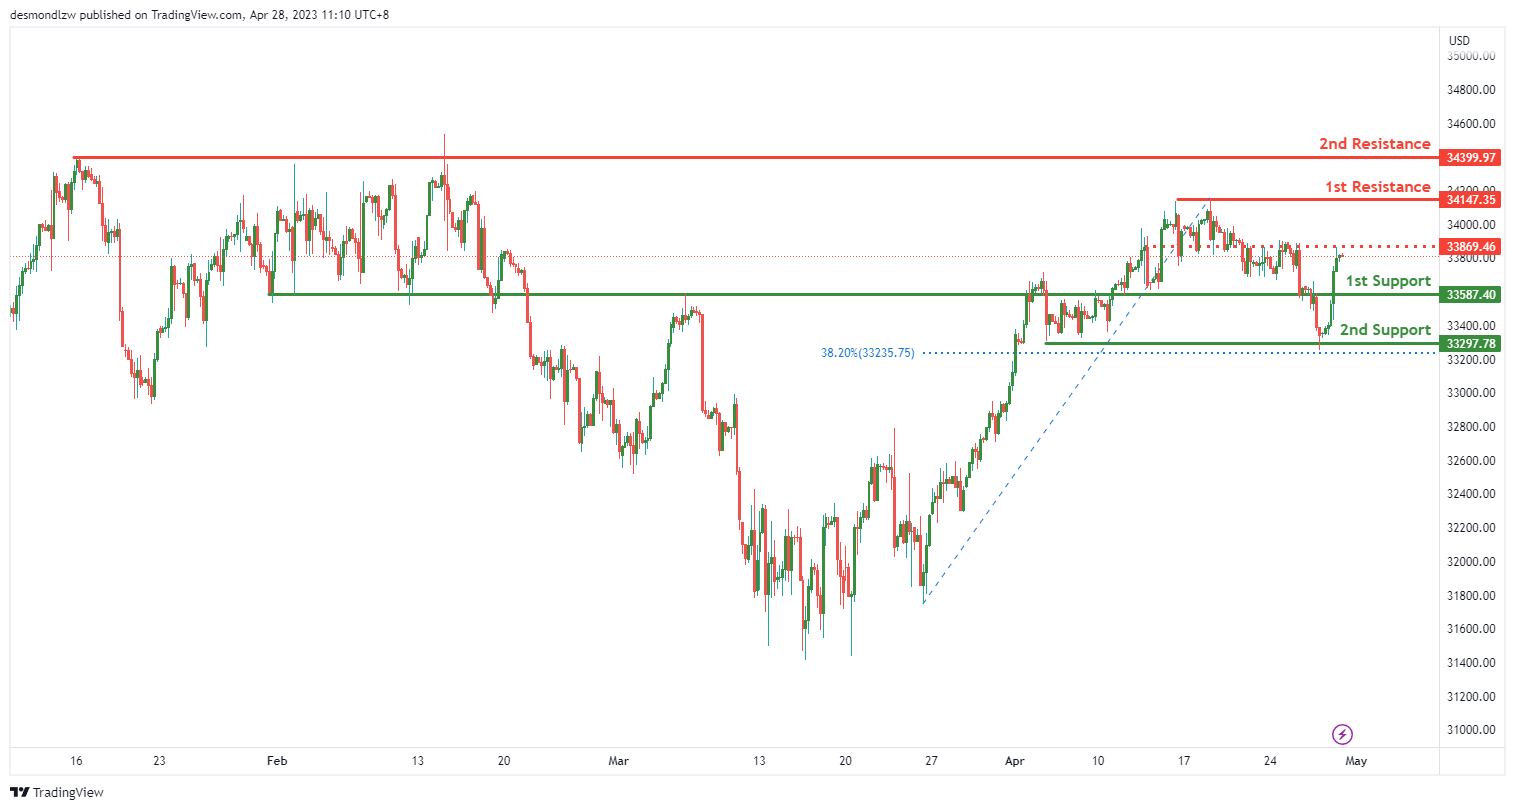
The DJ30 chart is currently displaying strong bullish momentum, with potential for a bullish continuation towards the first resistance level at 34147.35. As of writing, the price is trading at 33938.52, which is above the Ichimoku cloud, indicating a bullish momentum.
There are two strong support levels identified on the chart. The first support level is at 33587.40, which is a pullback support. This support level is a good point to look out for potential price bounces. The second support level is at 33297.78, which is a multi-swing low support and coincides with a 38.20% Fibonacci retracement. If the price were to drop below the first support level, this second support level could provide a good bounce point for prices to reverse back up.
In terms of resistance levels, there are two strong levels to watch out for. The first resistance level is at 34147.35, which is a multi-swing high resistance. This resistance level could provide a good point to look out for potential price reversals. If the price were to break above this resistance level, it could signal a shift in momentum towards the bullish side, potentially pushing prices up to the second resistance level at 34399.97. This level is also a multi-swing high resistance.
There is also an intermediate resistance level at 33869.46, which is a pullback resistance. This level could provide a good point for prices to reverse back down towards the support levels.
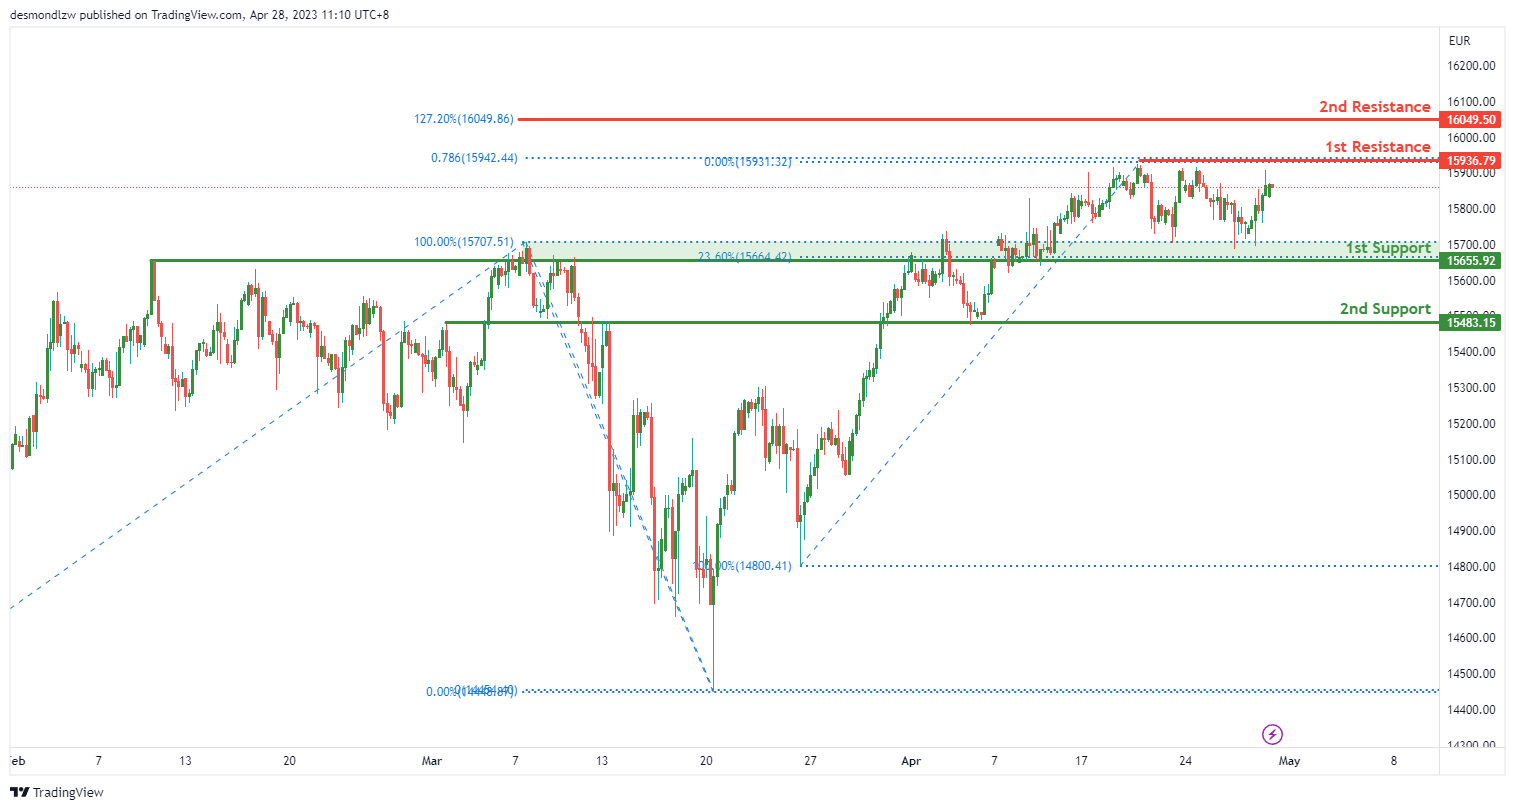
GER30:
The GER30 chart is currently displaying strong bullish momentum, with potential for a bullish continuation towards the first resistance level at 15936.79. As of writing, the price is trading at 15709.70, which is above the Ichimoku cloud, indicating a bullish momentum.
There are two strong support levels identified on the chart. The first support level is at 14655.92, which is an overlap support and coincides with a 23.60% Fibonacci retracement. This support level is a good point to look out for potential price bounces. The second support level is at 15483.15, which is another overlap support. If the price were to drop below the first support level, this second support level could provide a good bounce point for prices to reverse back up.
In terms of resistance levels, there are two strong levels to watch out for. The first resistance level is at 15936.79, which is a swing high resistance and coincides with a 78.60% Fibonacci projection. This resistance level could provide a good point to look out for potential price reversals. If the price were to break above this resistance level, it could signal a shift in momentum towards the bullish side, potentially pushing prices up to the second resistance level at 16049.50. This level is a 127.20% Fibonacci expansion.
BTC/USD:
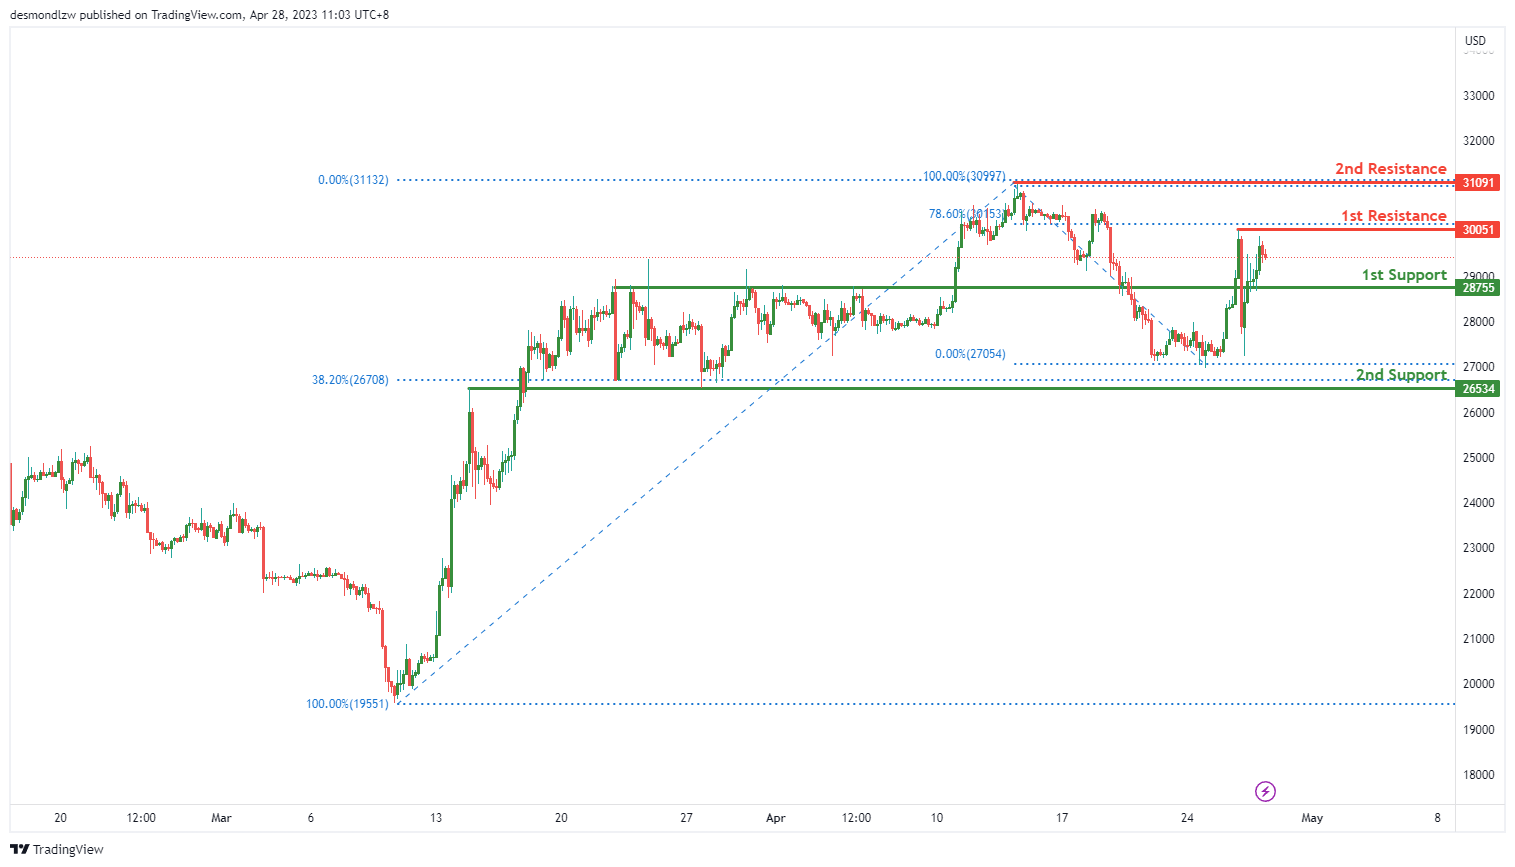
The BTC/USD chart is currently displaying bearish momentum, with potential for a bearish reaction off the first resistance level at 30051 and drop to the first support level at 28755. As of writing, the price is trading at 29307.31, which is below the Ichimoku cloud, indicating a bearish momentum.
There are two strong support levels identified on the chart. The first support level is at 28755, which is an overlap support. This support level is a good point to look out for potential price bounces. The second support level is at 26534, which is another overlap support and coincides with a 38.20% Fibonacci retracement. If the price were to drop below the first support level, this second support level could provide a good bounce point for prices to reverse back up.
In terms of resistance levels, there are two strong levels to watch out for. The first resistance level is at 30051, which is a swing high resistance. This resistance level could provide a good point to look out for potential price reversals. If the price were to break above this resistance level, it could signal a shift in momentum towards the bullish side, potentially pushing prices up to the second resistance level at 31091. This level is a swing high resistance and coincides with a 78.60% Fibonacci retracement.
US500
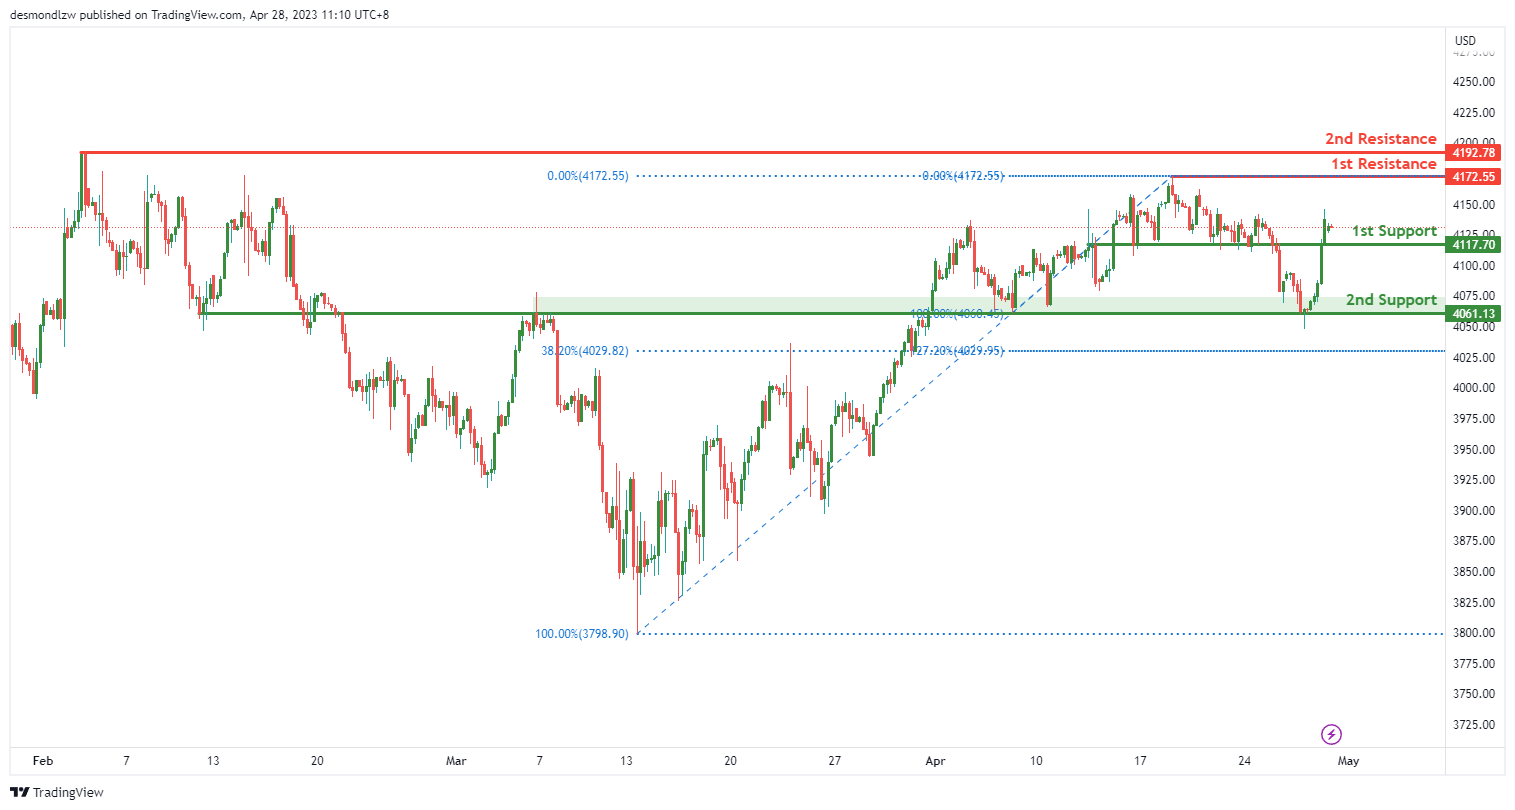
The US500 chart is currently displaying strong bullish momentum, with potential for a bullish continuation towards the first resistance level at 4172.55. As of writing, the price is trading at 4155.70, which is above the Ichimoku cloud, indicating a bullish momentum.
There are two strong support levels identified on the chart. The first support level is at 4147.70, which is a pullback support. This support level is a good point to look out for potential price bounces. The second support level is at 4061.13, which is another pullback support. If the price were to drop below the first support level, this second support level could provide a good bounce point for prices to reverse back up.
In terms of resistance levels, there are two strong levels to watch out for. The first resistance level is at 4172.55, which is a swing high resistance. This resistance level could provide a good point to look out for potential price reversals. If the price were to break above this resistance level, it could signal a shift in momentum towards the bullish side, potentially pushing prices up to the second resistance level at 4192.78. This level is also a swing high resistance.
ETH/USD:
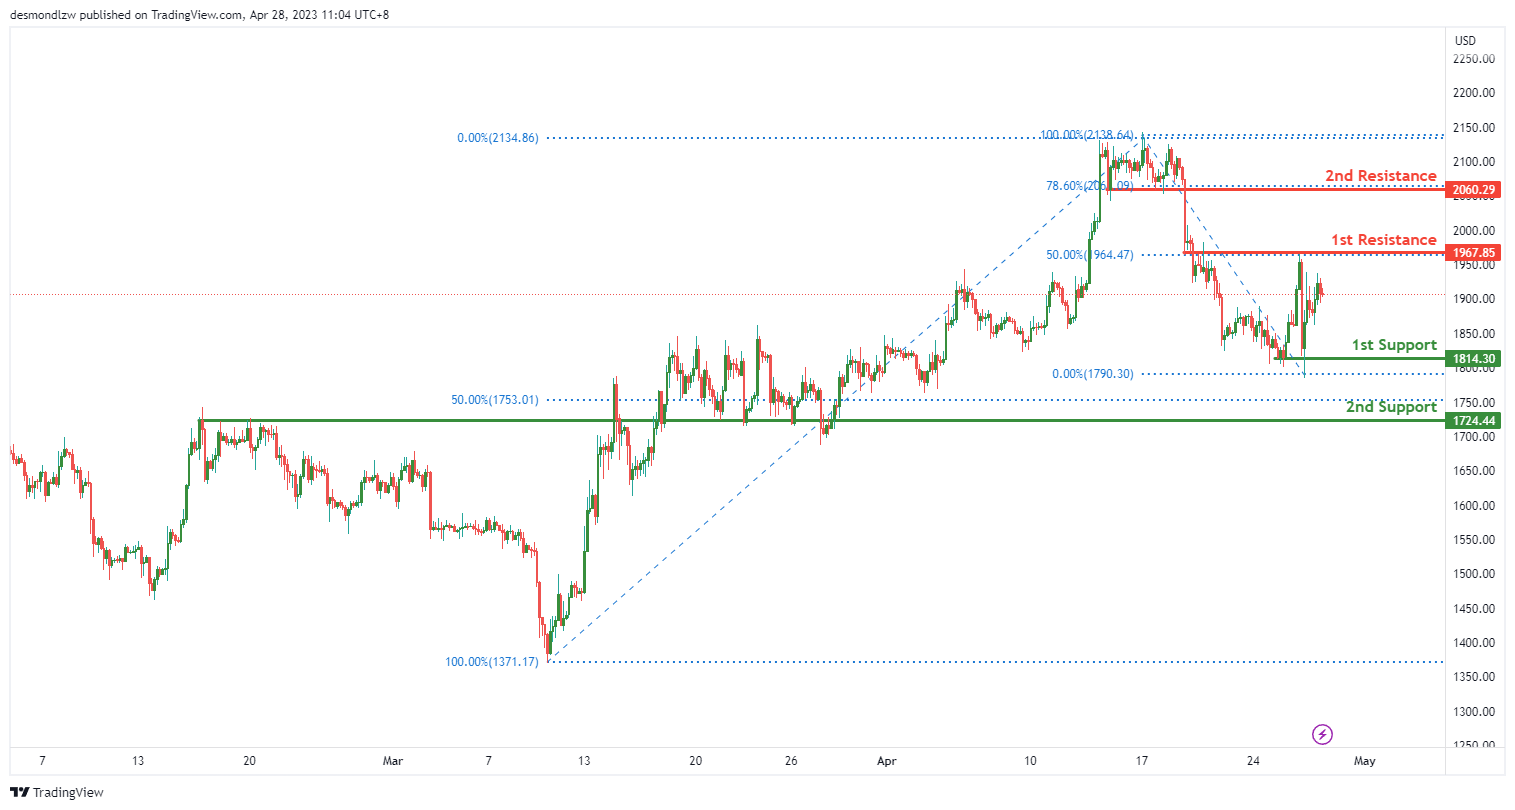
The ETH/USD chart is currently displaying bearish momentum, with potential for a bearish continuation towards the first support level at 1814.30. As of writing, the price is trading at 1877.34, which is below the Ichimoku cloud, indicating a bearish momentum.
There are two strong support levels identified on the chart. The first support level is at 1814.30, which is a multi-swing low support. This support level is a good point to look out for potential price bounces. The second support level is at 1724.44, which is an overlap support and coincides with a 50% Fibonacci retracement. If the price were to drop below the first support level, this second support level could provide a good bounce point for prices to reverse back up.
In terms of resistance levels, there are two strong levels to watch out for. The first resistance level is at 1967.85, which is an overlap resistance and coincides with a 50% Fibonacci retracement. This resistance level could provide a good point to look out for potential price reversals. If the price were to break below the first support level, it could signal a shift in momentum towards the bearish side, potentially pushing prices down to the second support level at 1724.44. On the other hand, if the price were to break above the first resistance level, it could potentially rise towards the second resistance level at 2060.29. This level is a pullback resistance and coincides with a 78.60% Fibonacci retracement.
WTI/USD:
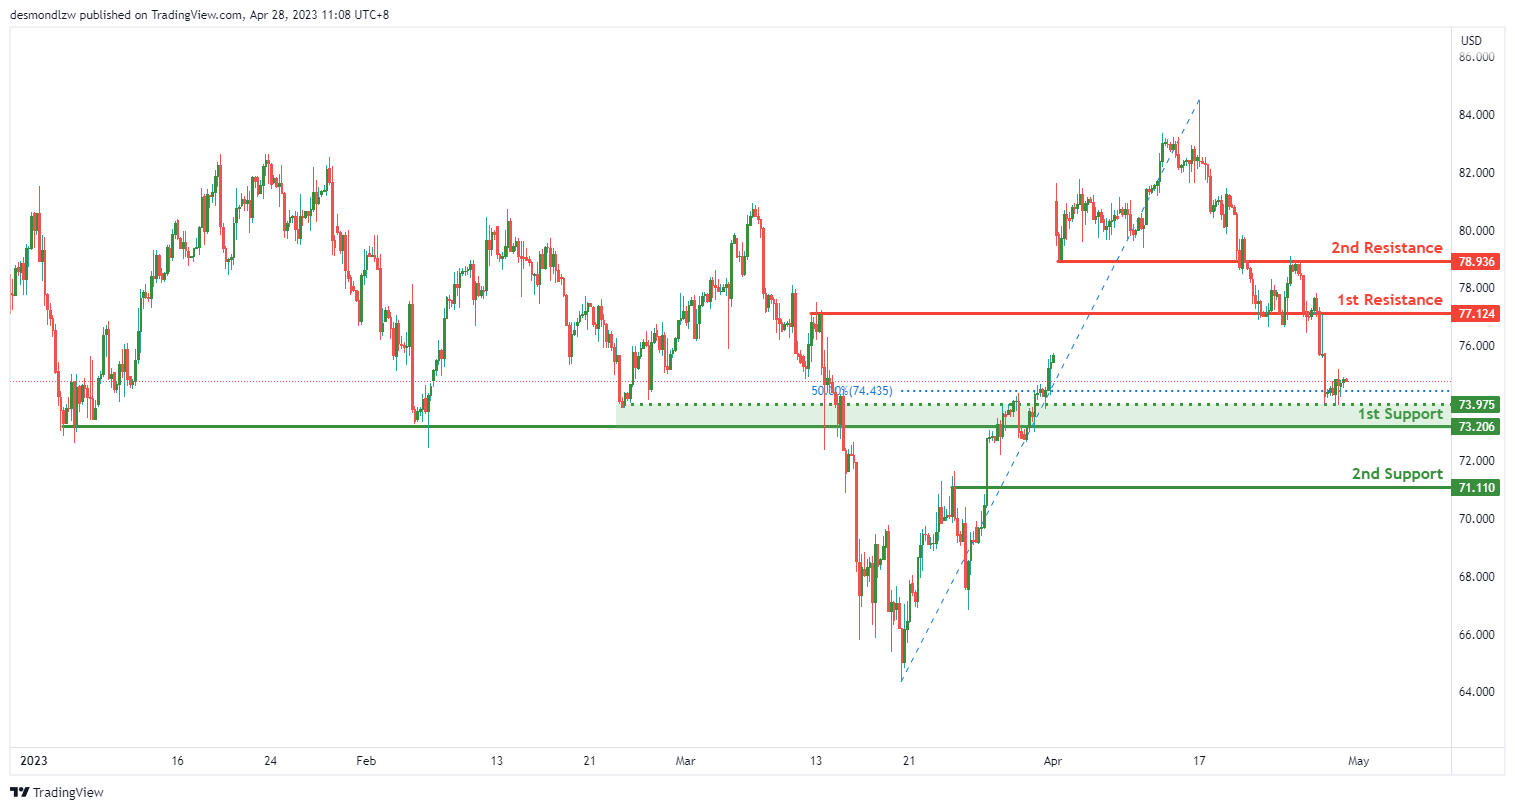
The WTI chart is currently displaying bullish momentum, with potential for a bullish bounce off the first support level at 73.20 and heading towards the first resistance level at 77.12. As of writing, the price is trading at 75.75, which is above the Ichimoku cloud, indicating a bullish momentum.
There are two strong support levels identified on the chart. The first support level is at 73.20, which is a pullback support. This support level is a good point to look out for potential price bounces. The second support level is at 71.11, which is also a pullback support. If the price were to drop below the first support level, this second support level could provide a good bounce point for prices to reverse back up.
In terms of resistance levels, there are two strong levels to watch out for. The first resistance level is at 77.12, which is an overlap resistance. This resistance level could provide a good point to look out for potential price reversals. If the price were to break above the first resistance level, it could potentially rise towards the second resistance level at 78.93. This level is also an overlap resistance, and both resistance levels indicate potential for further bullish momentum.
There is also an intermediate support level at 73.97, which is an overlap support. This level could potentially provide a good point to watch out for a bullish continuation towards the first resistance level.
XAU/USD (GOLD):
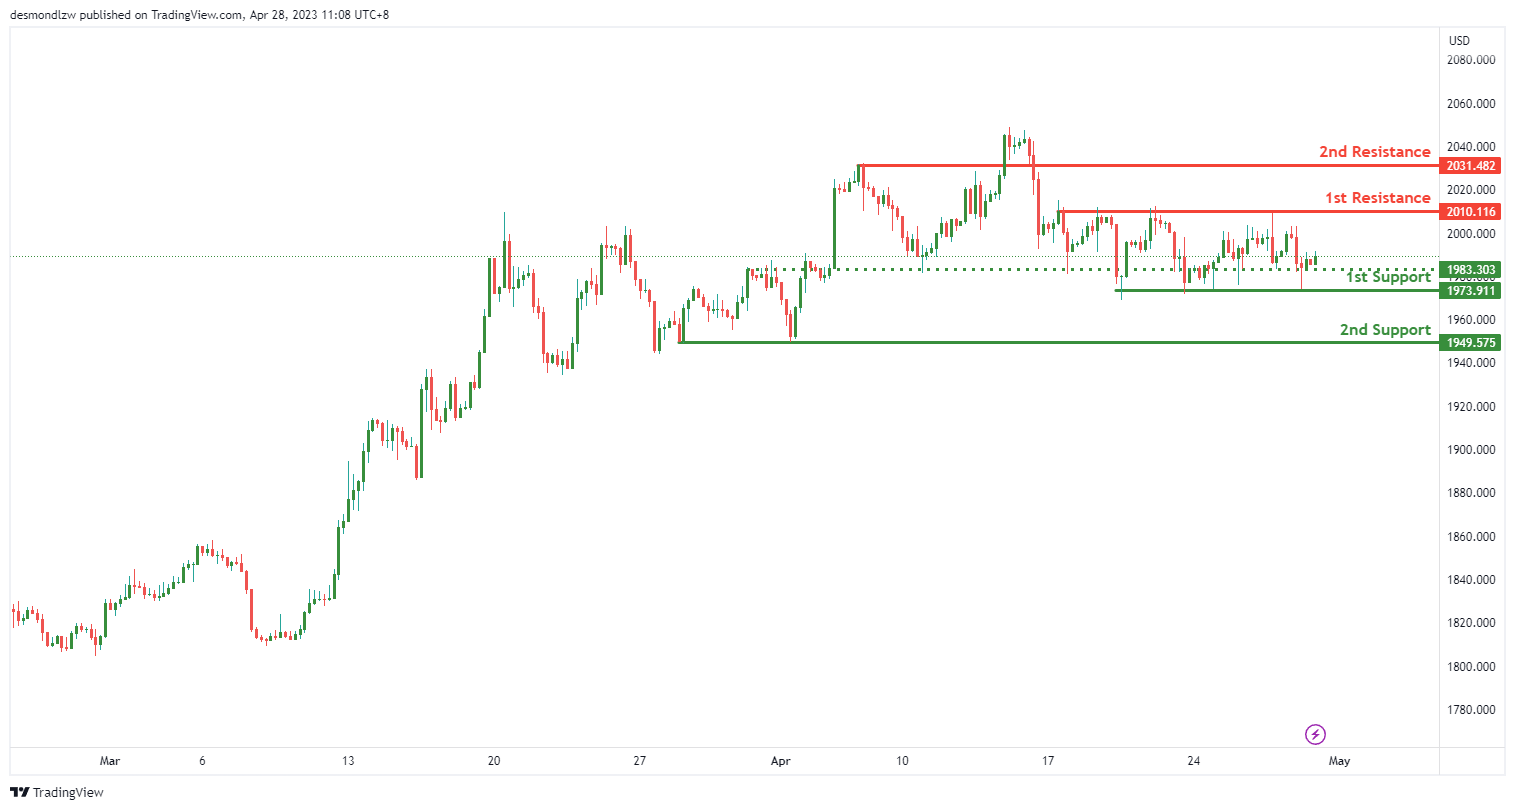
The XAU/USD chart is displaying bullish momentum, with potential for a bullish continuation towards the first resistance level at 2010.00. As of writing, the price is trading at 1989.18, which is above the Ichimoku cloud, indicating a bullish momentum.
There are two strong support levels identified on the chart. The first support level is at 1973.91, which is a multi-swing low support. This support level is a good point to look out for potential price bounces. The second support level is at 1949.57, which is also a multi-swing low support. If the price were to drop below the first support level, this second support level could provide a good bounce point for prices to reverse back up.
In terms of resistance levels, there are two strong levels to watch out for. The first resistance level is at 2010.00, which is a multi-swing high resistance. This resistance level could provide a good point to look out for potential price reversals. If the price were to break above the first resistance level, it could potentially rise towards the second resistance level at 2031.48. This level is also a pullback resistance, indicating potential for further bullish momentum.
There is also an intermediate support level at 1983.30, which is an overlap support. This level could potentially provide a good point to watch out for a bullish continuation towards the first resistance level.
GBP/JPY Daily Outlook
Daily Pivots: (S1) 166.66; (P) 167.09; (R1) 167.85; More...
GBP/JPY's rally resumed by breaking through 167.95 resistance an intraday bias is back on the upside. Current rise from 155.33 should target 169.26 resistance first, and then 172.11 high. For now, near term outlook will remain cautiously bullish as long as 165.40 support holds, in case of retreat. However, firm break of 165.40 will argue that the corrective pattern from 172.11 is starting another falling leg. Intraday bias will be back on the downside for 162.75 support and below.
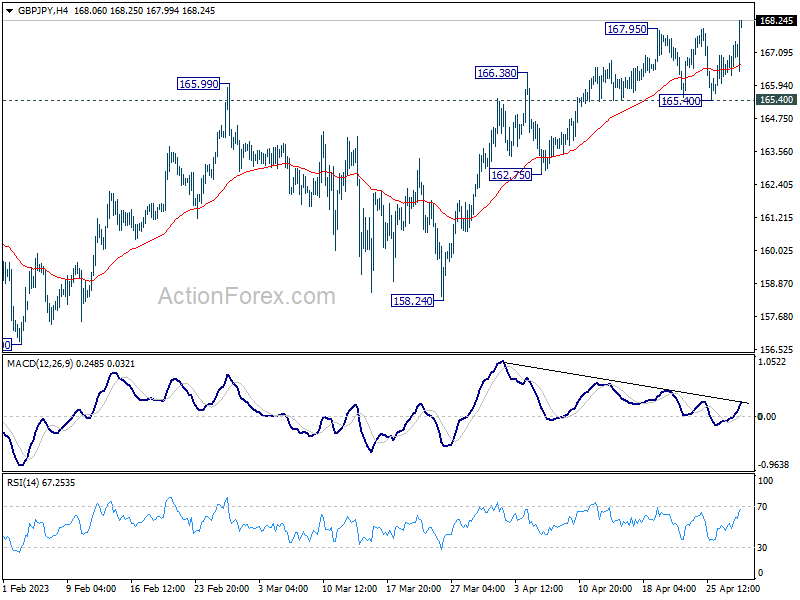
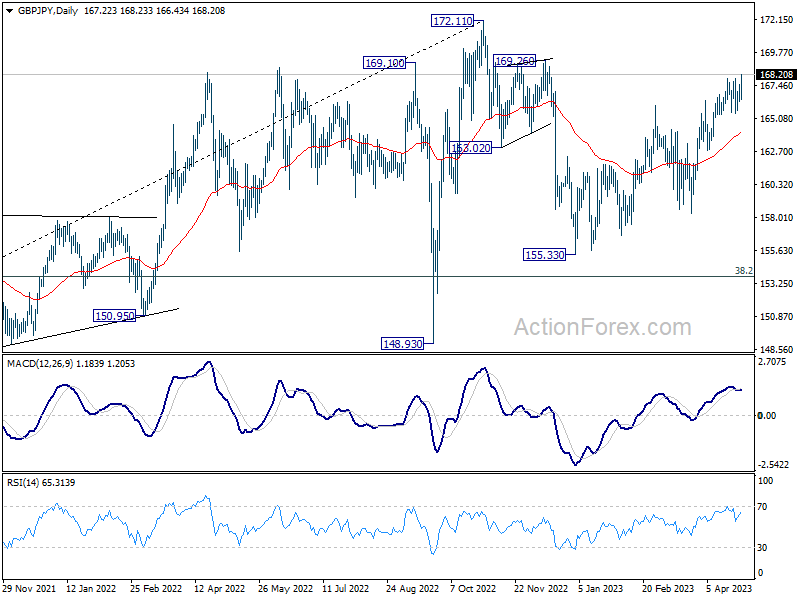
In the bigger picture, as long as 38.2% retracement of 123.94 (2020 low) to 172.11 (2022 high) at 153.70 holds, medium term bullishness is retained. That is, larger up trend from 123.94 (2020 low) is still in progress. Break of 172.11 high to resume such up trend is expected at a later stage.
Yen Falls on Dovish BoJ, Risk-On Sentiment Boosts Market
Yen declined broadly in Asian session as traders discovered that BoJ still has the potential to surprise the market with dovish moves. The selloff was triggered by the central bank's plan to review monetary policy in 12 to 18 months, a major disappointment for those who expected imminent changes as early as at today's meeting. Additionally, BoJ projects that core inflation will not sustain above target within the projection horizon. Risk-on sentiment, following the strong rebound in US stocks overnight, is another factor pressuring Yen. With the BoJ risk now cleared, bears should be feeling free to act.
At the moment, Australian dollar remains the worst performer for the week, as more analysts anticipate another RBA pause next week. Canadian dollar is the second worst, followed by The Sterling is the best performer, trailed by Euro and New Zealand dollar. While Dollar is recovering today, it remains mixed for the week. The overall picture may change, as Eurozone GDP, Canada GDP, and US PCE inflation data are set to be released today.
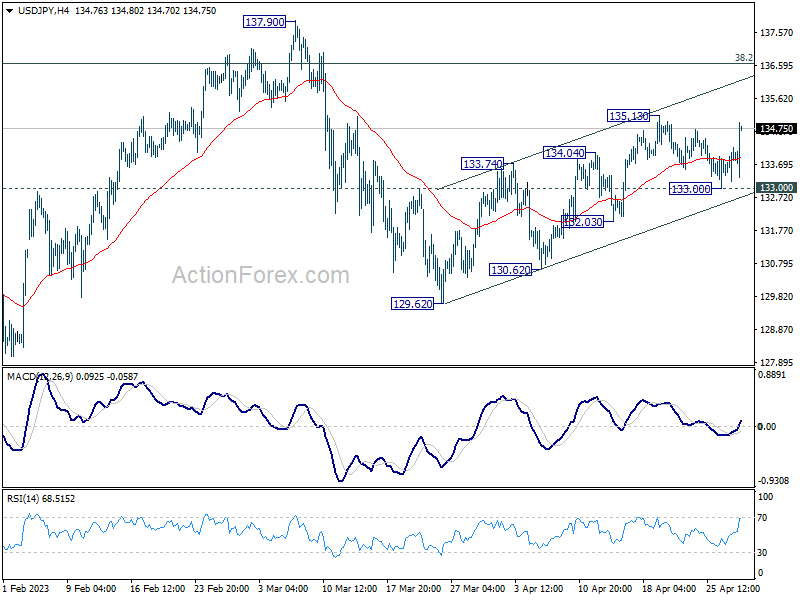
Technically, USD/JPY will be a focus in the next few hours, at least before US session. Break of 135.13 will resume the choppy rebound from 129.62. Attention will be on the reaction to the near-term channel resistance (now at around 136.10). Rejection by this resistance will likely keep the rebound corrective and favor a larger decline through 129.62 and 127.20 at a later stage. However, a strong break of the channel resistance will indicate upside acceleration and increase the likelihood of resuming the entire rise from 127.20 through 137.90 resistance.
In Asia, at the time of writing, Nikkei is up 0.80%. Hong Kong HSI is up 0.87%. China Shanghai SSE is up 0.67. Singapore Strait Times is down -0.21%. Japan 10-year JGB yield is down notably by -0.032 at 0.428. Overnight, DOW rose 1.57%. S&P 500 rose 1.96%. NASDAQ rose 2.43%. 10-year yield rose 0.096 to 3.528.
S&P 500 stays near term bullish after biggest rally since Jan
US stocks rebounded strongly overnight with DOW and S&P 500 having the biggest rally since January, and NASDAQ since March. Sentiment was boosted by Meta's quarterly performance, which shares ended up 14%. The miss in Q1 GDP data also added to hope that Fed is closer to ending the tightening cycle and gave the pessimists some bullets to call for a rate cut before the end of the year if the economy deteriorates further down the road.
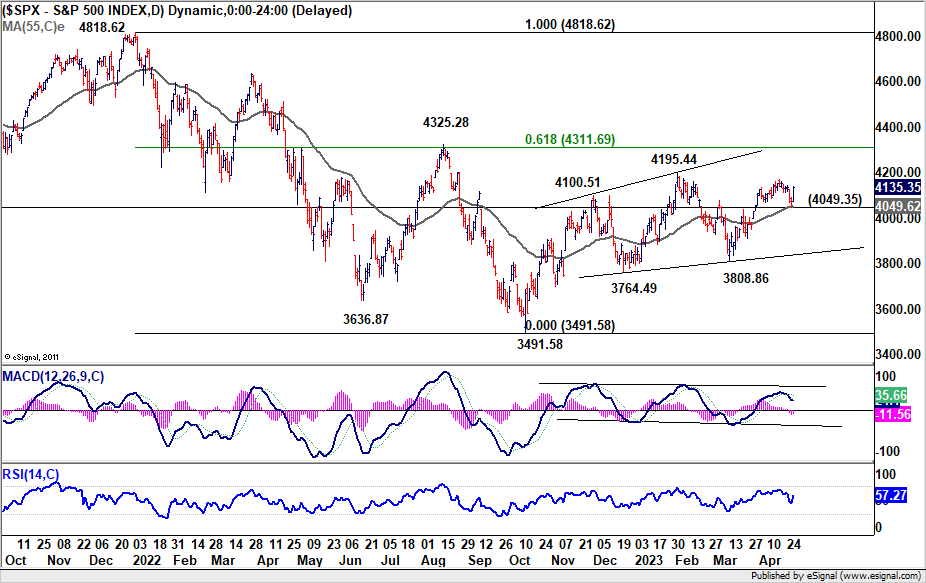
Technically, DOW, S&P 500 and NASDAQ all received strong support from their respective 55 D EMA this week. As for SPX, the development keeps the rally from 3808.83 alive. Near term outlook will now stay bullish as long as 4049.35 support holds. Break of 4195.44 resistance will confirm resumption of whole rebound from 3491.58.
The key hurdle remains on 4325.28 cluster resistance (61.8% retracement of 4818.62 to 3491.58 at 4311.69). Sustained break of this cluster resistance will open up further rally back to historical high at 4818.62. The reaction from this 4300 handle will hinge on next week's FOMC rate decision and Chair Jerome Powell's press conference.
BoJ stands pat, to take 1-1.5 yrs to review monetary policy
BoJ keeps monetary policy unchanged as widely expected, by unanimous vote. Under the yield curve control, short-term policy interest rate is held at -0.10%. 10-year JGB yield will be kept at around 0% with bond purchases without upper limit. 10-year JGB yield will continue to be allowed to fluctuate in range of around plus and minus 0.50% from 0% level.
The central bank maintained the pledge to continue with Quantitative and Qualitative Monetary Easing with Yield Curve Control for "as long as it is necessary" for meeting inflation target in a "stable manner". It "will not hesitate to take additional easing measures if necessary". BoJ will conduct a "broad-perspective review of monetary policy", with a planned time frame of around 12 to 18 months.
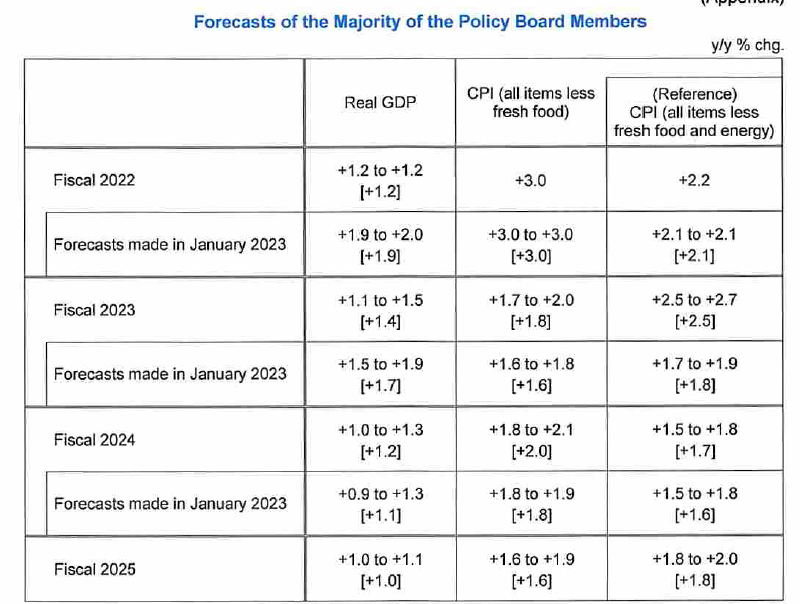
In the new economic projections, while core inflation forecasts were upgraded, it's not expected to sustain at the 2% level throughout the horizon.
- Real GDP forecasts (versus January estimates):
- Fiscal 2023 at 1.4% (down from 1.7%).
- Fiscal 2024 at 1.2% (up from 1.1%).
- Fiscal 2025 at 1.0% (new)
- CPI Core forecasts (versus January estimates):
- Fiscal 2023 at 1.8% (up from 1.6%).
- Fiscal 2024 at 2.0% (up from 1.8%).
- Fiscal 2025 at 1.6% (new).
- CPI Core-Core forecasts (versus January estimates):
- Fiscal 2023 at 2.5% (up from 1.8%).
- Fiscal 2024 at 1.7% (up from 1.6%).
- Fiscal 2025 at 1.8% (new).
Japan industrial production rose 0.8% mom, with signs of moderate pick up
Japan's industrial production expanded for the second consecutive month, recording a 0.8% mom growth in March, surpassing the expected 0.4% mom increase. The growth was driven by output in eight sectors, led by motor vehicles, while declines were observed in seven sectors, including electronic components and devices.
The Ministry of Economy, Trade and Industry upgraded its basic assessment for the month, stating that industrial production was "showing signs of moderately picking up" as parts supply shortages continued to ease. This is a marked improvement from the previous month's assessment of "weakening." The ministry also projects a further 4.1% growth in industrial production for April and a -2.0% decline in May.
Other economic indicators released include 7.2% yoy increase in retail sales for March, surpassing expectations of 6.5% yoy. However, unemployment rate rose for the second month in a row, reaching 2.8%, above expectation of 2.5%.
April, Tokyo core CPI, which excludes fresh food, accelerated from 3.2% to 3.5% yoy, exceeding expectations of 3.2% yoy. Core-core CPI, which excludes fresh food and fuel costs, accelerated from 3.4% to 3.8% year-on-year, marking the highest rate since April 1982.
Looking ahead
GDP data from Eurozone, Germany and France are the main focuses in European session. Germany will also publish CPI flash. Swiss will release retail sales and KOF economic barometer. Later in the day, Canada GDP, US personal income and spending with PCE inflation will be the main focuses.
GBP/JPY Daily Outlook
Daily Pivots: (S1) 166.66; (P) 167.09; (R1) 167.85; More...
GBP/JPY's rally resumed by breaking through 167.95 resistance an intraday bias is back on the upside. Current rise from 155.33 should target 169.26 resistance first, and then 172.11 high. For now, near term outlook will remain cautiously bullish as long as 165.40 support holds, in case of retreat. However, firm break of 165.40 will argue that the corrective pattern from 172.11 is starting another falling leg. Intraday bias will be back on the downside for 162.75 support and below.
In the bigger picture, as long as 38.2% retracement of 123.94 (2020 low) to 172.11 (2022 high) at 153.70 holds, medium term bullishness is retained. That is, larger up trend from 123.94 (2020 low) is still in progress. Break of 172.11 high to resume such up trend is expected at a later stage.
Economic Indicators Update
| GMT | Ccy | Events | Actual | Forecast | Previous | Revised |
|---|---|---|---|---|---|---|
| 23:30 | JPY | Tokyo CPI Core Y/Y Apr | 3.50% | 3.20% | 3.20% | |
| 23:50 | JPY | Industrial Production M/M Mar P | 0.80% | 0.40% | 4.60% | |
| 23:50 | JPY | Retail Trade Y/Y Mar | 7.20% | 6.50% | 6.60% | 7.30% |
| 23:30 | JPY | Unemployment Rate Mar | 2.80% | 2.50% | 2.60% | |
| 01:30 | AUD | Private Sector Credit M/M Mar | 0.30% | 0.30% | 0.30% | |
| 01:30 | AUD | PPI Q/Q Q1 | 1.00% | 1.50% | 0.70% | |
| 01:30 | AUD | PPI Y/Y Q1 | 5.20% | 5.80% | 5.80% | |
| 04:00 | JPY | BoJ Interest Rate Decision | -0.10% | -0.10% | -0.10% | |
| 05:00 | JPY | Housing Starts Y/Y Mar | -3.2% | -3.70% | -0.30% | |
| 05:30 | EUR | France GDP Q/Q Q1 P | 0.10% | 0.10% | ||
| 06:00 | EUR | Germany Import Price Index M/M Mar | -0.90% | -2.40% | ||
| 06:30 | CHF | Real Retail Sales Y/Y Mar | 0.40% | 0.30% | ||
| 07:00 | CHF | KOF Leading Indicator Apr | 98 | 98.2 | ||
| 07:55 | EUR | Germany Unemployment Change Mar | 10K | 16K | ||
| 07:55 | EUR | Germany Unemployment Rate Mar | 5.60% | 5.60% | ||
| 08:00 | EUR | Italy GDP Q/Q Q1 P | 0.20% | -0.10% | ||
| 08:00 | EUR | Germany GDP Q/Q Q1 P | 0.10% | -0.40% | ||
| 09:00 | EUR | Eurozone GDP Q/Q Q1 P | 0.10% | 0.00% | ||
| 12:00 | EUR | Germany CPI M/M Apr P | 0.60% | 0.80% | ||
| 12:00 | EUR | Germany CPI Y/Y Apr P | 7.30% | 7.40% | ||
| 12:30 | CAD | GDP M/M Feb | 0.20% | 0.50% | ||
| 12:30 | USD | Personal Income M/M Mar | 0.20% | 0.30% | ||
| 12:30 | USD | Personal Spending Mar | -0.10% | 0.20% | ||
| 12:30 | USD | PCE Price Index M/M Mar | 0.30% | 0.30% | ||
| 12:30 | USD | PCE Price Index Y/Y Mar | 4.60% | 5.00% | ||
| 12:30 | USD | Core PCE Price Index M/M Mar | 0.30% | 0.30% | ||
| 12:30 | USD | Core PCE Price Index Y/Y Mar | 4.50% | 4.60% | ||
| 12:30 | USD | Employment Cost Index Q1 | 1.10% | 1.00% | ||
| 13:45 | USD | Chicago PMI Apr | 43.7 | 43.8 | ||
| 14:00 | USD | Michigan Consumer Sentiment Index Apr F | 63.5 | 63.5 |
BoJ stands pat, to take 1-1.5 yrs to review monetary policy
BoJ keeps monetary policy unchanged as widely expected, by unanimous vote. Under the yield curve control, short-term policy interest rate is held at -0.10%. 10-year JGB yield will be kept at around 0% with bond purchases without upper limit. 10-year JGB yield will continue to be allowed to fluctuate in range of around plus and minus 0.50% from 0% level.
The central bank maintained the pledge to continue with Quantitative and Qualitative Monetary Easing with Yield Curve Control for "as long as it is necessary" for meeting inflation target in a "stable manner". It "will not hesitate to take additional easing measures if necessary". BoJ will conduct a "broad-perspective review of monetary policy", with a planned time frame of around 12 to 18 months.
In the new economic projections, while core inflation forecasts were upgraded, it's not expected to sustain at the 2% level throughout the horizon.
- Real GDP forecasts (versus January estimates):
- Fiscal 2023 at 1.4% (down from 1.7%).
- Fiscal 2024 at 1.2% (up from 1.1%).
- Fiscal 2025 at 1.0% (new)
- CPI Core forecasts (versus January estimates):
- Fiscal 2023 at 1.8% (up from 1.6%).
- Fiscal 2024 at 2.0% (up from 1.8%).
- Fiscal 2025 at 1.6% (new).
- CPI Core-Core forecasts (versus January estimates):
- Fiscal 2023 at 2.5% (up from 1.8%).
- Fiscal 2024 at 1.7% (up from 1.6%).
- Fiscal 2025 at 1.8% (new).