Sample Category Title
USD/JPY Surges after BoJ Maintains Policy, Inflation Rises
- Bank of Japan maintains monetary policy
- BoJ removes forward guidance and announces policy review
- Tokyo Core CPI rises higher than expected
- USD/JPY soars
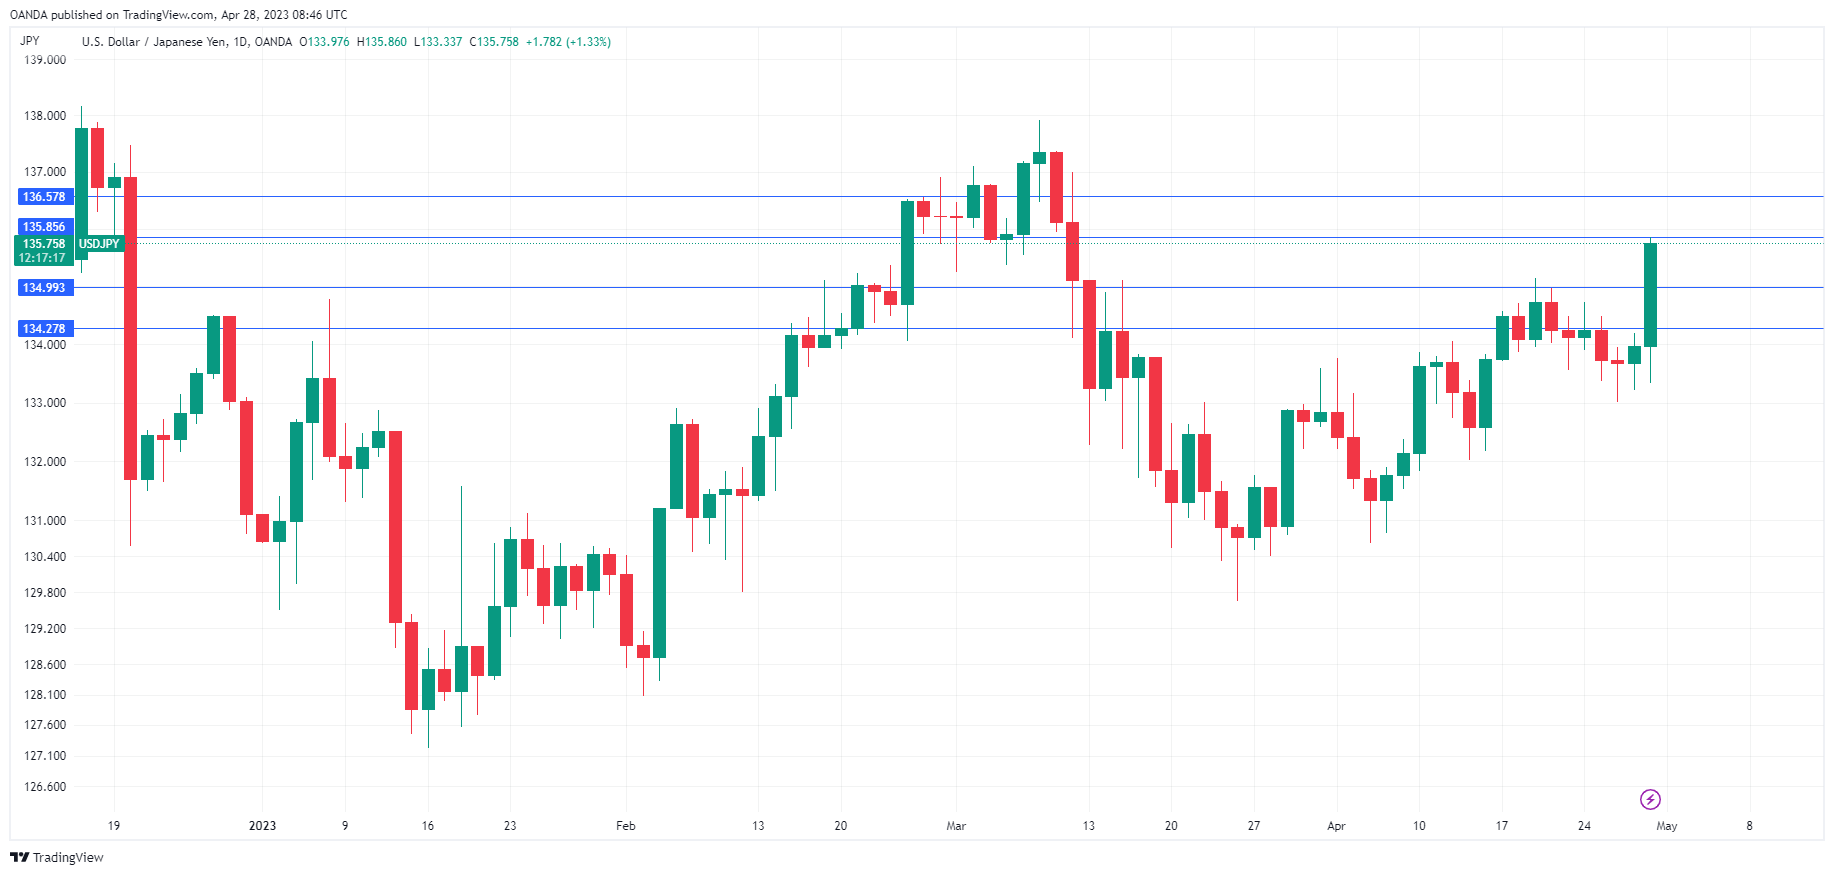
USD/JPY has jumped 1.3% today and is trading at 135.74. Earlier, the yen touched a low of 135.86, its lowest level since March 10th.
BoJ holds policy but changes guidance
Today’s Bank of Japan meeting was closely watched, as New Governor Ueda chaired his first meeting. As expected, there were no dramatic announcements about a shift in policy, but the yen still dropped sharply, as those investors that had hoped for a hint of monetary tightening in the short term were disappointed.
The BoJ announced that key policy settings will stay the same. Interest rates will remain at -0.10% and the yield curve control (YOC) scheme on 10-year government bonds will maintain a band of 0.50% on either side of the 0% target. There was no surprise here, as Ueda has stated on numerous occasions and again this week that he would not change these policy settings.
At the same time, the central bank modified its future guidance, removing its pledge to maintain rates at “current or lower levels”. The BoJ said it would “patiently continue with monetary easing” while saying it would conduct a broad review of monetary policy, which it expects to take one to one-and-half years.
The takeaway from the BoJ meeting is that the markets can expect more of the same in the short term, but there is the possibility of a shift in policy down the road. Ueda stated earlier in the week that if inflation and wage growth were to accelerate faster than expected, he would consider the possibility of tightening policy. Ueda does not seem as glued to current policy as his predecessor Kuroda, but the new Governor is unlikely to make any moves absent a major change in economic conditions.
Ahead of the BoJ meeting there was an interesting note from Barclays which said that the yen could regain its status as a safe-haven currency, which has been taken over by the US dollar. Barclays said that if the BoJ normalizes policy and central banks cut rates due to a weak global economy, rate differentials would tighten and the yen would move higher. Barclays is projecting that the yen will rise to 123 by the end of next year, and the stronger currency could re-establish itself as a safe haven.
Overshadowed by the BoJ meeting, Tokyo Core CPI rose in April, an indication that high inflation is alive and well. The indicator rose from 3.2% to 3.5%, above the market consensus of 3.2%.
USD/JPY Technical
- USD/JPY tested resistance at 1.3585 earlier today. The next resistance line is 1.3657
- 134.99 and 1.3427 are providing support
USDCAD Brings Weekly Resistance Back into Play
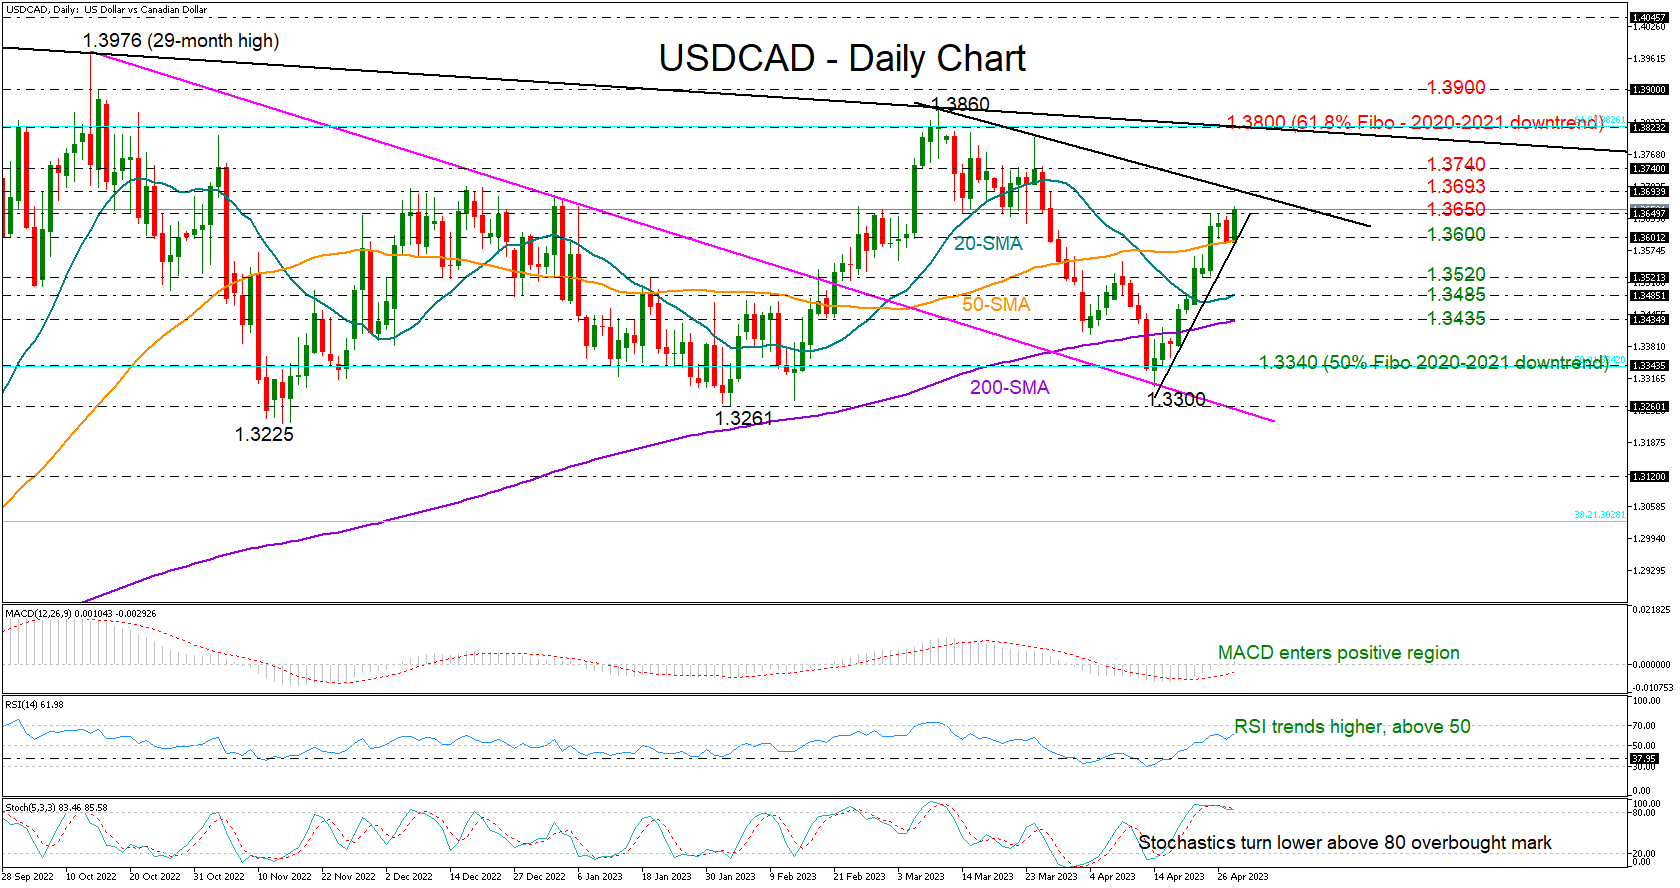
USDCAD bounced on the 50-day simple moving average (SMA) early on Friday to recoup Thursday’s losses and fight against the weekly resistance of 1.3650.
The odds are leaning on the bullish side as the RSI is maintaining an upward trajectory above its 50 neutral mark and the MACD is trying to enter the positive area. Yet some caution is necessary as the stochastic oscillator seems to have already peaked in the overbought region.
Should the bulls clear the 1.3650 resistance, the next stop could be near the tentative short-term descending trendline seen around 1.3693. Piercing through this wall, the price could then rise towards the 1.3740 constraining zone, a break of which could lift the price straight up to the tough 1.3800 barrier. This is where the 61.8% Fibonacci retracement of the 2020-2021 downtrend and the long-term resistance line from the 2020 top are placed. Hence, a close higher is expected to bolster buying appetite, likely up to the 1.3900 hurdle taken from October 2022.
Alternatively, a backward flip may initially test the 50-day SMA at 1.3600 and the steep ascending trendline from April’s lows. If that floor collapses, the price may tumble towards the 1.3520 barrier, while lower, the 20- and 200-day SMAs at 1.3485 and 1.3435 respectively may attract some attention ahead of the 50% Fibonacci mark of 1.3340.
In brief, USDCAD seems to have enough fuel in the tank to drive higher, though traders may wisely wait for a decisive close above 1.3650, and more importantly, beyond 1.3693 before they boost their buying orders.
Bitcoin’s Short-Term Triangle
Market Picture
Crypto market capitalisation is up 0.85% in the last 24 hours to 1.21 trillion, in the middle of its range over the previous two weeks. The Crypto Fear and Greed Index rose 5 points to 64, establishing itself in greed territory and showing that sentiment is recovering faster than capitalisation.
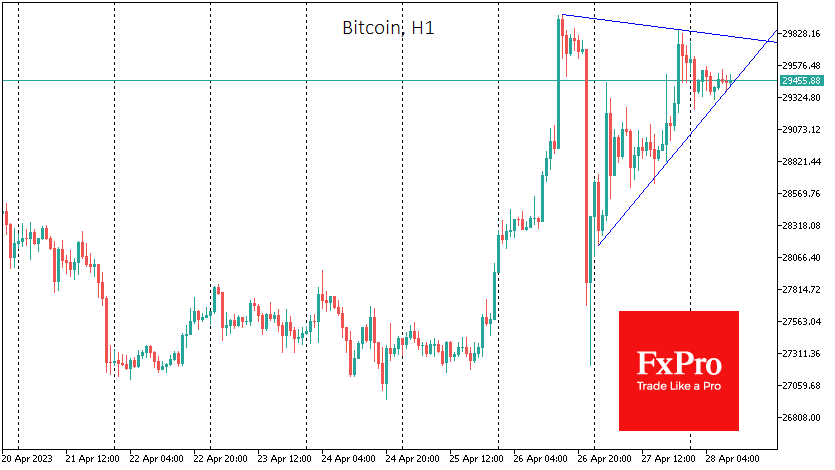
Bitcoin attempted to approach $30K again on Thursday but hit lower highs than on Wednesday, although it didn’t pull back as hard. Notably, the Nasdaq high tech index was up an impressive 2.75%.
Bitcoin continues to form triangles in the short term and has a reasonably clear support line. At the same time, an impressive supply of sellers is preventing the price from fixing above the psychologically important $30K price.
Kaiko points to the increasing correlation between BTC and gold. The cryptocurrency’s dependence on precious metals has grown since early March. The banking crisis and the risks of financial turmoil are scaring investors around the world and causing them to buy up safe-haven assets.
According to CryptoQuant, bitcoin’s leverage ratio has reached an all-time low of 0.195. This reduces the volatility of the spot VC market, which is becoming less sensitive to futures market activity.
News background
Ethereum options volume and open interest on the CME hit all-time highs following the successful Shapella hardfork.
The Hong Kong Securities and Futures Commission (SFC) said it is preparing rules for licensing crypto exchanges and will introduce them next month. Turning Hong Kong into a crypto hub could provide liquidity for cryptocurrency growth and become a new rally driver, according to Blockfin Academy.
Investment in bitcoin startups has outpaced the rest of the crypto industry in terms of investment in 2022, according to a report by Trammell Venture Partners (TVP). However, the first cryptocurrency has yet to be widely accepted.
The Google Cloud platform has partnered with the Polygon project to accelerate the adoption of “key Polygon protocols” in enterprise infrastructure and tools and “increase bandwidth” in gaming, supply chain and DeFi.
Eurozone GDP rose 0.1% qoq in Q1, EU up 0.3 qoq
Eurozone GDP grew 0.1% qoq in Q1, matched expectations. EU GDP rose 0.3% qoq.
Among the Member States for which data are available for the first quarter of 2023, Portugal (+1.6%) recorded the highest increase compared to the previous quarter, followed by Spain, Italy and Latvia (all +0.5%). Declines were recorded in Ireland (-2.7%) as well as in Austria (-0.3%). The year-on-year growth rates were positive for all countries except for Germany (-0.1%).
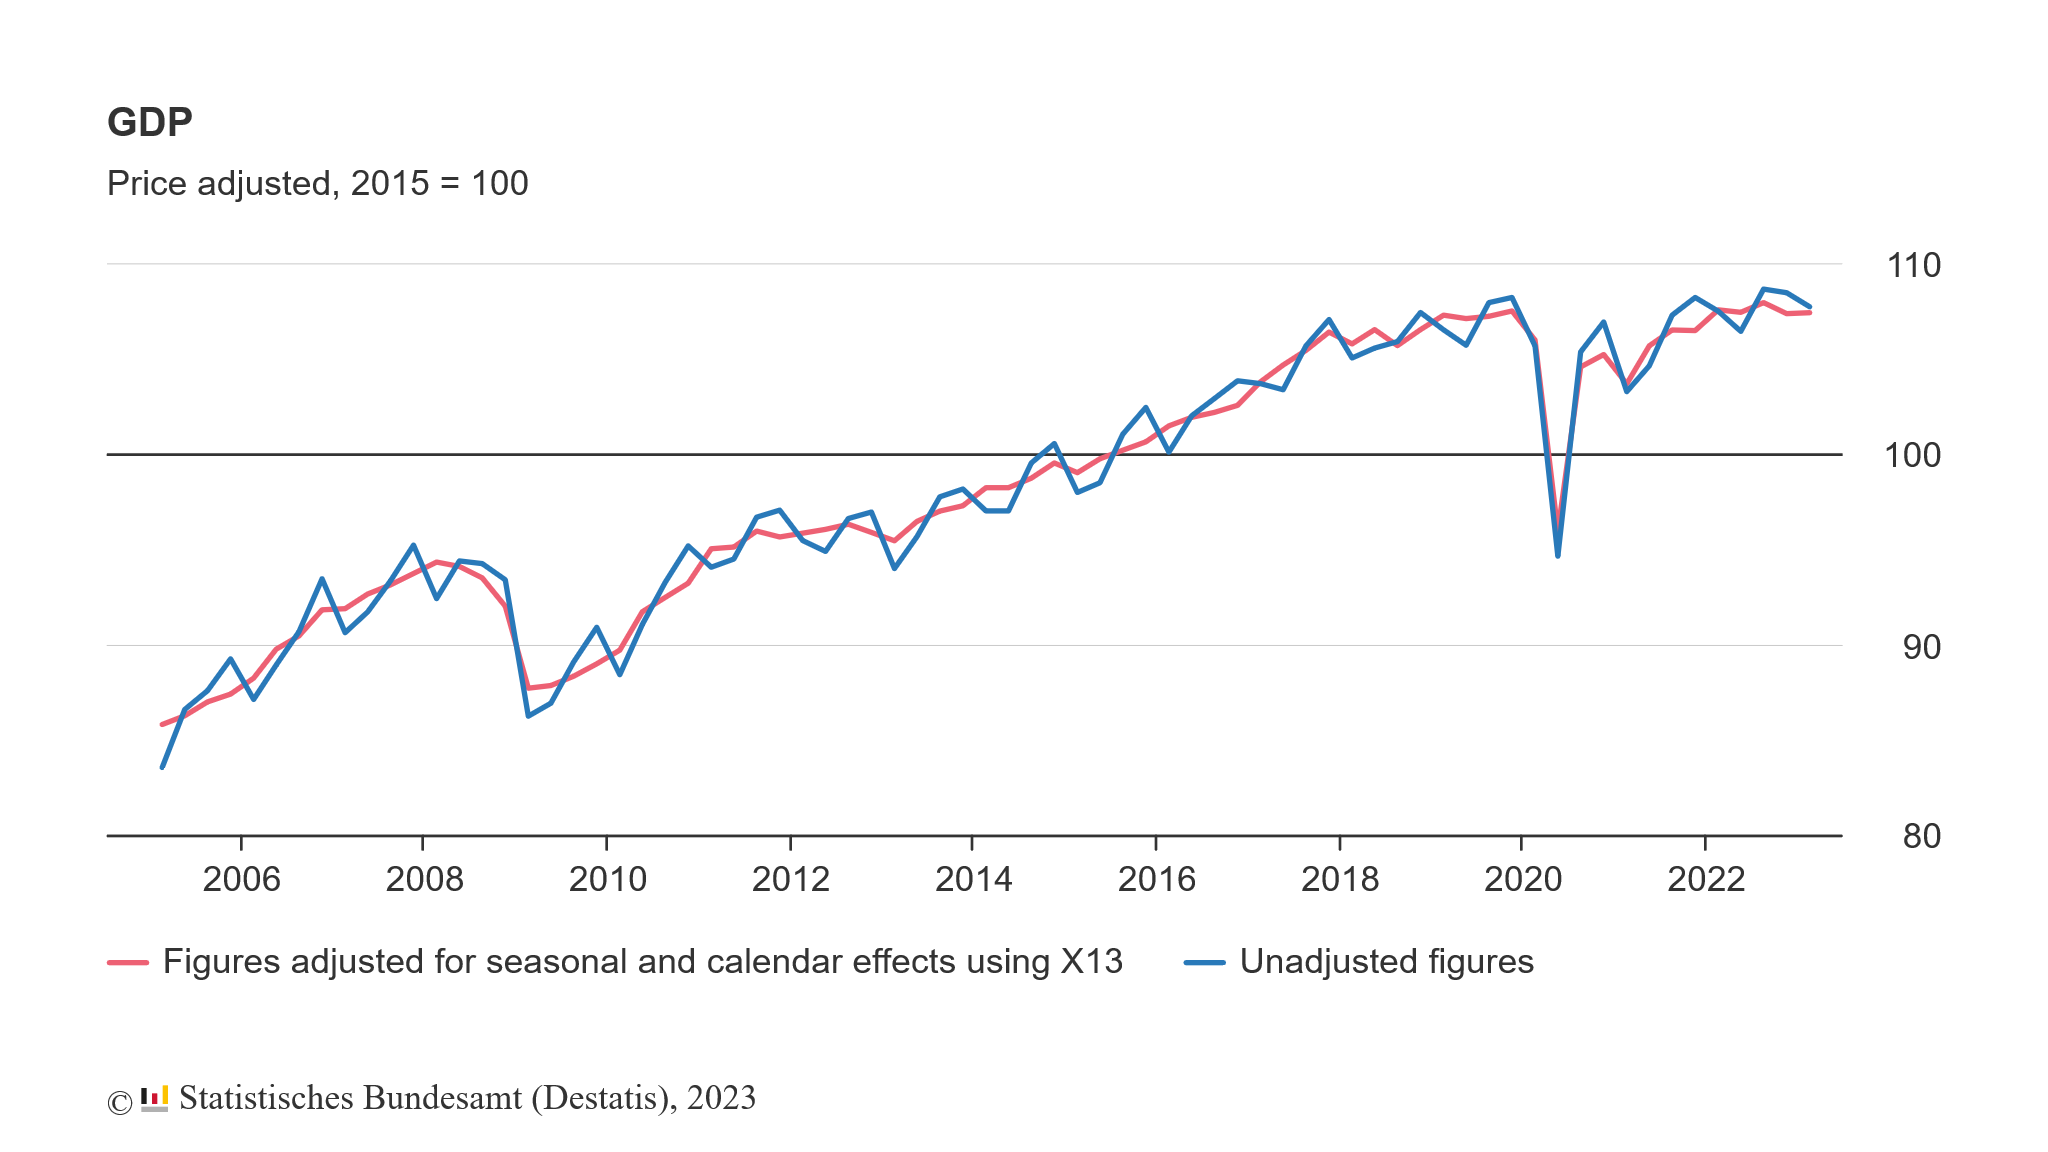
Germany GDP stalled in Q1, worst than expectations
Germany GDP stalled in Q1 (price, seasonally and calendar adjusted), below expectation of 0.1% qoq growth. GDP was up a price adjusted 0.2% compared with the first quarter of 2022. The price and calendar adjusted GDP was -0.1% lower because there was one working day more than in the same period a year earlier.
The final consumption expenditure of both households and government declined at the beginning of 2023, according to the Federal Statistical Office (Destatis). Positive contributions, in contrast, came from capital formation and exports.
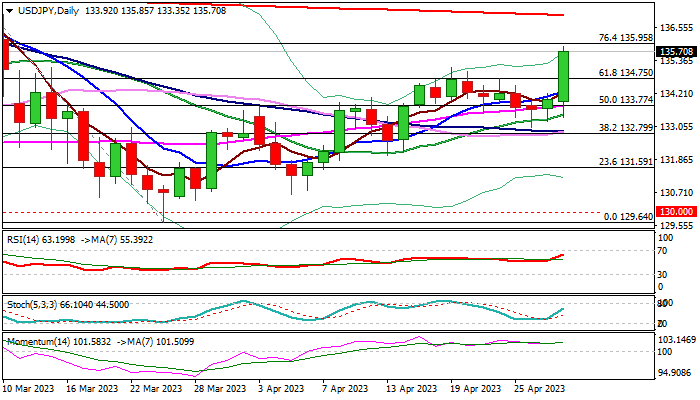
USD/JPY: Surges on BOJ’s Decision to Keep its Ultra-Loose Policy Unchanged
The USDJPY jumped 1.5% following BoJ policy decision, hitting a seven-week high in early Friday’s trading.
The central bank’s first meeting under new governor Ueda resulted in a widely expected decision of keeping ultra-low policy unchanged, but modified its future guidance, signaling a broad review of the monetary policy over time.
New governor showed he is not in rush to start withdrawing current monetary stimulus and tightening the policy, despite warning signals from unexpected rise in consumer inflation in Tokyo, which increases pressure on the central bank.
Fresh acceleration pushed the USDJPY pair through pivotal Fibo barrier at 134.75 (61.8% of 137.90/129.64) which repeatedly capped the action since mid-March, signaling continuation of the uptrend from 129.64 (Mar 24 low).
Bulls so far show no signs of fatigue and pressure target at 135.95 (Fibo 76.4%), the last significant obstacle on the way towards key barriers at 136.98 (200DMA) and 137.90 (Mar 8 peak).
Daily studies maintain strong positive momentum and MA’s turned to bullish configuration, supporting the advance, while the pair is on track for the third consecutive bullish weekly close, which additionally brightens near-term outlook.
Bulls will look for confirmation on Friday’s close above former high at 135.13 to keep in play preferred near-term dip-buying strategy.
Only return and close below 134.75 Fibo level would weaken near-term structure on signals of false break higher and a bull-trap.
Res: 135.95; 136.98; 137.35; 137.90.
Sup: 135.13; 134.75; 134.09; 133.77.
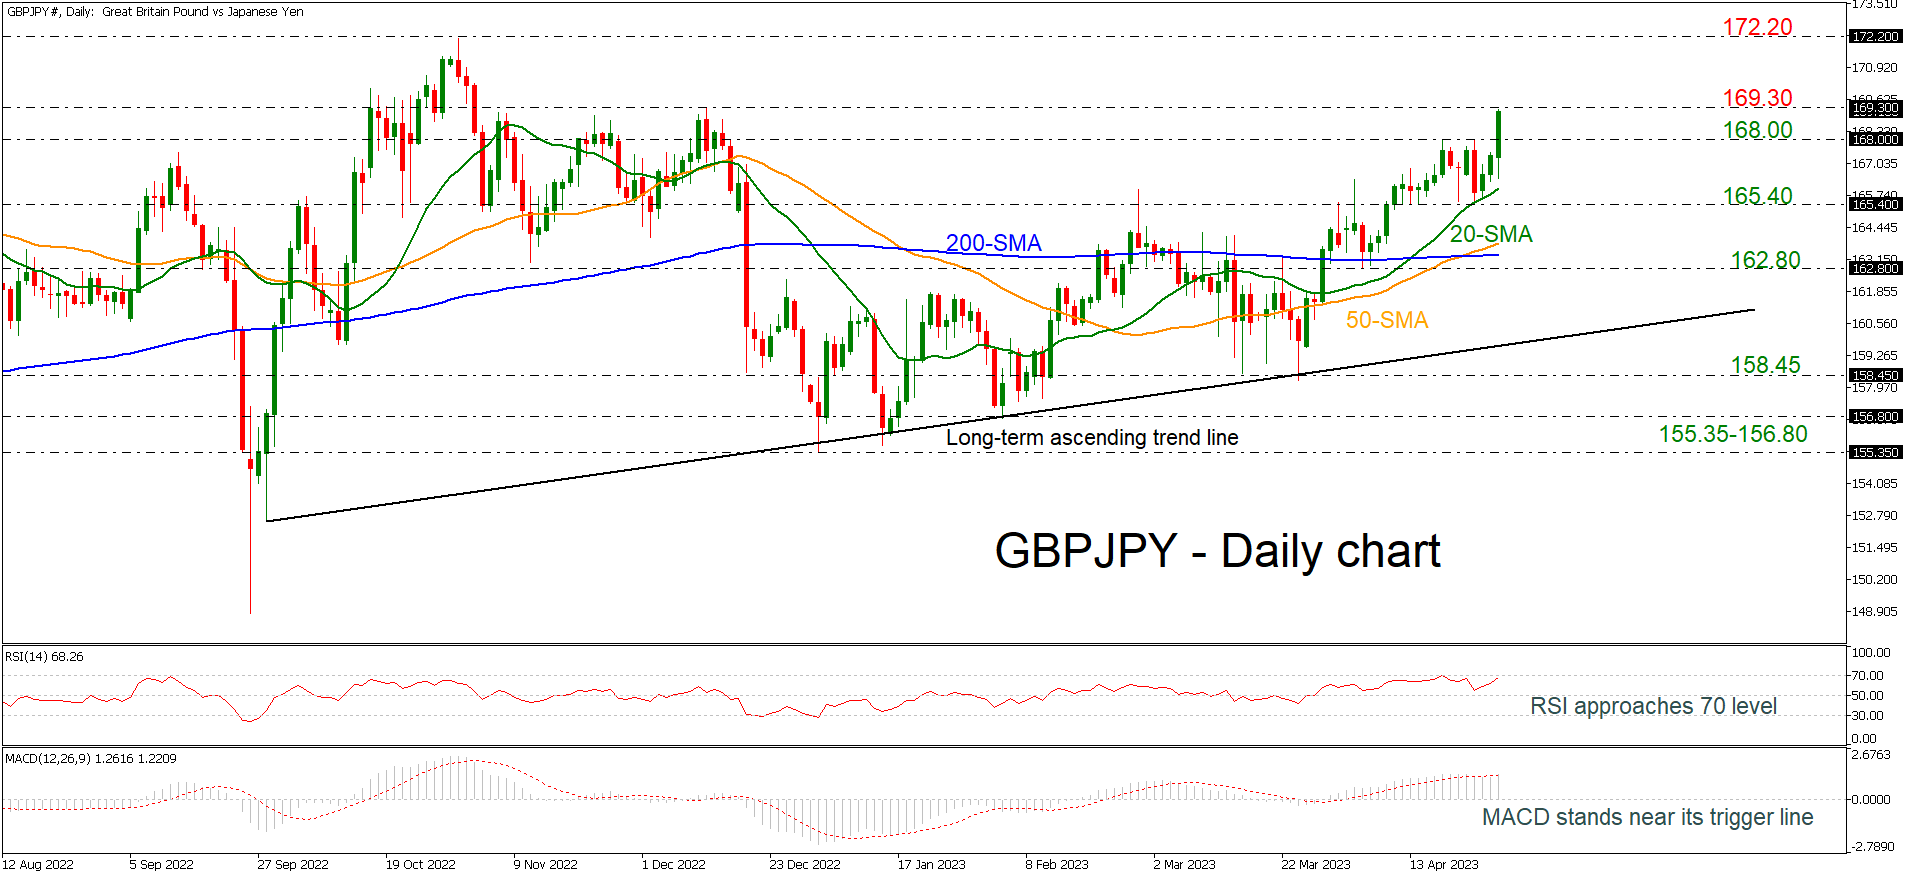
GBPJPY Flies to New High Above 169.00
GBPJPY is rallying above the 169.00 psychological mark, recording a new four-month high. The rebound off the 20-day simple moving average (SMA) and the 165.40 support is endorsing the bullish outlook in the long-term. The RSI is approaching the 70 level, while the MACD is moving sideways near its trigger line and well above the zero level.
The 169.30 number, where the high from December 2022 lies could challenge any bullish attempts before resting near the next 172.20 resistance level.
Alternatively, an extension below the 20-day SMA of 166.00 and the 165.40 barrier may strengthen the case of a down-trending market in the short-term, hitting the 50- and the 200-day SMAs at 163.75 and 163.35 respectively. Failure to hold above that floor could cause another negative extension towards 162.80 before meeting the uptrend line at 160.00.
In brief, the fresh four-month high has upgraded the long-term outlook to strongly bullish.
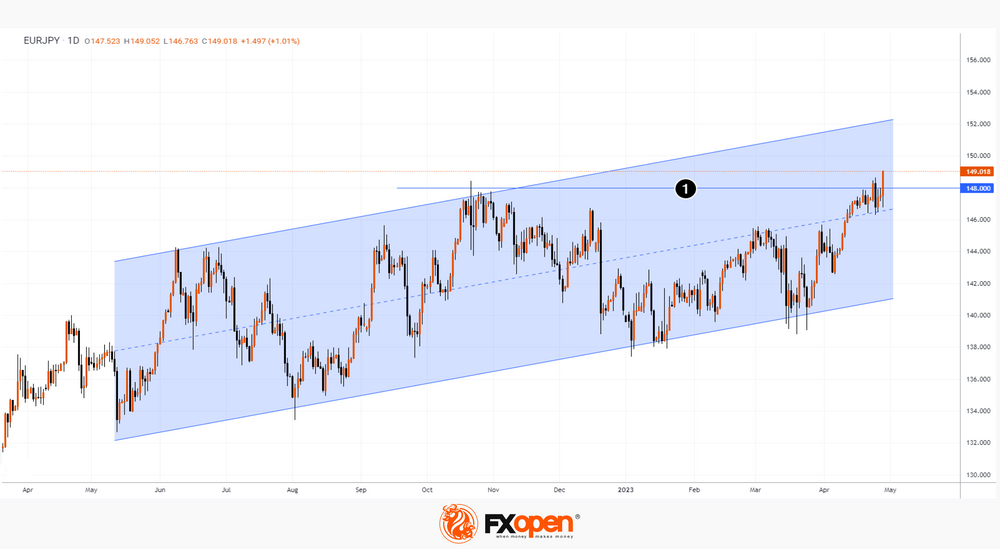
EURJPY Climbs to Its Highest in Over 8 Years
On Friday morning, the EURJPY rose above 149 yen per euro on news from Japan. There, unemployment rose to 2.8% (expected 2.5%, last month 2.6%, a year ago 2.6%), it was higher only in the summer of 2021 (2.9%).
Market participants also followed the meeting of the Bank of Japan, which is now managed by Kazuo Ueda. As expected, the Bank of Japan said it would maintain ultra-low interest rates. However, at the same time it became known that the bank will conduct a "broad review of monetary policy."
It is possible that this revision will lay the groundwork for Kazuo Ueda's phasing out of the massive stimulus program pursued by his predecessor.
Perhaps the level of 148 yen per euro (1), which previously served as resistance, will now become a support for the bulls to try to break through the psychological mark of 150 yen per euro. In 2014, this mark turned out to be unattainable for them.
Bitcoin Bulls Battle for the USD 30k Psychological Level
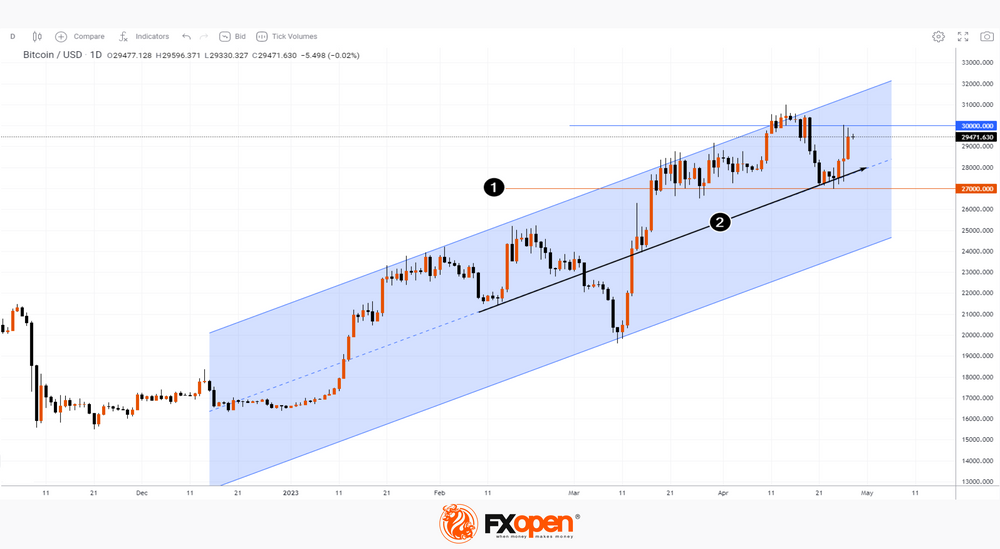
The last few days have been volatile for cryptocurrency traders. The BTCUSD rate fell to the USD 27k support line and rose to USD 30k.
Bullish sentiment was fueled by new fears in the banking sector: First Republic Bank’s Q1 report showed a significant outflow of deposits, although earlier USD 30 billion was poured into the bank to calm depositors. WSJ writes about the lack of a simple solution. Stocks plummeted more than 50%, eroding confidence in the banking sector but boosting confidence in cryptocurrencies.
The bearish mood was driven by:
→ the news about the requirements of the US Internal Revenue Service (IRS) to the Kraken cryptocurrency exchange to issue the data of its users to the court. The Kraken exchange refused to comply with the requirements, believing that the IRS had gone beyond what was permitted.
→ the Bitrue Incident: A technical glitch caused the XRP price to drop to zero, resulting in the liquidation of its clients' positions.
Looking at the BTCUSD chart, it can be noted that the psychological level of USD 30k looks like a serious resistance. But with support from the USD 27k level (1) and the median line of the rising channel (2), the bulls may try to take a new assault.
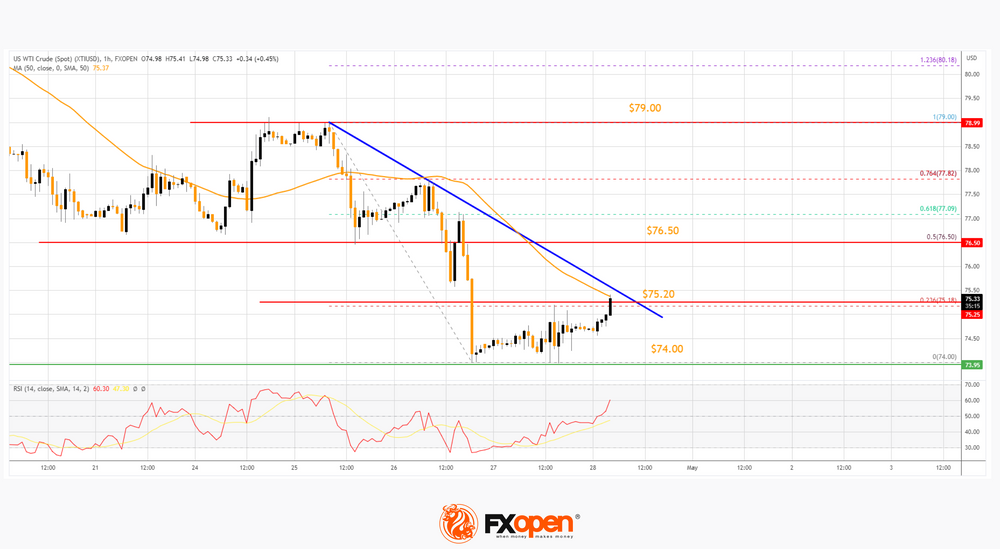
Gold Price and Crude Oil Price Face Key Hurdles
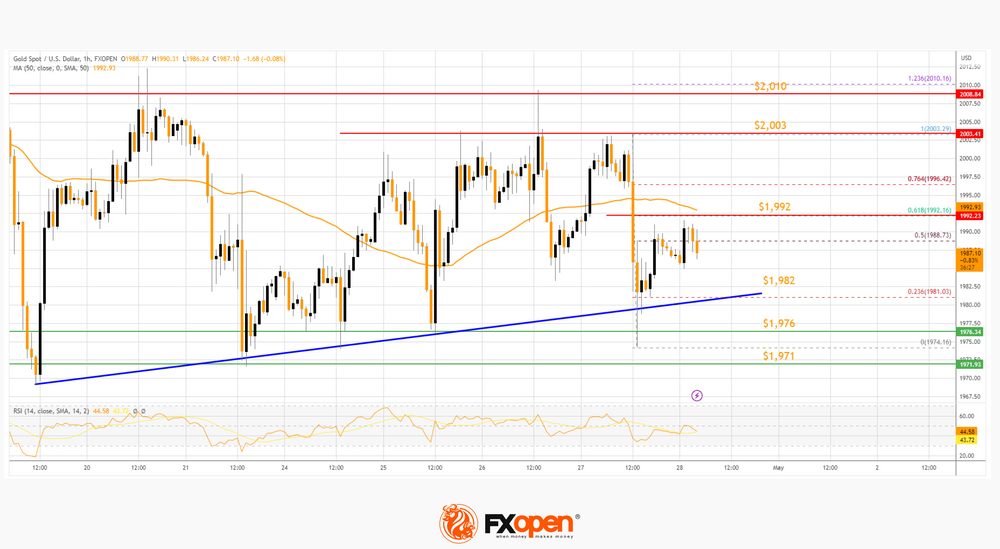
Gold price is struggling to gain momentum above the $2,003 resistance. Crude oil price is consolidating losses and struggling to recover above $75.20.
Important Takeaways for Gold and Oil
- Gold price seems to be trading in a range below the $2,010 resistance against the US Dollar.
- A key bullish trend line is forming with support near $1,982 on the hourly chart of gold at FXOpen.
- Crude oil prices declined heavily below the $79.00 and $76.50 support levels.
- There is a major bearish trend line forming with resistance near $75.20 on the hourly chart of XTI/USD at FXOpen.
Gold Price Technical Analysis
On the hourly chart of Gold at FXOpen, the price formed a base above the $1,976 support zone. The price started a decent increase and was able to clear the $2,003 resistance zone.
However, the bears were active near the $2,010 resistance. There were more than two attempts to clear the $2,010 resistance but the bulls failed. It reacted to the downside and retested the $1,976 support.
The price is now rising and trading near the 50% Fib retracement level of the recent decline from the $2,003 swing high to the $1,974 low. Initial support on the downside is near a key bullish trend line at $1,982.
The first major support is near the $1,976 level. The main support sits near the $1,971 level. If there is a downside break below the $1,971 support, the price might decline heavily.
The next major support is near $1,960, below which the bulls could aim for a test of $1,950. On the upside, the bulls are facing resistance near the 50-hour simple moving average at $1,992. It coincides with the 61.8% Fib retracement level of the recent decline from the $2,003 swing high to the $1,974 low.
An upside break above the $1,992 resistance could send the price toward $2,003. Any more gains may perhaps set the pace for an increase toward the $2,010 level.
Oil Price Technical Analysis
On the hourly chart of Crude Oil at FXOpen, the price started a fresh decline from well above $80.00 against the US Dollar. The price declined heavily below the $76.50 support zone.
Finally, it tested the $74.00 support zone. A low is formed near $74.00 and the price is now attempting a recovery wave. It is testing the 23.6% Fib retracement level of the downward move from the $79.00 swing high to the $74.00 low.
There is also a major bearish trend line forming with resistance near $75.20 and the 50-hour simple moving average. An upside break above the trend line resistance might send the price further higher.
The first major resistance is near the 50% Fib retracement level of the downward move from the $79.00 swing high to the $74.00 low at $76.50, above which the price might accelerate higher toward $79.00. Any more gains might send the price toward the $80.00 level in the coming days.
On the downside, support is near the $74.00 level. The next major support is near $72.50. If there is a downside break, the price might decline toward $70.00. Any more losses may perhaps open the doors for a move toward the $68.00 support zone.