Sample Category Title
EUR/USD Technical Analysis
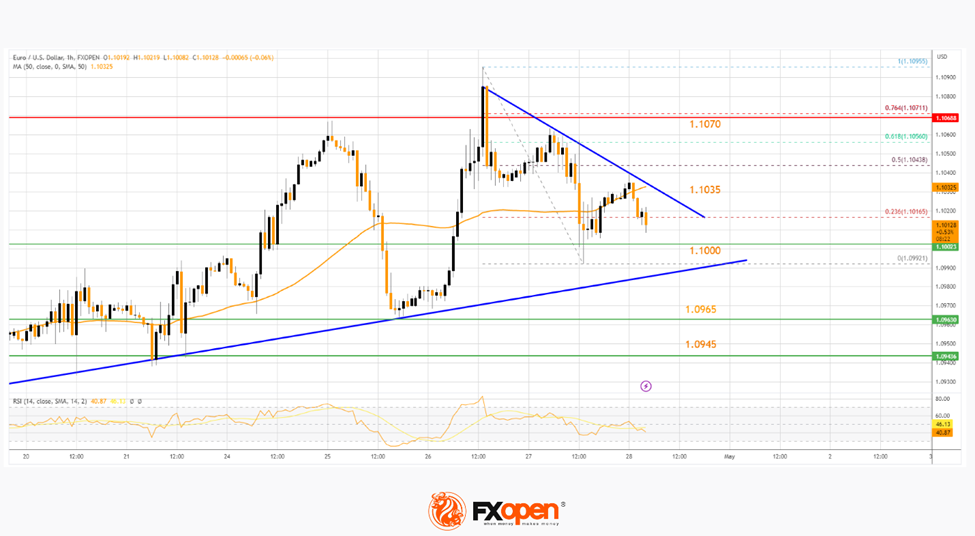
On the hourly chart of EUR/USD at FXOpen, the pair failed to clear the 1.1070 resistance and reacted to the downside. The Euro declined below the 1.1035 support against the US Dollar.
The pair tested the 1.1000 support and is currently showing a few bearish signs. On the upside, immediate resistance is near a connecting bearish trend line at 1.1035 and the 50-hour simple moving average.
The next major resistance is near the 1.1070 level. A break above the 1.1070 resistance zone could start a decent increase. In the stated case, it could rise toward the 1.1120 resistance.
Conversely, the pair might resume its decline from the 1.1035 level. Initial support is near the 1.1000 zone. The next major support is near 1.0965. Any more losses might resend the pair toward the 1.0945 support in the near term.
Nasdaq Bounces Back
NZD/USD tests critical floor
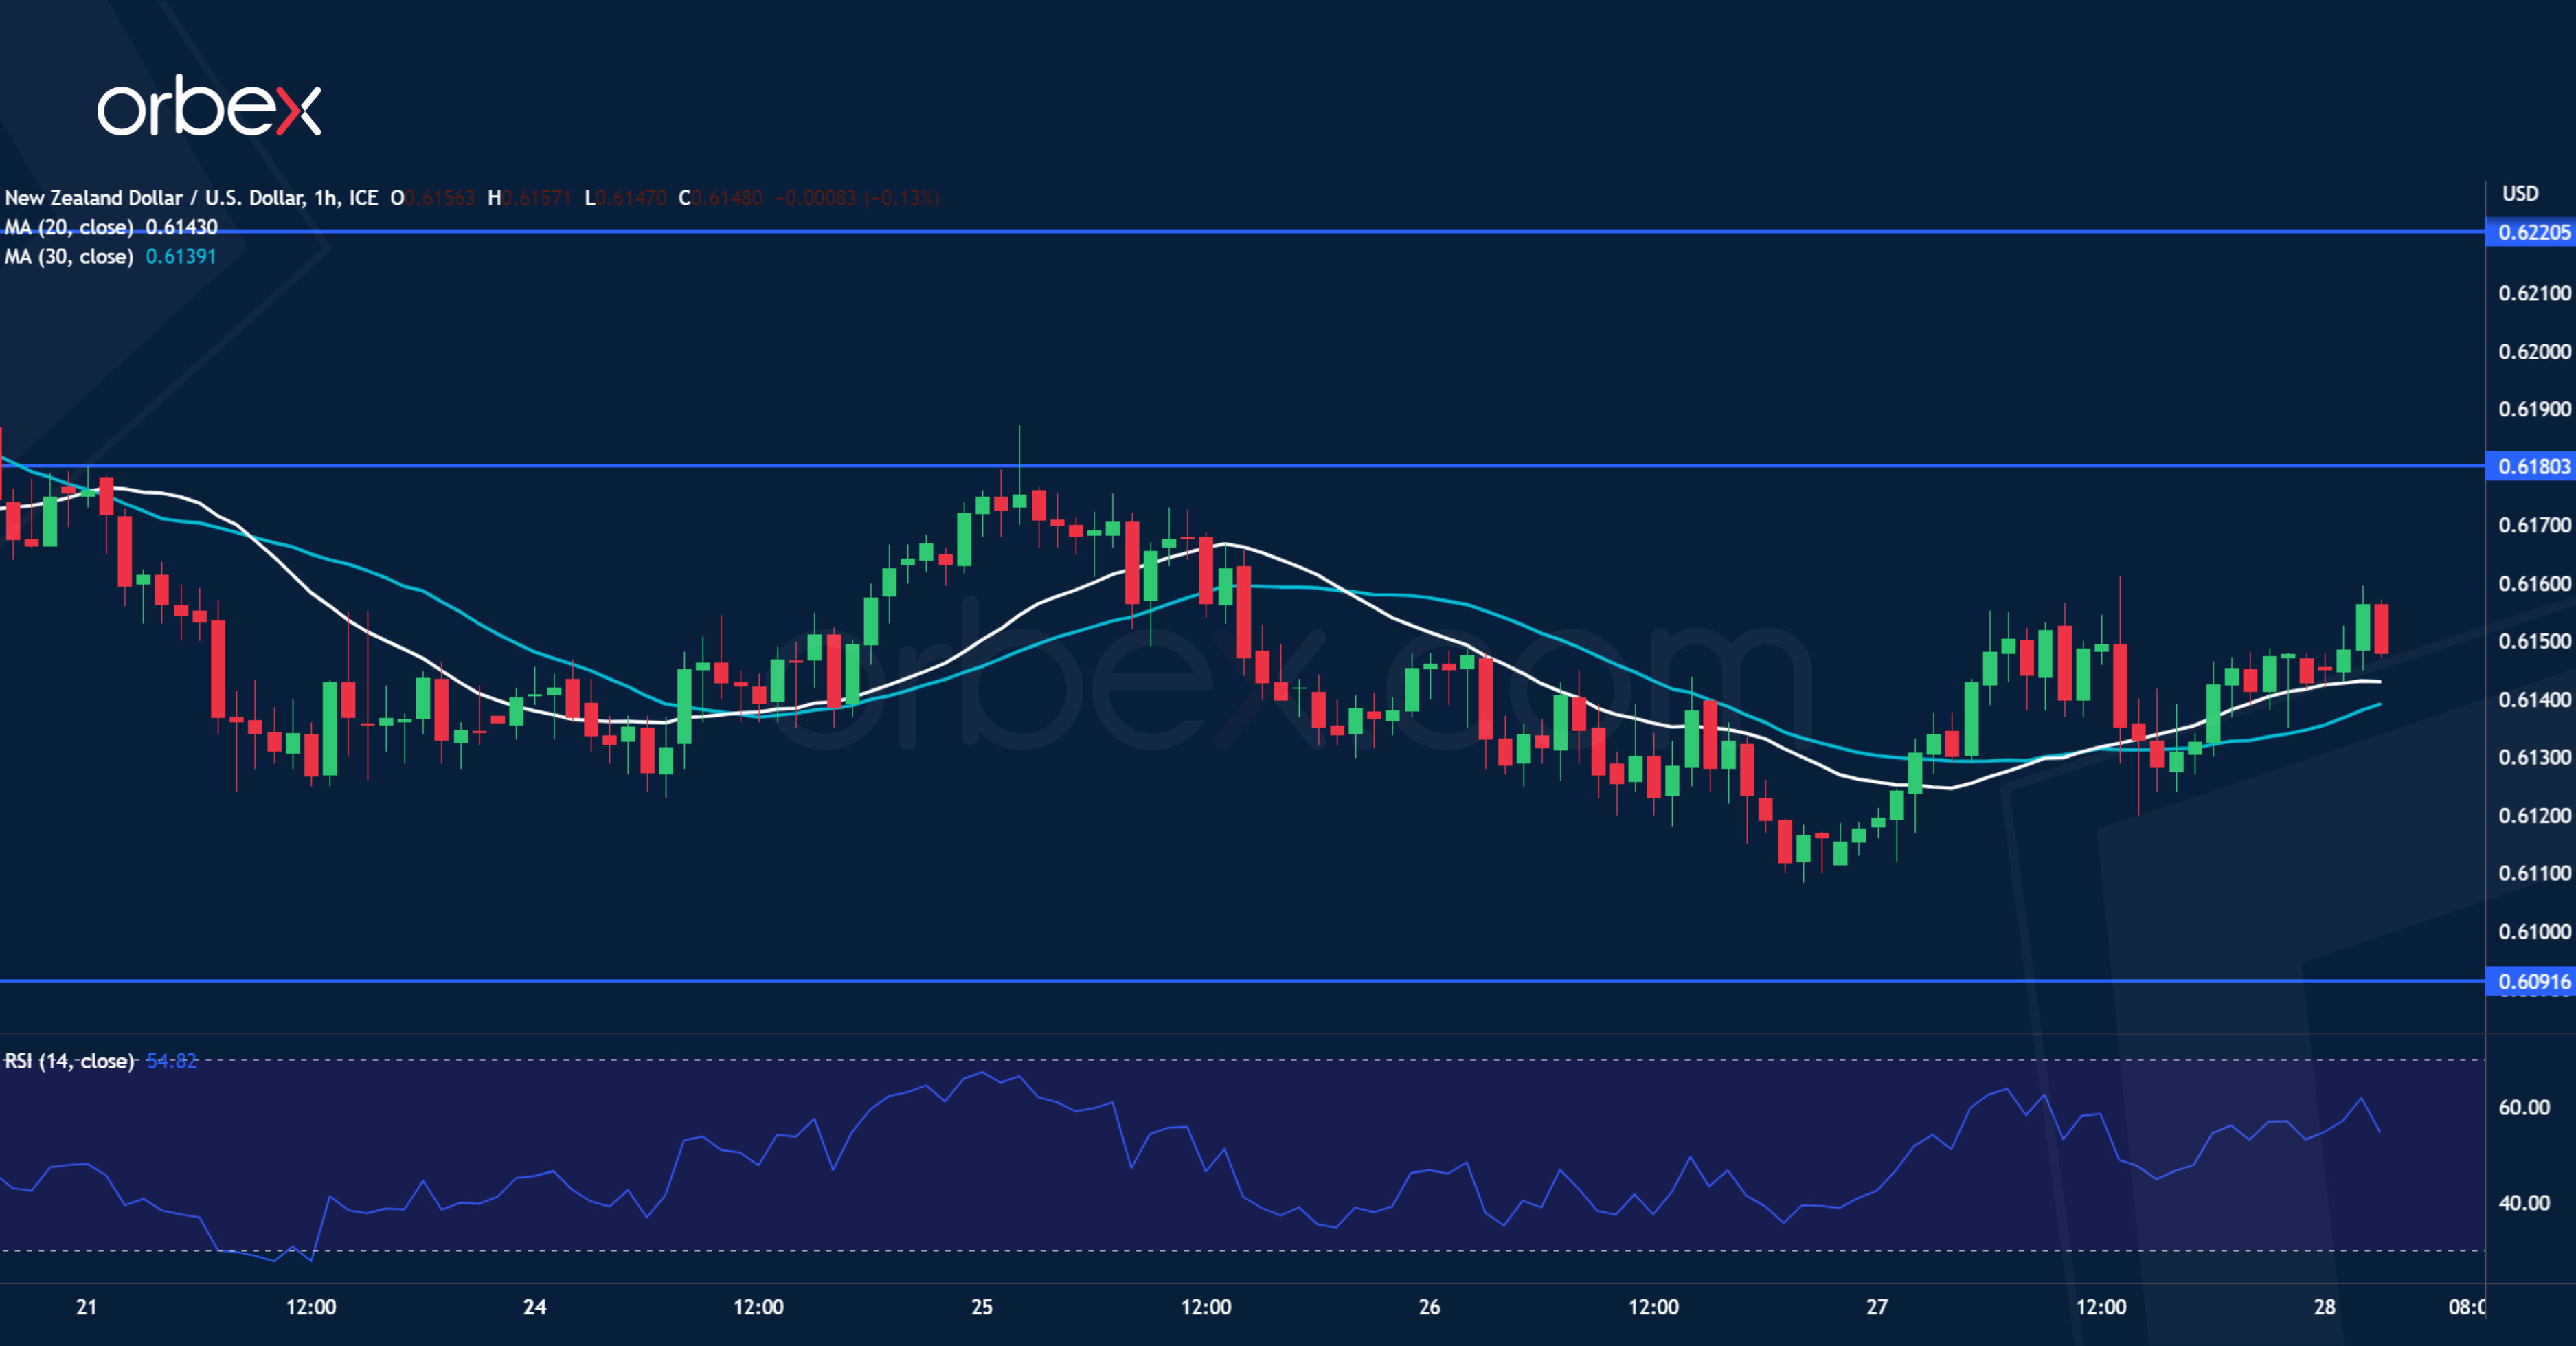
The US dollar advanced as the core PCE accelerated in Q1. The pair is hovering above the daily support of 0.6090 as kiwi buyers struggle to hold on to their gains. Rebounds have been capped so far which indicates a growing downward pressure. A bearish breakout would trigger a broader sell-off as trapped bulls scramble for the exit and lead to a correction below the psychological level of 0.6000. On the upside, 0.6180 is the first hurdle and only a close above the support-turned-resistance of 0.6220 would turn sentiment around.
EUR/JPY tests resistance
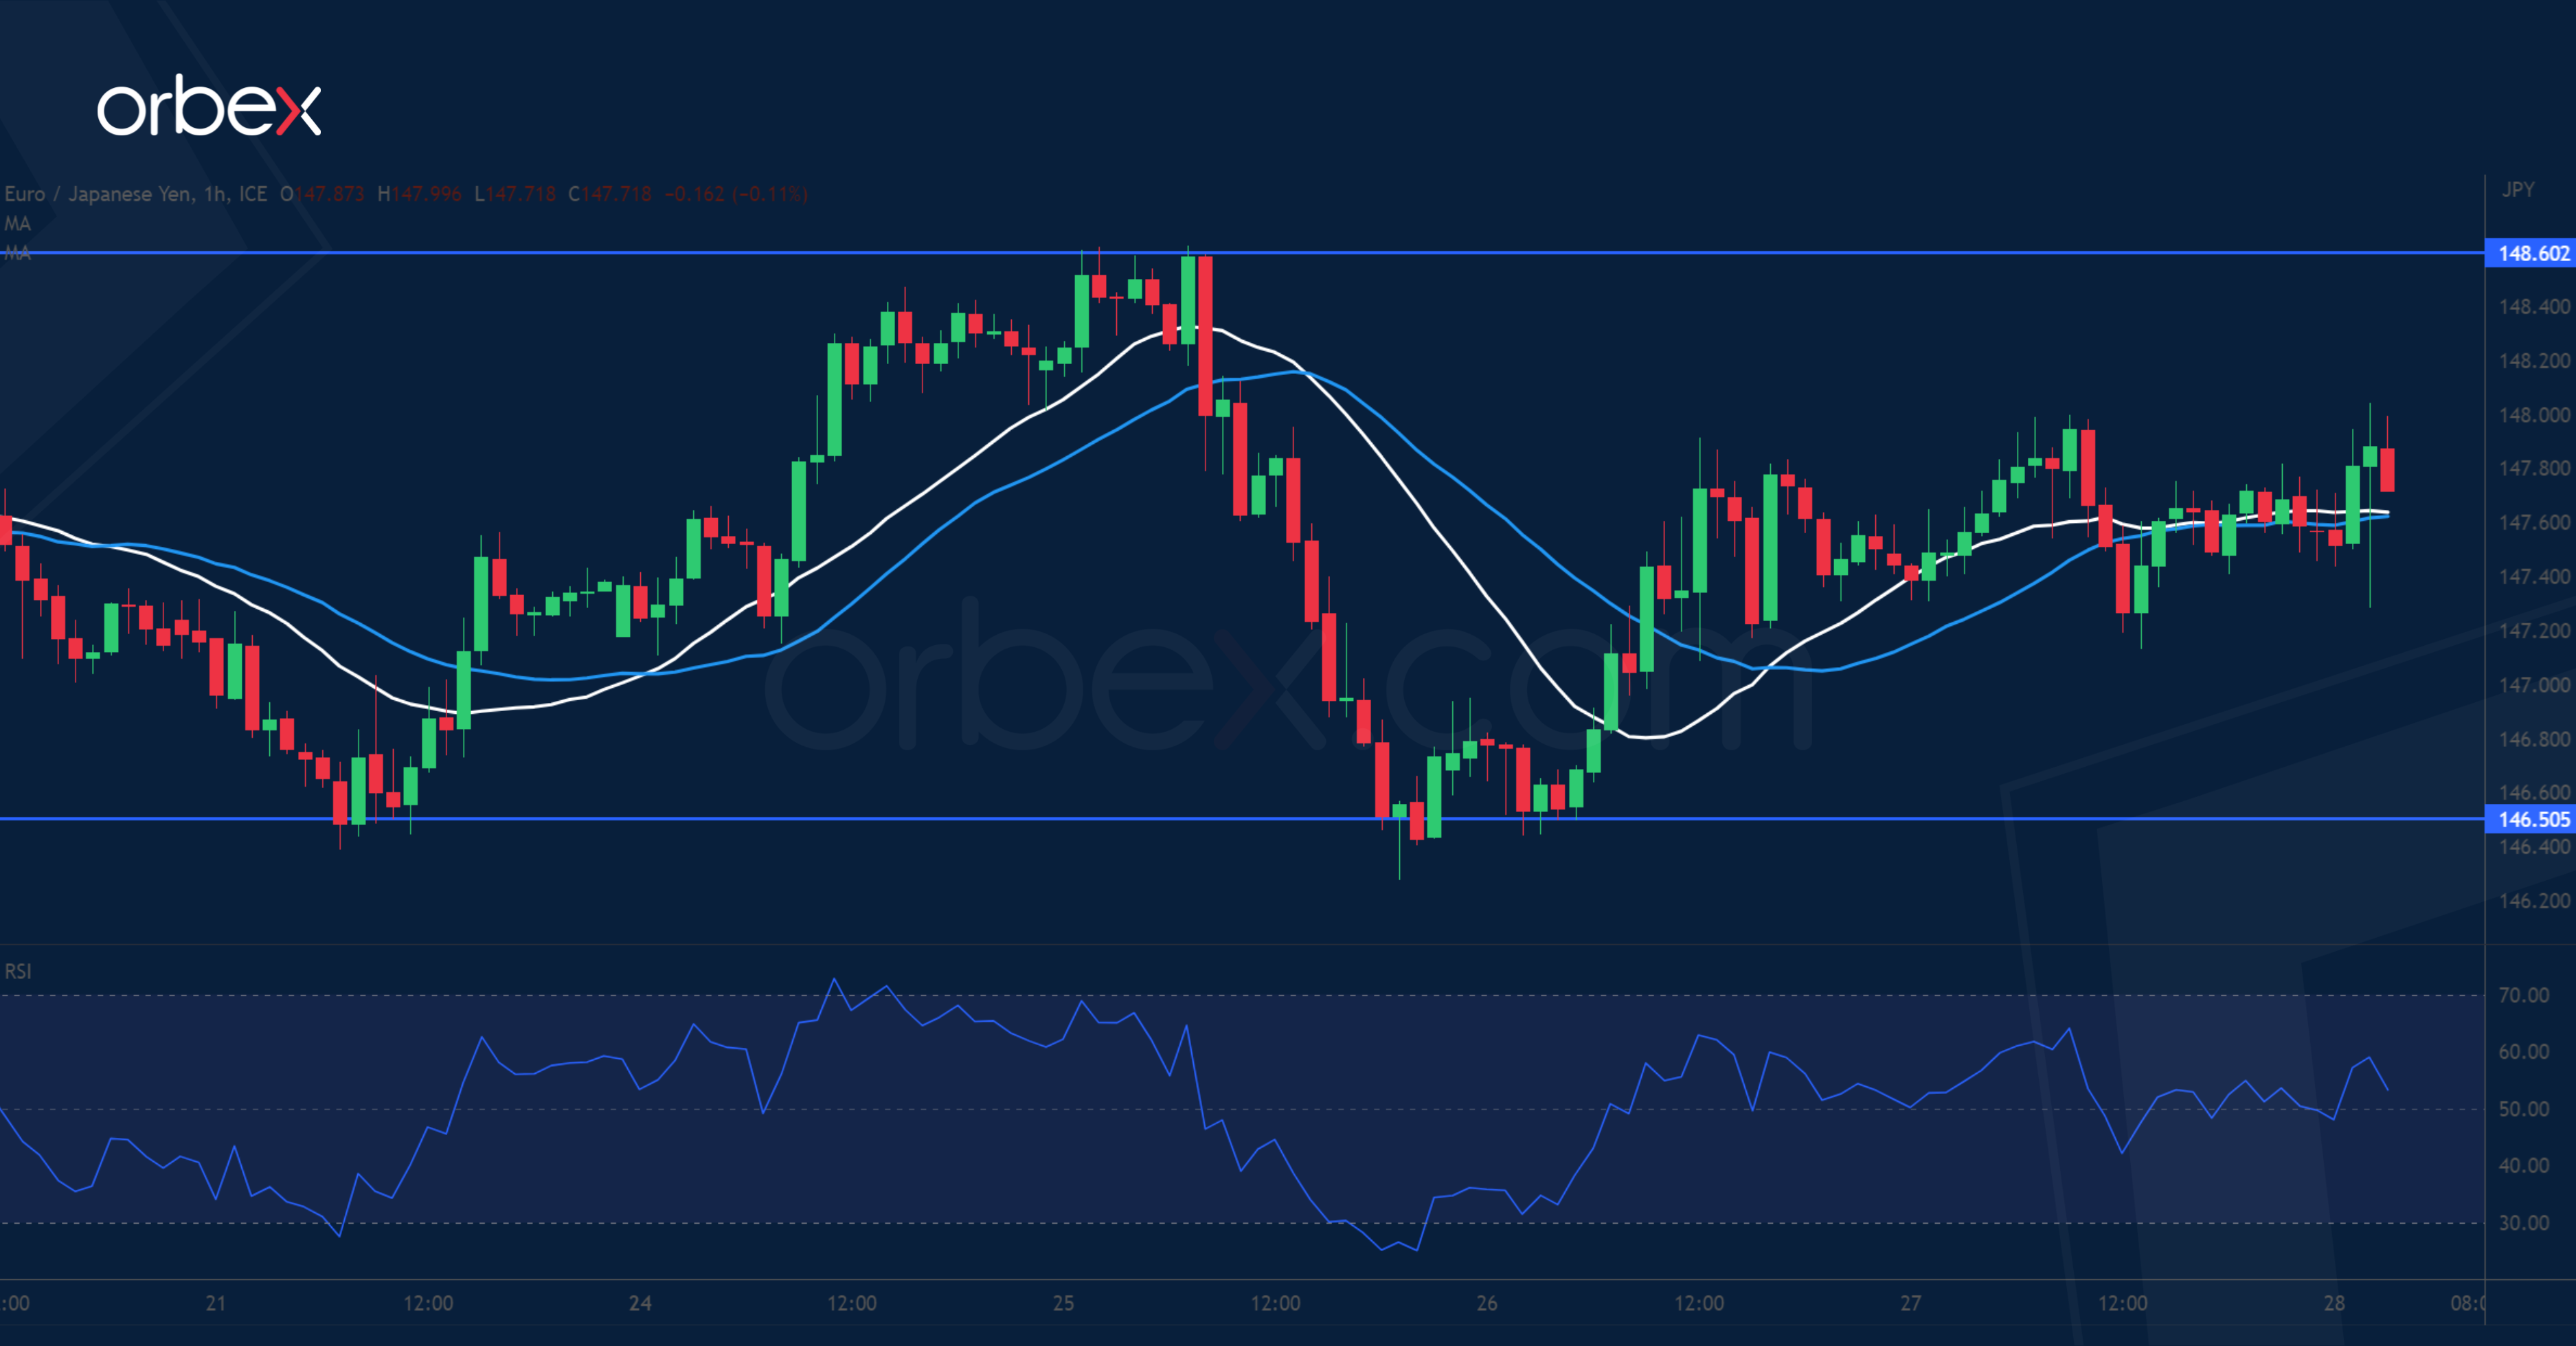
The Japanese yen recoups some losses as April’s CPI in the Tokyo area beat expectations. On the daily chart, the single currency is consolidating its gain after rising above October 2021’s high of 147.70. An attempt below 146.50 has shaken out some weaker hands but the overall upward direction remained intact. This level near the 20-day SMA is important in keeping the current bullish momentum going or a deeper retracement could be in order. A break above the recent peak at 148.60 would resume the uptrend.
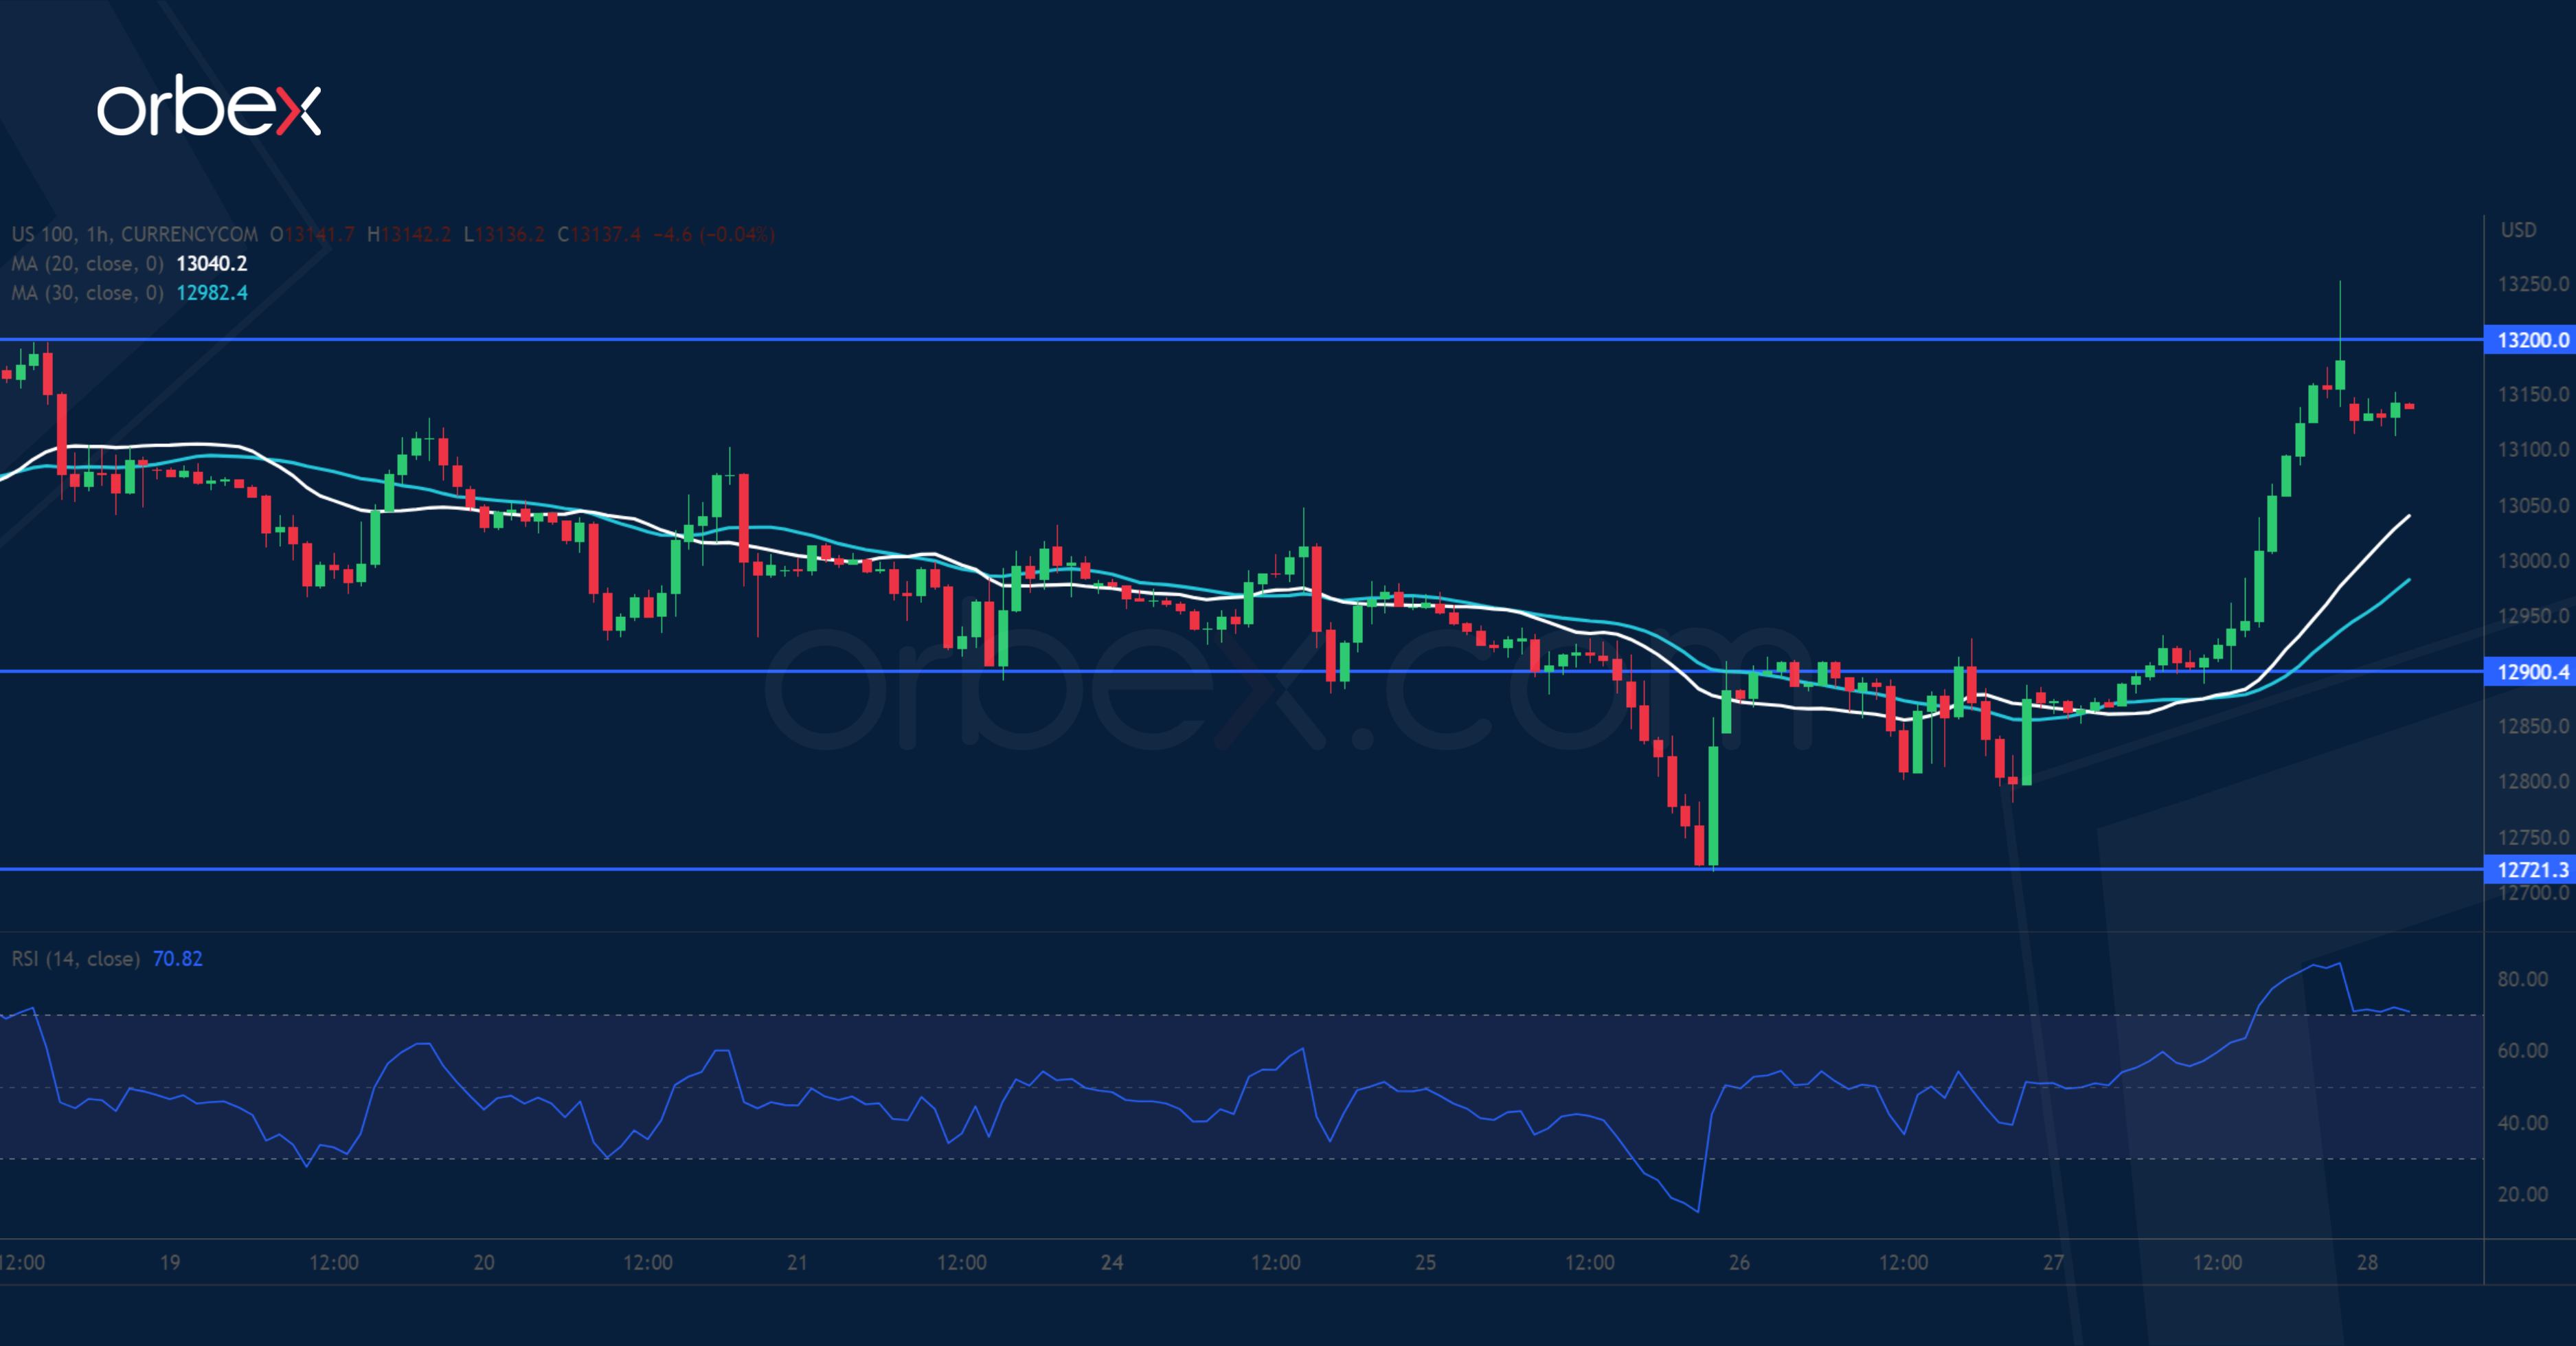
Nasdaq100 breaks higher
The Nasdaq 100 surged as megacap tech companies reported upbeat results. The medium-term prospect remained upbeat after the price cleared the February high of 12800. This means that the latest pullback would be short-lived and the bulls have seen it as an opportunity to accumulate. As a fresh bullish drive takes out 13030, weakening the selling impetus in the process, a close above 13200 would pave the way for a bullish continuation to 13700. With the RSI shooting into the overbought area 12900 is the first support.
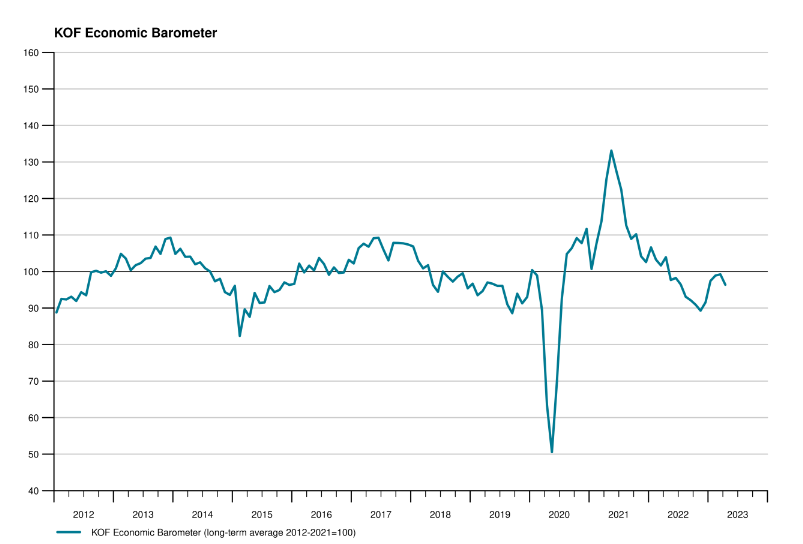
Swiss KOF dropped to 96.4, the economy cannot find its footing
Swiss KOF Economic Barometer dropped from 99.2 to 96.4 in April, dipping slightly lower under its medium-term average value. KOF said, "at the moment, the Swiss economy cannot really find its footing."
The majority of the indicator bundles are affected by the softening. In particular, the indicators for manufacturing, services, hospitality and private consumption. In contrast, the outlook for foreign demand is stable and that for financial and insurance services is brightening.
USD/JPY Daily Outlook
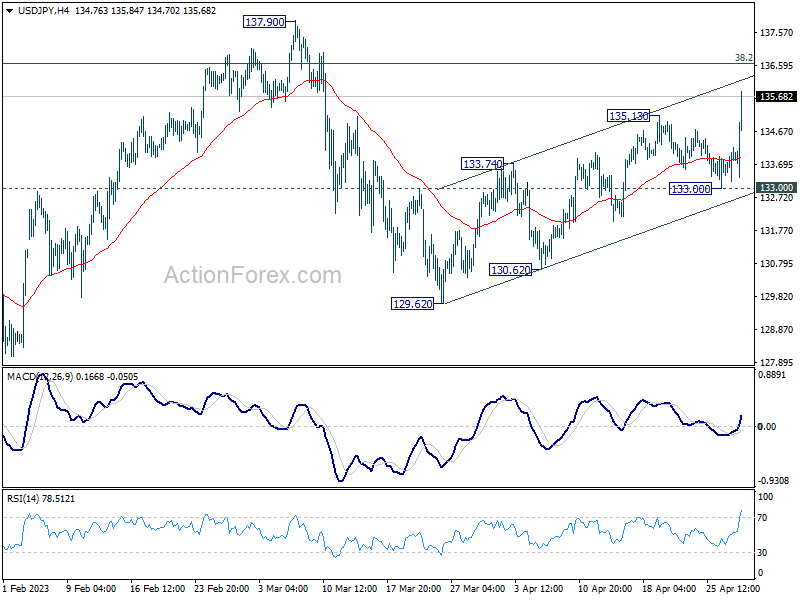
Daily Pivots: (S1) 133.42; (P) 133.81; (R1) 134.38; More...
USD/JPY's rebound from 129.62 resumed by breaking through 135.13 resistance today. Intraday bias is back on the upside with focus on near term channel resistance (now at 136.17). Sustained break there will raise the chance of resumption of whole rise from 127.20, and target 137.90 resistance and above. For now, further rally will remain in favor as long as 133.00 support holds, in case of retreat.
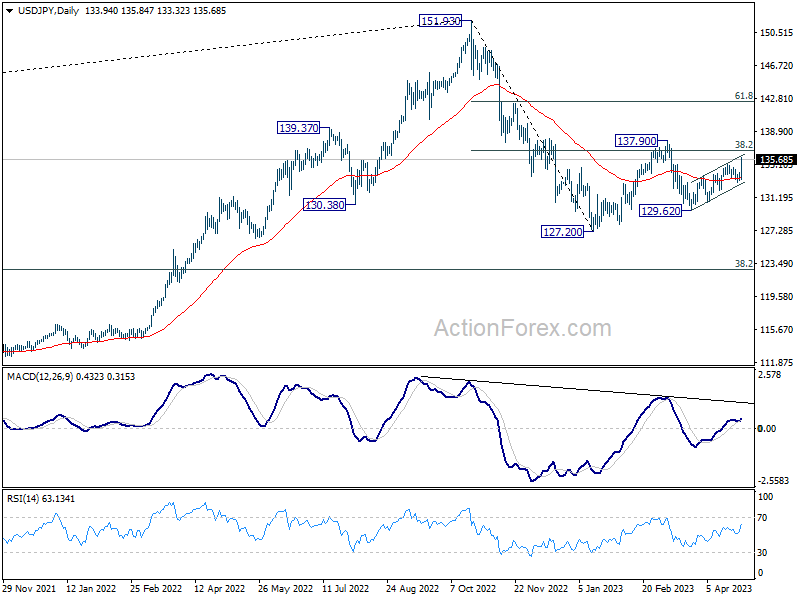
In the bigger picture, price actions from 151.93 high are currently seen as a corrective pattern to the long term up trend. The first leg should have completed at 127.20. Rebound from there is seen as the second leg. Sustained break of 31.8% retracement of 151.93 to 127.20 at 136.34 will bring stronger rebound to 142.48. Meanwhile, break of 129.62 will argue that the third leg is starting to 61.8% projection of 151.93 to 127.20 from 137.90 at 122.61.
USD/CHF Daily Outlook
Daily Pivots: (S1) 0.8905; (P) 0.8941; (R1) 0.8978; More...
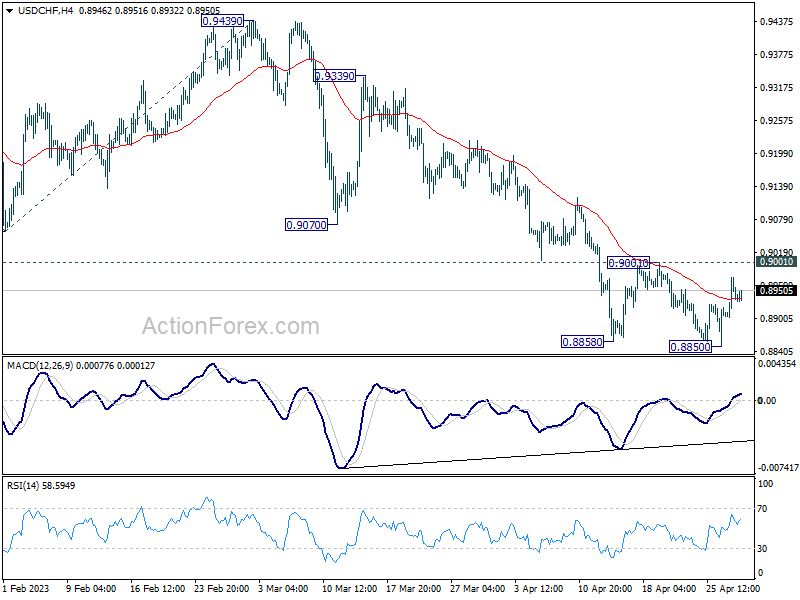
Intraday bias in USD/CHF remains neutral at this point, and outlook is unchanged. On the upside, decisive break of 0.9001 resistance should confirm short term bottoming at 0.8850. Intraday bias will be back on the upside 55 D EMA (now at 0.9120). Sustained break there will be a strong sign of bullish reversal. On the downside, break of 0.8850 will resume larger fall from 1.0146, to 61.8% projection of 1.0146 to 0.9058 from 0.9439 at 0.8767, which is close to 0.8756 long term support. Strong support is expected there to bring rebound, at least on first attempt.
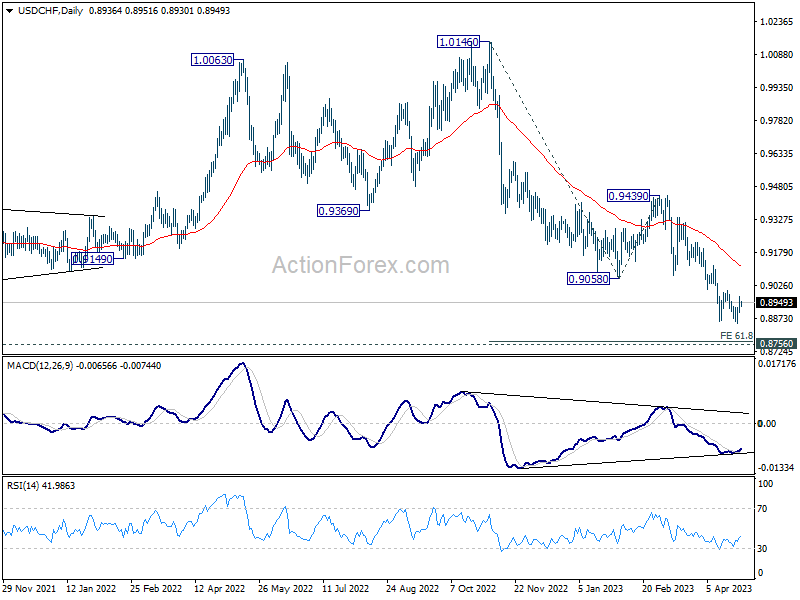
In the bigger picture, fall from 1.1046 (2022 high) is in progress for 0.8756 support (2021 low). But overall, this fall is still seen as a leg in the long term range pattern from 1.0342 (2016 high). So, downside should be contained by 0.8756 to bring reversal. Sustained break of 0.9058 support turned resistance will be the first sign of medium term bottoming. However, decisive break of 0.8756 will carry larger bearish implications.
GBP/USD Daily Outlook
Daily Pivots: (S1) 1.2456; (P) 1.2479; (R1) 1.2520; More...
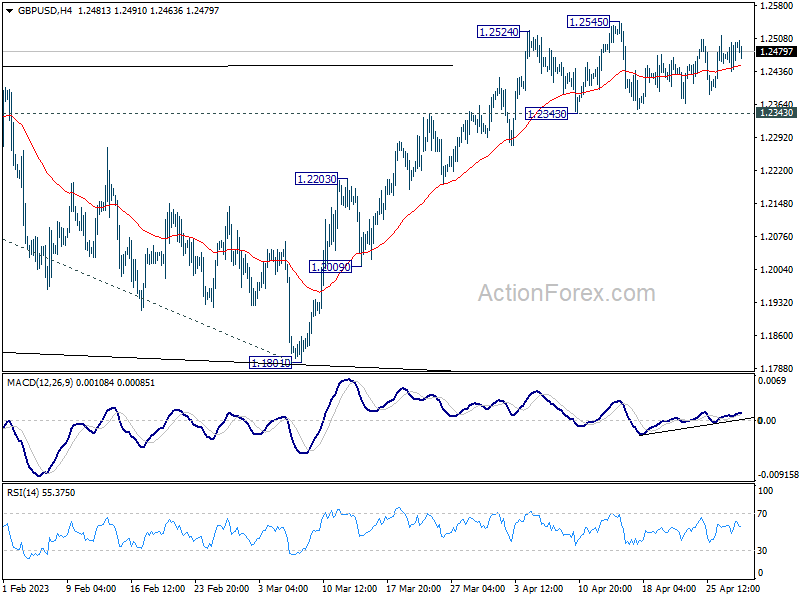
Intraday bias in GBP/USD remains neutral as consolidation from 1.2545 is still extending. Outlook remains bullish with 1.2343 support intact. On the upside, above 1.2545 will target 1.2759 fibonacci level first. Firm break there will target 61.8% projection of 1.0351 to 1.2445 from 1.1801 at 1.3095. However, considering bearish divergence condition in 4H MACD, firm break of 1.2343 will confirm short term topping, and turn bias back to the downside for deeper pullback.
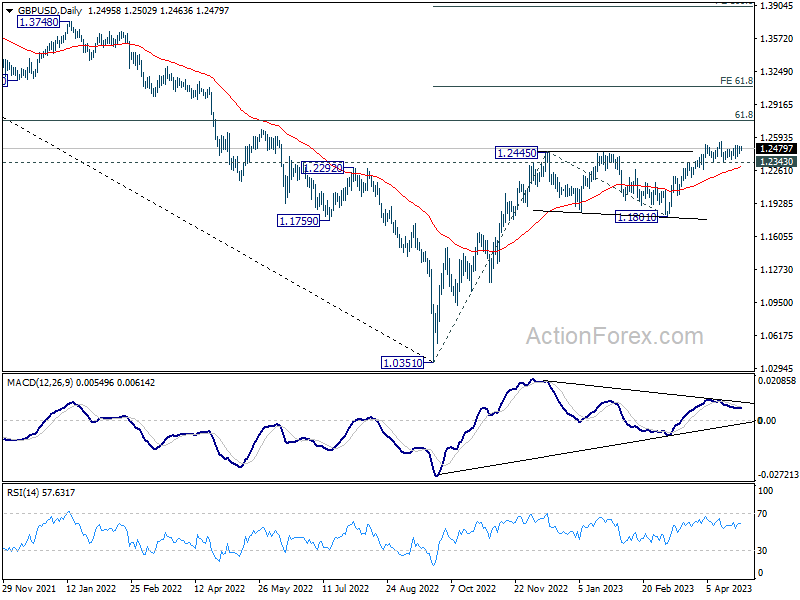
In the bigger picture, the rise from 1.0351 medium term term bottom (2022 low) is in progress for 61.8% retracement of 1.4248 (2021 high) to 1.0351 at 1.2759. Sustained break there will add to the case of long term bullish trend reversal. Further break of 61.8% projection of 1.0351 to 1.2445 from 1.1801 at 1.3095 could prompt upside acceleration to 100% projection at 1.3895. For now, this will remain the favored case as long as 1.1801 support holds, even in case of deep pull back.
EUR/USD Daily Outlook
Daily Pivots: (S1) 1.0993; (P) 1.1028; (R1) 1.1064; More...
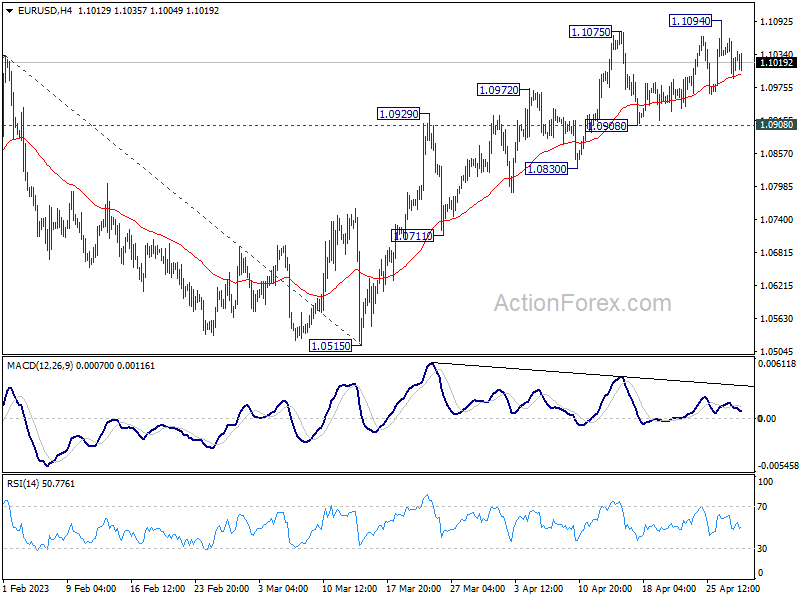
EUR/USD is still extending the consolidation pattern from 1.1094 and intraday bias remains neutral. But further rally is expected as long as 1.0908 support holds. Break of 1.1094 will resume larger up trend to 1.1273 fibonacci level. Break there will target 61.8% projection of 0.9534 to 1.1032 from 1.0515 at 1.1441.
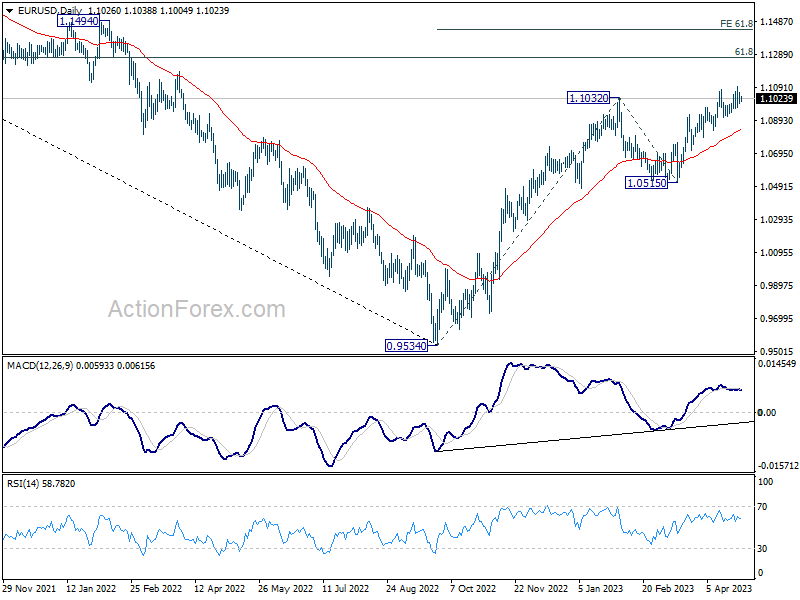
In the bigger picture, rise from 0.9534 (2022 low) is in progress for 61.8% retracement of 1.2348 (2021 high) to 0.9534 at 1.1273. Sustained break there will solidify the case of bullish trend reversal and target 1.2348 resistance next (2021 high). This will now remain the favored case as long as 1.0515 support holds, even in case of deeper pull back.
AUD/USD Daily Report
Daily Pivots: (S1) 0.6606; (P) 0.6621; (R1) 0.6645; More...
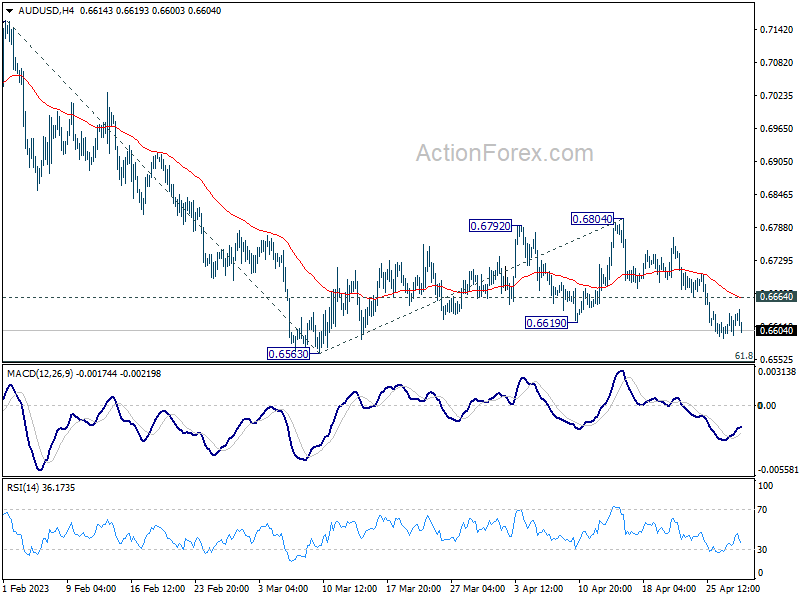
Further decline is still expected in AUD/USD with 0.6664 minor resistance intact, despite loss of downside momentum. Consolidation pattern from 0.6563 should have completed at 0.6804, and larger decline from 0.7156 is ready to resume. Firm break of 0.6563 will bring deeper decline through 0.6546 fibonacci level to 61.8% projection of 0.7156 to 0.6563 from 0.6804 at 0.6438 next. On the upside, break 0.6664 minor resistance will turn bias to the upside to extend the consolidation pattern with another rising leg.
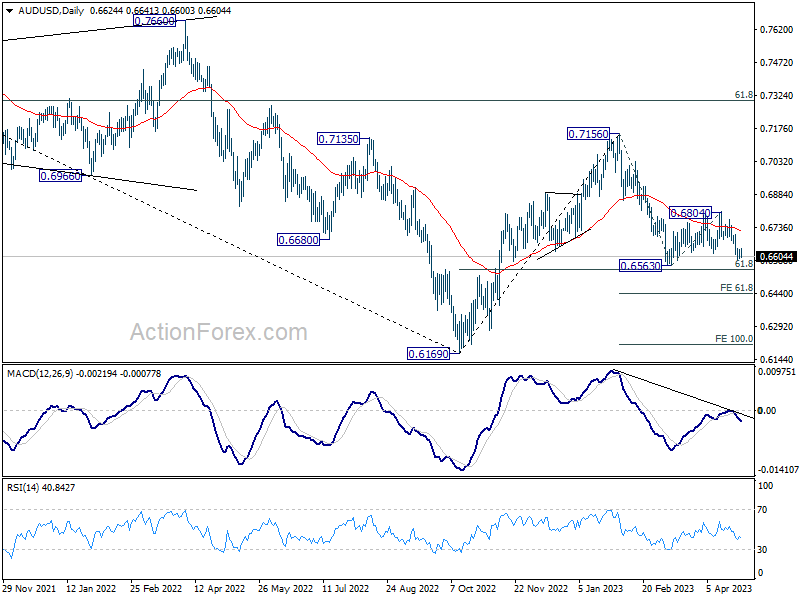
In the bigger picture, as long as 61.8% retracement of 0.6169 to 0.7156 at 0.6546 holds, the decline from 0.7156 is seen as a correction to rally from 0.6169 (2022 low) only. Another rise should still be seen through 0.7156 at a later stage. However, sustained break of 0.6546 will raise the chance of long term down trend resumption through 0.6169 low.
USD/CAD Daily Outlook
Daily Pivots: (S1) 1.3571; (P) 1.3609; (R1) 1.3629; More....
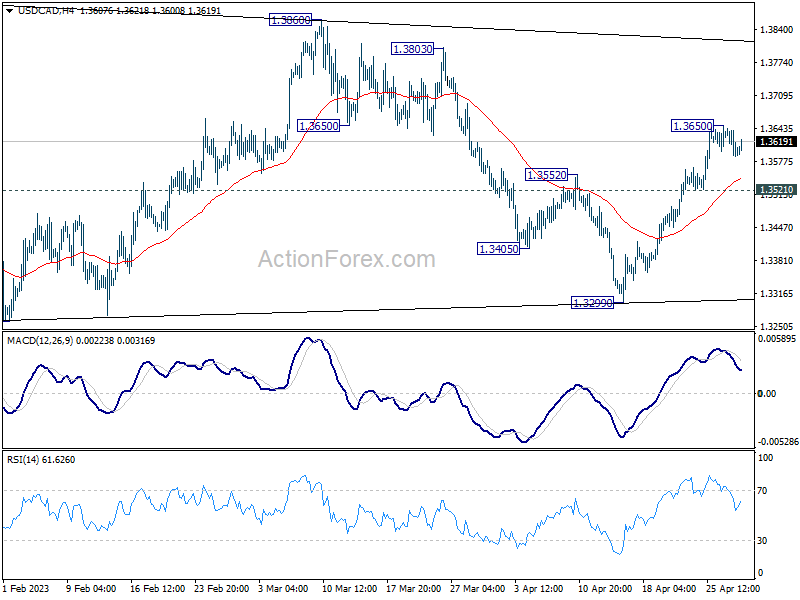
A temporary top should be conformed at 1.3650 with current retreat. Intraday bias in USD/CAD is turned neutral first. Overall, the correction pattern from 1.3976 could have completed with three waves to 1.3299. Above 1.3650 will resume the rise from 1.3299 to 1.3860/3976 resistance zone. Decisive break there will resume larger up trend. However, break of 1.3521 support will dampen this bullish case.
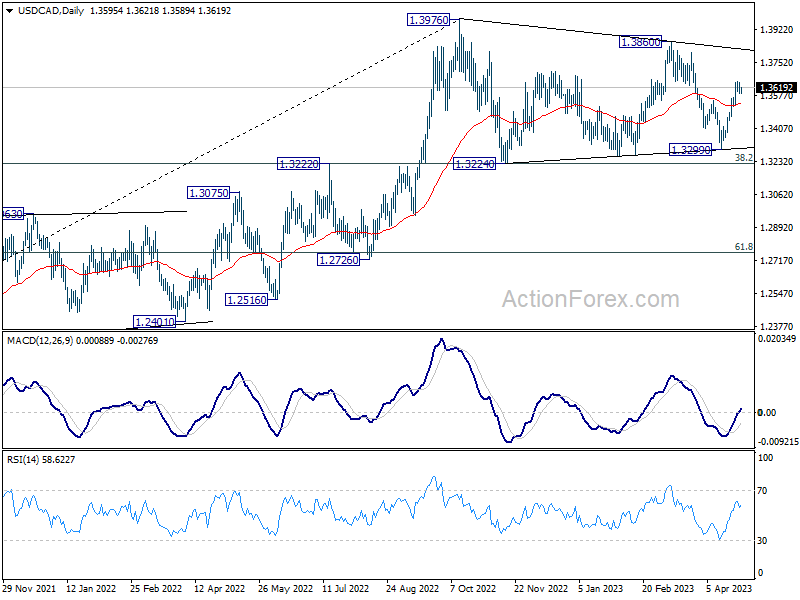
In the bigger picture, the up trend from 1.2005 (2021 low) is still in progress. Break of 1.3976 will confirm resumption and target 61.8% projection of 1.2401 to 1.3976 from 1.3261 at 1.4234. Firm break there will pave the way to long term resistance zone at 1.4667/89 (2016, 2020 highs). On the downside, sustained break of 55 W EMA (now at 1.3302) is needed to confirm medium term topping. Otherwise, outlook will remain bullish even in case of deep pull back.
EUR/GBP Daily Outlook
Daily Pivots: (S1) 0.8807; (P) 0.8840; (R1) 0.8856; More...
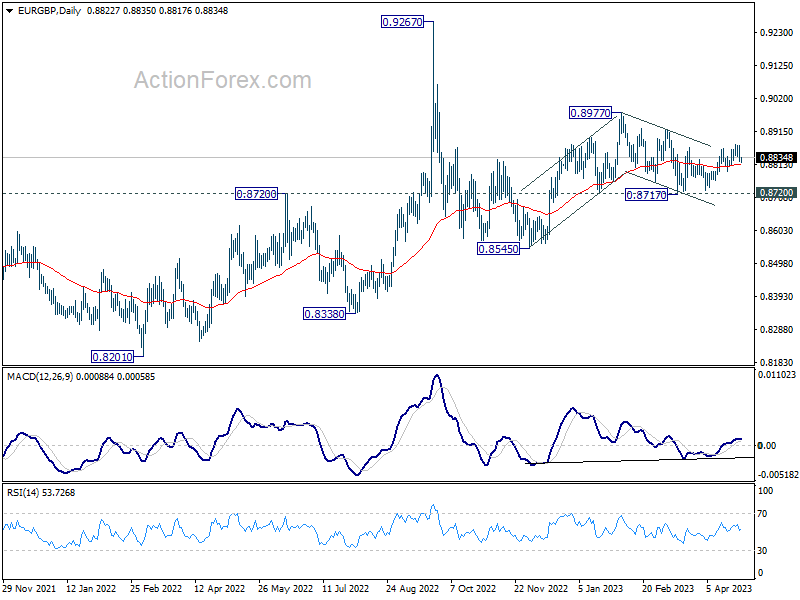
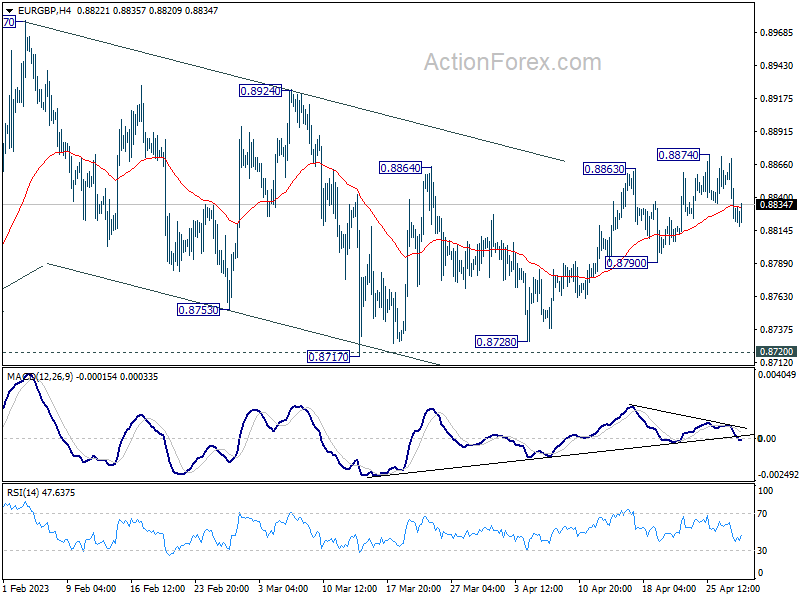
Intraday bias in EUR/GBP remains neutral first and further rally is mildly in favor as long as 0.8790 support holds. Choppy decline from 0.8977 could have completed already. Above 0.8874 will target 0.8924 resistance first. Firm break there will target 0.8977 high next. However, break of 0.8790 will turn bias back to the downside for retesting 0.8717 support again.
In the bigger picture, outlook remains rather mixed for now, except that price actions from 0.9267 (2022 high) are part of the long term range pattern from 0.9499 (2020 high). With 0.8720 support intact, rise from 0.8545 is in favor to continue through 0.8977. However, firm break of 0.8720 will argue that such rebound has completed, and open up deeper fall through this support level.