Sample Category Title
NZDUSD Fails to Jump Above the 200-day SMA
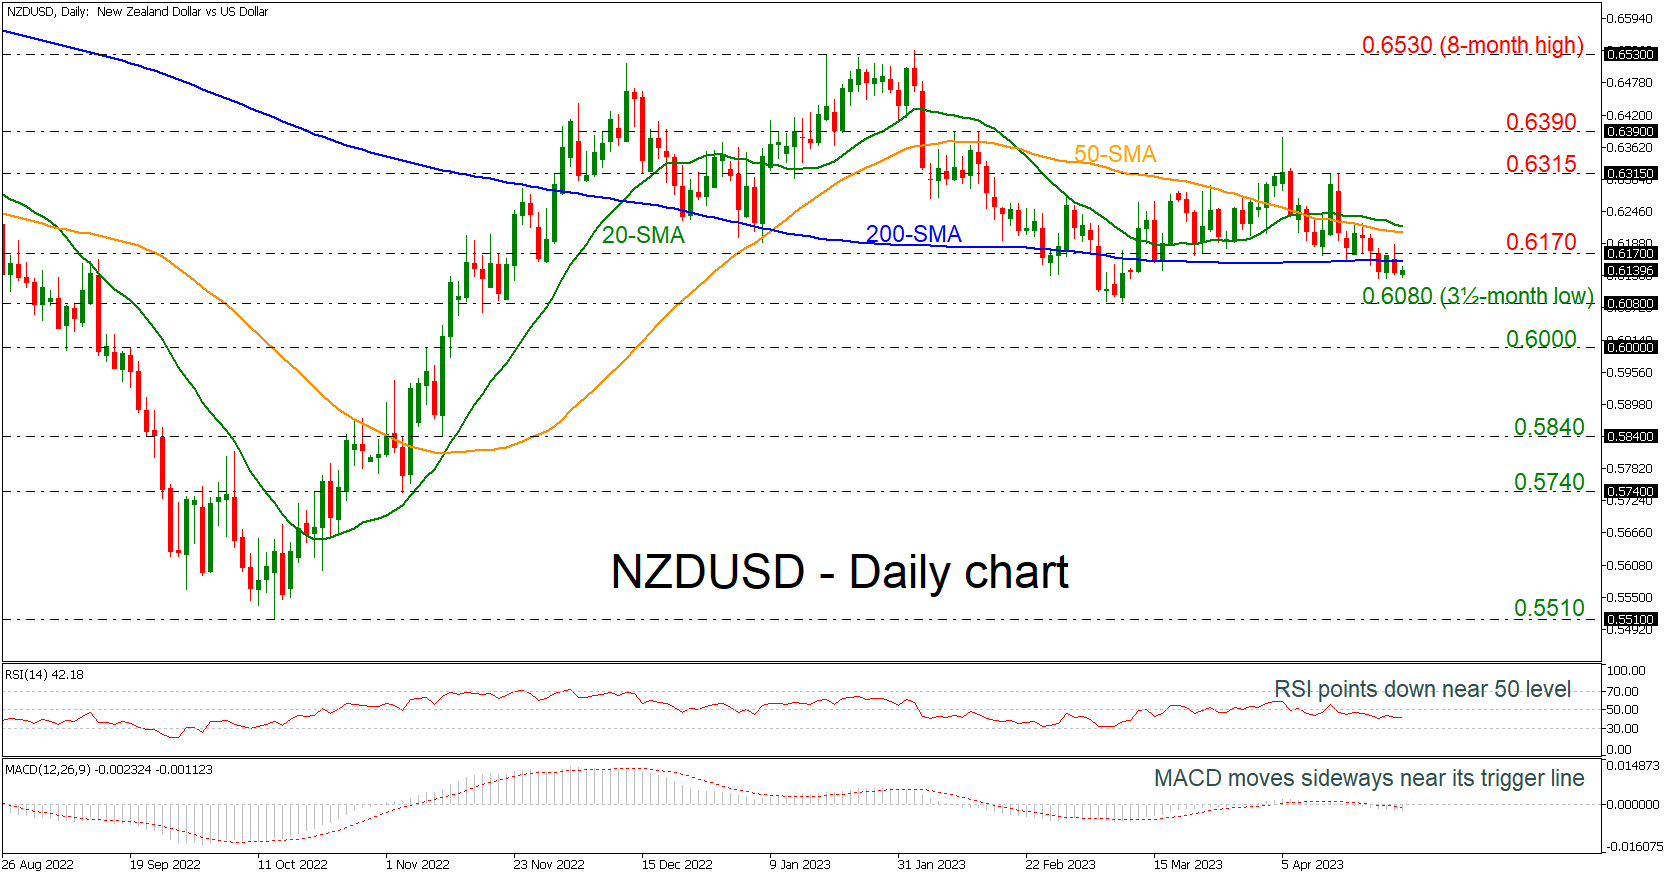
NZDUSD is still developing beneath the strong flat 200-day simple moving average (SMA) around the 0.6155 barrier. The RSI indicator is standing beneath its trigger and zero lines with weak momentum, while the MACD is losing ground beneath its trigger and zero lines.
An extension of the bearish movement may find immediate support at the three-and-half-month low of 0.6080. Even lower, the 0.6000 psychological mark may halt the negative actions but if not the 0.5840 obstacle may act as a turning point for traders.
Alternatively, any bullish attempts above the 200-day SMA and the 0.6170 resistance could meet the short-term SMAs around 0.6215. If the bulls hold the control could open the way for a rest near 0.6315 and the 0.6390 barrier, shifting the outlook to neutral. A climb above this line may switch the bias to positive, challenging the eight-month high of 0.6530.
All in all, NZDUSD is showing some negative signs as it is failing to jump above the 200-day SMA and the oscillators are endorsing this view.
USDJPY Challenges April’s Bullish Trend
USDJPY has been in a slow corrective mode below the 135.00 area so far this week, making investors wonder whether this is another temporary bearish phase within the short-term uptrend.
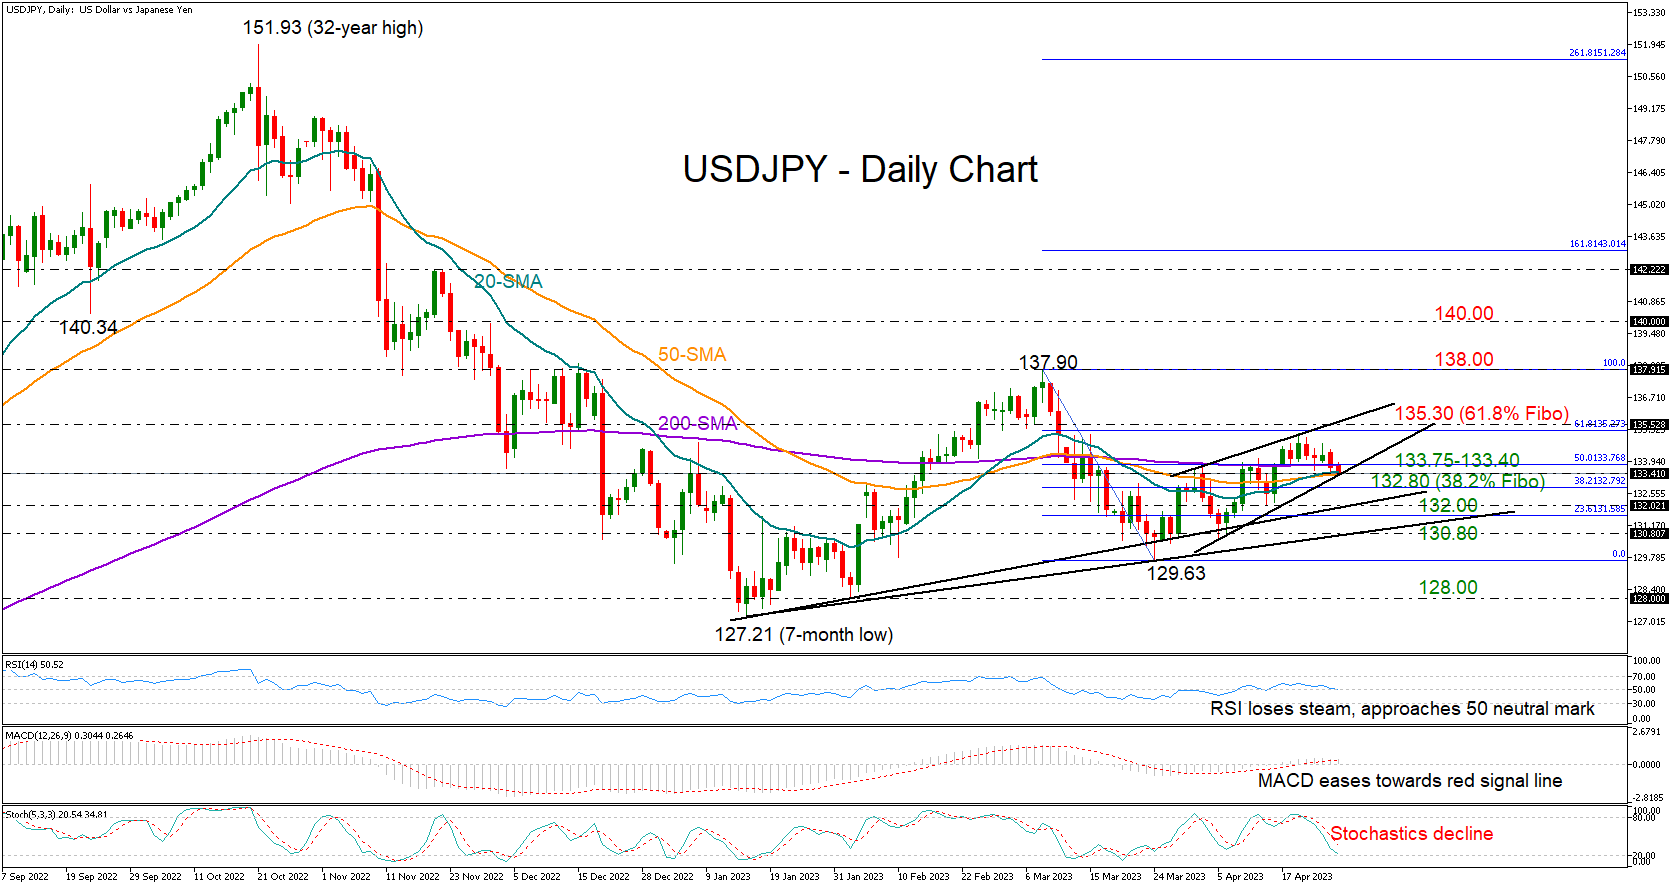
Although the price is currently seeking new support from its simple moving averages (SMAs) within the 133.75-133.45 region and near its previous highs, the momentum indicators are not looking promising. The RSI has almost erased its latest bounce and is approaching its 50 neutral mark. Likewise, the MACD has lost some ground and is near its red signal line, with the stochastic oscillator pointing downwards as well.
In terms of market structure, a rising wedge seems to be developing. Technically, this is usually considered a bearish trend reversal signal.
If sellers persist, the 38.2% Fibonacci retracement of the previous downleg could immediately attempt to cool downside pressures around 132.80. If not, then the pair might have another opportunity for a rebound between the two ascending trendlines, which connect all the lows from January’s trough, seen between 132.00 and 131.80. A break below the trendlines would worsen the outlook, shifting the spotlight to the March low of 129.63, while a steeper decline could reach the 2023 floor of 128.00-127.21.
In case the bulls return, a decisive close above the 61.8% Fibonacci level of 135.30 and the upper resistance line will be needed for a quick rally up to the March high of 137.90. This was a tough resistance area in November and December too. Therefore, a violation at this point could be a prerequisite for a bounce towards the 140.00 mark.
All in all, USDJPY maintains a series of higher highs and higher lows in the short-term picture despite its latest pullback. A step below 132.45 would downgrade the short-term outlook to neutral. Yet only an aggressive downfall below 130.80 would question the 2023 upward trajectory.
USD/JPY: Intermediate Correction Come to an End, Waiting for Fall in Bearish Impulse
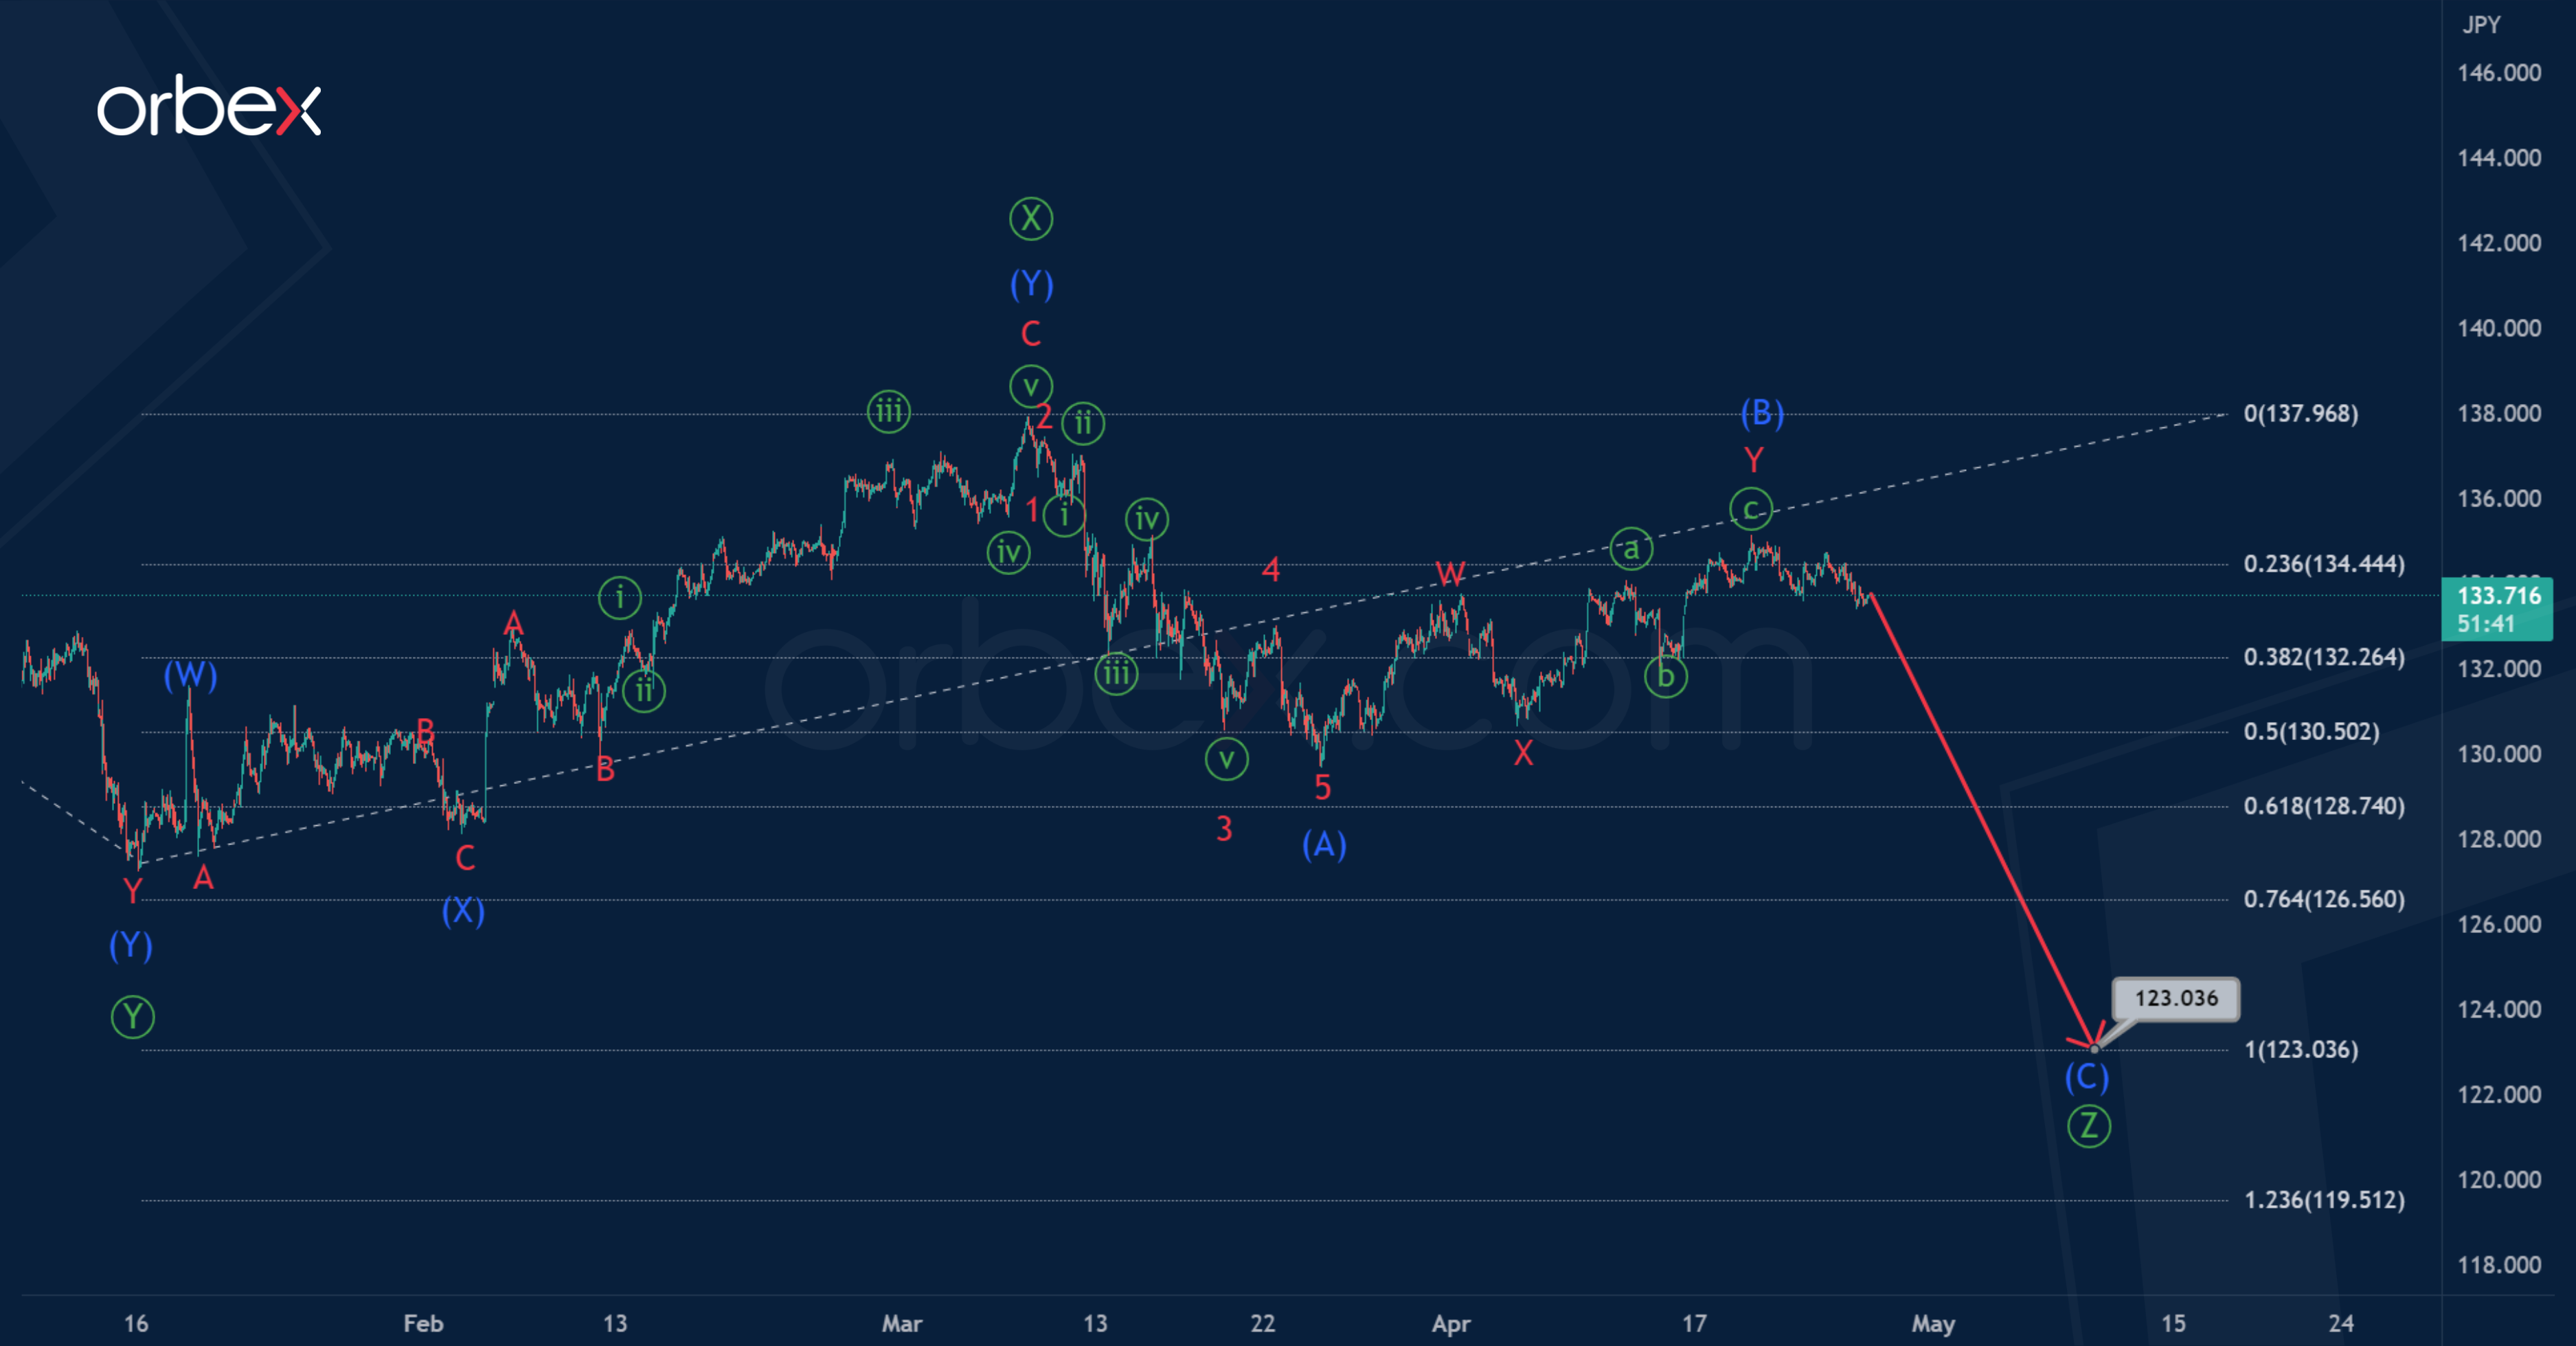
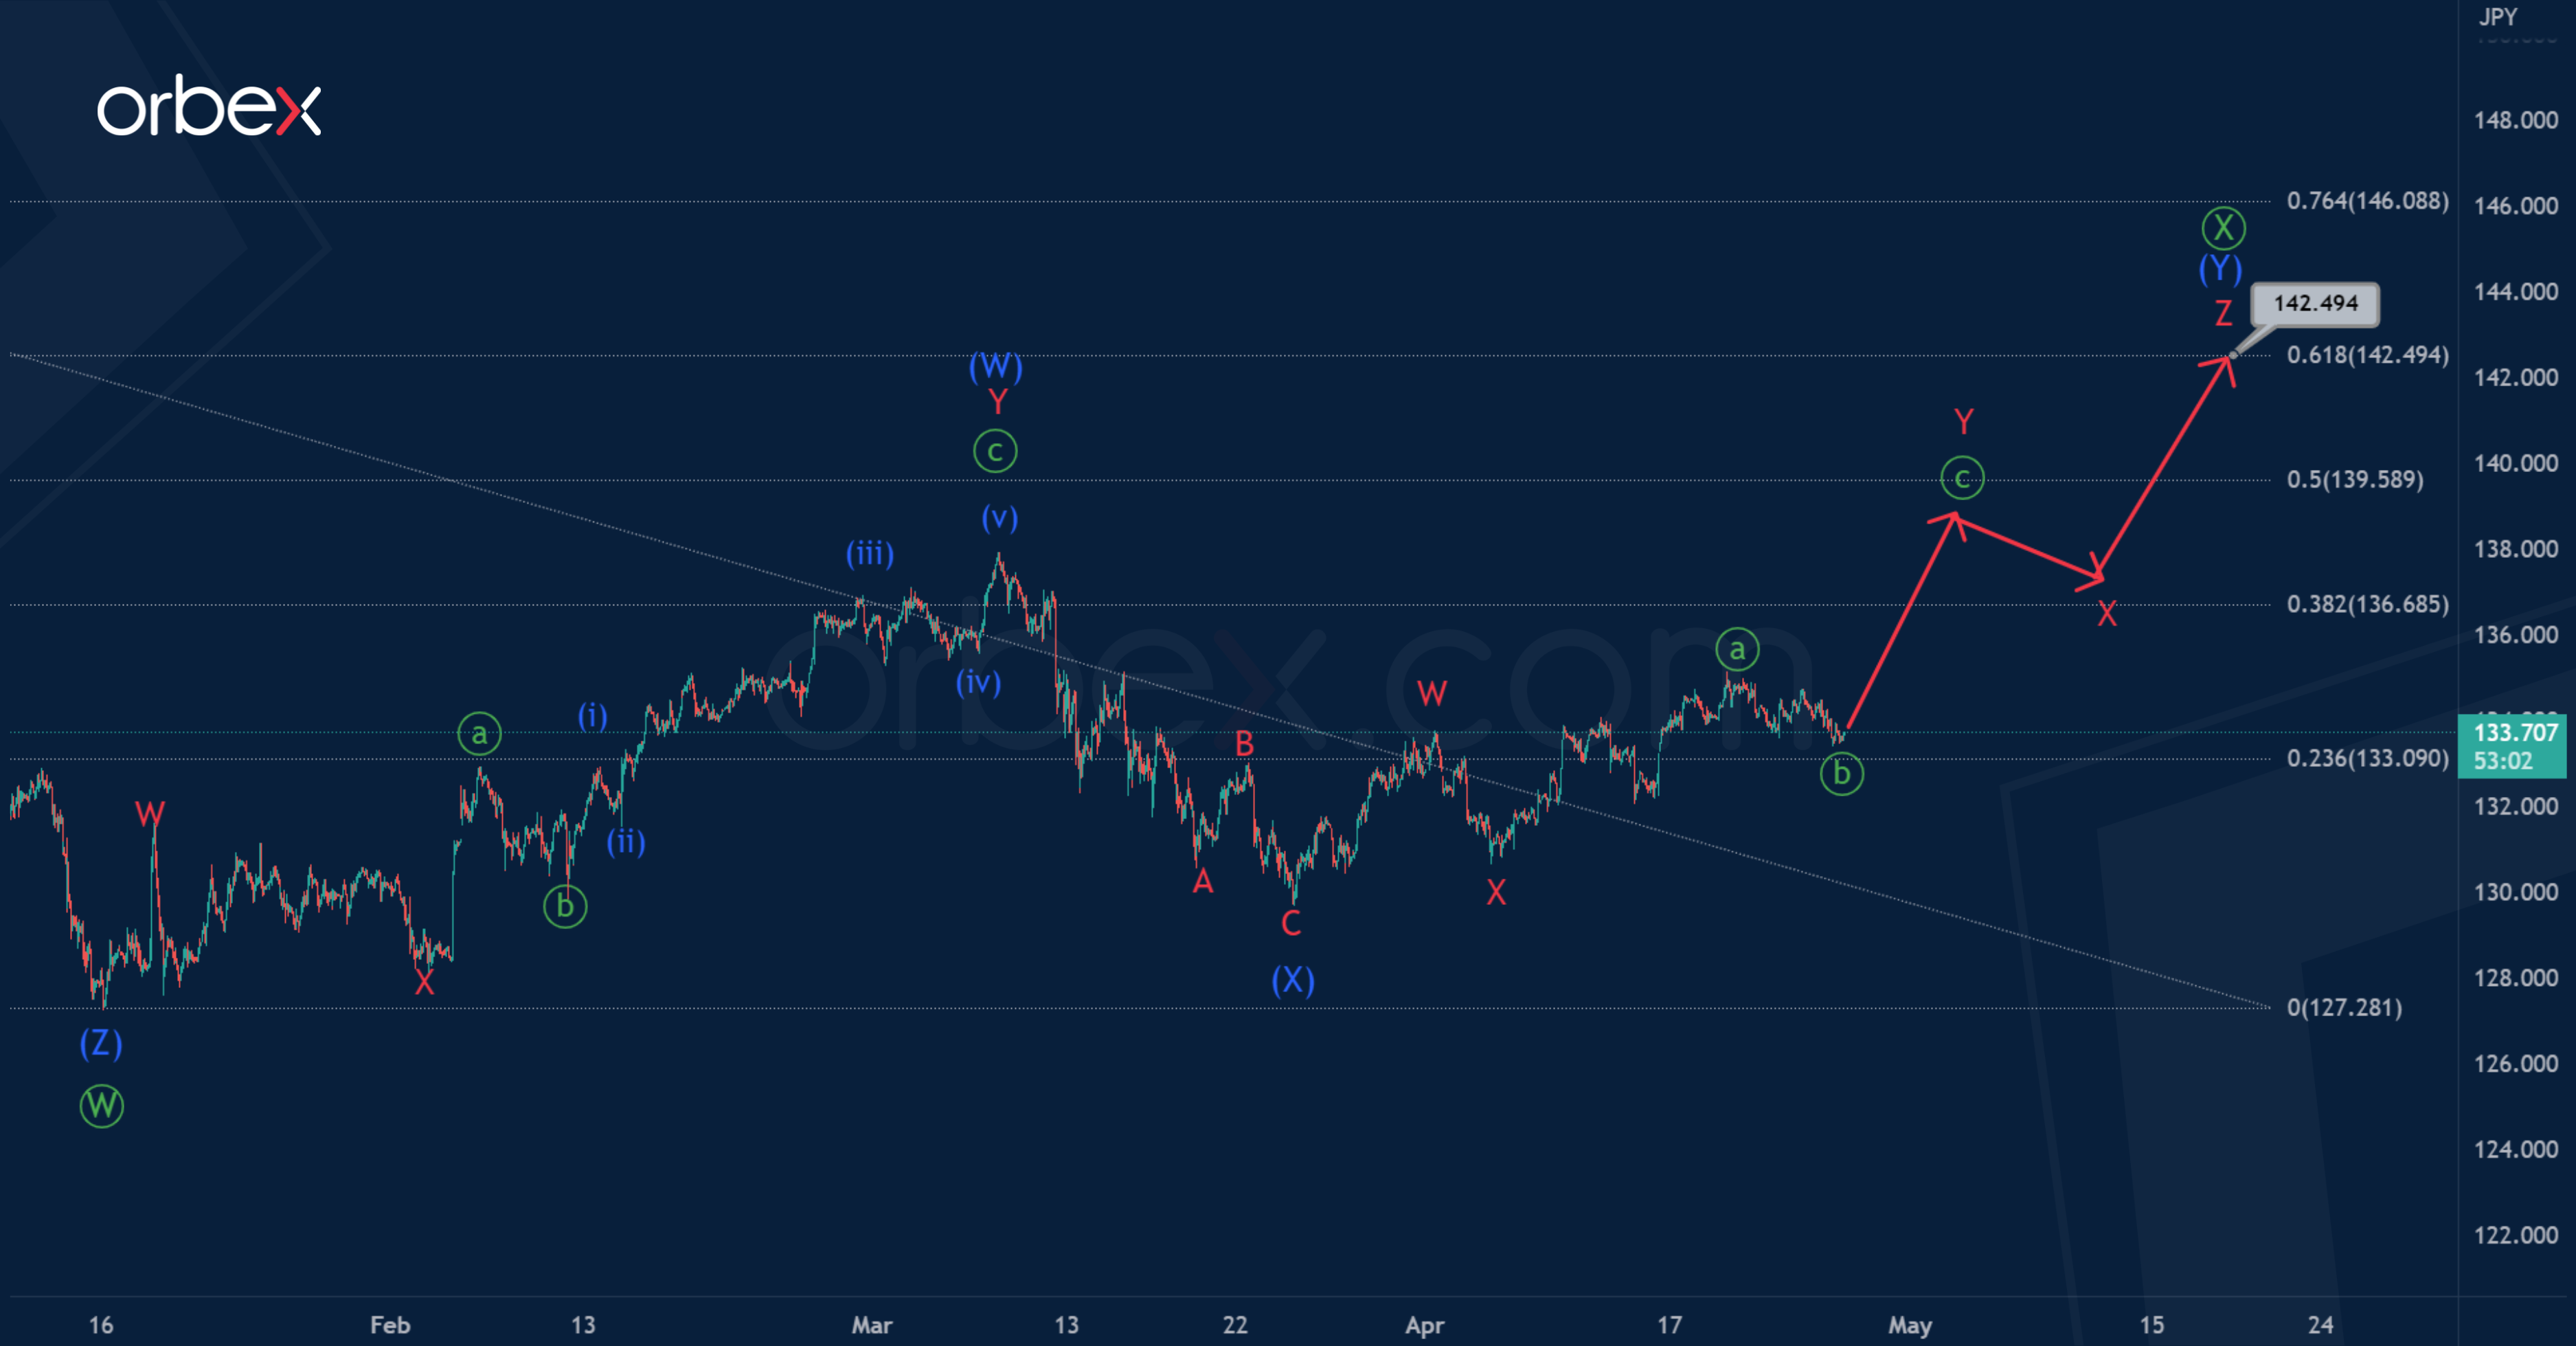
In the long term, the USDJPY pair may form a bearish trend. Most likely, the trend takes the form of a triple zigzag Ⓦ-Ⓧ-Ⓨ-Ⓧ-Ⓩ, within which the sub-waves Ⓦ-Ⓧ-Ⓨ-Ⓧ are completed.
The wave Ⓧ is a double zigzag consisting of intermediate sub-waves (W)-(X)-(Y).
At the time of writing, the market is in a wave Ⓩ. This wave, judging by its internal structure, takes the form of an intermediate zigzag (A)-(B)-(C). Since the correction (B) looks like a completed double zigzag, in the near future the pair may start moving in a bearish impulse wave (C) to 123.03.
At that level, primary waves Ⓩ and Ⓨ will be equal.
Unlike the main scenario, here, in an alternative scenario, wave Ⓧ is under development.
The primary wave Ⓧ can take the form of a double zigzag (W)-(X)-(Y). Within this pattern, we see completed intermediate sub-waves (W) and (X).
Most likely, in the last section of the chart we see the beginning of the construction of the final actionary wave (Y), the initial structure of which hints at a triple zigzag W-X-Y-X-Z.
It is expected to end at 142.49, where the primary wave Ⓧ will be at 61.8% of wave Ⓦ.
GBP/JPY Daily Outlook
Daily Pivots: (S1) 164.93; (P) 166.45; (R1) 167.46; More...
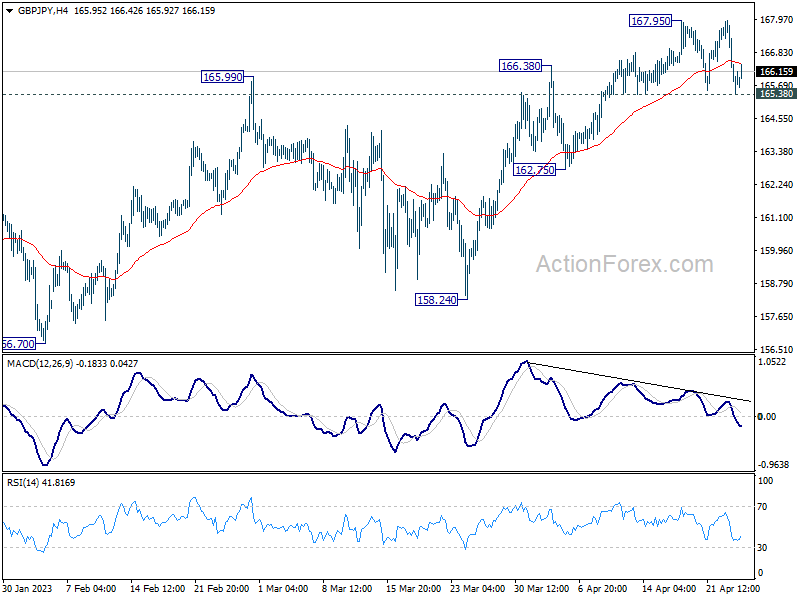
Intraday bias in GBP/JPY stays neutral and outlook is unchanged. Further rally is expected as long as 165.38 support holds. On the upside, break of 167.95 will resume the rebound from 155.33 to 169.26 resistance. However, firm break of 165.38 will argue that the corrective pattern from 172.11 is starting another falling leg. Intraday bias will be back on the downside for 162.75 support and below.
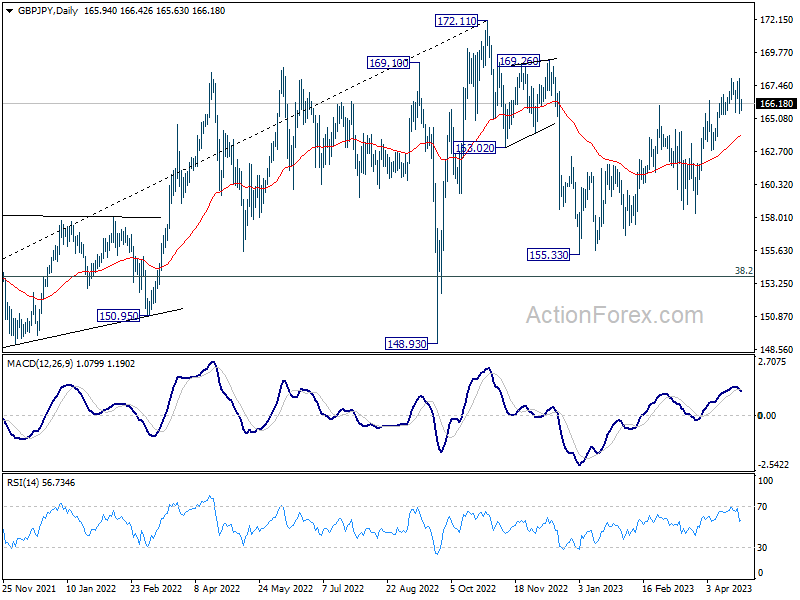
In the bigger picture, as long as 38.2% retracement of 123.94 (2020 low) to 172.11 (2022 high) at 153.70 holds, medium term bullishness is retained. That is, larger up trend from 123.94 (2020 low) is still in progress. Break of 172.11 high to resume such up trend is expected at a later stage.
EUR/JPY Daily Outlook
Daily Pivots: (S1) 145.81; (P) 147.22; (R1) 148.14; More....
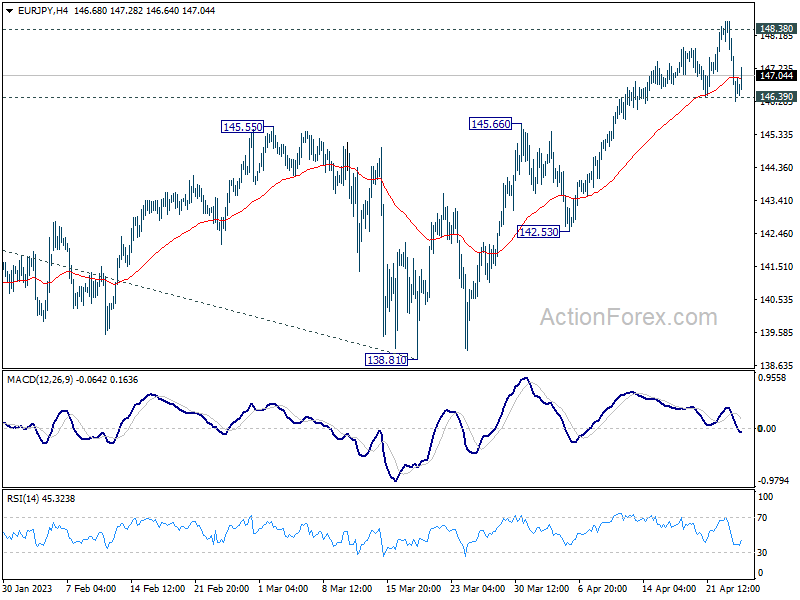
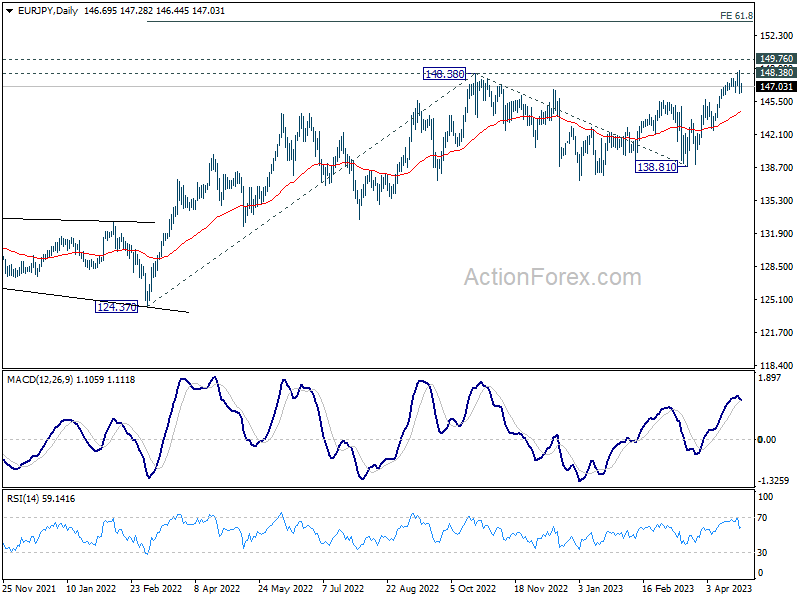
Intraday bias in EUR/JPY is turned neutral first as it retreated after failing to sustain above 148.38 resistance. On the upside, decisive break of 148.38 will resume larger up trend, and next target will be 149.76 long term resistance. However, sustained trading below 146.39 will indicate rejection by 148.38, and bring deeper fall to extend the corrective pattern from there.
In the bigger picture, as long as 55 W EMA (now at 140.70) holds, larger up trend from 114.42 (2020 low) is still in progress for 149.76 long term resistance (2014 high). Decisive break there will resume long term up trend from 94.11 (2012 low). Next target is 61.8% projection of 124.37 to 148.38 from 138.81 at 153.64.
EUR/GBP Daily Outlook
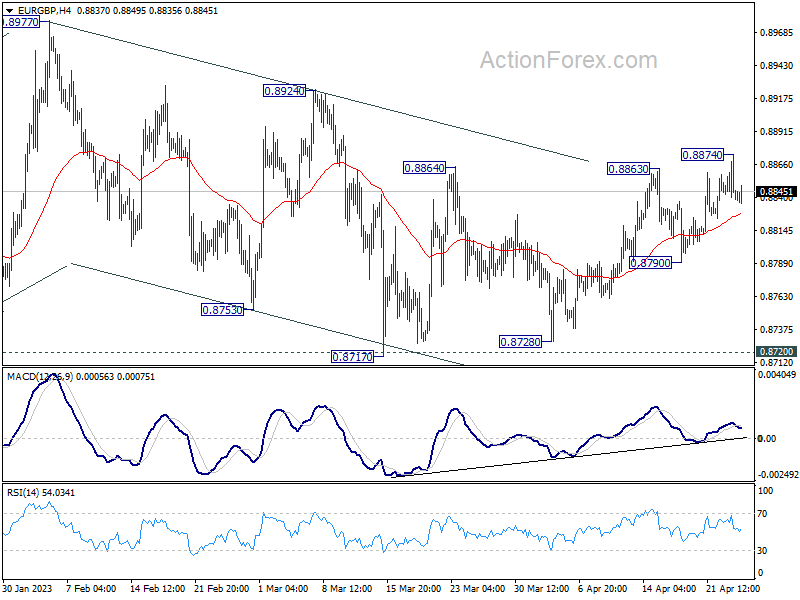
Daily Pivots: (S1) 0.8830; (P) 0.8853; (R1) 0.8865; More...
Intraday bias in EUR/GBP is turned neutral again at it retreated after edging higher to 0.8874. Further rally will remain in favor as long as 0.8790 support holds. Choppy decline from 0.8977 could have completed already. Above 0.8874 will target 0.8924 resistance first. Firm break there will target 0.8977 high next.
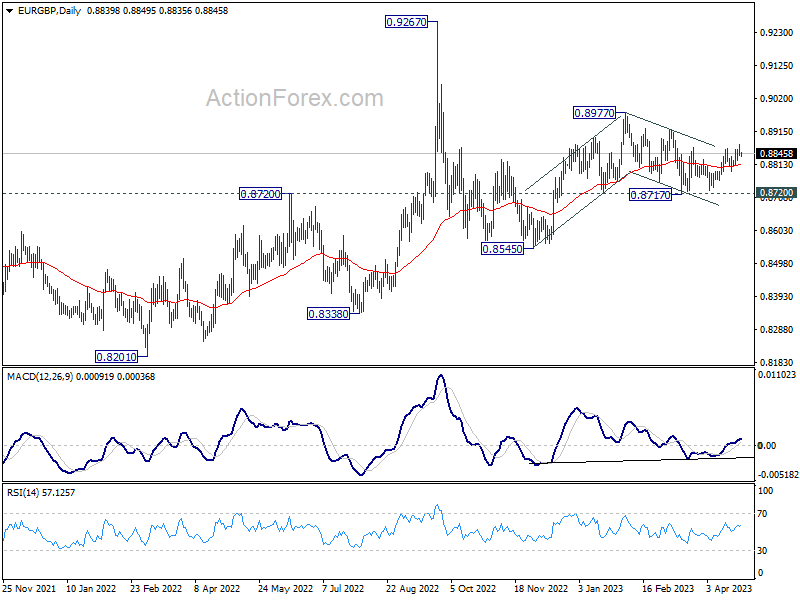
In the bigger picture, outlook remains rather mixed for now, except that price actions from 0.9267 (2022 high) are part of the long term range pattern from 0.9499 (2020 high). With 0.8720 support intact, rise from 0.8545 is in favor to continue through 0.8977. However, firm break of 0.8720 will argue that such rebound has completed, and open up deeper fall through this support level.
EUR/AUD Daily Outlook
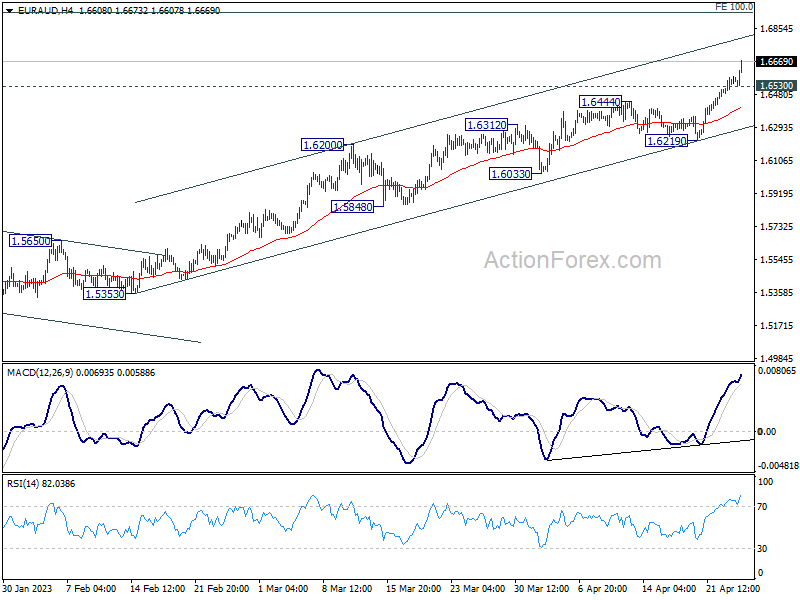
Daily Pivots: (S1) 1.6504; (P) 1.6546; (R1) 1.6604; More...
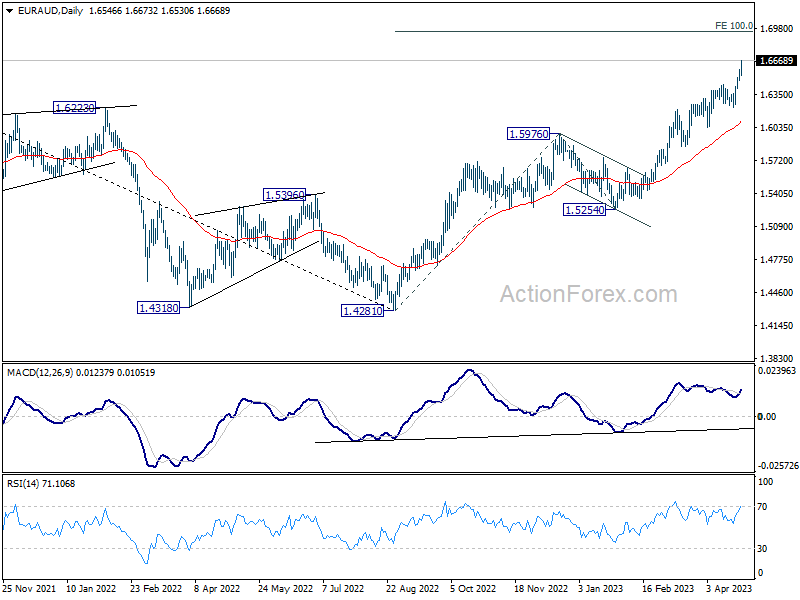
EUR/AUD accelerates higher today and intraday bias remains on the upside. Current up trend should target 100% projection of 1.4281 to 1.5976 from 1.5254 at 1.6949. On the downside, below 1.6530 minor support will turn intraday bias neutral and bring consolidations first. But near term outlook will remain bullish as long as 1.6219 support holds, in case of retreat.
In the bigger picture, the solid break of 1.6389/6434 cluster resistance (38.2% retracement of 1.9799 to 1.4281 at 1.6389) argues that whole down trend from 1.9799 (2020 high) has completed at 1.4281 (2022 low). Further rise should be seen to 61.8% retracement at 1.7691 next. For now, outlook will stay bullish as long as 1.5976 resistance turned support holds, even in case of deep pull back.
EUR/CHF Daily Outlook
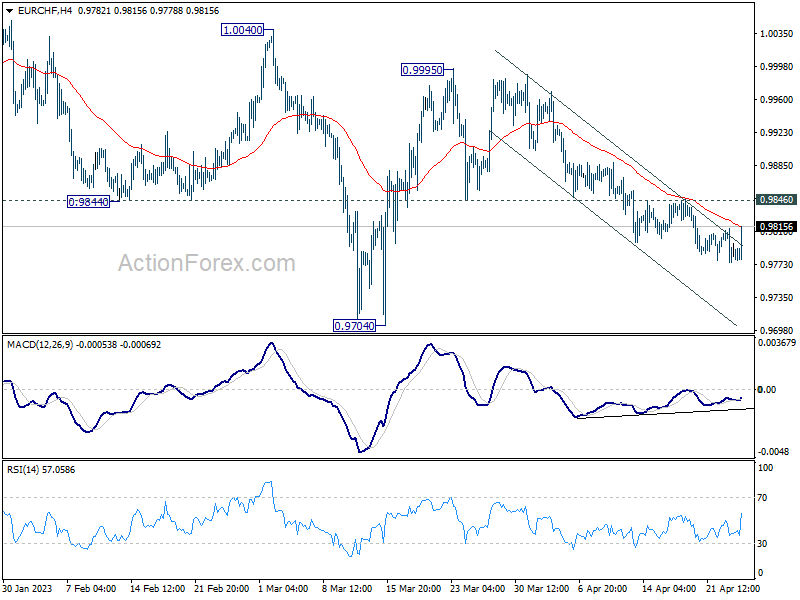
Daily Pivots: (S1) 0.9786; (P) 0.9799; (R1) 0.9819; More...
EUR/CHF continues to lose downside momentum as seen in 4H MACD. But still deeper decline is expected with 0.9846 resistance holds. The cross is extending the correction from 1.0095, and further fall would be seen to 0.9704 and below. On the upside, however, break of 0.9846 resistance will indicate short term bottoming, and turn bias back to the upside for stronger rebound.
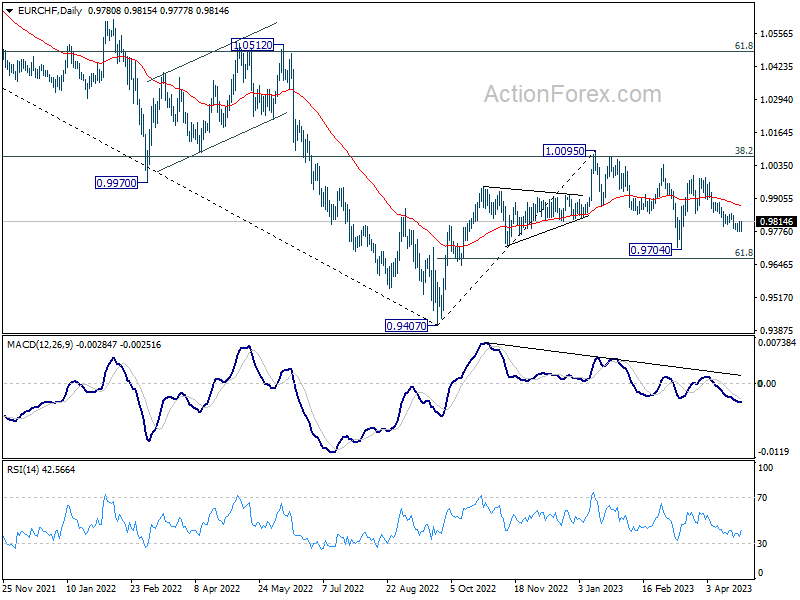
In the bigger picture, prior rejection by 55 W EMA (now at 0.9989) and 38.2% retracement of 1.1149 to 0.9407 at 1.0072 suggests that medium term outlook is staying bearish. That is, down trend from 1.2004 is not completed yet and is in favor to resume through 0.9407 at a later stage. However, decisive break of 1.0095 resistance will raise the chance of bullish trend reversal. Rise from 0.9407 should then target 1.0505 cluster resistance (2020 low at 1.0505, 61.8% retracement of 1.1149 to 0.9407 at 1.1484).
EUR/USD Daily Outlook
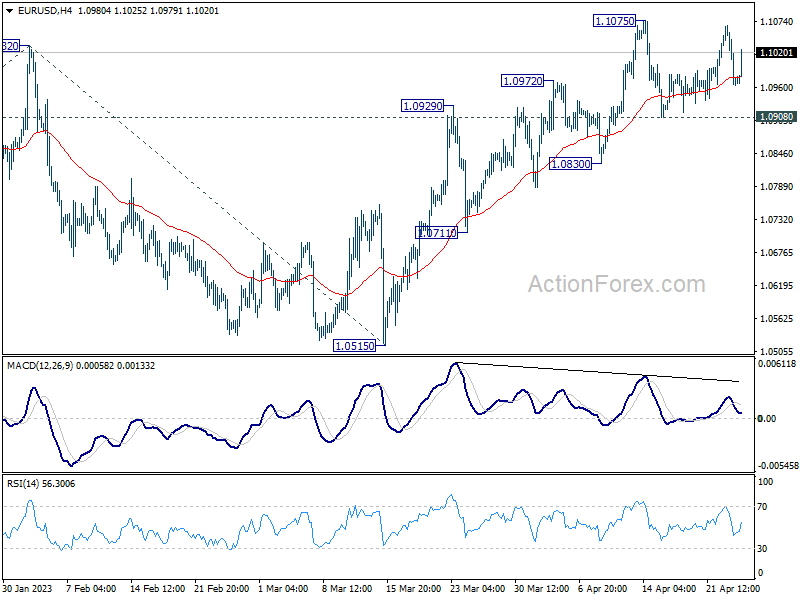
Daily Pivots: (S1) 1.0936; (P) 1.1002; (R1) 1.1039; More...
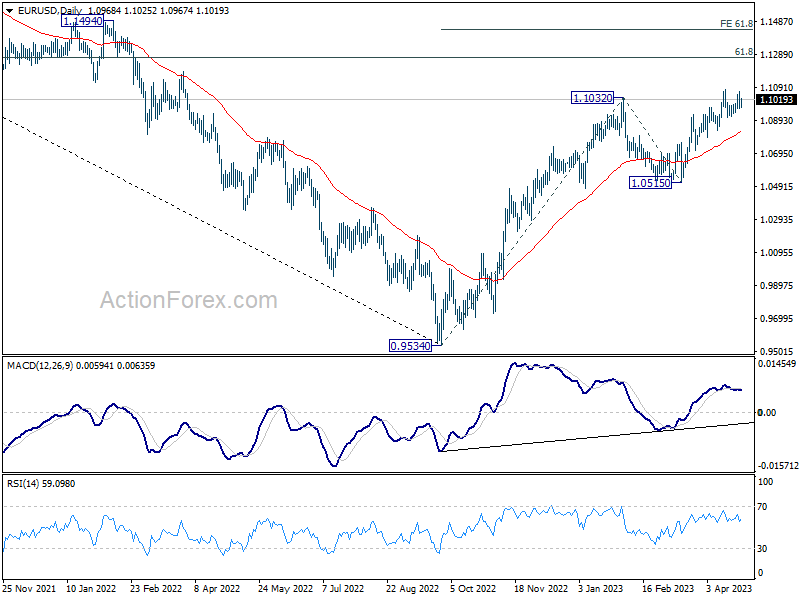
EUR/USD is extending the consolidation from 1.1075 and intraday bias remains neutral first. Outlook will remain bullish as long as 1.0908 support holds. Break of 1.1075 will resume larger up trend from 0.9534 to 1.1273 fibonacci level. Break there will target 61.8% projection of 0.9534 to 1.1032 from 1.0515 at 1.1441.
In the bigger picture, rise from 0.9534 (2022 low) is in progress for 61.8% retracement of 1.2348 (2021 high) to 0.9534 at 1.1273. Sustained break there will solidify the case of bullish trend reversal and target 1.2348 resistance next (2021 high). This will now remain the favored case as long as 1.0515 support holds, even in case of deeper pull back.
GBP/USD Daily Outlook
Daily Pivots: (S1) 1.2362; (P) 1.2435; (R1) 1.2482; More...
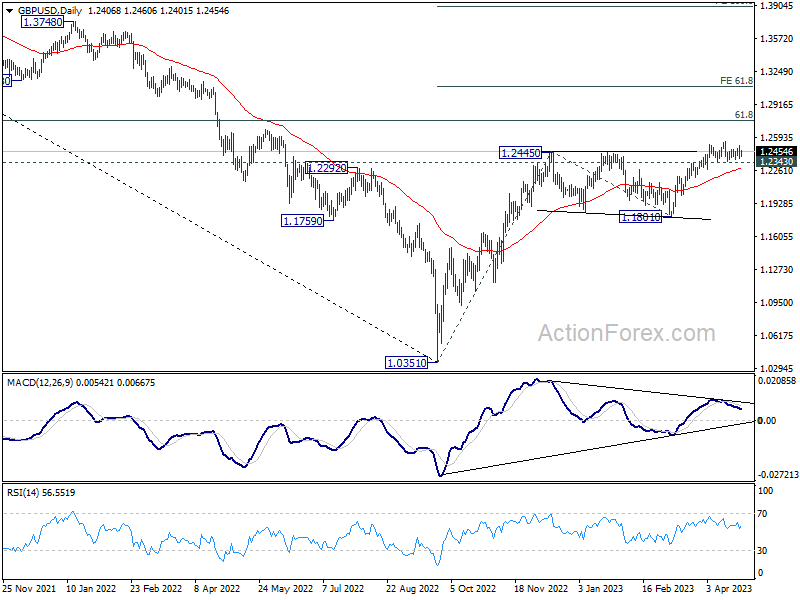
No change in GBP/USD's outlook as consolidation continues below 1.2545. Intraday bias remains neutral for the moment. Outlook stays bullish with 1.2343 support intact. On the upside, above 1.2545 will target 1.2759 fibonacci level first. Firm break there will target 61.8% projection of 1.0351 to 1.2445 from 1.1801 at 1.3095. However, considering bearish divergence condition in 4H MACD, firm break of 1.2343 will confirm short term topping, and turn bias back to the downside for deeper pullback.
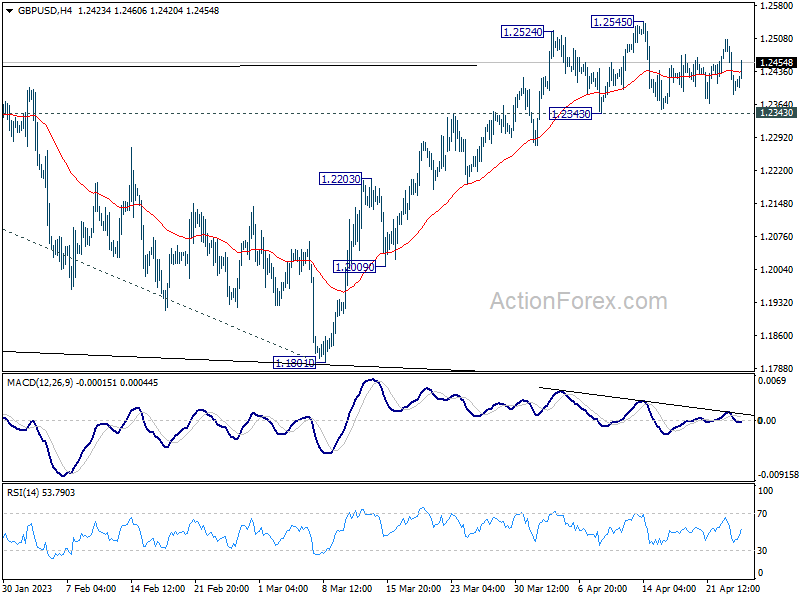
In the bigger picture, the rise from 1.0351 medium term term bottom (2022 low) is in progress for 61.8% retracement of 1.4248 (2021 high) to 1.0351 at 1.2759. Sustained break there will add to the case of long term bullish trend reversal. Further break of 61.8% projection of 1.0351 to 1.2445 from 1.1801 at 1.3095 could prompt upside acceleration to 100% projection at 1.3895. For now, this will remain the favored case as long as 1.1801 support holds, even in case of deep pull back.