

Sample Category Title
Technical Outlook and Review
DXY:
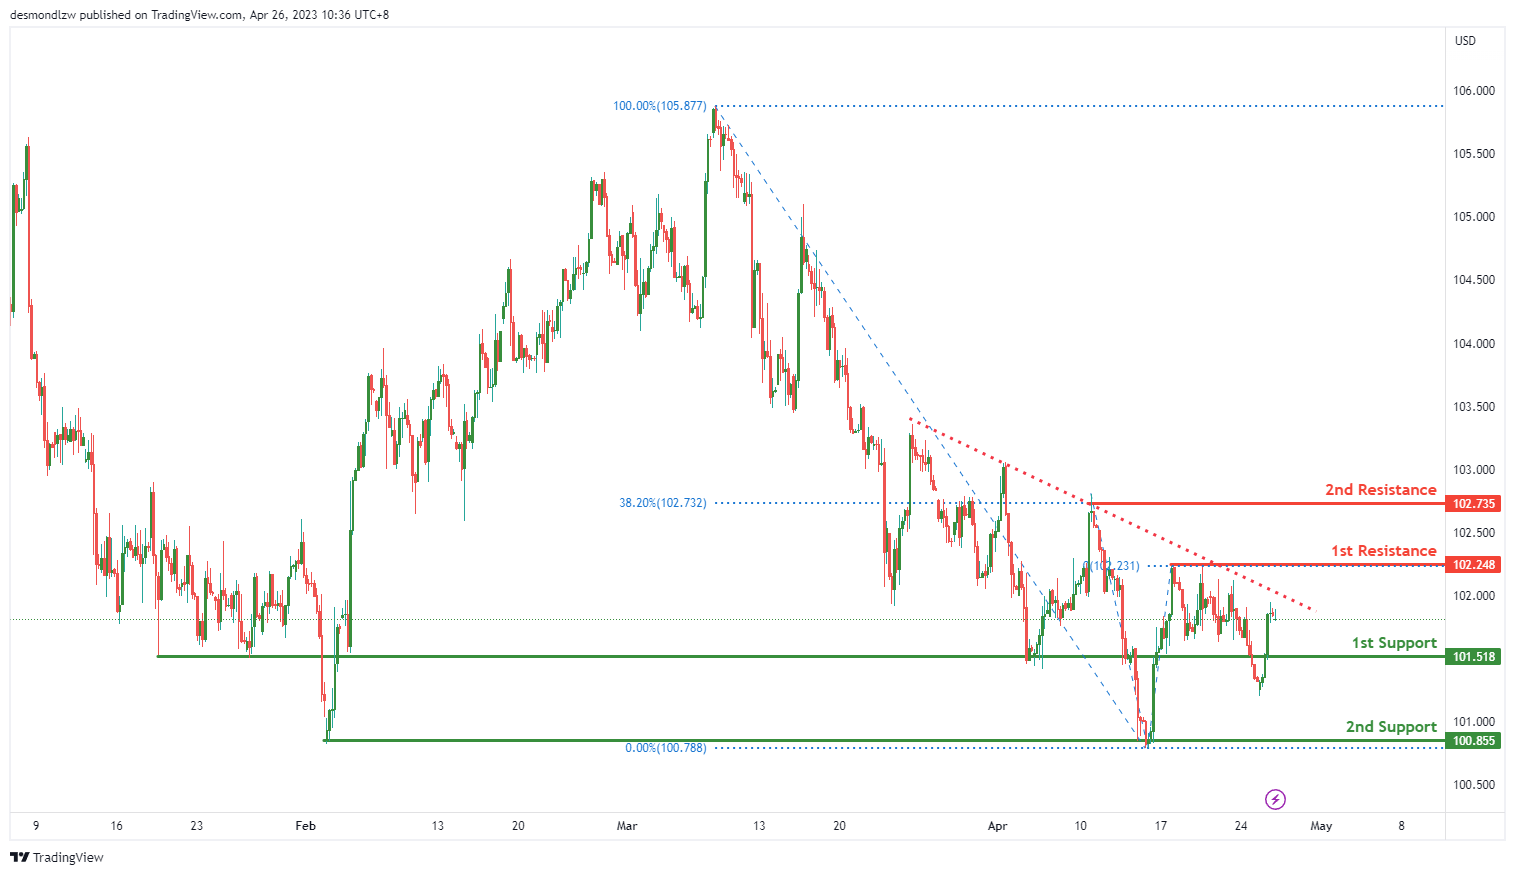
The US Dollar Index (DXY) is currently showing bullish momentum, as it could potentially continue to move towards its first resistance level.
At the moment, the first support level for DXY is at 101.52, which is an overlap support. If the price drops further, it could potentially find support at 100.86, which is another overlap support.
However, the overall momentum of the chart remains bullish, so it’s more likely that the price will continue to rise towards the first resistance level of 102.25, which is also an overlap resistance. If it manages to break through this level, it could reach the second resistance level of 102.74, which is an overlap resistance and also coincides with the 38.20% Fibonacci retracement level.
EUR/USD:
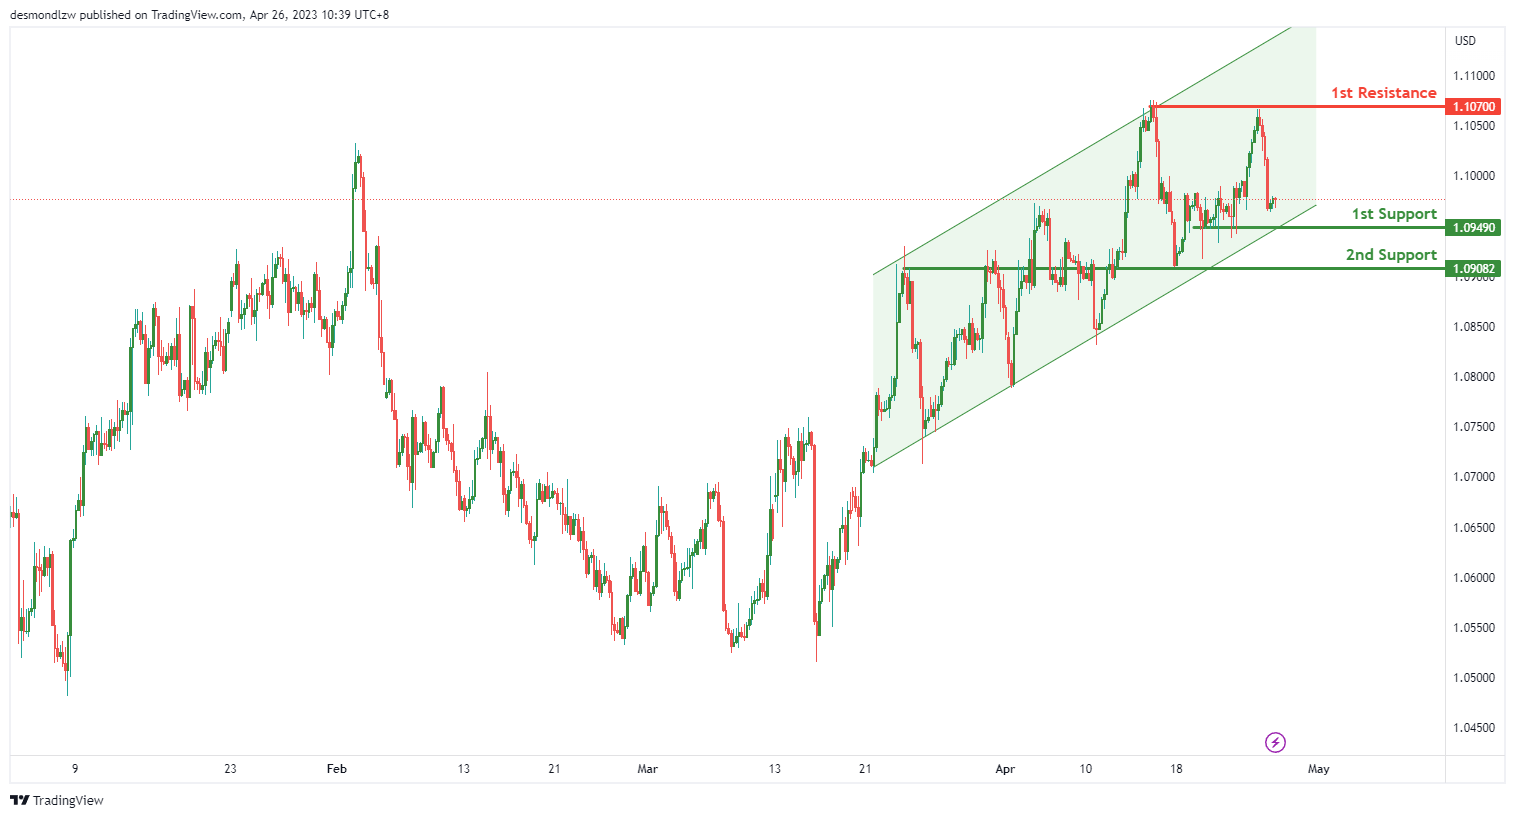
The EUR/USD chart shows weak momentum with a bearish bias. Prices could potentially make a bearish continuation towards the first support level. On the upside, prices could face resistance near the swing high resistance level.
Looking at the support and resistance levels, we can see that the first support level is at 1.0949. This level is an overlap support, indicating that it has been an important price level in the past. The second support level is at 1.0908, which is also an overlap support level, and it coincides with the 50% Fibonacci retracement level.
On the other hand, the first resistance level is at 1.1070, which is a multi-swing high resistance level.
GBP/USD:
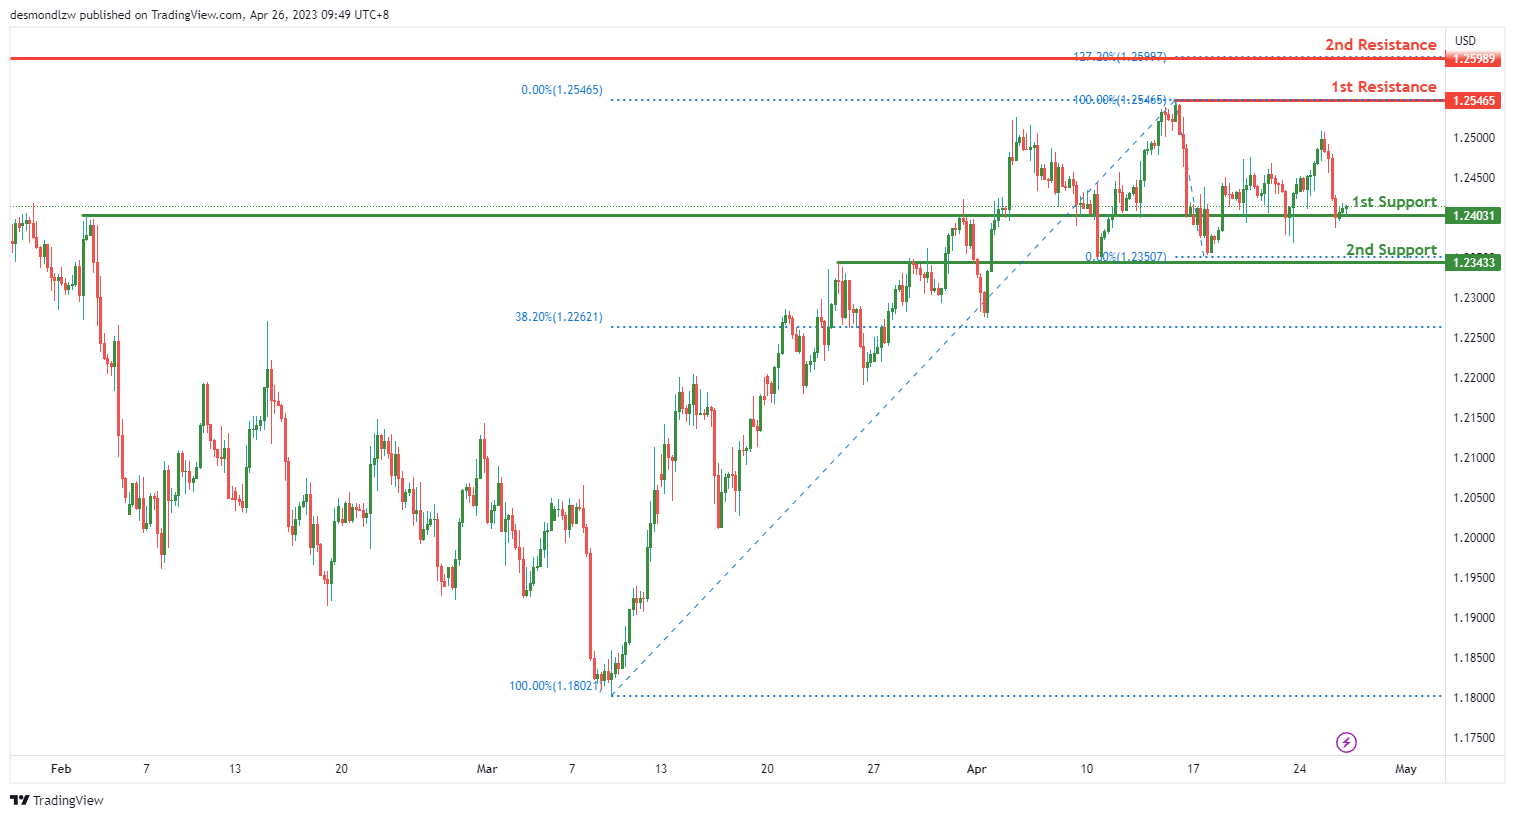
The GBP/USD pair has been showing weak momentum with low confidence overall. However, there is a possibility for a bullish bounce off the first support level and head towards the first resistance level.
The first support level is at 1.2403, which is an overlap support level. If the price reaches this level, there is a chance that it could bounce off this level and head towards the first resistance level.
The second support level is at 1.2343, which is also an overlap support level. This level may act as a stronger support level if the price falls further.
On the upside, the first resistance level is at 1.2547, which is a swing high resistance level. If the price manages to break above this level, it could potentially continue to rise.
The second resistance level is at 1.2599, which is an overlap resistance level. This level may act as a stronger resistance level if the price manages to break above the first resistance level.
USD/CHF:
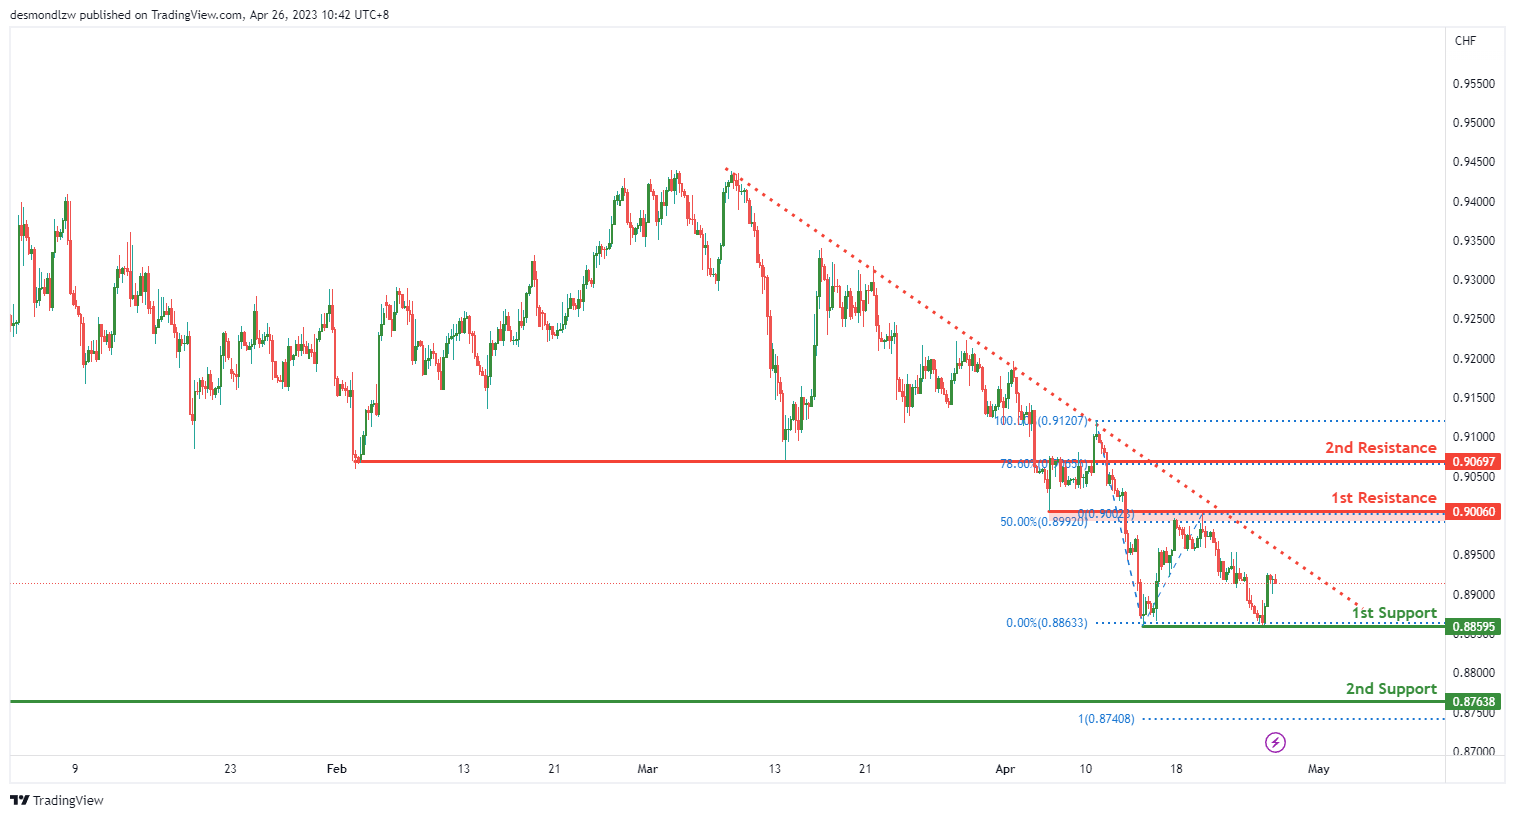
The USD/CHF currency pair is currently showing neutral momentum on the charts, with the potential to fluctuate between the 1st resistance and 1st support levels.
The 1st support level is at 0.8860 and is considered a multi-swing low support, while the 2nd support level is at 0.8764 and is an overlap support.
On the other hand, the 1st resistance level is at 0.9006 and is an overlap resistance, with the 50% Fibonacci retracement adding to its significance.
The 2nd resistance level is at 0.9070 and is an overlap resistance, with the 78.60% Fibonacci retracement providing additional support.
USD/JPY:
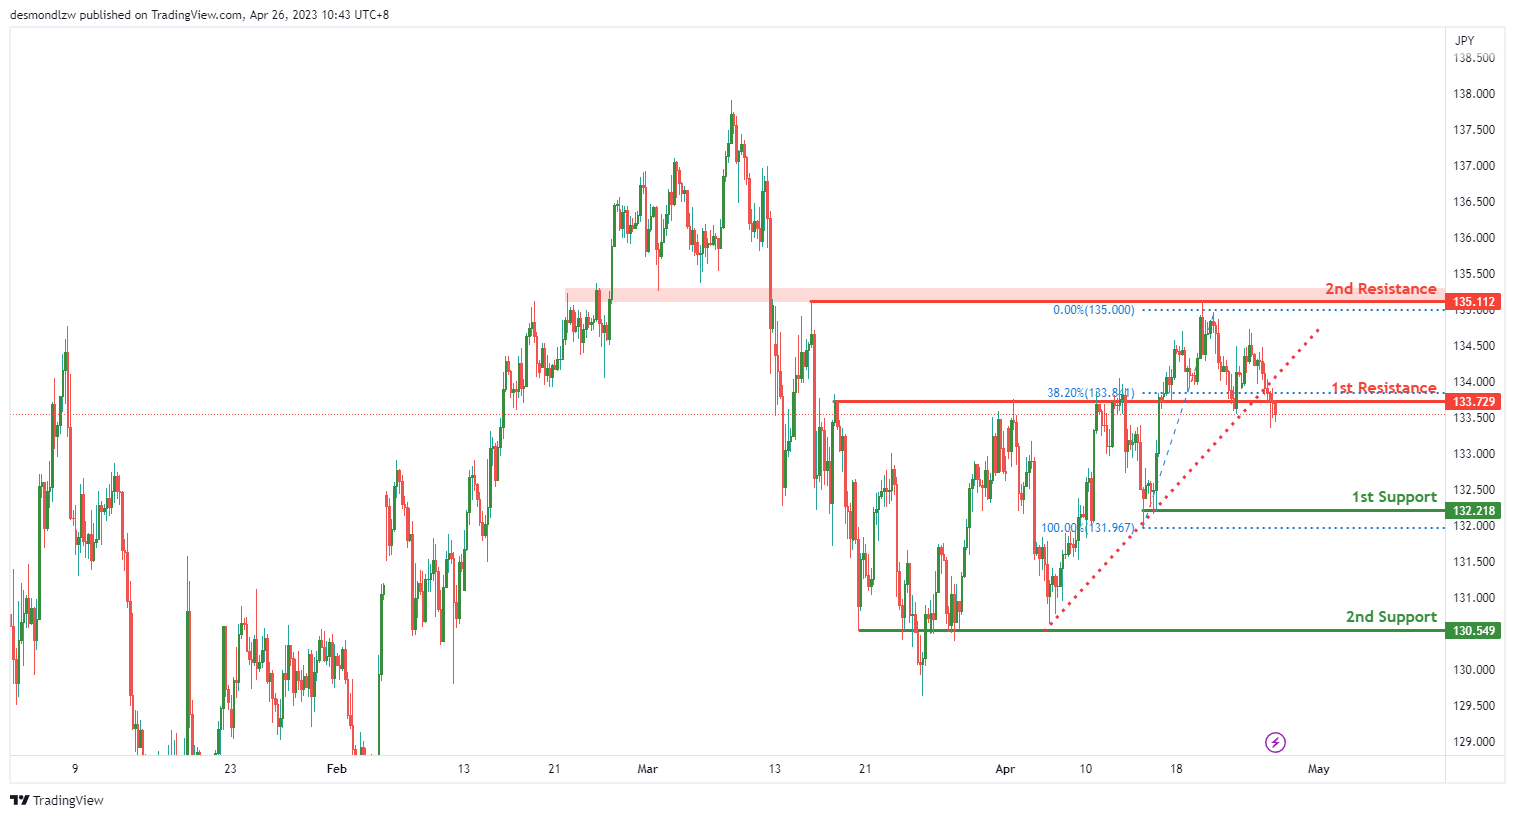
After breaking out of the rising trendline and prior 1st support of 133.73, USD/JPY could continue its bearish momentum towards the new 1st support level at 132.22. The level is considered a strong support as it has been tested multiple times in the past.
If the price breaks below this level, the next potential support could be at 130.55, which is a key support level based on the 61.80% Fibonacci retracement.
On the upside, the first resistance is at 133.73, which is an overlap resistance level. If the price manages to break above this level, it could potentially head towards the next resistance at 135.11, which is also an overlap resistance level.
AUD/USD:
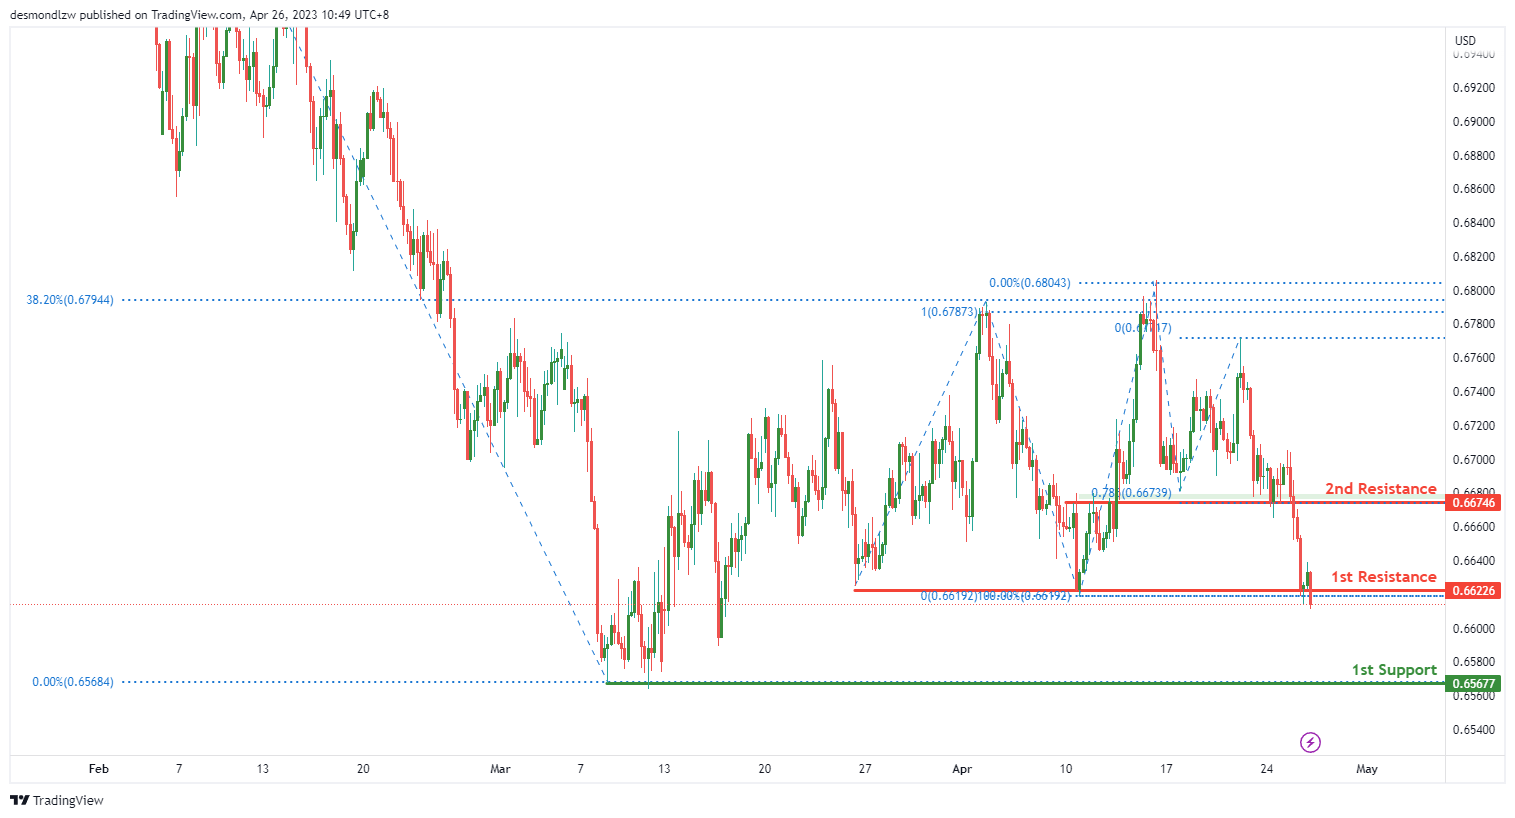
The AUD/USD pair is currently showing strong bearish momentum as it broke through the prior first support of 0.6623. It could reach the new first support level at 0.6568, which is another multi-swing low support level.
If the price bounces from this new support level, it could head towards the first resistance level at 0.6623. The previous first support level at 0.6623 now acts as the new first resistance, which is an overlap resistance. This second resistance level is an overlap resistance and also corresponds to the 78.60% Fibonacci projection.
NZD/USD:
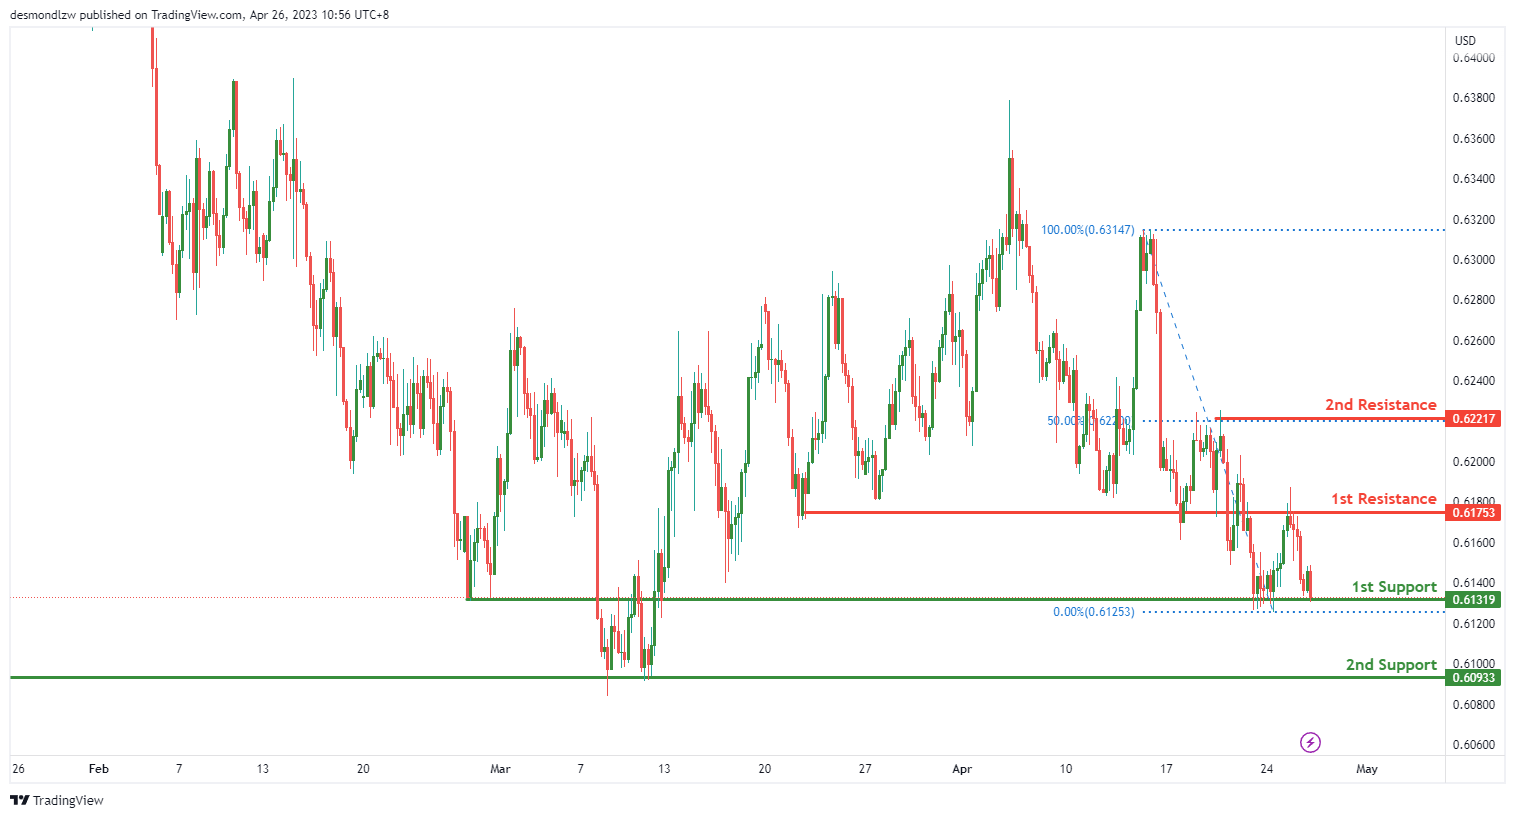
The NZD/USD chart is currently exhibiting an overall bearish momentum, indicating that the price may potentially break through the first support levels. The first support level is at 0.6132 and may provide potential support.
The next potential support level is at 0.6093, which is a multi-swing low support and may provide additional support for the price if it were to drop further.
On the other hand, if the price were to rise, the 1st resistance level is at 0.6175. This level is a multi-swing high resistance, making it a strong level for potential resistance.
If the price were to break above the 1st resistance level, the next potential resistance level is at 0.6222. This level is also an overlap resistance and coincides with the 50.0% Fibonacci retracement, making it a strong level for potential resistance.
USD/CAD:
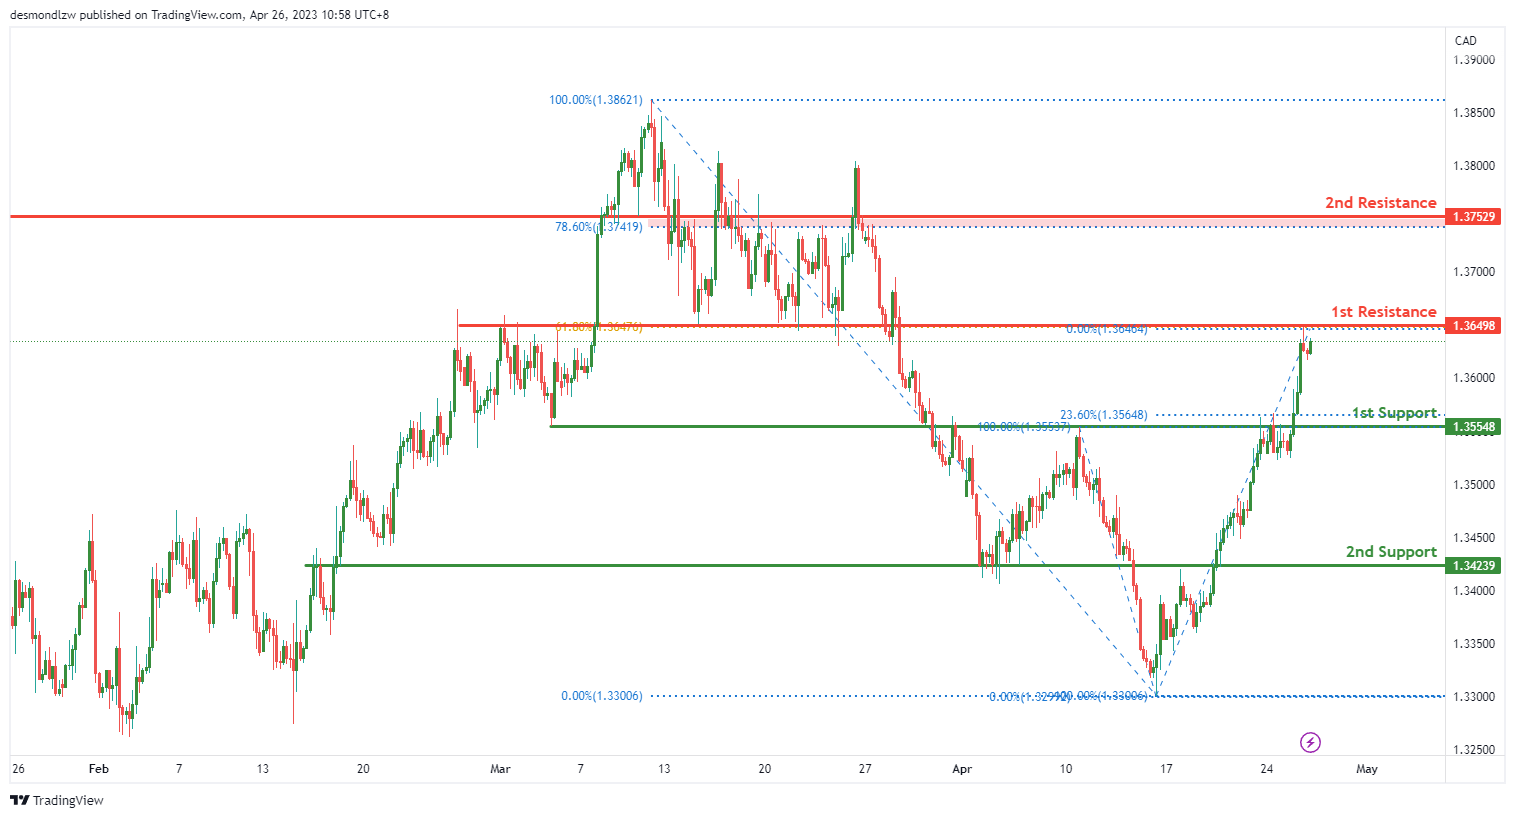
The USD/CAD currency pair has been showing bullish momentum recently, with the potential for continued upside movement towards the first resistance level.
The first support level at 1.3555 is a good level to watch, as it represents an overlap support and also coincides with the 23.60% Fibonacci retracement level. A bounce off this level could signal a continuation of the recent bullish trend.
The second support level at 1.3424 is also an overlap support and may provide additional buying opportunities in case of a deeper retracement.
On the upside, the first resistance level at 1.3650 is an overlap resistance and coincides with the 61.80% Fibonacci retracement level, making it a strong area of resistance. If price breaks above this level, it could indicate a sustained bullish trend.
The second resistance level at 1.3753 is also an overlap resistance and coincides with the 78.60% Fibonacci retracement level, adding further strength to this resistance level.
DJ30:
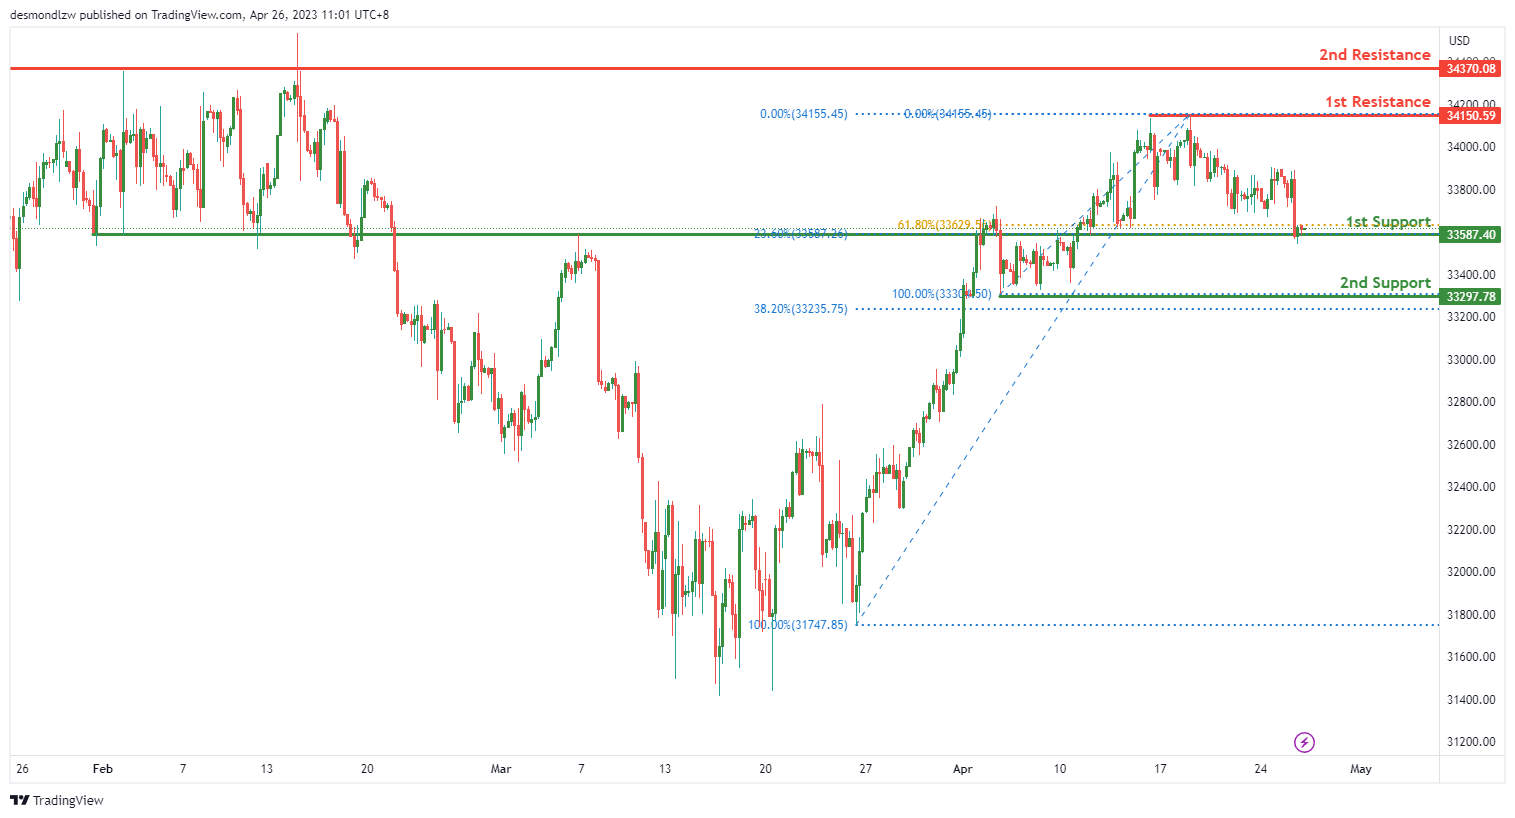
The DJ30 has been showing a weak overall momentum with low confidence. However, the price could potentially make a bullish bounce off the first support level and head towards the first resistance level.
The first support level is at 33,587.40 and it is considered a good support level due to its overlap support and its 23.60% Fibonacci retracement. The second support level is at 33,297.78, and it is also an overlap support, and its 38.20% Fibonacci retracement makes it a good level of support.
The first resistance level is at 34,150.59 and it is considered a good level of resistance due to its multi-swing high resistance. The second resistance level is at 34,370.08, and it is an overlap resistance that provides another potential level of resistance.
GER30:
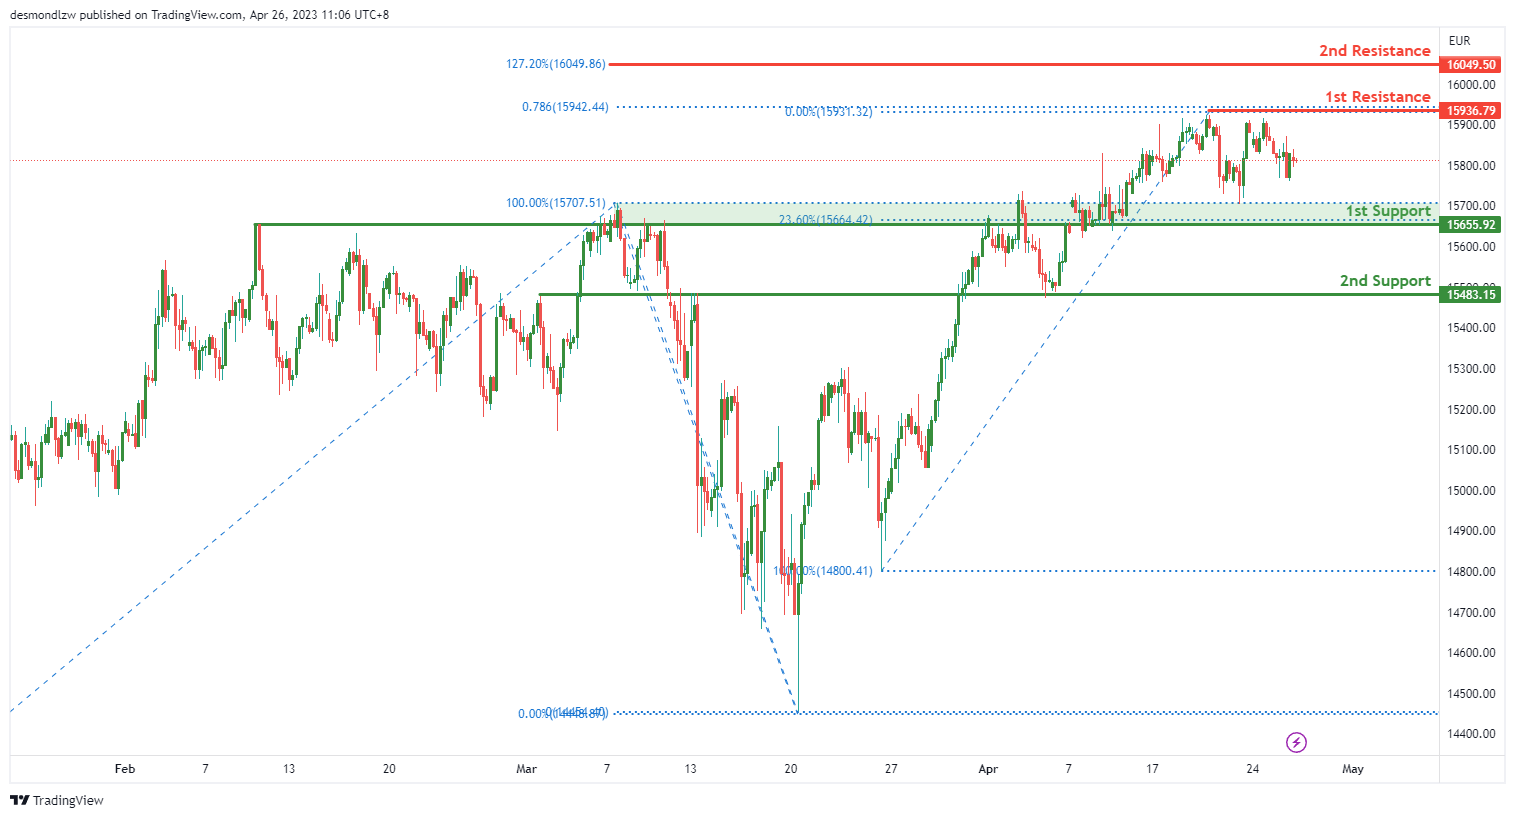
The GER30 index has been trading in a neutral momentum. The price could potentially fluctuate between the 1st support and 1st resistance level.
The 1st support level is at 15655.92, which is an overlap support and also coincides with the 23.60% Fibonacci retracement level. The 2nd support level is at 15483.15, which is an overlap support.
On the upside, the 1st resistance level is at 15936.79, which is a multi-swing high resistance level. The 2nd resistance level is at 16049.50, which is an overlap resistance level and also coincides with the 127.20% Fibonacci extension level.
BTC/USD:
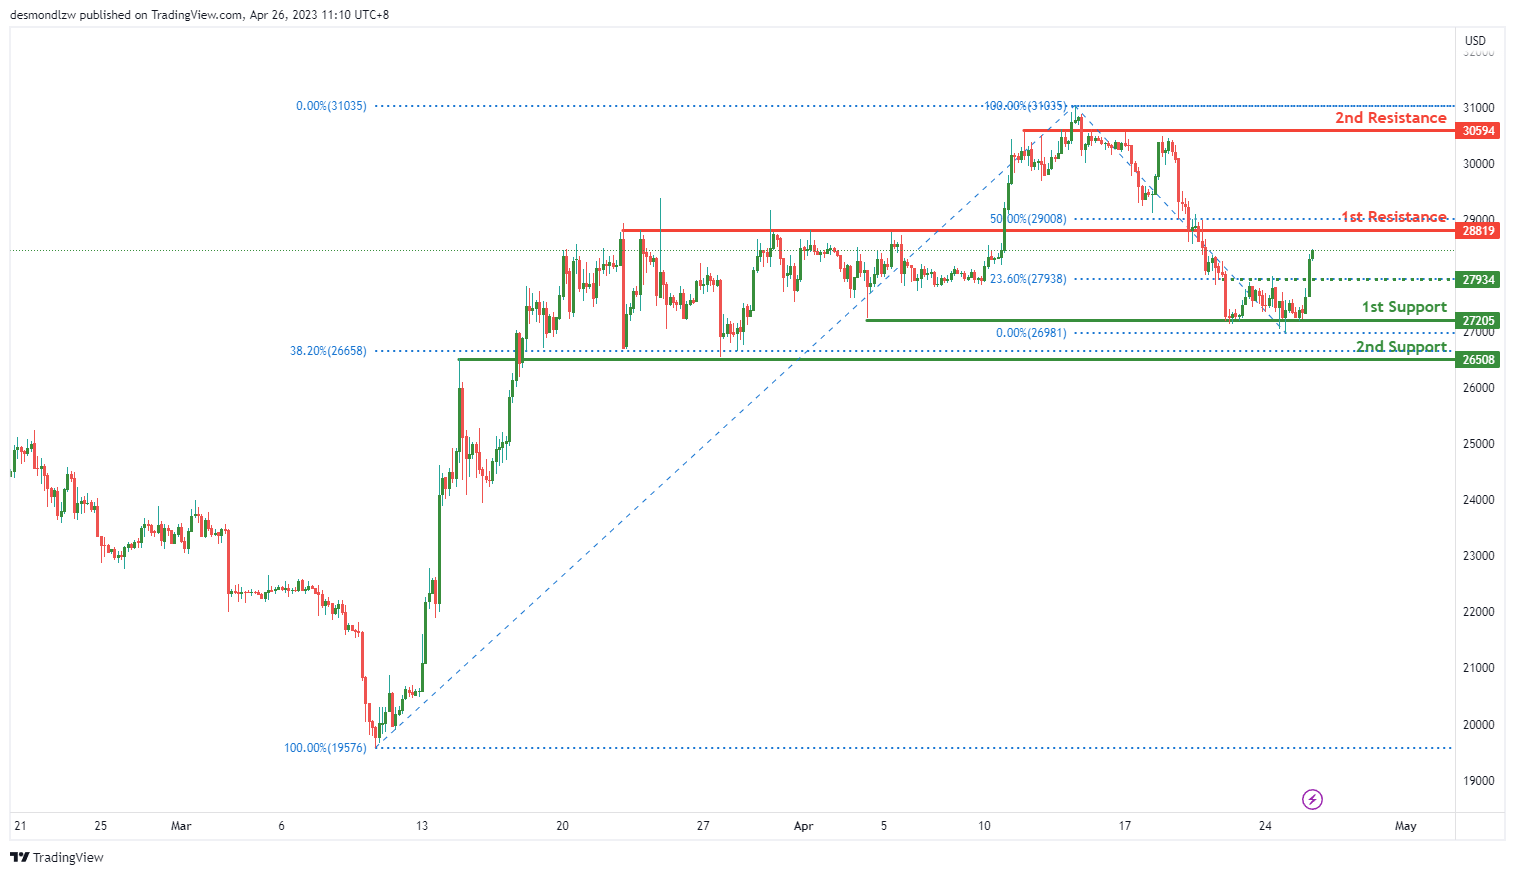
The current overall momentum of the chart for BTC/USD is showing strong bullishness with high confidence. Based on the current price action, Bitcoin has the potential to continue its bullish trend towards the first resistance level.
The first support level for BTC/USD is located at 27205.00, which is an overlap support level. This support level is expected to hold if the bullish trend continues. However, if the price drops below this level, the next support level is located at 26508.00, which is also an overlap support level and a 38.20% Fibonacci retracement level.
On the upside, the first resistance level is located at 28819.00, which is an overlap resistance level and a 50% Fibonacci retracement level. This level has the potential to attract sellers and push the price lower. However, if the price breaks above this level, the next resistance level is located at 30594.00, which is another overlap resistance level.
US500
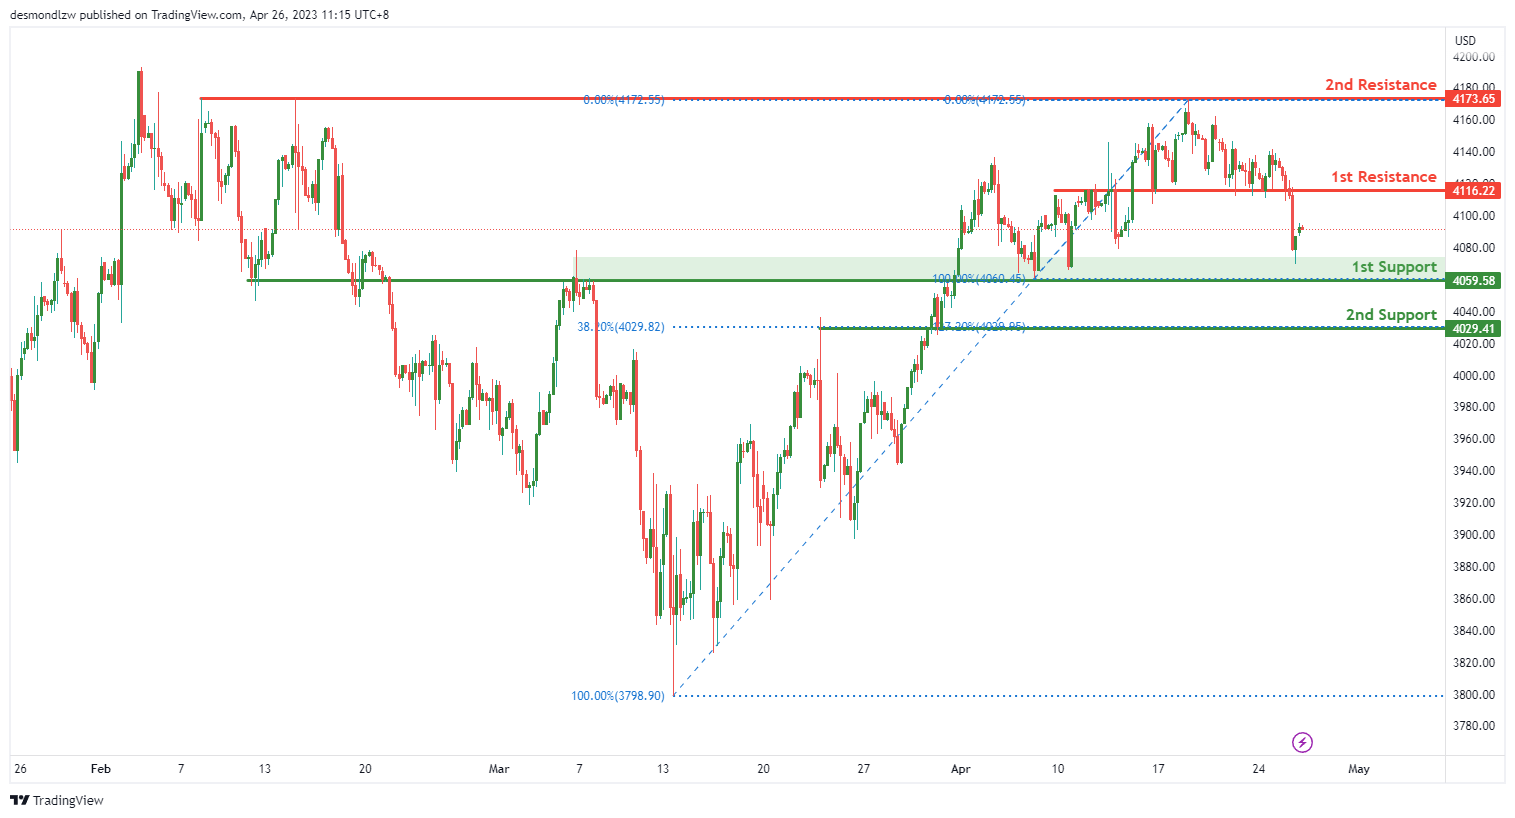
The US500 is currently exhibiting neutral momentum. Based on the chart, price could potentially fluctuate between the 1st resistance and 1st support level.
The 1st support level is at 4059.58 and is considered good because it is an overlap support. The 2nd support level is at 4029.41 and is also a good support level because it coincides with the 38.20% Fibonacci retracement.
On the other hand, the 1st resistance level is at 4116.22, which is an overlap resistance. The 2nd resistance level is at 4173.65, which is also an overlap resistance.
ETH/USD:
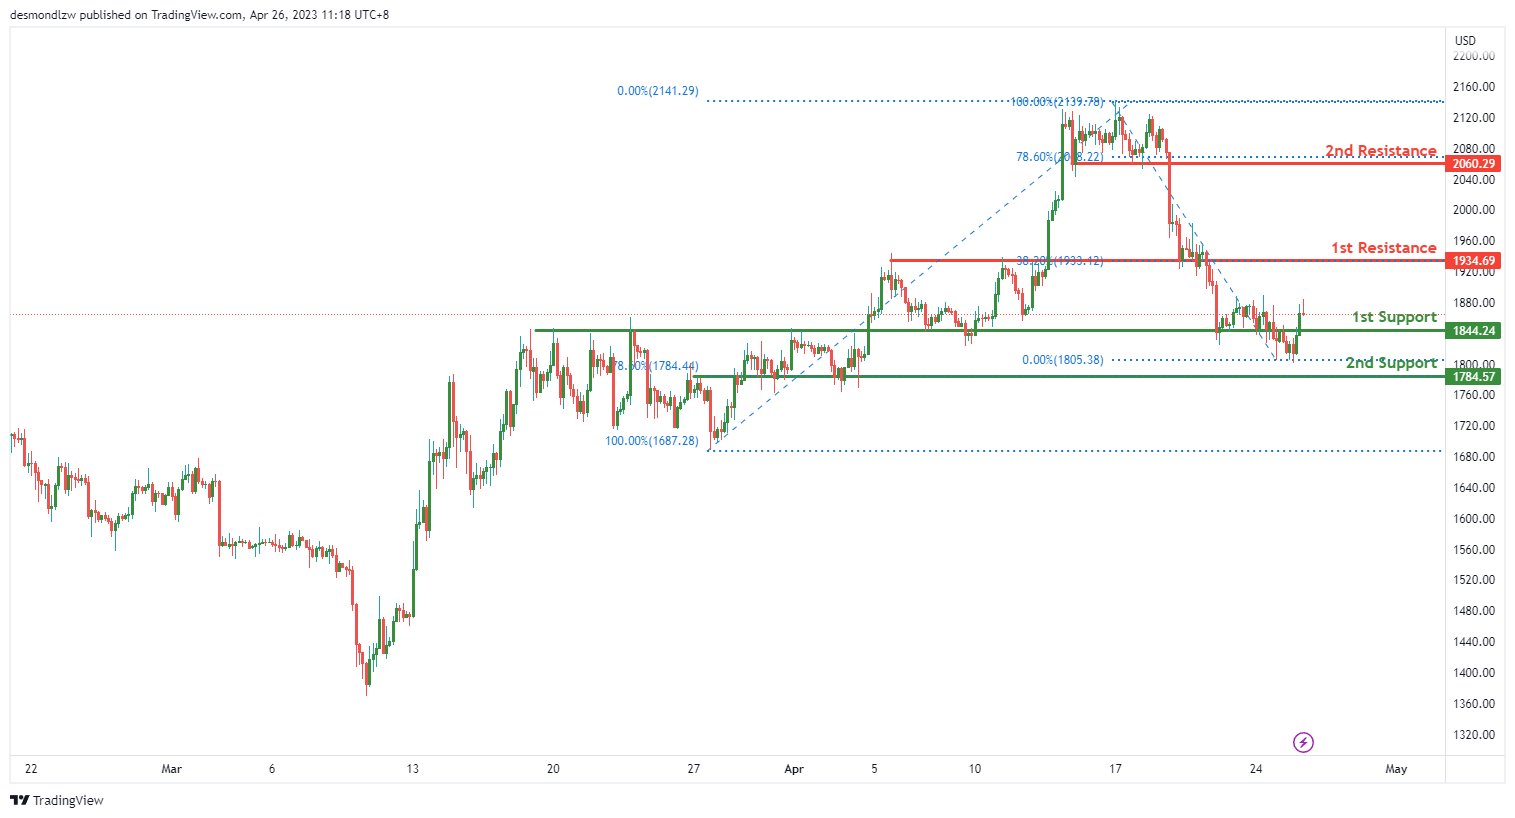
The chart of ETH/USD is currently showing signs of weakness with low confidence. The price could potentially continue its bearish move towards the first support level, which is located at 1844.24. This level is significant as it has acted as an overlap support in the past, which makes it more likely that it will provide a bounce for the price.
In case the price breaks below the first support level, it may continue to decline towards the second support level at 1784.57. This level is also significant as it represents the 78.60% Fibonacci retracement level of the recent bullish move, adding to its significance.
On the upside, the first resistance level at 1934.69 is significant as it has acted as an overlap resistance in the past. If the price manages to break above this level, it may head towards the second resistance level at 2060.29, which is also an overlap resistance and coincides with the 78.60% Fibonacci retracement level.
WTI/USD:
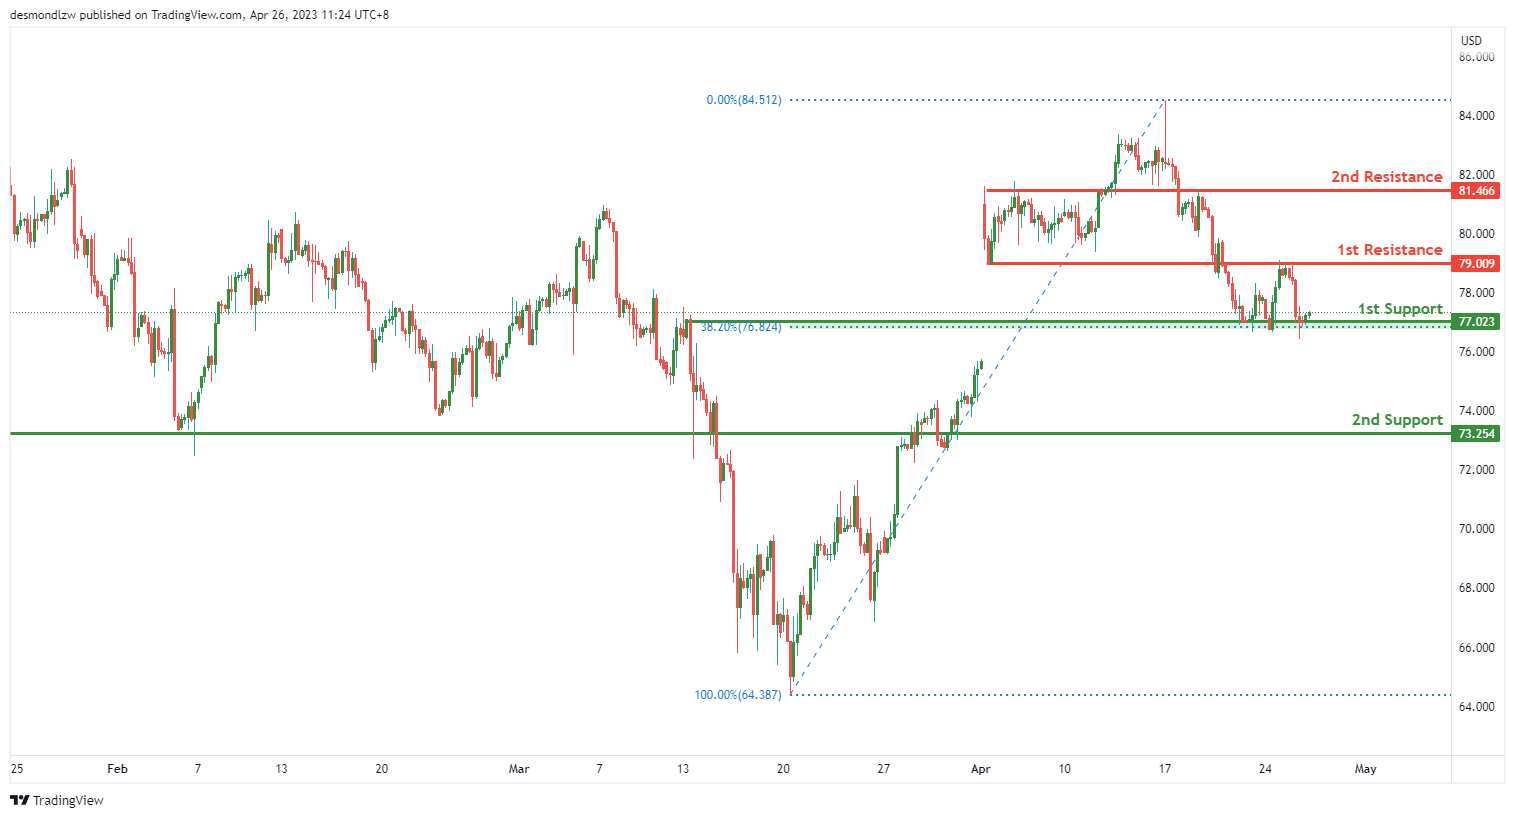
The overall momentum of WTI chart is currently bullish. The recent dip in price has provided a buying opportunity for traders as the price could potentially make a bullish bounce off the 1st support level and head towards the 1st resistance level.
The 1st support level is at 77.02 and it is a good support level as it is an overlap support level and also a 38.20% Fibonacci Retracement level. A bounce from this level could lead to a bullish momentum in price.
If the price fails to bounce off the 1st support level, it could potentially drop further to the 2nd support level at 73.25. This is also a good support level as it is an overlap support level.
On the other hand, the 1st resistance level is at 79.01 and it is a good resistance level as it is an overlap resistance level. If the price manages to break through this resistance level, it could potentially head towards the 2nd resistance level at 81.47.
XAU/USD (GOLD):
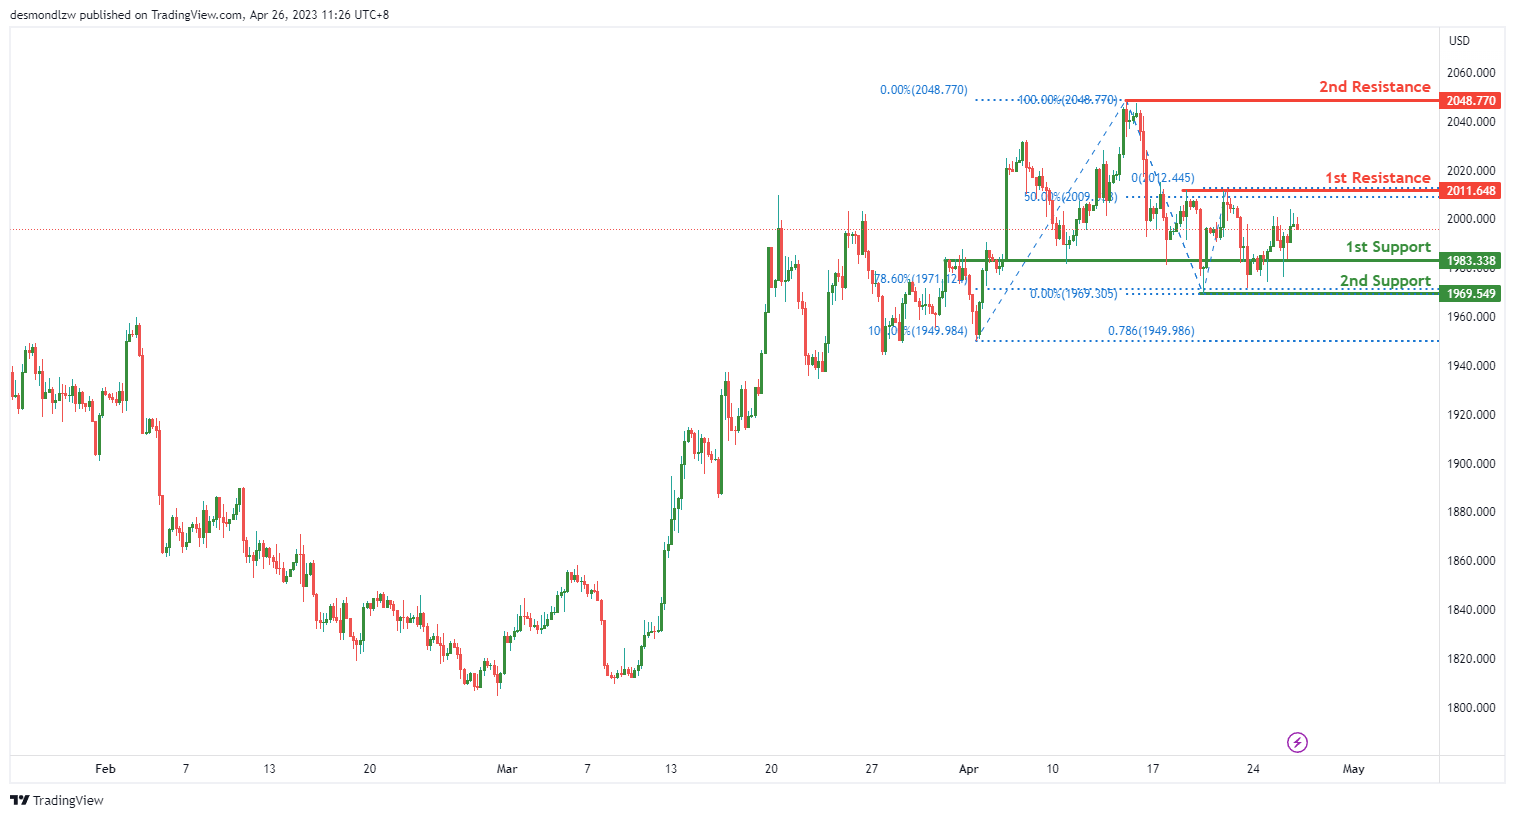
The XAU/USD price has a weak bearish momentum with low confidence, and it could potentially make a bearish continuation towards the first support level before bouncing back up towards the first resistance level.
The first support level is at 1983.34, which is an overlap support. The second support level at 1969.55 is also an overlap support and is at 78.60% Fibonacci retracement.
On the other hand, the first resistance level at 2011.65 is an overlap resistance and is at 50% Fibonacci retracement. The second resistance level at 2048.77 is a swing high resistance.
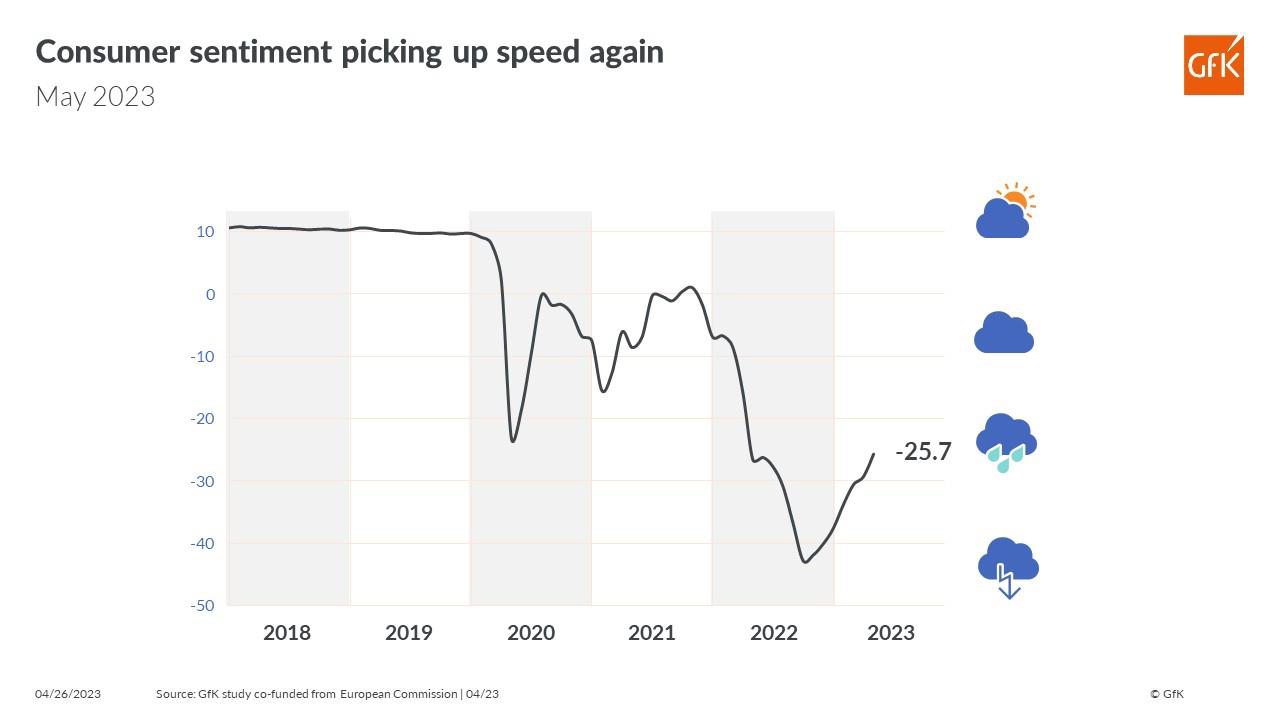
Germany Gfk consumer sentiment rose to -25.7, improved economic and income expectations
Germany Gfk Consumer Sentiment for May improved from -29.3 to -25.7, above expectation of -27.5. In April, Economic Expectations rose sharply from 3.7 to 14.3. Income Expectations rose from -24.3 to -10.7. Propensity to Buy rose from -17.0 to -13.1.
The seventh increase in a row indicates that consumer sentiment is gathering momentum. "Following a rather small increase in the previous month, consumer sentiment is showing clear signs of an upswing this month," explains Rolf Bürkl, GfK consumer expert.
"However, the value still remains below pre-pandemic levels of around three years ago. On another positive note, income expectations have risen for the seventh time in a row, returning to the level prior to the start of the war in Ukraine for the first time."
AUD/USD Daily Report
Daily Pivots: (S1) 0.6592; (P) 0.6649; (R1) 0.6683; More...
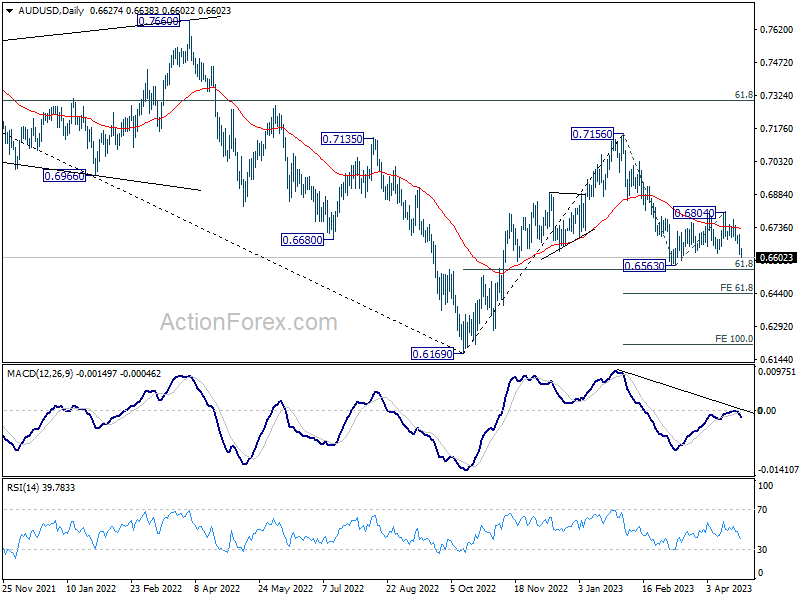
AUD/USD's break of 0.6619 support argues that consolidation pattern from 0.6563 has completed at 0.6804, and larger fall from 0.7156 is ready to resume. Intraday bias is now on the downside for 0.6563 support first. Firm break there should bring deeper decline through 0.6546 fibonacci level to 61.8% projection of 0.7156 to 0.6563 from 0.6804 at 0.6438 next. On the upside, though, above 0.6704 minor resistance will delay the bearish case and turn intraday bias neutral first.
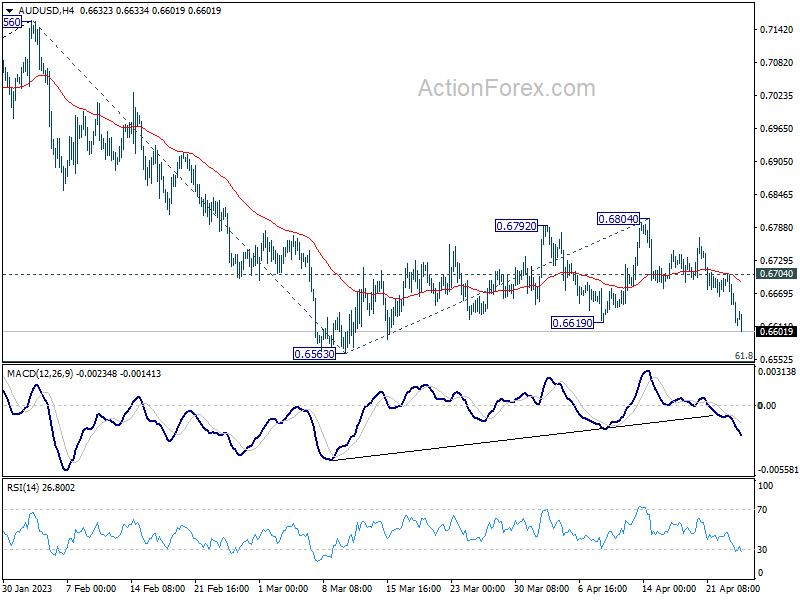
In the bigger picture, as long as 61.8% retracement of 0.6169 to 0.7156 at 0.6546 holds, the decline from 0.7156 is seen as a correction to rally from 0.6169 (2022 low) only. Another rise should still be seen through 0.7156 at a later stage. However, sustained break of 0.6546 will raise the chance of long term down trend resumption through 0.6169 low.
Risk Aversion Gains Momentum, Aussie Heading Back to Year Low Against Dollar
Risk aversion is intensifying as US stocks tumbled significantly overnight, following First Republic Bank's earnings report, which reignited concerns about the broader banking sector. The troubled regional bank's shares plummeted by nearly half. Concurrently, bonds surged higher, pushing 10-year yield below 3.4% handle. Japanese Yen and Swiss Franc surged following the shift in sentiment, trailed by Dollar.
Meanwhile, Australian Dollar led the decline, as it was further pressured by plunging Copper prices. Aussie could be ready to break through 2023 low against the greenback. Canadian Dollar followed as the second worst performer, with Sterling following. Euro is mixed as partly supported by hawkish comments by ECB officials.
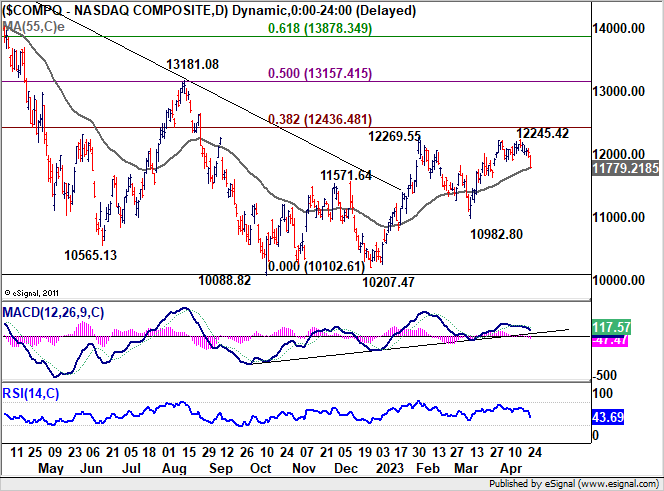
Technically, it appears that NASDAQ's rebound from 10,982.80 has peaked at 12,245.42, just ahead of 12,269.55 resistance. Immediate focus returns to 55 D EMA (now at 11,779.21). Sustained break there could prompt deeper decline back towards 10,982.80 support. As long as 10,982.80 support holds, outlook would be more neutral than bearish, with another rise through 12,269.55 remaining slightly in favor. However, firm break below 10,982.80 could signal that larger downtrend from 2021 high of 16,212.22 is resuming through 10,088.82 low.
In Asia, at the time of writing, Nikkei is down -0.92%. Hong Kong HSI is up 0.59%. China Shanghai SSE is down -0.31%. Singapore Strait Times is down -0.15%. Japan 10-year JGB yield is down -0.015 at 0.465. Overnight DOW dropped -1.02%. S&P 500 dropped -1.58%. NASDAQ dropped -1.98%. 10-year yield dropped sharply by -0.119 to 3.396.
BoE Pill: We've had a series of transitory inflation shocks one after the other
In an interview on the "Beyond Unprecedented" podcast produced by Columbia University's law school, BoE Chief Economist Huw Pill reiterated the central bank's official forecast, stating that some factors maintaining high inflation are likely to recede in the upcoming months and that inflation could fall below the 2% target in the next few years.
Discussing the continuous inflationary shocks faced by the UK, Pill said, "We've had a series of inflation shocks that just come one after the other." He added, "Each of those shocks was in itself transitory, but they just were timed in a way that inflation never dissipated."
Pill emphasized the need for UK citizens to accept being worse off and to refrain from trying to maintain their real spending power by driving up prices through higher wages or passing on energy costs to customers. Pill observed, "What we're facing now is that reluctance to accept that, yes, we're all worse off and have to take our share."
He also highlighted the UK's status as a major net importer of natural gas and the resulting challenges, noting, "The UK, which is a big net importer of natural gas, is facing a situation that the price of what you're buying from the rest of the world has gone up a lot, relative to the price of what you're selling to the rest of the world, which is mainly services in the case of the UK."
Pill concluded, "If what you're buying has gone up a lot relative to what you're selling, you're going to be worse off."
BoJ Ueda: Dealing with cost-push inflation is very difficult
In an address to parliament today, BoJ Governor Kazuo Ueda highlighted the difficulties central banks face when dealing with cost-push inflation.
Ueda explained, "In general, dealing with cost-push inflation is very difficult for central banks. On the one hand, you'd like to curb inflation. On the other hand, you don't want to tighten monetary policy knowing that cost-push inflation will cool the economy."
The governor emphasized the importance of striking the right balance, which he said, "depends on economic developments at the time, including where inflation stood at the outset."
Ueda also noted that cost-push inflation in Japan is likely to ease as prices of imported raw materials have probably peaked.
These comments come ahead of BoJ's two-day policy meeting starting on Thursday, during which the central bank is widely anticipated to maintain its ultra-loose monetary policy.
Australia CPI down to 7.0% yoy in Q1, 6.3% yoy in Mar
Australia CPI slowed from 7.8% yoy to 7.0% yoy in Q1, slightly above expectation of 6.9% yoy. For the quarter, CPI rose 1.4% qoq, down from prior 1.9% qoq, below expectation of 1.3% qoq. Trimmed mean CPI rose 1.2% qoq, 6.6% yoy while weighted median CPI rose 1.2% qoq, 5.8% yoy.
Michelle Marquardt, ABS head of prices statistics, said "CPI inflation slowed in the March quarter, with the quarterly rise being the lowest since December 2021. While prices continued to rise for most goods and services, many of these increases were smaller than they have been in recent quarters."
Monthly CPI slowed from 6.8% yoy to 6.3% yoy in March, below expectation of 6.5% yoy. Excluding volatile items (Fruit and vegetables and Automotive fuel) CPI, rose from 6.8% yoy to 6.9% yoy.
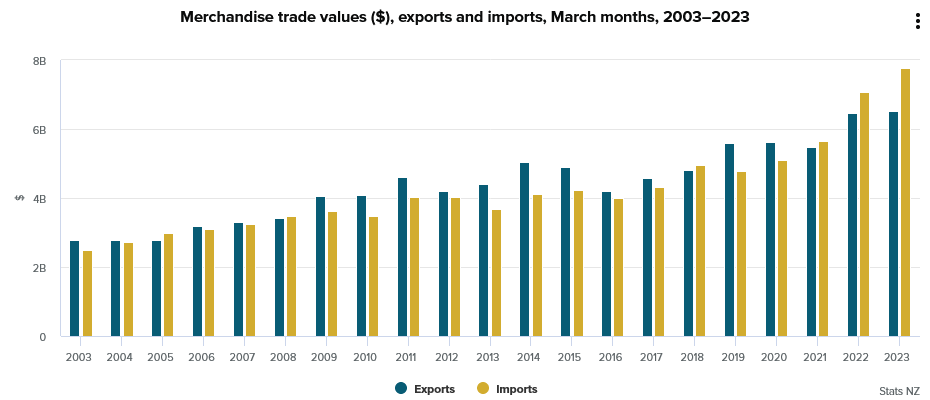
NZ imports surged 10% yoy, export rose 0.6% yoy in Mar
New Zealand goods exports rose 0.6% yoy or NZD 40m to NZD 6.5B in March. Imports rose 10% yoy or NZD 719m to NZD 7.8B. Monthly trade balance recorded a deficit of NZD -1.3B, larger than expectation of NZD -0.5B.
Australia contributed the most to the growth in monthly exports, with a 30% rise. Goods exports to the US was up 4.1%, EU up 28%, but down -9.6% to Japan and down -5.7% to China.
On the other hand, imports from the US leads the monthly rise, up 39%. Imports from EU and South Korea grew 24% and 20% respectively. On the other hand, imports from China was down -13%, Australia down -4.0%.
Looking ahead
Germany Gfk consumer confidence and Swiss Credit Suisse economic expectations will be released in European session. Later in the day, US will publish durable goods orders and goods trade balance.
AUD/USD Daily Report
Daily Pivots: (S1) 0.6592; (P) 0.6649; (R1) 0.6683; More...
AUD/USD's break of 0.6619 support argues that consolidation pattern from 0.6563 has completed at 0.6804, and larger fall from 0.7156 is ready to resume. Intraday bias is now on the downside for 0.6563 support first. Firm break there should bring deeper decline through 0.6546 fibonacci level to 61.8% projection of 0.7156 to 0.6563 from 0.6804 at 0.6438 next. On the upside, though, above 0.6704 minor resistance will delay the bearish case and turn intraday bias neutral first.
In the bigger picture, as long as 61.8% retracement of 0.6169 to 0.7156 at 0.6546 holds, the decline from 0.7156 is seen as a correction to rally from 0.6169 (2022 low) only. Another rise should still be seen through 0.7156 at a later stage. However, sustained break of 0.6546 will raise the chance of long term down trend resumption through 0.6169 low.
Economic Indicators Update
| GMT | Ccy | Events | Actual | Forecast | Previous | Revised |
|---|---|---|---|---|---|---|
| 22:45 | NZD | Trade Balance (NZD) Mar | -500M | -714M | ||
| 01:30 | AUD | Monthly CPI Y/Y Mar | 6.30% | 6.50% | 6.80% | |
| 01:30 | AUD | CPI Q/Q Q1 | 1.40% | 1.30% | 1.90% | |
| 01:30 | AUD | CPI Y/Y Q1 | 7.00% | 6.90% | 7.80% | |
| 01:30 | AUD | RBA Trimmed Mean CPI Q/Q Q1 | 1.20% | 1.40% | 1.70% | |
| 01:30 | AUD | RBA Trimmed Mean CPI Y/Y Q1 | 6.60% | 7.20% | 6.90% | |
| 06:00 | EUR | Germany Gfk Consumer Confidence May | -27.5 | -29.5 | ||
| 08:00 | CHF | Credit Suisse Economic Expectations Apr | -41.3 | |||
| 12:30 | USD | Goods Trade Balance (USD) Mar P | -89.8B | -91.6B | ||
| 12:30 | USD | Wholesale Inventories Mar P | -0.20% | 0.10% | ||
| 12:30 | USD | Durable Goods Orders Mar | 0.80% | -1.00% | ||
| 12:30 | USD | Durable Goods Orders ex Transport Mar | -0.20% | -0.10% | ||
| 14:30 | USD | Crude Oil Inventories | -1.3M | -4.6M |
Australia CPI down to 7.0% yoy in Q1, 6.3% yoy in Mar
Australia CPI slowed from 7.8% yoy to 7.0% yoy in Q1, slightly above expectation of 6.9% yoy. For the quarter, CPI rose 1.4% qoq, down from prior 1.9% qoq, below expectation of 1.3% qoq. Trimmed mean CPI rose 1.2% qoq, 6.6% yoy while weighted median CPI rose 1.2% qoq, 5.8% yoy.
Michelle Marquardt, ABS head of prices statistics, said "CPI inflation slowed in the March quarter, with the quarterly rise being the lowest since December 2021. While prices continued to rise for most goods and services, many of these increases were smaller than they have been in recent quarters."
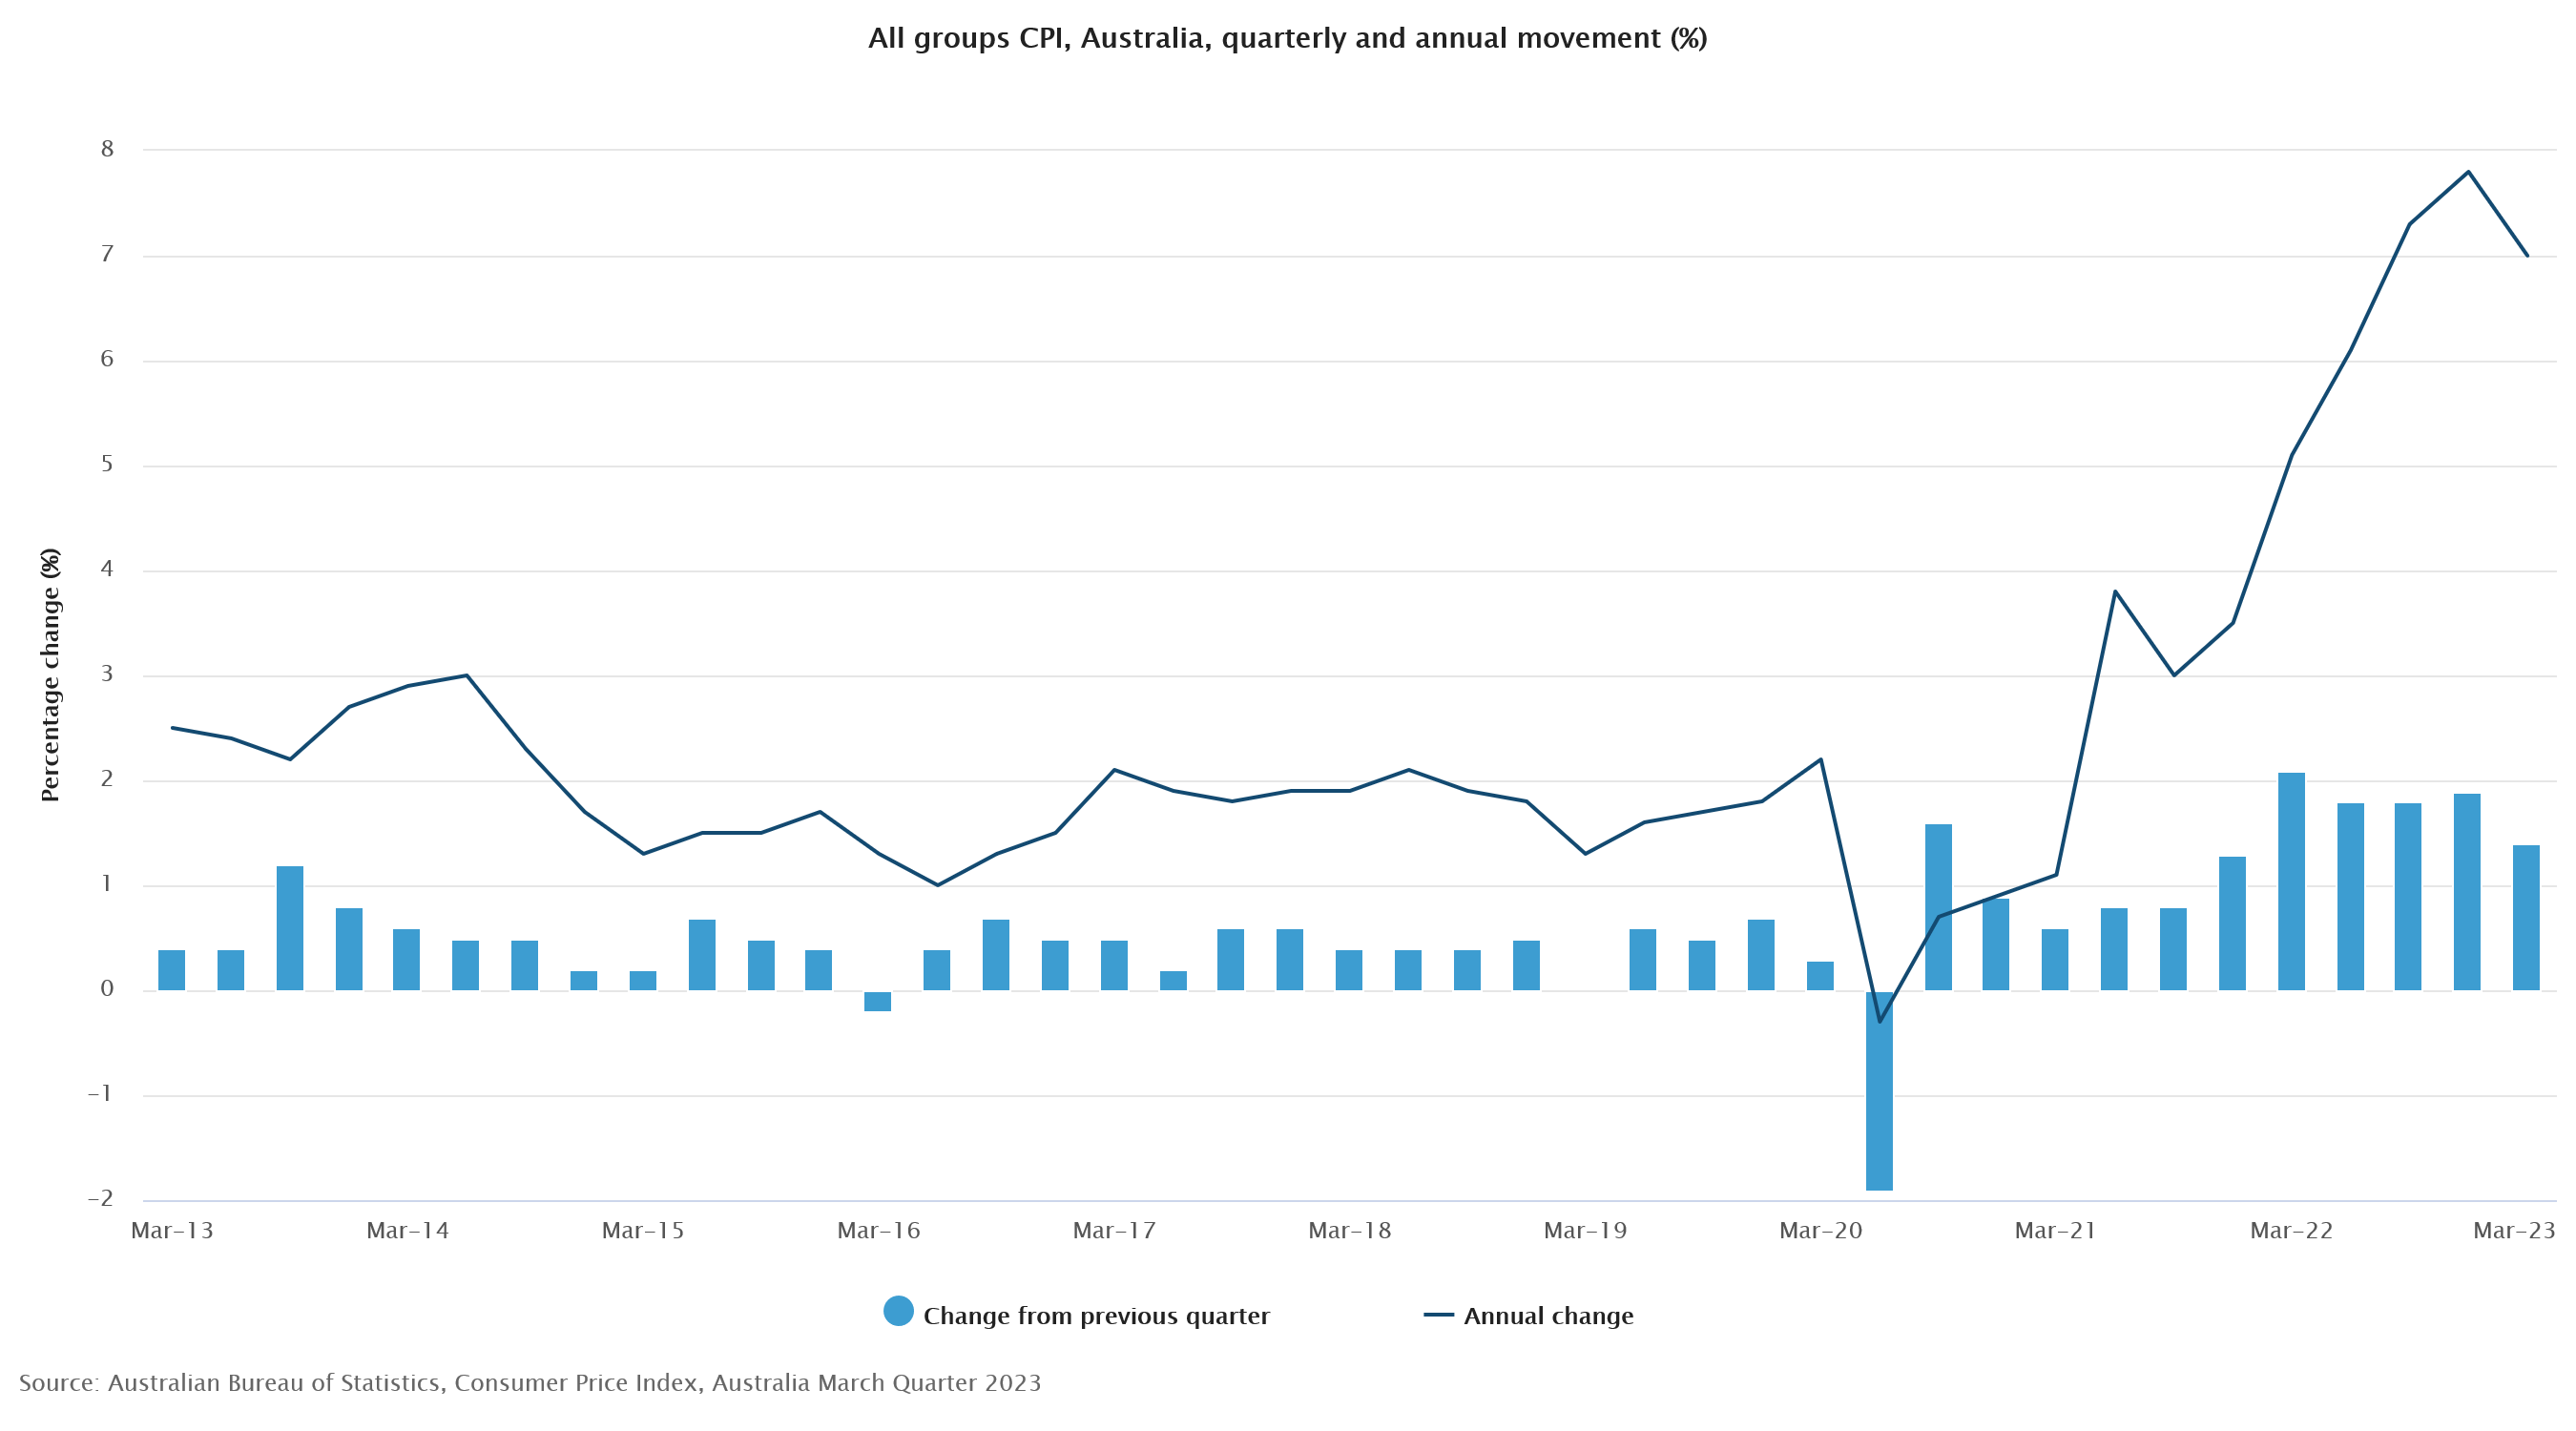
Monthly CPI slowed from 6.8% yoy to 6.3% yoy in March, below expectation of 6.5% yoy. Excluding volatile items (Fruit and vegetables and Automotive fuel) CPI, rose from 6.8% yoy to 6.9% yoy.
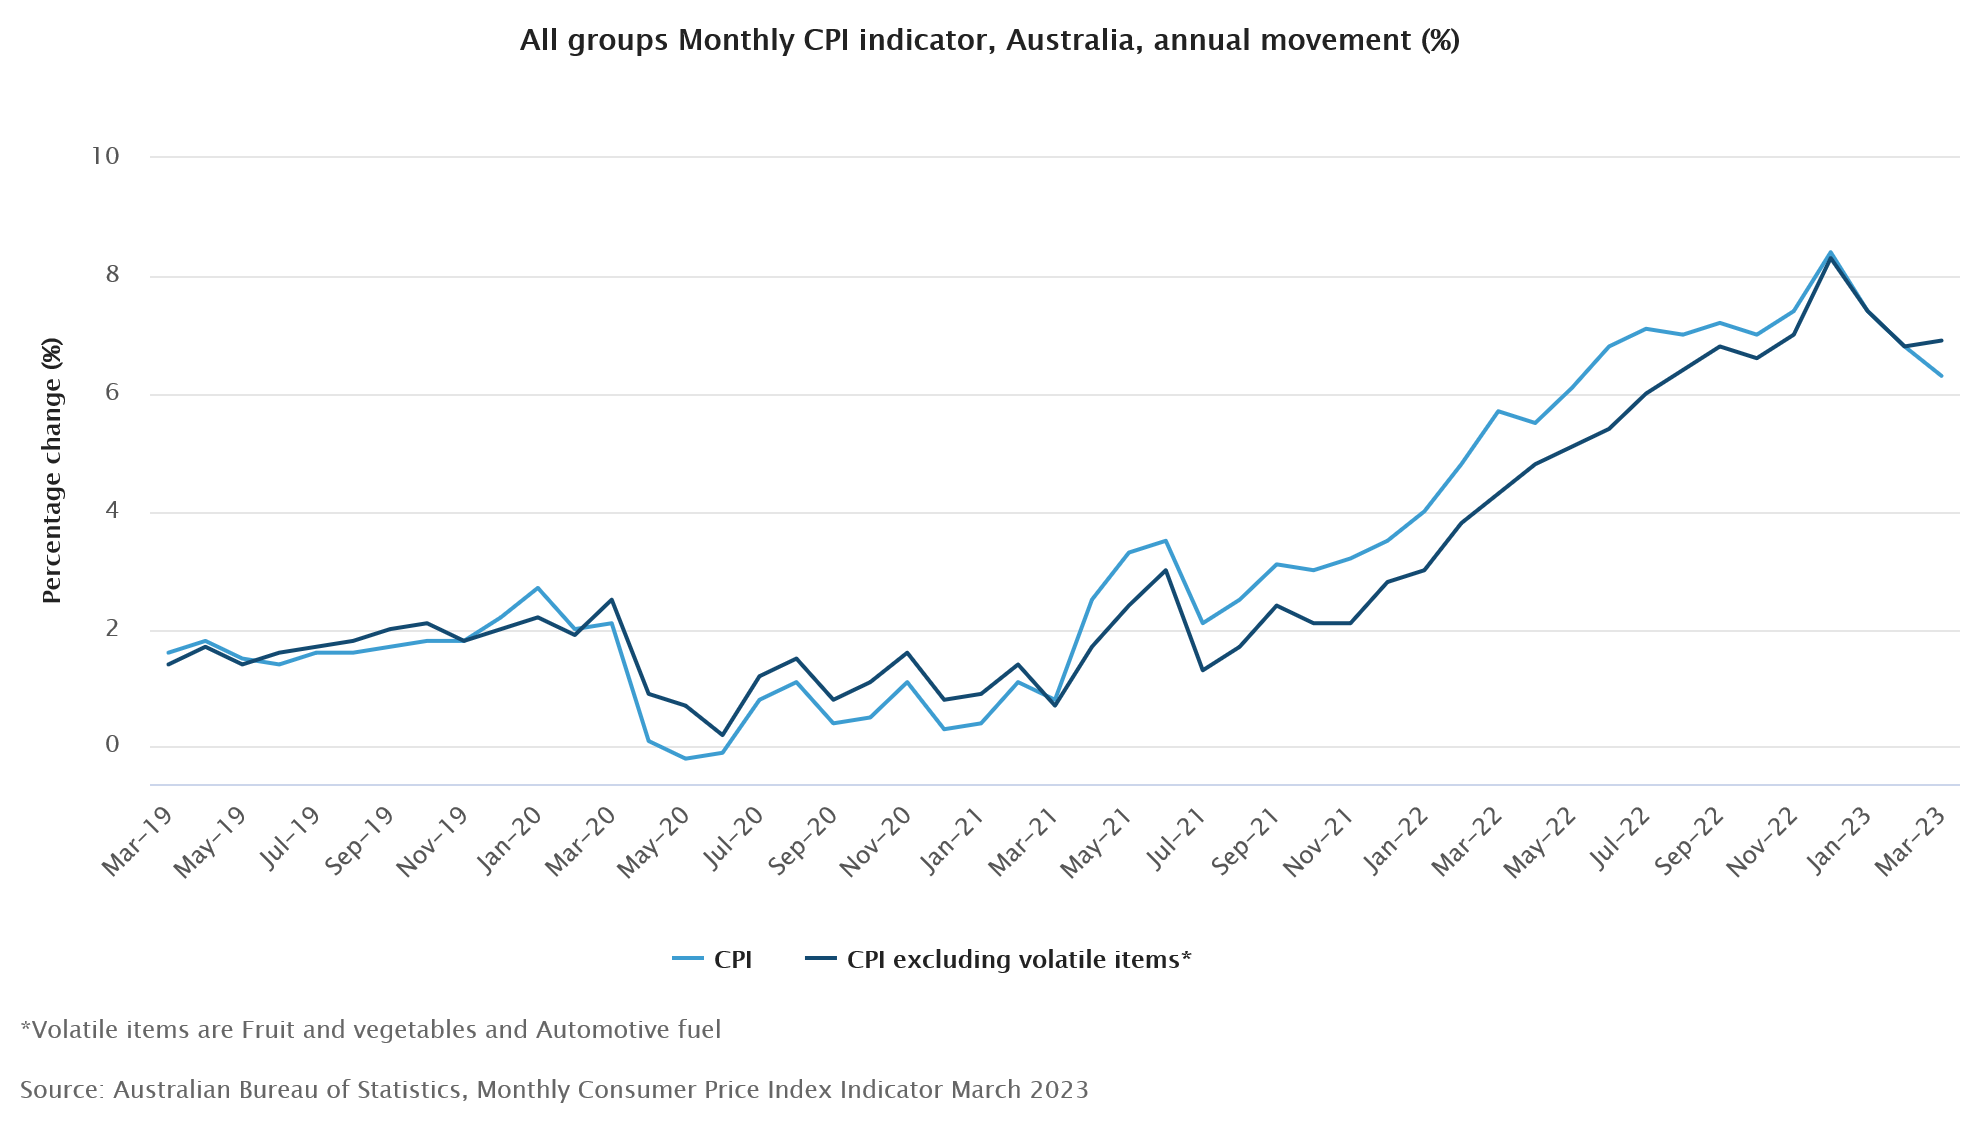
Full Australia quarterly CPI release here, and monthly CPI release here.
NZ imports surged 10% yoy, export rose 0.6% yoy in Mar
Australia contributed the most to the growth in monthly exports, with a 30% rise. Goods exports to the US was up 4.1%, EU up 28%, but down -9.6% to Japan and down -5.7% to China.
On the other hand, imports from the US leads the monthly rise, up 39%. Imports from EU and South Korea grew 24% and 20% respectively. On the other hand, imports from China was down -13%, Australia down -4.0%.
BoJ Ueda: Dealing with cost-push inflation is very difficult
In an address to parliament today, BoJ Governor Kazuo Ueda highlighted the difficulties central banks face when dealing with cost-push inflation.
Ueda explained, "In general, dealing with cost-push inflation is very difficult for central banks. On the one hand, you'd like to curb inflation. On the other hand, you don't want to tighten monetary policy knowing that cost-push inflation will cool the economy."
The governor emphasized the importance of striking the right balance, which he said, "depends on economic developments at the time, including where inflation stood at the outset."
Ueda also noted that cost-push inflation in Japan is likely to ease as prices of imported raw materials have probably peaked.
These comments come ahead of BoJ's two-day policy meeting starting on Thursday, during which the central bank is widely anticipated to maintain its ultra-loose monetary policy.
BoE Pill: We’ve had a series of transitory inflation shocks one after the other
In an interview on the "Beyond Unprecedented" podcast produced by Columbia University's law school, BoE Chief Economist Huw Pill reiterated the central bank's official forecast, stating that some factors maintaining high inflation are likely to recede in the upcoming months and that inflation could fall below the 2% target in the next few years.
Discussing the continuous inflationary shocks faced by the UK, Pill said, "We've had a series of inflation shocks that just come one after the other." He added, "Each of those shocks was in itself transitory, but they just were timed in a way that inflation never dissipated."
Pill emphasized the need for UK citizens to accept being worse off and to refrain from trying to maintain their real spending power by driving up prices through higher wages or passing on energy costs to customers. Pill observed, "What we're facing now is that reluctance to accept that, yes, we're all worse off and have to take our share."
He also highlighted the UK's status as a major net importer of natural gas and the resulting challenges, noting, "The UK, which is a big net importer of natural gas, is facing a situation that the price of what you're buying from the rest of the world has gone up a lot, relative to the price of what you're selling to the rest of the world, which is mainly services in the case of the UK."
Pill concluded, "If what you're buying has gone up a lot relative to what you're selling, you're going to be worse off."
Crude Oil Price Reaches Key Support, Gold Consolidates
Key Highlights
- Crude oil prices started a downside correction below the $80 support.
- A key bearish trend line is forming with resistance near $78.60 on the 4-hour chart.
- EUR/USD and GBP/USD corrected lower from local highs.
- The US Durable Goods Orders could increase by 0.8% in March 2023.
Crude Oil Price Technical Analysis
Crude oil prices struggled to clear the $83.50 resistance against the US Dollar. The price declined below the $80.00 support to move into a short-term bearish zone.
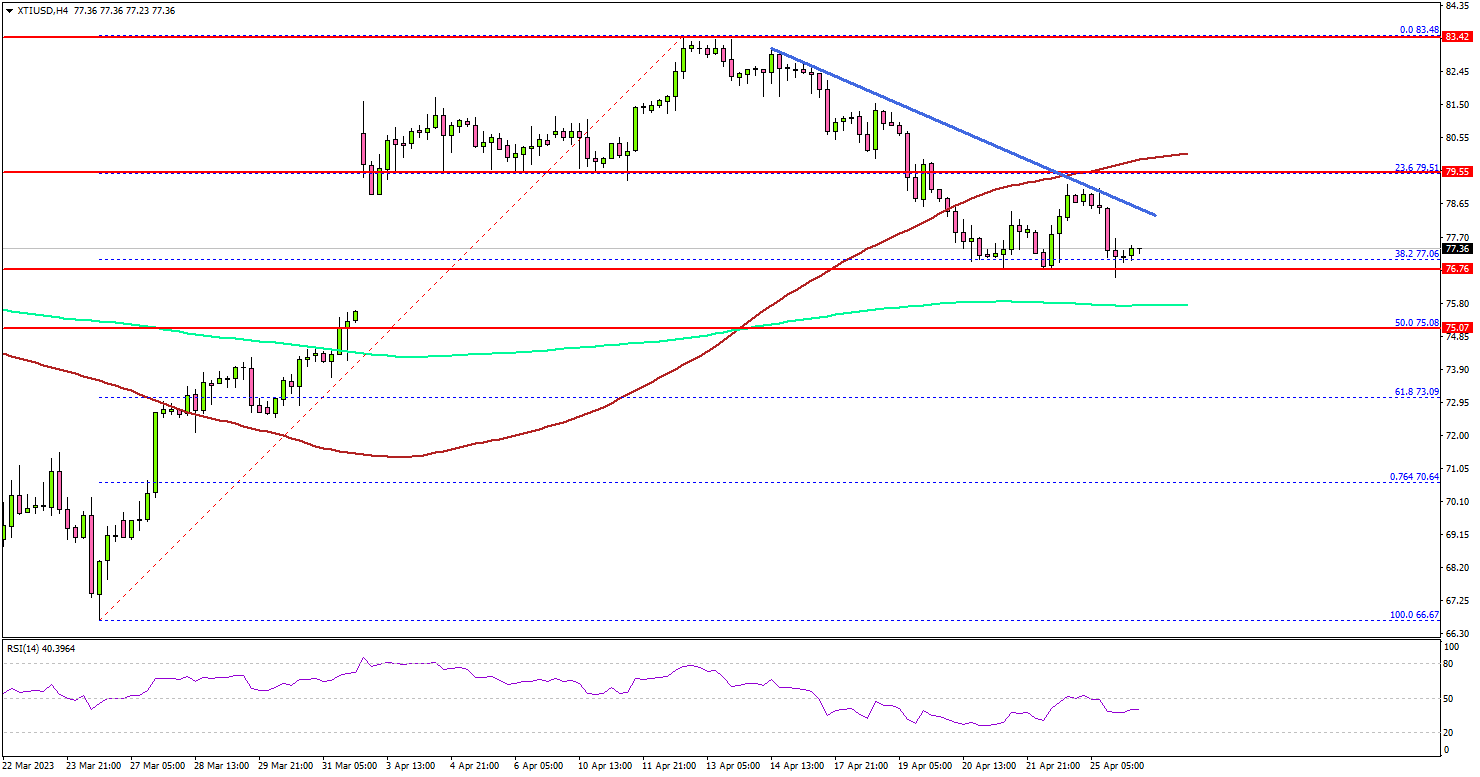
Looking at the 4-hour chart of XTI/USD, the price even declined below $78.80 and the 100 simple moving average (red, 4-hour). It tested the 38.2% Fib retracement level of the upward move from the $66.67 swing low to the $83.48 high.
The next major support sits near the $75.80 level or the 200 simple moving average (green, 4-hour). Any more losses might call for a test of 61.8% Fib retracement level of the upward move from the $66.67 swing low to the $83.48 high at $73.00.
On the upside, the price is facing resistance near the $78.65 level. The next major resistance is near the $79.50 zone and the 100 simple moving average (red, 4-hour).
A clear move above the $79.50 resistance could open the doors for another steady increase toward $80.50 or even $81.20.
Looking at EUR/USD, the pair struggled to gain strength and reacted to the downside from the 1.1050 zone.
Economic Releases to Watch Today
- US Durable Goods Orders for March 2023 – Forecast +0.8% versus -1% previous.
- US Durable Goods Orders Ex Defense for March 2023 – Forecast 0% versus -0.5% previous.