

Sample Category Title
AUD/USD Slips to 2-Week Low Ahead of CPI
- AUD/USD is down almost 1%
- Australian CPI expected to drop to 6.6%
- UoM Consumer Sentiment falls, US New Home Sales jump
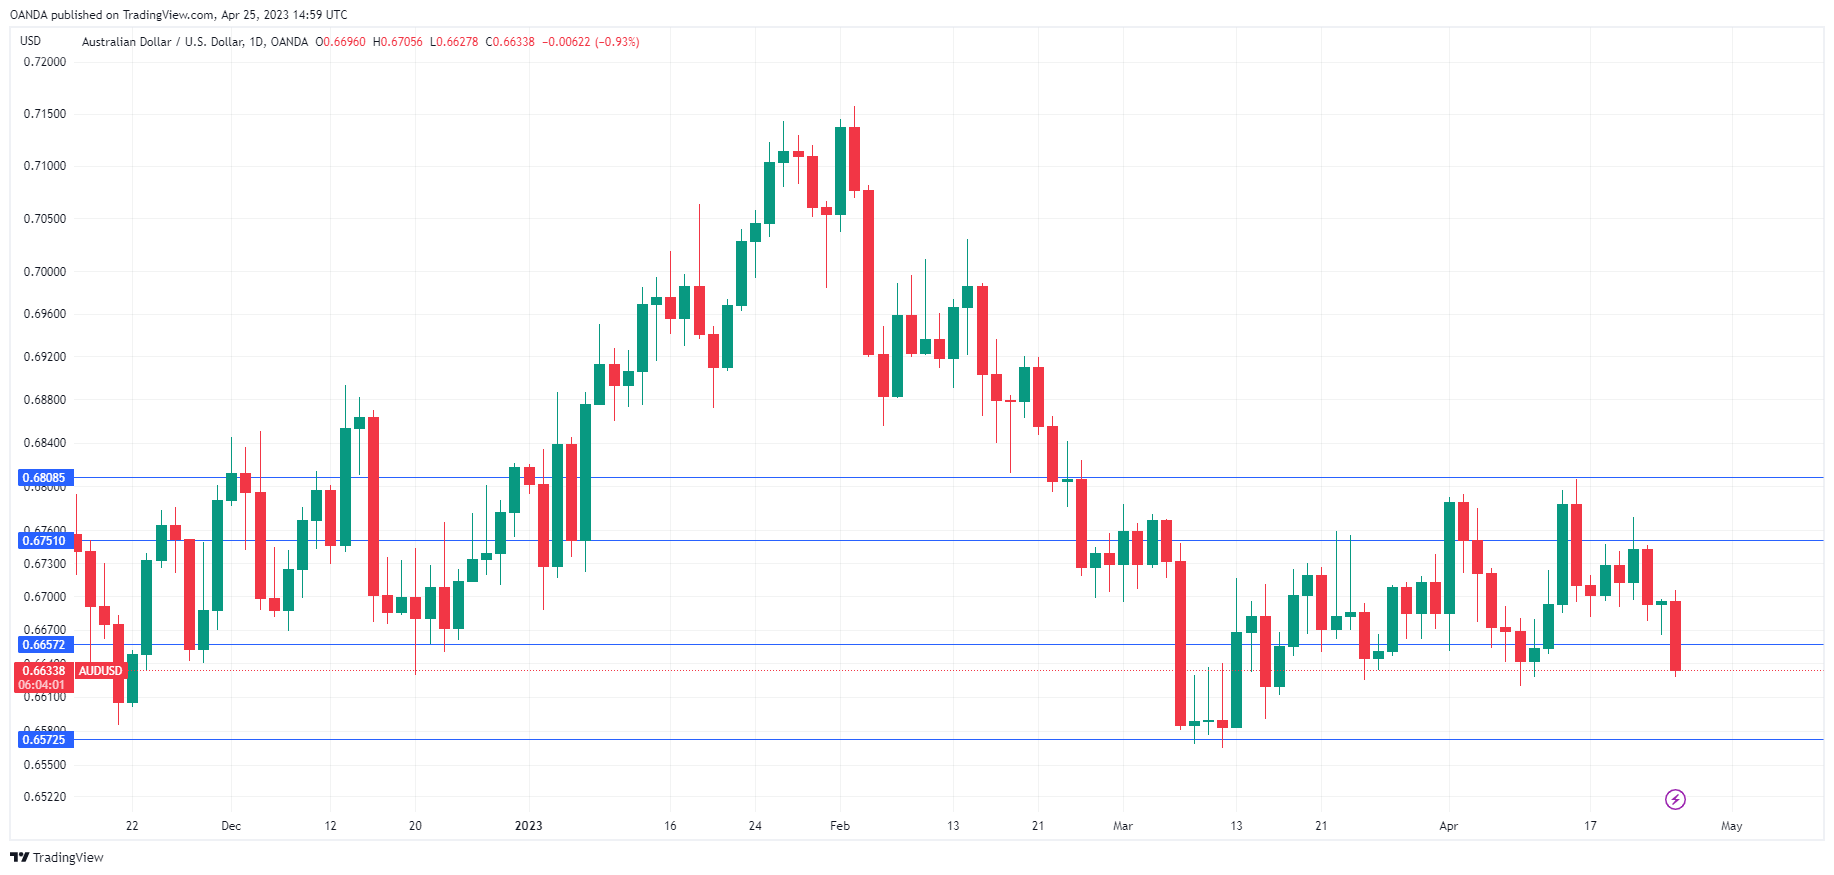
The Australian dollar has plunged on Tuesday. AUD/USD is trading at 0.6632, down 0.95% on the day. The Aussie is under strong downward pressure, having lost around 1.7% since Thursday.
Australian inflation expected to fall
Australia releases inflation on a quarterly basis, which magnifies the impact of the release. Inflation has been falling and this trend is expected to continue in the Wednesday release of first-quarter CPI. The headline figure is expected to fall from 7.8% to 6.9% y/y and from 1.9% to 1.3% q/q. The core rate, which is considered a more reliable gauge, is likewise expected to fall – from 6.9% to 6.7% y/y and from 1.7% to 1.4% q/q.
Investors will be mindful that headline inflation surprised on the upside in Q4, rising from 7.3% to 7.8%. The two monthly inflation reports since the Q4 release in January, however, indicated that inflation was back on its way down, with headline CPI falling from 7.4% to 6.8% and beating expectations.
The RBA would love to pause rates at 3.60% for a second straight month, and another drop in inflation would strongly support a pause at the May 2nd meeting. As well, another deceleration would be a strong indication that inflation has peaked, although the battle is far from over as it will take a long time to achieve the 2% target. The likelihood of another pause in rates stands at 83%, according to the RBA Rate Tracker.
In the US, today’s data has been a mixed bag. UoM Consumer Sentiment for April was expected to remain unchanged at 104.0, but surprised on the downside, falling to 101.3. There was better news from New Home Sales, which soared 9.6% in March, rebounding from -3.9% in February and crushing the estimate of 1.1%.
AUD/USD Technical
- There is resistance at 0.6751 and 0.6808
- AUD/USD is testing support at 0.6657. Next, there is support at 0.6572
Cryptos to Recover Bull-run in May
Bank of Indonesia Governor Perry Warjiyo announced that Jakarta is following the lead of the BRICS bloc to reduce dependence on the USD and diversify the use of currency in international trade. Indonesia is "more concrete" than the BRICS because they have already implemented the currency diversification method with several nations, including Thailand, Malaysia, China, and Japan. And the Indonesian government plans to sign an agreement with South Korea soon. Other countries are seeking alternatives as the US continues to weaponize the dollar. It seems the USD may have to share the spotlight with other currencies soon. The search for alternatives will positively impact the crypto markets as early-bird investors look to capitalize.
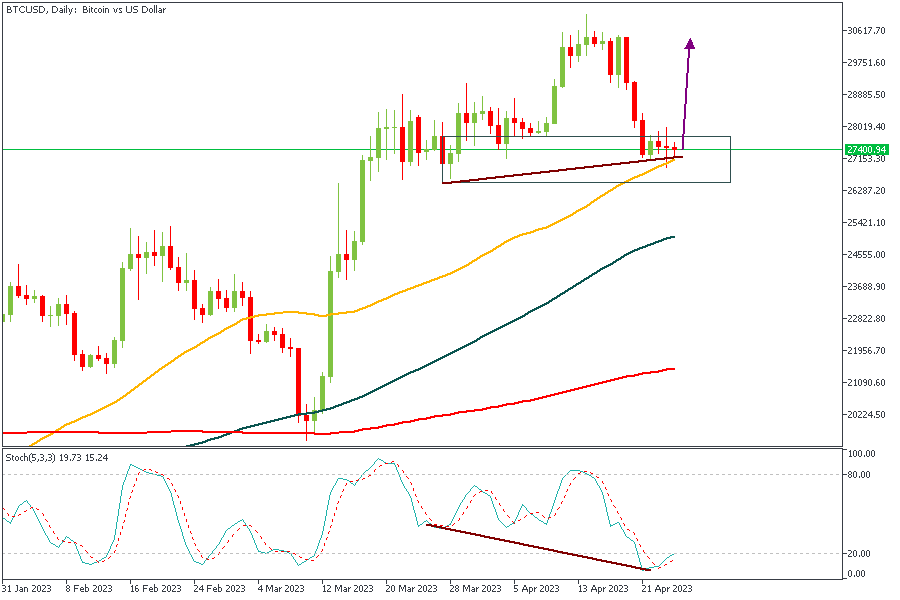
BTCUSD - Daily Timeframe
Bitcoin has had a few days of consolidation within a key demand zone. As you can see from the chart, we also have added confluence from the 50-Day Moving Average. Looking at the stochastics, we can establish that there is a divergence that often results in price reversals. With these indicators and considering the fundamental data, I believe it is safe to expect a bullish reversal soon enough.
Analysts’ Expectations:
- Direction: Bullish
- Target: $29,300
- Invalidation: $26,450
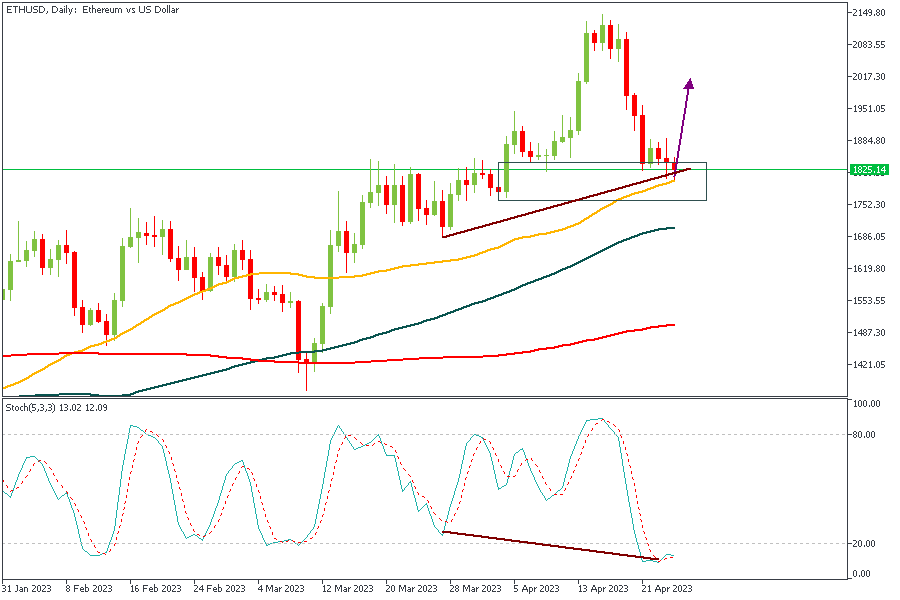
ETHUSD - Daily Timeframe
ETHUSD has a very similar outlook to the setup on BTCUSD. The consolidation here on ETHUSD has also lasted a few days and is within a demand zone. The 50-Day Moving Average support is another common confirmation. To top it off, we have a similar divergence setup. This means we can also begin to expect a bullish reversal soon.
Analysts’ Expectations:
- Direction: Bullish
- Target: $2,060
- Invalidation: $1,760
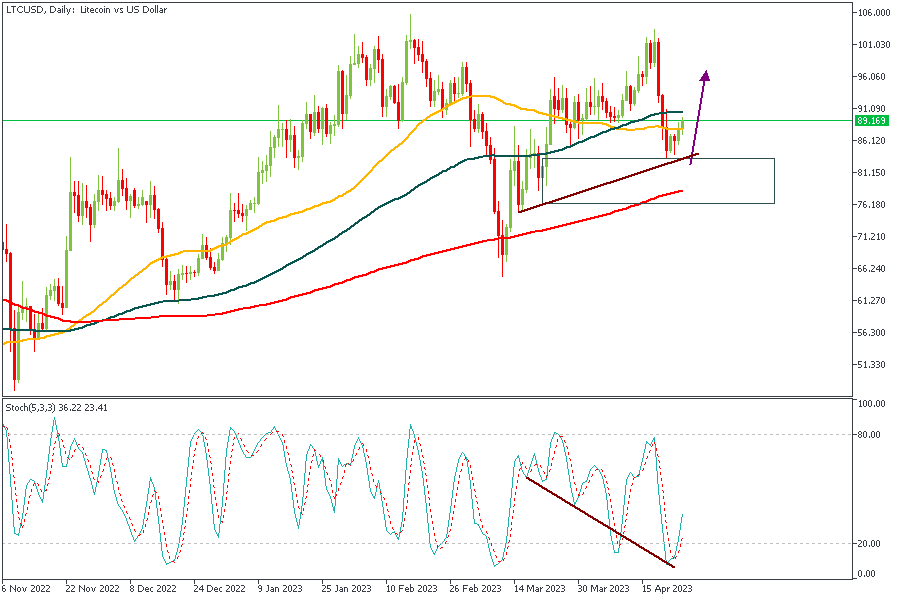
LTCUSD - Daily Timeframe
Litecoin (LTCUSD), on its own, has already reacted from the initial demand zone. There's not much to say about the demand zone, the stochastics divergence, and the 76% Fibonacci retracement level. The sentiment here is also largely bullish.
Analysts’ Expectations:
- Direction: Bullish
- Target: $98.40
- Invalidation: $82.50
P.S: A divergence is a phenomenon that describes a scenario where price makes higher highs on the charts whereas an oscillator indicator (such as the MACD, RSI, or Stochastics) records lower highs, or vice versa.
CONCLUSION
The trading of CFDs comes at a risk. Thus, to succeed, you have to manage risks properly. To avoid costly mistakes while you look to trade these opportunities, be sure to do your due diligence and manage your risk appropriately.
Crypto Seeks Support
Market picture
The cryptocurrency market is down 0.6% over the past 24 hours, falling to $1.15 trillion, as we see reduced volatility and attempts to “buy the bottom”.
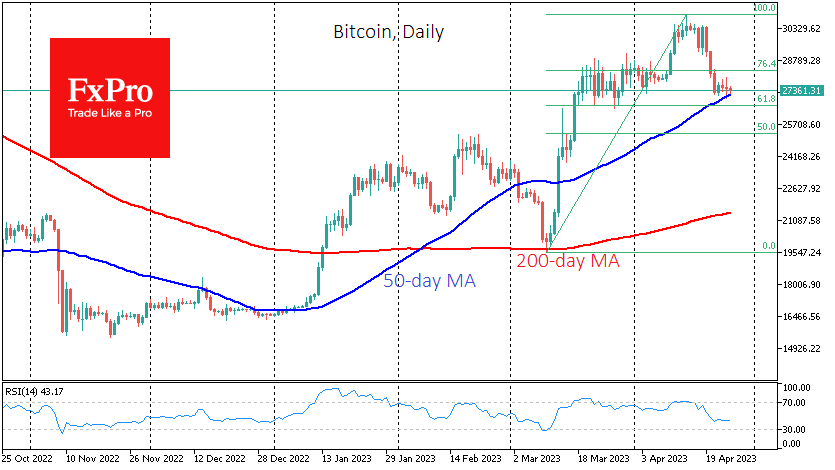
Bitcoin is testing and attempting to hold above its 50-day moving average on Monday and Tuesday. As it does so, we, for now, see some reduced volatility and attempts to form a local bottom. It could be an attempt to return to buying after a corrective pullback or a consolidation before a new downward impulse.
Regarding technical analysis, bitcoin’s correction will only become a new downtrend when the price consolidates below $26.5K, 61.8% of the upside momentum from the March lows and the bottom of last month’s consolidation.
According to CoinShares, investments in crypto funds fell by $30 million last week after four weeks of gains. Bitcoin investments decreased by $53 million, while Ethereum rose by $17 million.
News background
Significant inflows into Ethereum assets indicate growing investor confidence following the successful implementation of the Shapella update.
Crypto winter is over, says Standard Chartered. Bitcoin will benefit from the turmoil in the banking sector and several other factors. By the end of 2024, the price of the first cryptocurrency could reach $100K.
Twitter analyst PlanB, the creator of the Stock-to-Flow model, expects Bitcoin to grow significantly in 2024 after halving. He calculates that BTC will break through $100,000 and could eventually reach $542,000.
In the medium term, BTC could become the world’s reserve currency, according to BitMEX co-founder Arthur Hayes. More and more investors are looking to Bitcoin to preserve capital.
The World Economic Forum (WEF) said Bitcoin mining could significantly reduce greenhouse gas emissions. But only if miners switch to renewable energy sources.
Billy Marcus, the creator of the meme cryptocurrency Dogecoin, called crypto investors “mentally disturbed” and NFT buyers “even more unhealthy”. He said he stopped investing in cryptocurrencies nine years ago, shortly after Dogecoin was launched.
EURGBP Pokes Its Nose Above 0.8865
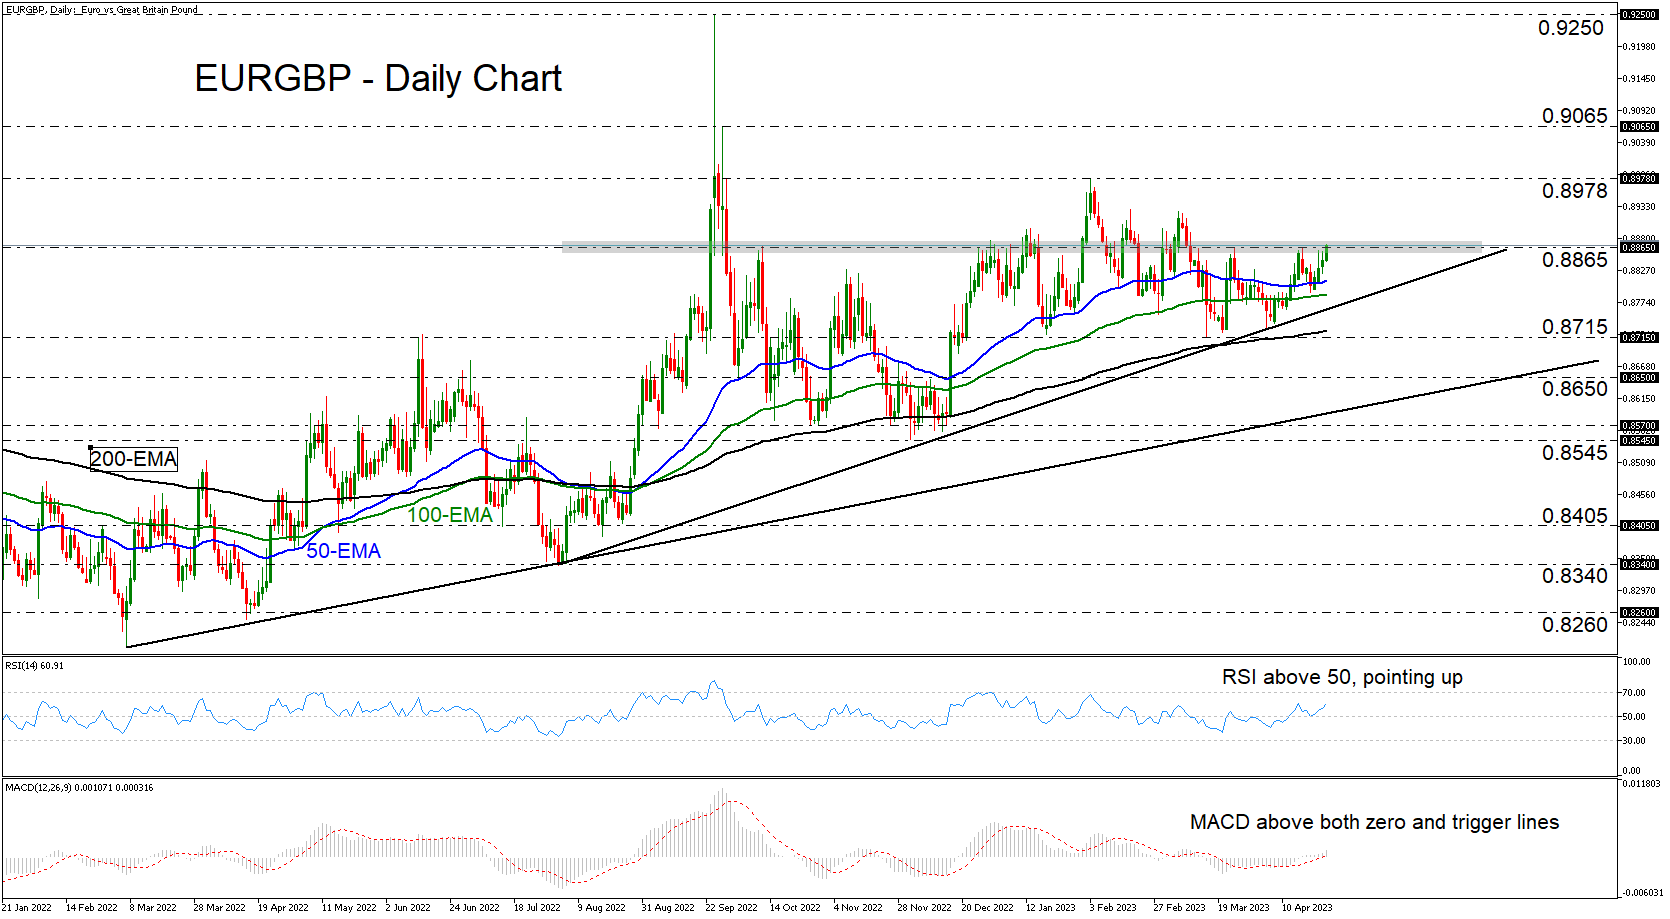
EURGBP has been edging north since April 19 when it hit support slightly above the 100-day exponential moving average (EMA). The pair is trading above all three of the plotted EMAs, as well as above the uptrend line drawn from the low of August 3, which paints a positive medium-term picture.
Our short-term oscillators make the outlook even brighter. The RSI moved higher after rebounding from its 50 line, while the MACD lies above both its zero and trigger lines, pointing up. Both indicators detect upside momentum and support the notion of some further advances.
Today, EURGBP poked its nose above the key barrier of 0.8865, a move that may have opened the door for advances towards the peak of February 3 at around 0.8978. If the bulls are unwilling to let the driver’s seat go, they may extend their march towards the high of September 28 at around 0.9065.
For the outlook to turn bearish, the pair may need to tumble all the way below the 0.8545 area, marked by the low of December 1. Such a slide would take the action below a longer-term uptrend line taken from the low of March 7, and may see scope for extensions towards the 0.8405 territory, marked by the low of August 24.
To wrap up, EURGBP continues to trade above the uptrend line taken from the low of August 3 and above all the plotted EMAs, which suggests that the pair may be destined to continue traveling north for a while longer.
US consumer confidence fell to 101.3, consumer inflation expectations essentially unchanged
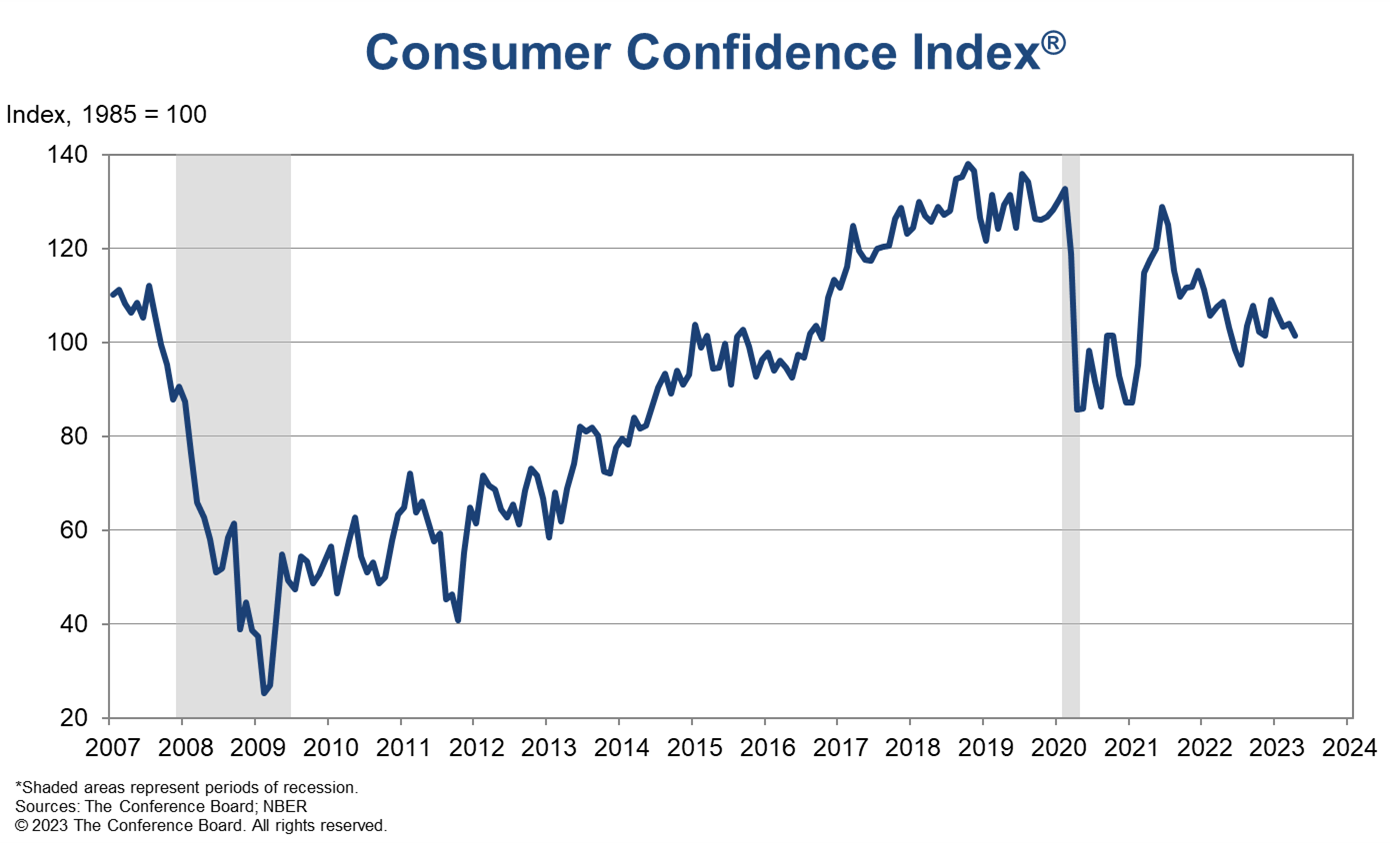
US Conference Board Consumer Confidence fell from 104.0 to 101.3 in April, below expectation of 104.1. Present Situation Index rose from1 48.9 to 151.1. Expectations Index dropped from 74.0 to 68.1. The Expectations Index has now remained below 80—the level associated with a recession within the next year—every month since February 2022, with the exception of a brief uptick in December 2022.
"While consumers' relatively favorable assessment of the current business environment improved somewhat in April, their expectations fell and remain below the level which often signals a recession looming in the short-term," said Ataman Ozyildirim, Senior Director, Economics at The Conference Board.
"Consumers became more pessimistic about the outlook for both business conditions and labor markets. Compared to last month, fewer households expect business conditions to improve and more expect worsening of conditions in the next six months. They also expect fewer jobs to be available over the short term. April's decline in consumer confidence reflects particular deterioration in expectations for consumers under 55 years of age and for households earning $50,000 and over."
"Meanwhile, April's results show consumer inflation expectations over the next 12 months remain essentially unchanged from March at 6.2 percent—although that level is down substantially from the peak of 7.9 percent reached last year, it is still elevated. Overall purchasing plans for homes, autos, appliances, and vacations all pulled back in April, a signal that consumers may be economizing amid growing pessimism."
Sunset Market Commentary
Markets
First Republic Bank’s $100bn deposit outflow wacked sentiment at the end of US dealings yesterday as investors relived the turbulent March month. Asian and European trading today suffered from spillover effects with other, mixed earnings unable to provide directional guidance. Core bonds gain. German Bunds outperform relative to US Treasuries at the front end of the curve, perhaps following ECB’s Villeroy post-market comments yesterday. The French governor said more hikes may be needed but they should be limited in time and size. The tone contrasted with the outright hawkish rhetoric by Belgian ECB member Wunsch over the weekend. German yields eased between 2.8 bps (30-y) to 6.6 bps (5-y). US rates declined 3.7 to 5.7 bps across the curve with the 10-y yield slipping further south of the 3.5% support level (June 2022 interim high). The US 2-y yield is hitting support from the 200DMa at around 4.04%. News flow was thin and in any case American inspired. US president Biden officially announced his reelection bid with current VP Kamala Harris as running mate again. At GOP side, former president Trump has a major lead in the polls over his first rival, Florida governor DeSantis. Turning to economic data, the Philly Fed non-manufacturing activity index (from -12.8 to -22.8) fell to the lowest since December 2020. Even labelling it as a second-tier indicator is an overstatement. And yet yields eked out further losses following the release by another 4 to 5 bps. Peripheral spreads vs Germany’s 10y widen slightly, between 1 and 2 bps. Analysts from rating agency Moody’s wrote today that Italy is the only country on its watch list that is at risk of losing its investment-grade creditworthiness. Italy carries a Baa3-rating, one notch above junk, with a negative outlook. An update is due May 19. They said that sluggish Italian growth and higher funding costs may further weaken it’s fiscal position.
FX markets display familiar risk-off correlations. The USD and the JPY outperform peers, cyclicals including the NOK, CAD and AUD lose. DXY (trade-weighted dollar) advances from 101.25 to 101.52 currently. EUR/USD reversed Asian gains to around 1.107 to trade in the low 1.10 area again. USD/JPY keep each other more or less in balance while EUR/JPY, after temporarily hitting a new 9-y high, turned south to 147.48. Sterling slips beyond EUR/GBP 0.8867 and is testing the April low (EUR/GBP-high) after comments from BoE chief economist Pill. He warned for risks of doing too much and said that recent events moderated calls for higher rates. BoE Broadbent earlier today said there are signs wage pressures are easing, though not enough. The Hungarian forint in Central-Europe quickly erased a minor kneejerk move lower after the Hungarian central bank lowered the top-end of the rate corridor by 450 bps to 20.5% - a decision seen as a monetary pivot. Deputy governor Virag hinted at such a move already last week. The forint nevertheless appreciates to EUR/HUF 374.87.
News & Views
The UK Office for National Statistics (ONS) today published the March 2023 government budget data as well as the results for the fiscal year 2022/23. The ONS reported net public sector borrowing (ex. banking) of £21.5 bln in March translating in an estimated full fiscal year borrowing of £139.2 bln, being 5.5% of GDP. This compared to a budget deficit of £121.1 bln (5.2% of GDP) in fiscal year 2021/22. The outcome was less than the latest estimate of the Office for Budget Responsibility (OBR) which expected a deficit of £152.4 bln (6.1% of GDP). However, ONS indicated that the data will revised over the coming months. Public sector net debt at the end of March was £2530.4 Bln or 99.6% of GDP, with the debt-to GDP ratio at levels last seen in the early 1960s. An estimate of the UK public sector net worth showed a deficit of £605.8 bln a further deterioration from last year’s £530 bln. While still substantially worse than the initial estimate, the UK budget data confirm recent data evidence that the UK economy recently probably fared better than assumed a few months ago.
Today, the ECB, Bank of England, Bank of Japan and Swiss National Bank jointly announced to, in consultation with the US Federal Reserve, revert from daily to weekly 7-day operations which will provide liquidity via the standing US dollar liquidity swap line agreement. The new frequency of operations will be effective as of 1 May 2023. The ECB communiqué indicates that the change is the result of the improvements in US dollar funding conditions and the low demand at recent USD liquidity providing operations. However, the ECB and other major central banks stand ready to re-adjust provisions of US dollar liquidity as warranted by market conditions.
US GDP in Focus as Fed Prepares to Play its Final Card
There is a heavy load of US economic releases coming up this week. The highlight will be the latest GDP report on Thursday, which will help shape market expectations about the trajectory of interest rates as the Fed prepares to roll out the final rate increase of this cycle next week. As for the dollar, it has been on the ropes lately, but better days may lie ahead.
US economy regains steam
The economic data pulse in the United States has improved significantly lately. Business surveys point to an economy that is regaining growth momentum, the banking crisis has receded, and the unemployment rate remains near historic lows. It seems that fears of a recession were overblown, or at least premature.
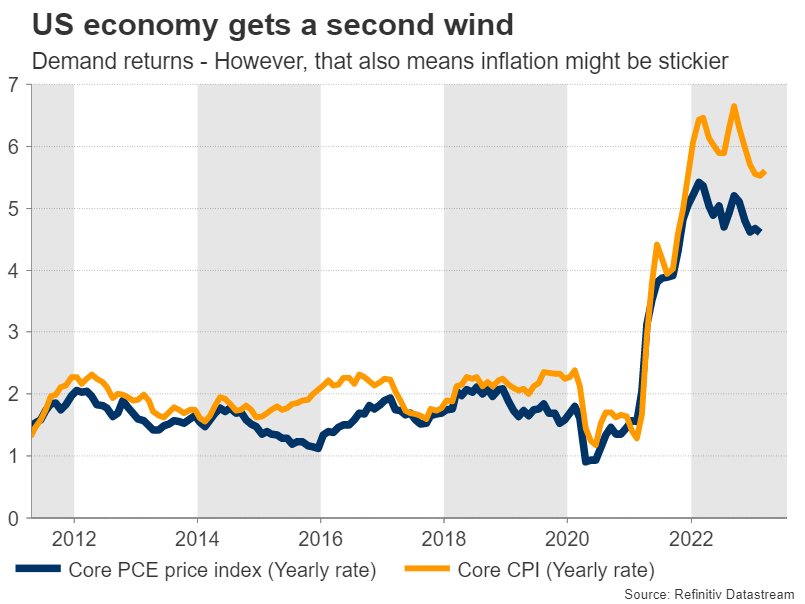
But not everything is rosy. The dark side of this surge in demand is that inflationary pressures have received a second wind too. Companies continue to raise their selling prices at a rapid clip, and this has been reflected in the core inflation rate, which remains sticky at elevated levels. In other words, the inflation battle is not over.
And yet, investors think the Fed is about to conclude its tightening cycle. Market pricing suggests the US central bank will deliver one final 25bps rate increase next week and then move to the sidelines while the economy absorbs the lagged impact of previous rate hikes. Traders are also betting the Fed will start to cut rates before the year ends.
With the Fed currently in its blackout period ahead of next week’s policy decision, there won’t be any public comments from FOMC officials this week, so the spotlight will be entirely on data releases.
Upside GDP surprise?
The show will get going on Tuesday with the Conference Board consumer confidence index, ahead of the latest batch of durable goods orders on Wednesday. Both are considered forward-looking measures of economic activity, so they will be closely watched.
Turning to the main event, the preliminary estimate of GDP growth for the first quarter will be released on Thursday. The US economy is expected to have grown at an annualized pace of 2%, driven mostly by an upturn in consumption. There is some scope for a stronger-than-expected print, considering that the Fed’s GDPNow model estimates growth at 2.5% instead.
Wrapping things up on Friday will be the core PCE price index for March, alongside personal consumption and income figures. Forecasts point to a minor decline in the yearly PCE rate, although the risks seem tilted to the upside in this case too, judging by the spike higher in the core CPI rate during the month.
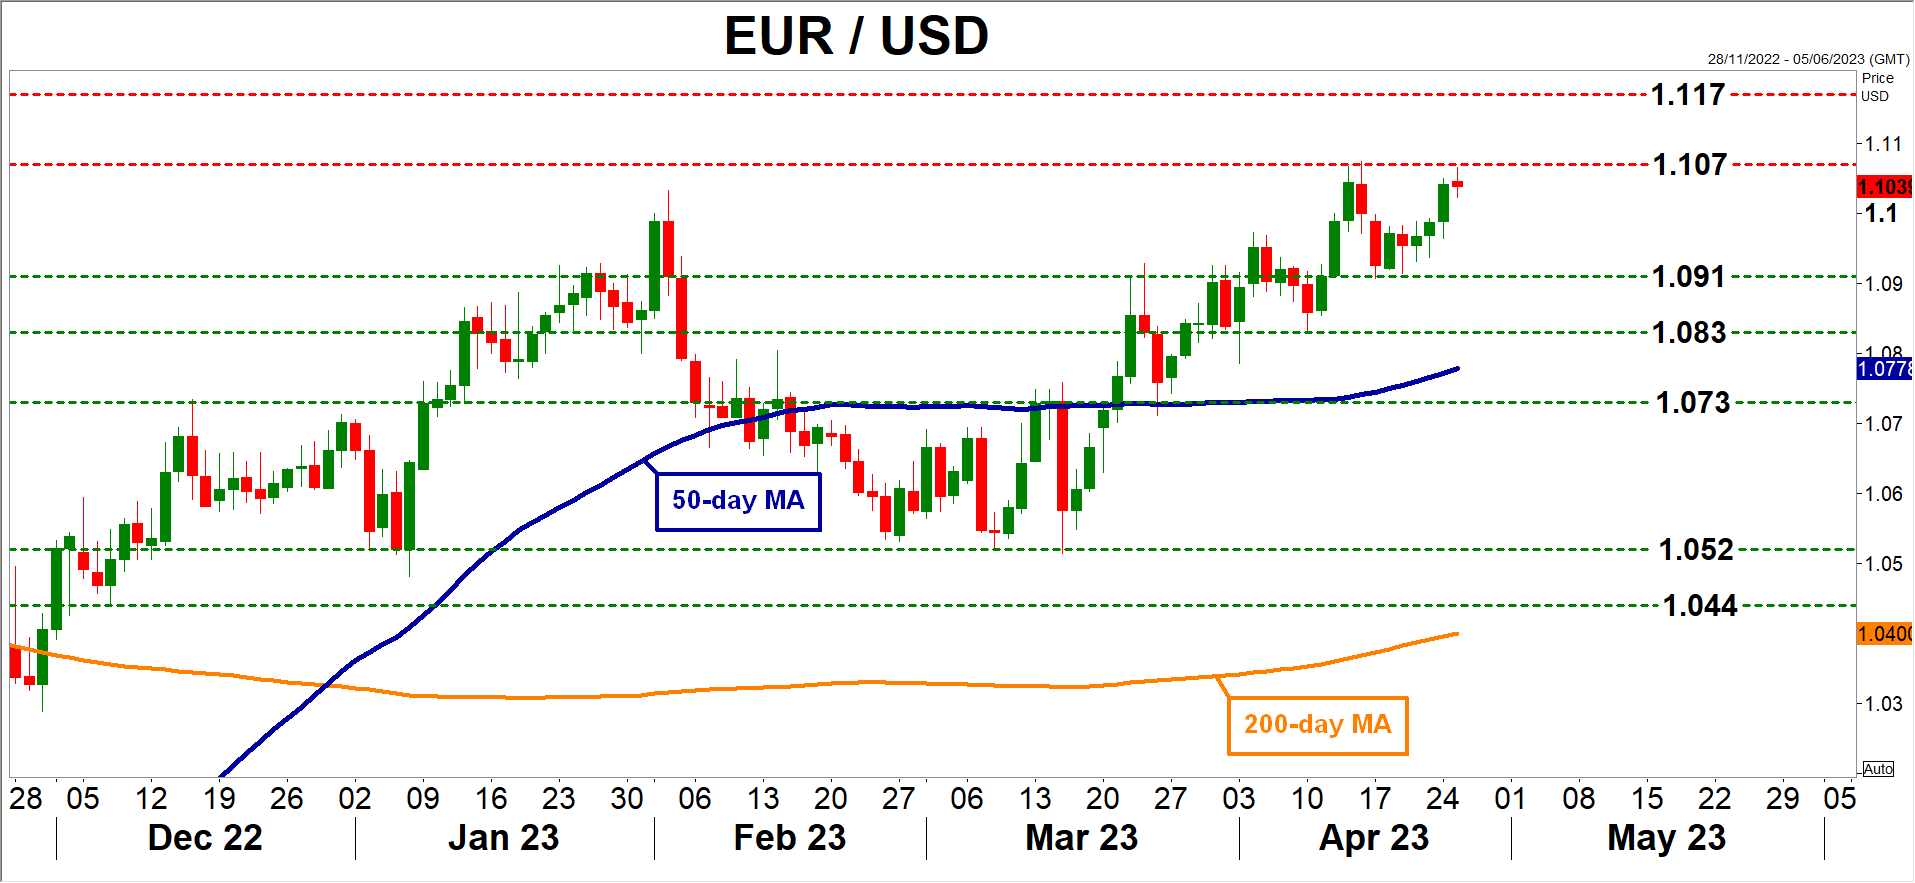
A round of strong data could dispel some speculation for Fed rate cuts this year, and help the dollar recover some poise. Looking at the euro/dollar chart, the 1.0910 zone could serve as the first durable obstacle to any declines.
One interconnected trade
In the big picture, the dollar has been underperforming for several months now. Some of this weakness is linked to the brighter outlook in Europe that has fueled expectations for continued ECB rate increases and boosted the euro, but perhaps an even bigger driver was the cheerful tone in stock markets.
The 30-day rolling correlation between euro/dollar and the S&P 500 currently stands at 86%, and it is even higher for sterling/dollar. This suggests that recent FX moves have been mainly a reflection of the mood in stock markets.
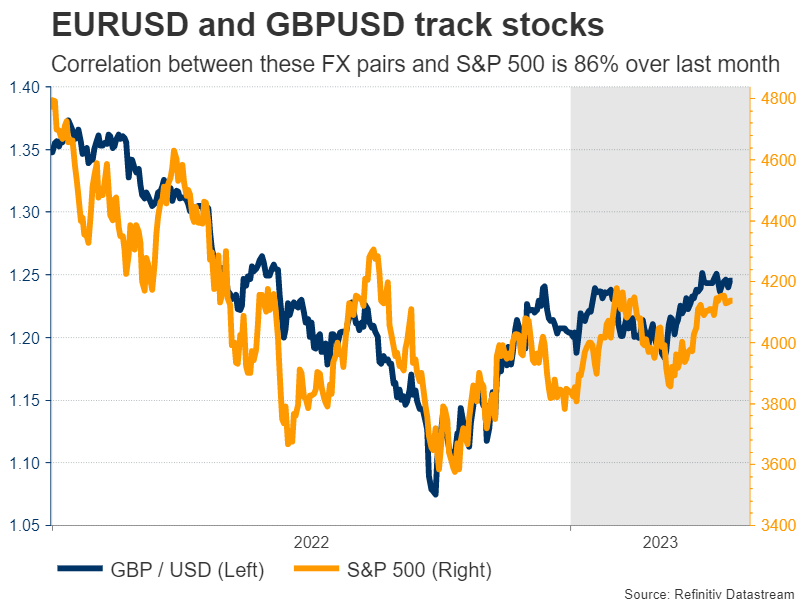
Hence, any turnaround in stocks could be particularly painful for pairs like euro/dollar and sterling/dollar. With equity valuations having reached extreme levels again just as corporate earnings growth has turned negative, the risks surrounding stock markets seem tilted to the downside.
In turn, this allows some scope for a comeback in the dollar, especially if euro/dollar is unable to pierce above the 1.1070 region.
Bank of Japan Decision: First Gathering Under Ueda’s Leadership
On Friday, the Bank of Japan will hold its first monetary policy decision under the leadership of the new Governor Kazuo Ueda. After taking the helm, Ueda has repeatedly highlighted that the central bank is in no rush to change the current policy settings, and thus no action is expected at this gathering. However, investors may be eager to find out whether there will be any hints regarding the timing of a potential normalization step, as well as whether there will be any changes in the Bank’s communication style in the Ueda era.
Policy changes not likely to happen quickly
The last time the BoJ gathered to decide on monetary policy was back on March 10, with Kuroda taking the driver’s seat for the last time. Disappointing those expecting further widening of the yield control band, policymakers decided to keep all policy settings untouched under the reasoning that inflation seems to be fueled by import costs of raw materials rather than strong domestic demand.
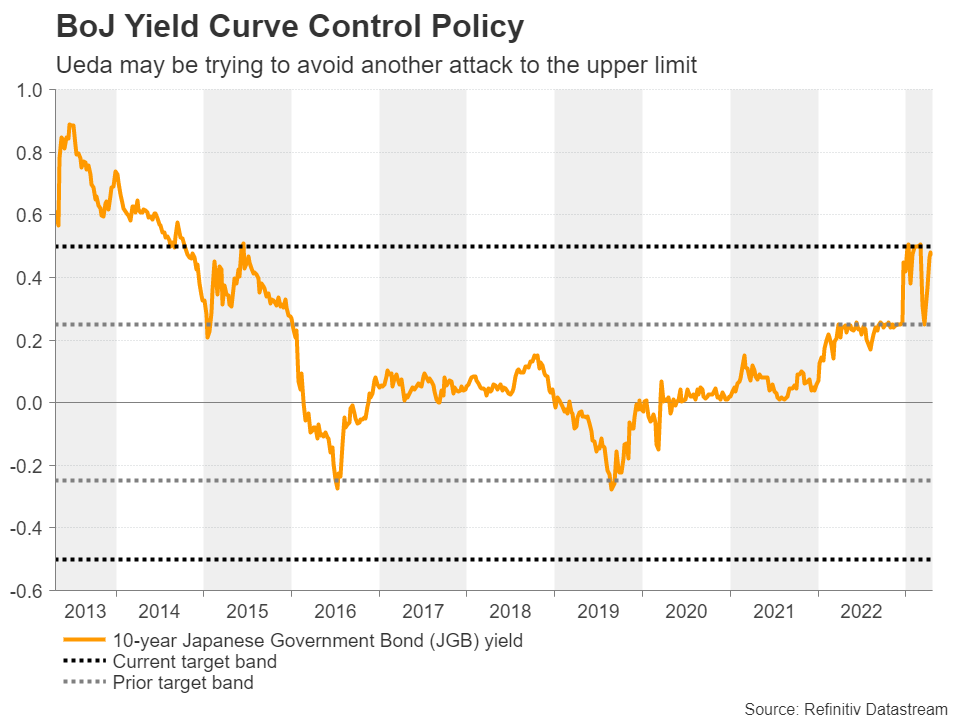
Since taking the helm, Kuroda’s successor Kazuo Ueda has dropped some hints that massive stimulus will eventually be phased out, but he reassured the financial community that changes will not happen quickly. Like most of his new colleagues, he is an advocate of the view that inflation in Japan is not fueled by domestic demand, and by repeatedly highlighting that the current stance remains appropriate, he may be trying to avoid any anticipation of a pivot soon and thereby a surge in long-dated yields.
Data supports staying patient
On the data front, headline inflation slowed in March by a tenth of a percentage point in yearly terms, but the month-over-month rate rebounded more strongly than expected and the underlying year-over-year CPI rate stayed unchanged. Although this may have stimulated expectations of a normalization step sooner rather than later, it is far from suggesting that a change is imminent.
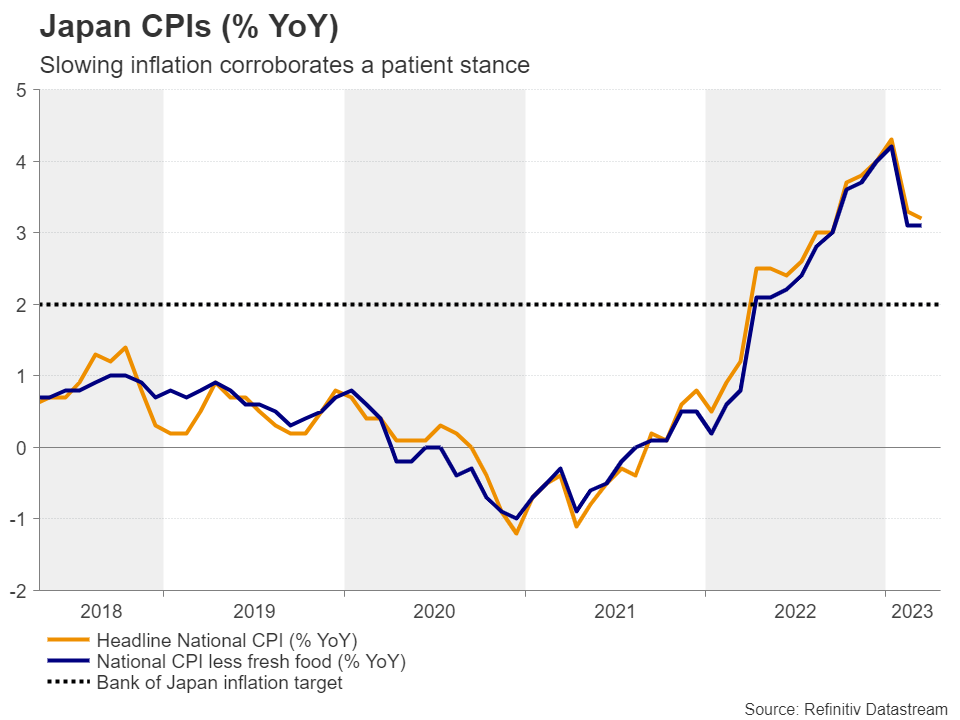
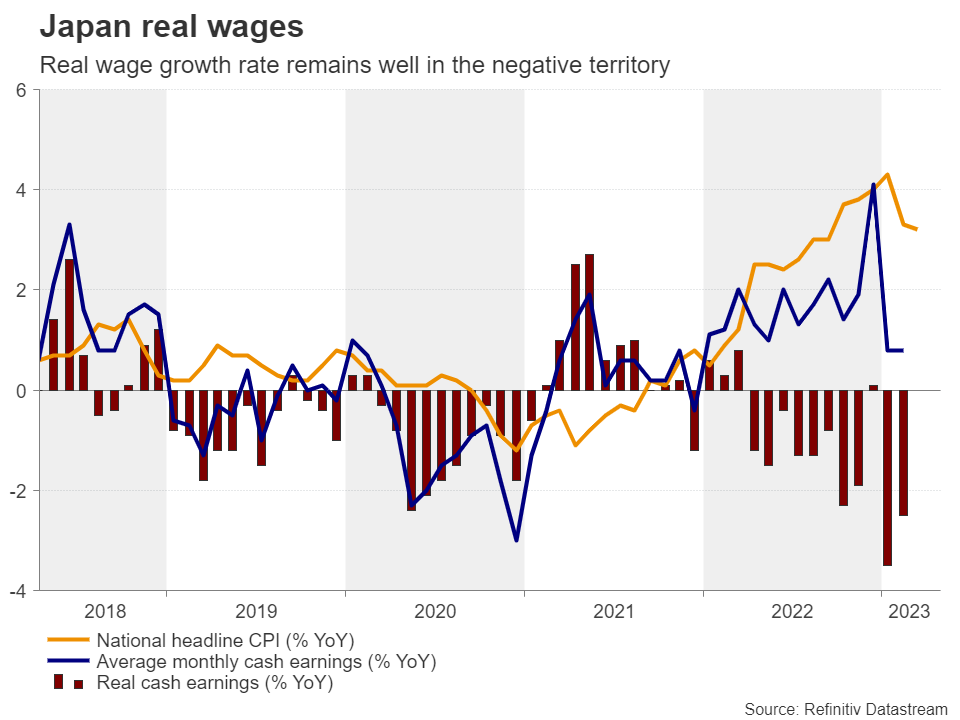
After all, these rates follow the steep slowdown during the month of February, which corroborated the narrative that inflation in Japan may be largely imported. On top of that, despite unions agreeing with employers on raising salaries by the most since 1993, the latest wage data we have in hand is for February, where earnings growth held steady at 0.8% y/y, leaving the real rate well in the negative territory. Therefore, given the Bank’s emphasis on wage growth, officials may not only prefer to wait for the accord to be reflected in the data, but also for evidence of sustained momentum before they proceed with removing further accommodation.
Focus to fall on hints about the coming months
Therefore, the most likely outcome for this gathering is again no action. However, investors are likely to be looking for clues and hints on when and what kind of tightening the Bank will deliver in coming months. At his inaugural news conference on April 10, Ueda said that the lowered US and Japanese yields after the financial turmoil decreased the urgency to tweak yield curve control. So, anything suggesting that the Bank will stay the course through the summer may disappoint those expecting action soon and thereby hurt the yen.
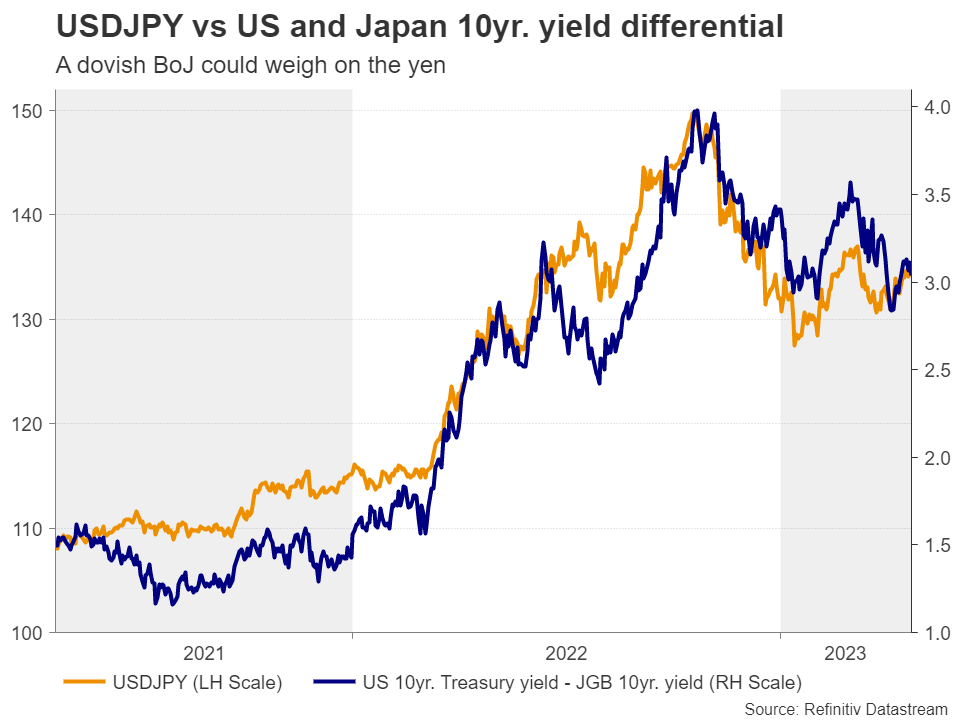
On the other hand, any hints that another tweak may be appropriate at the upcoming gatherings could fuel the yen’s engines due to renewed market attacks on the upper limit of the target band around the 10-year yield. Nonetheless, bearing in mind that the BoJ likely prefers to avoid that, a scenario where they provide strong tightening signals seems unlikely.
Yen could stay pressured in the short run
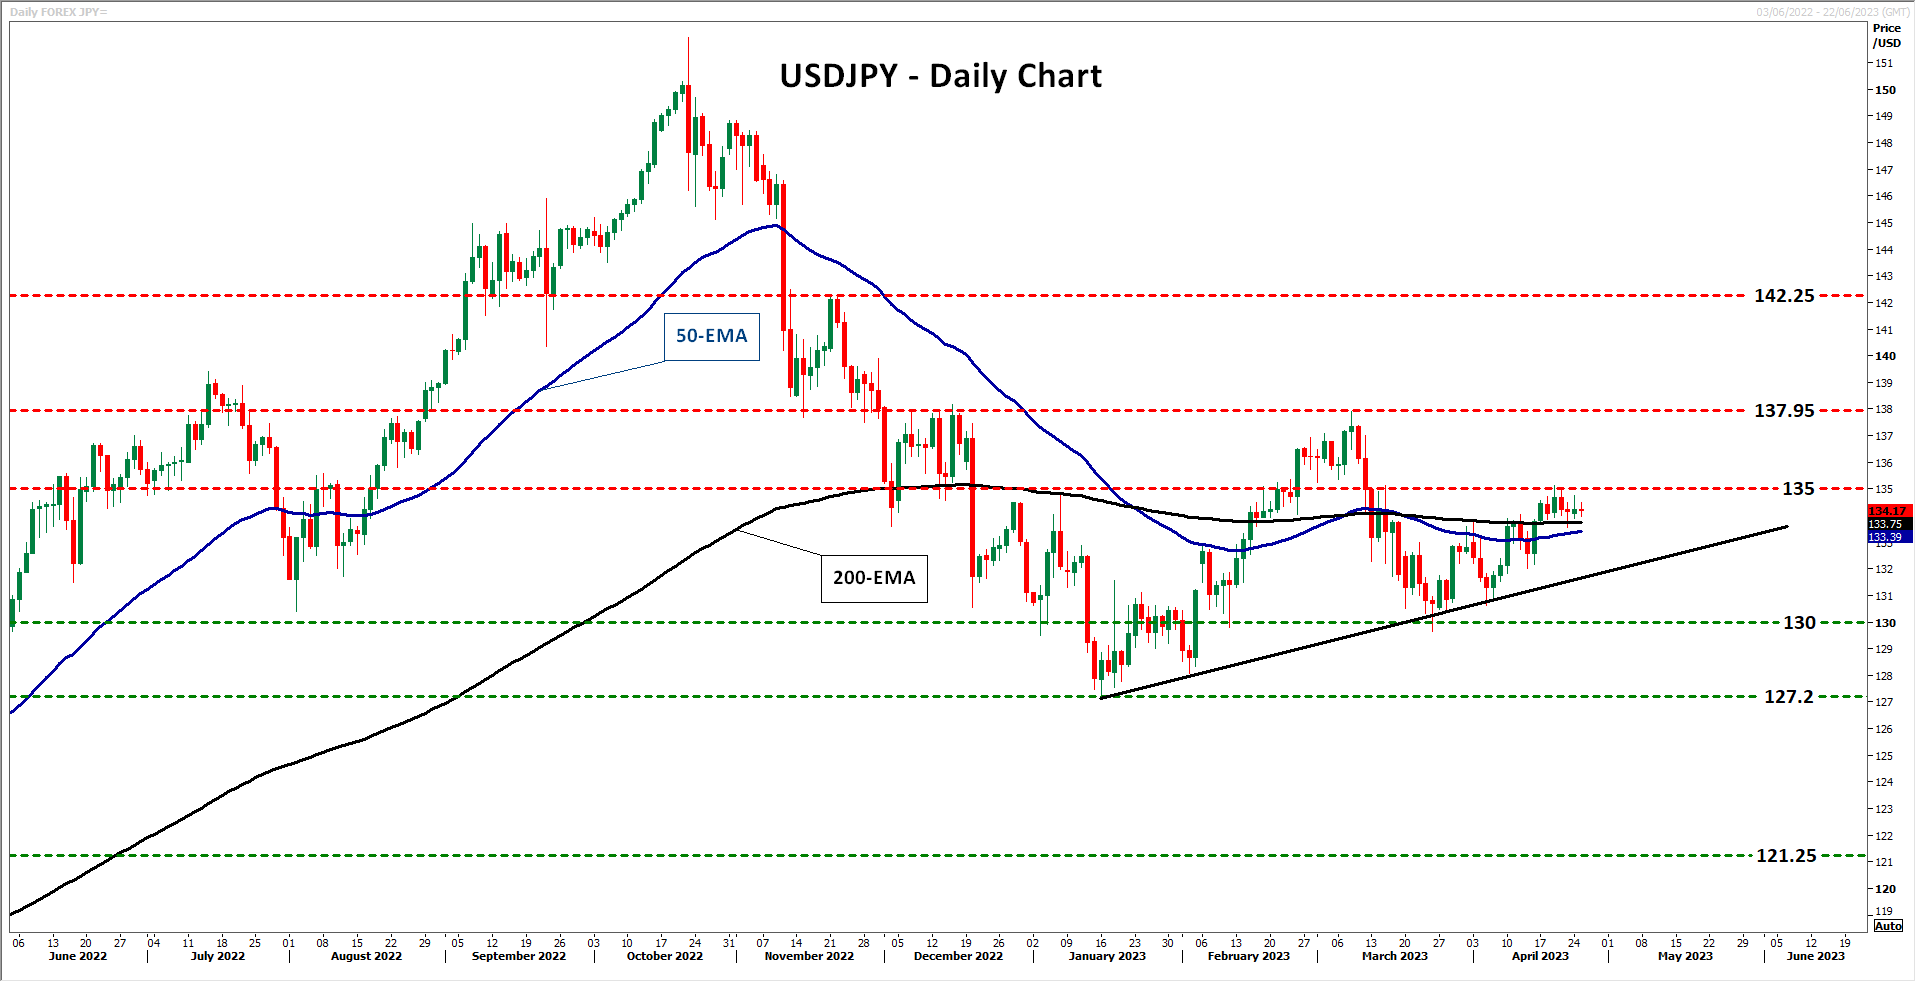
From a technical standpoint, dollar/yen has been in a recovery mode since April 5, when it hit the upside support line drawn from the low of January 16. Now the bulls are struggling to break above the 135.00 territory, but if they manage to do so, they may target the 137.95 barrier, marked by the high of March 8. If that zone doesn’t hold either, then the advance may extend towards the peak of November 22 at 142.25.
Having said all that though, it is still too early to chuck up the sponge on the yen. Ueda has clearly said that they are still looking for a removal of the YCC regime and a rate hike at some stage this year. So, with other major central banks, like the Fed, expected to start cutting interest rates towards the end of the year, at some point the new divergence in monetary policy expectations between the Fed and the BoJ may start working in favor of the yen.
BTC/USD: Bullish Engulfing Pattern Above $26,981
Bitcoin continues its bullish momentum from last week, and after touching a low of $26,981 on April 24, we can see a move towards a consolidation phase, after which we are expecting upsides in the range of $28500 and $302000.
We can clearly see a bullish engulfing pattern above the $26,981 handle on the H1 timeframe.
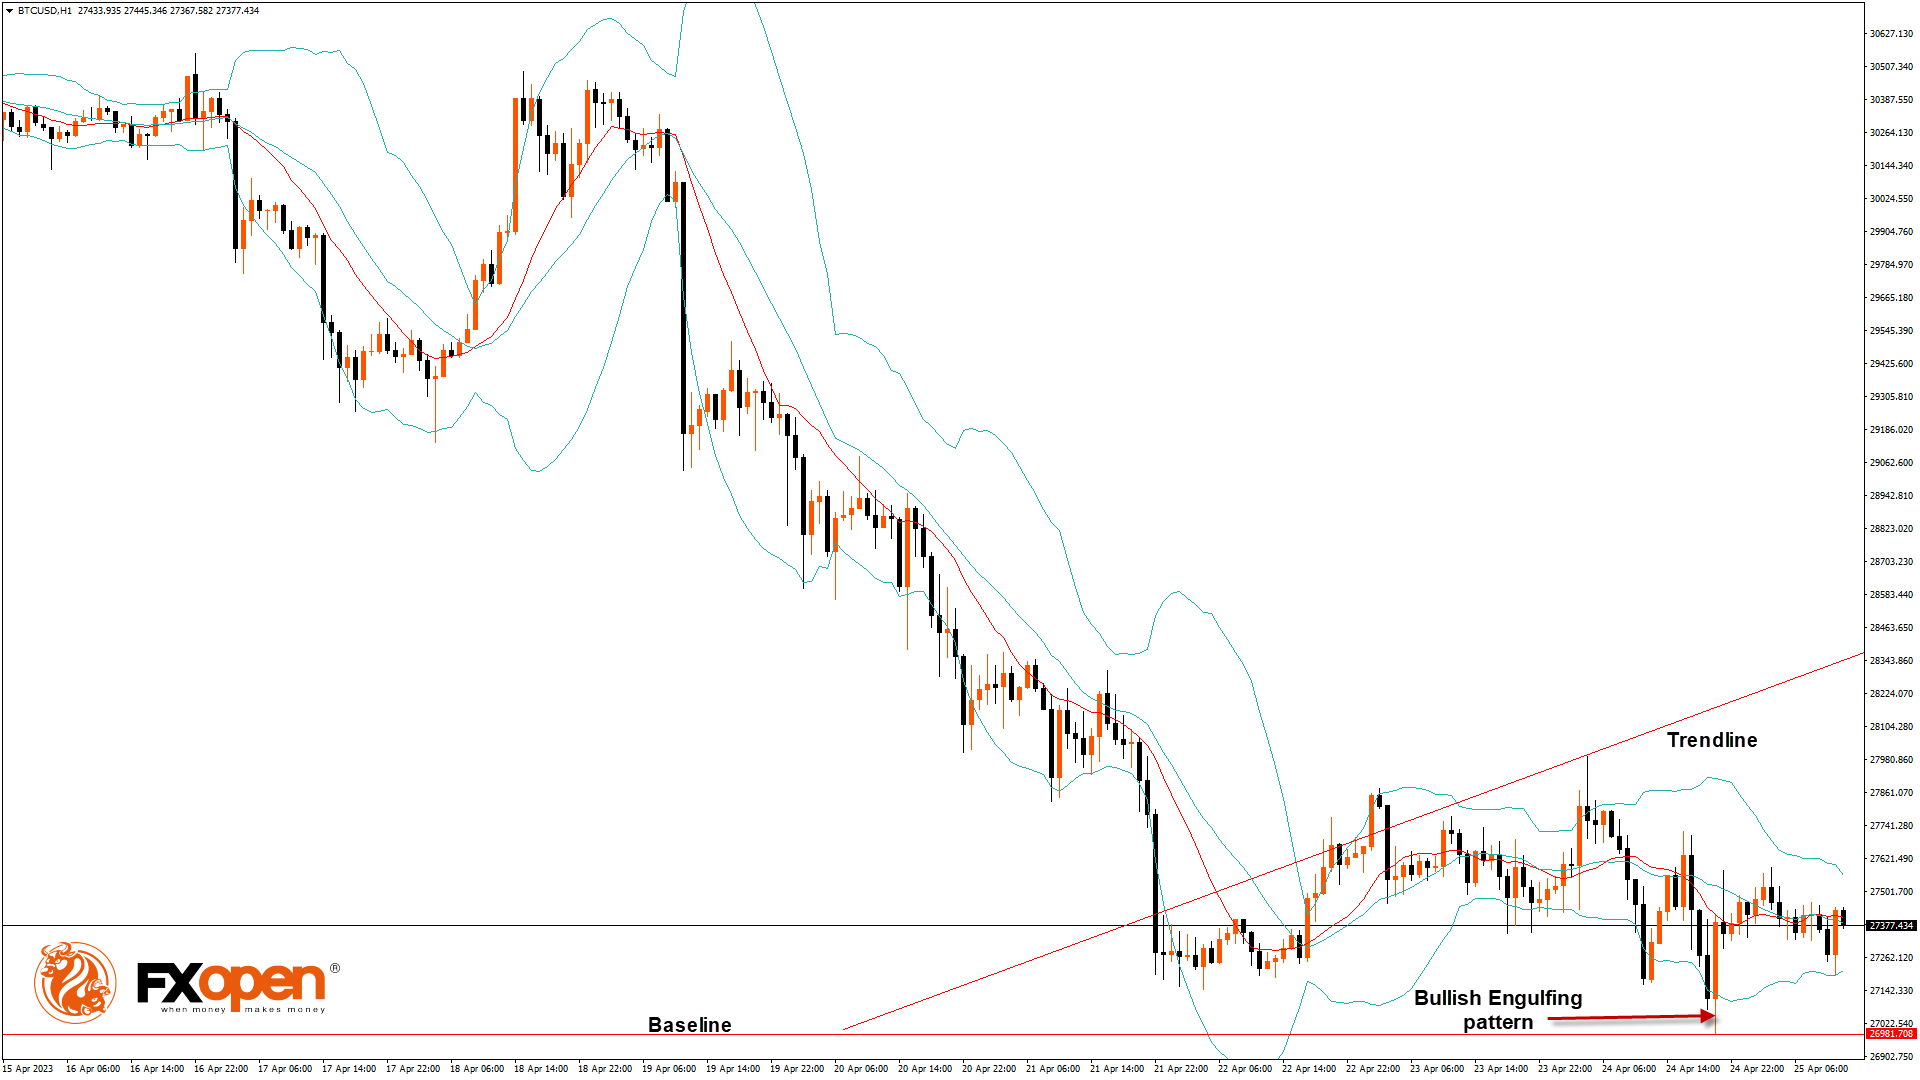
Bitcoin continues to move in a consolidation phase, after which we can see upside moves towards the $28,000 handle.
Both the STOCH and Williams’ percent range indicate overbought levels, which means that in the immediate short term, a decline in the price is expected.
We can also see the formation of bullish Harami pattern in the 1, 2 and 4 hourly timeframes.
The relative strength index is at 58.23, indicating a strong demand for Bitcoin and the continuation of the buying pressure in the markets.
Bitcoin is now moving above its 200-hour exponential moving average and above its 200-hour exponential moving average.
Most of the major technical indicators are giving a bullish signal, which means that in the immediate short term, we are expecting targets of $28,500 and $30,000.
The average true range indicates high market volatility with mild bullish momentum.
- Bitcoin bullish continuation is seen above $26,981.
- The RSI remains above 50, indicating a bullish market.
- The price is now trading below its pivot level of $28,516.
- The short-term range is mildly bullish.
- Some major technical indicators signal that the price may move to $28,000 and $29,500 soon.
Bitcoin Bullish Continuation Seen Above $26,981
The price of Bitcoin entered a consolidation zone below the $28,000 handle after which we can see the start of the bullish moves.
There is a bullish trend reversal pattern with adaptive moving average AMA-20 and AMA-50 in the 30-minutes timeframe.
The prices are ranging near the support of the triangle in the 1-hourly timeframe.
We have also seen a Bullish Doji located in the 15-minutes timeframe.
A support zone is located at $26,246, which is a 3-10 Day MACD Oscillator Stalls, and at $26,624, which is a 38.2% Retracement from 13 Week High.
BTCUSD is now facing its classic resistance level of $28,015 and Fibonacci resistance level of $28,508, breaking which the price will be able to move to $29,000.
There is an increase of 4.64% in the daily trading volume, which is normal. The short-term outlook for Bitcoin is bullish, the medium-term outlook has turned bullish, and the long-term outlook remains neutral under present market conditions.
The Week Ahead
Bitcoin continues its bullish momentum from last week, and after touching a low of $26,981 on April 24, we can see a move towards a consolidation phase, after which we are expecting upsides in the range of $28500 and $302000.
We can see that Bitcoin remains well supported above the $27,000 handle and the continuation pattern is seen, with the current support at $25,143, which is a 38.2% Retracement from 52-week low.
The immediate expected target is $29,000, after which we may see some consolidation in the zone of the $29,500 level.
Monthly RSI is at 49.68, which indicates the Neutral market and the shift towards the consolidation zone in the medium-term range.
We can see the formation of a bullish trend line from $26,981 to $28,355.
BTCUSD is now facing resistance at $27,943, which is a pivot point 1st resistance point, and at 28,152, at which the price crosses 18 day moving average stalls.
GBPCAD Another Blue Box Offered Another Buying Opportunity
In this technical blog, we will look at the past performance of the 4-hour Elliott Wave Charts of GBPCAD. In which, the rally from the 10 February 2023 low unfolded as an impulse sequence and showed a higher high sequence with a bullish sequence stamp. Therefore, we knew that the structure in GBPCAD is incomplete & should see another extension higher to complete the sequence. So, we advised members not to sell the pair & buy the dips in 3, 7, or 11 swings at the blue box areas. We will explain the structure & forecast below:
GBPCAD 4-Hour Elliott Wave Chart From 4.14.2023
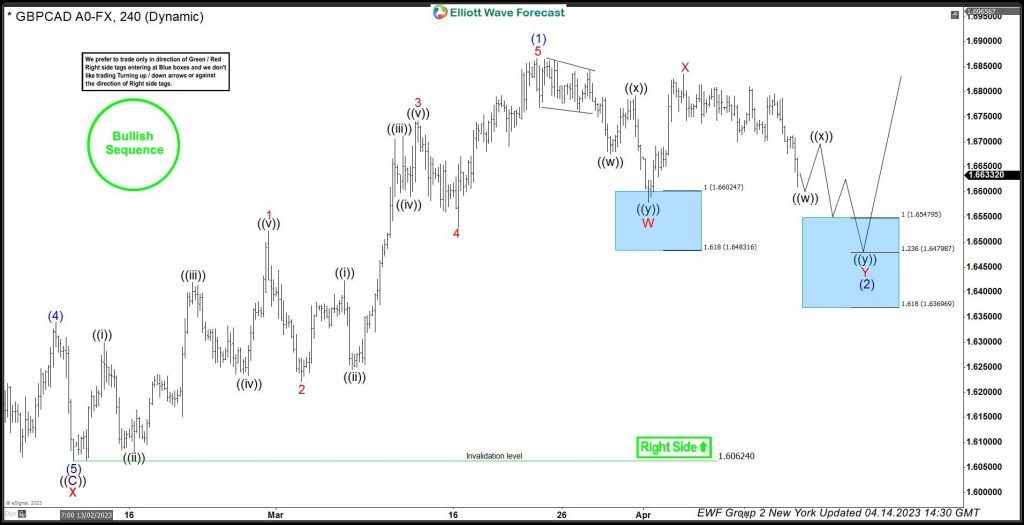
Here’s the 4hr Elliott wave Chart from the 4/14/2022 New York update. In which, the rally to 1.6866 high ended 5 waves from the 2/10/2023 low in wave (1) & made a pullback in wave (2). The internals of that pullback unfolded as Elliott wave double three correction where wave W ended at 1.6579 low. Then a bounce to 1.6835 high-ended wave X & started the next leg lower in wave Y towards 1.6547-1.6369 blue box area. From there, buyers were expected to appear looking for new highs ideally or for a 3-wave bounce minimum.
GBPCAD 4-Hour Latest Elliott Wave Chart From 4.03.2023
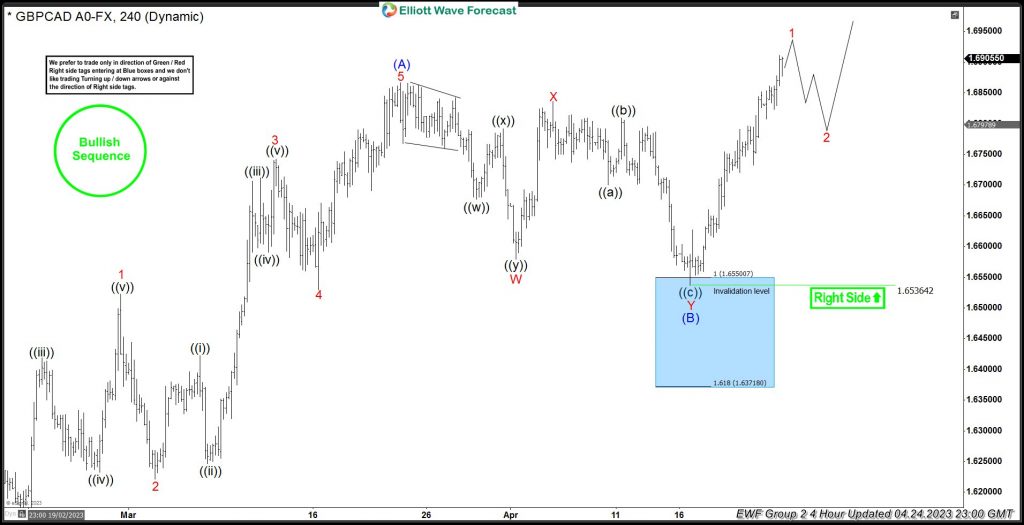
This is the latest 4hr Elliott wave Chart from the 4/24/2023 update. In which the pair is showing a strong reaction higher taking place, right after ending the double correction within the blue box area. Allowed members to create a risk-free position shortly after taking the long position at the blue box area. Since then the pair has managed to make a new high above 1.6866 high confirming the next extension higher.