Sample Category Title
USD/CHF Daily Outlook
Daily Pivots: (S1) 0.8878; (P) 0.8903; (R1) 0.8945; More...
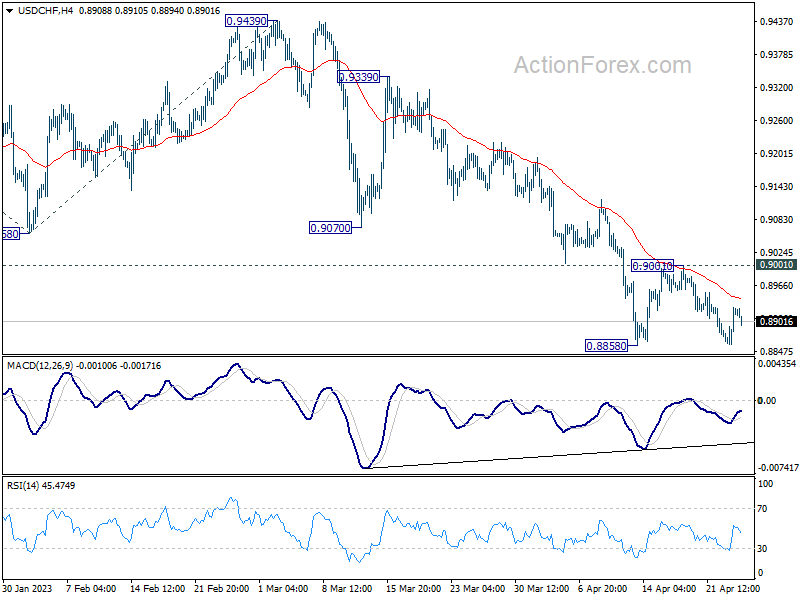
No change in USD/CHF's outlook as sideway trading continues above 0.8858. Intraday bias stays neutral at this point. Overall, further decline is expected as long as 0.9001 resistance holds. On the downside, below 0.8858 will resume the down trend from 1.0146 to 61.8% projection of 1.0146 to 0.9058 from 0.9439 at 0.8767, which is close to 0.8756 long term support. Strong support is expected there to bring rebound, at least on first attempt. On the upside, break of 0.9001 resistance will confirm short term bottoming and turn bias back to the upside.
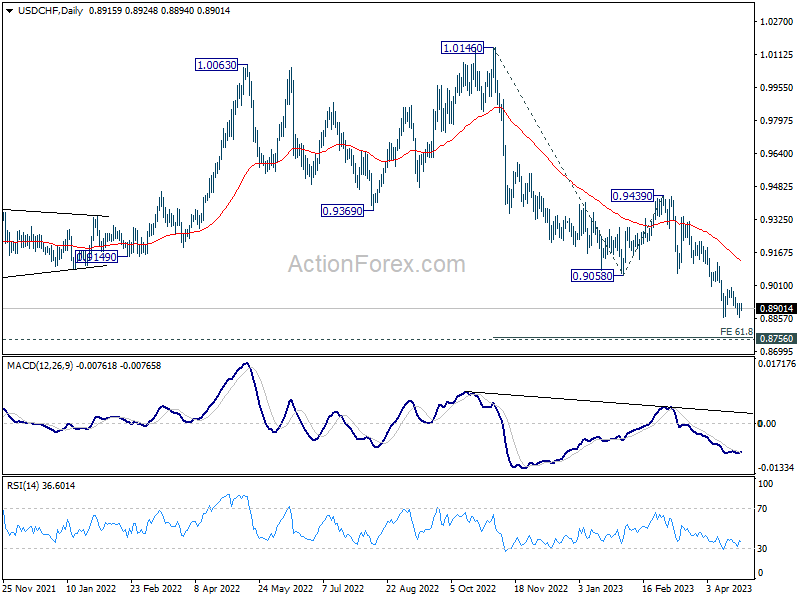
In the bigger picture, fall from 1.1046 (2022 high) is in progress for 0.8756 support (2021 low). But overall, this fall is still seen as a leg in the long term range pattern from 1.0342 (2016 high). So, downside should be contained by 0.8756 to bring reversal. Sustained break of 0.9058 support turned resistance will be the first sign of medium term bottoming. However, decisive break of 0.8756 will carry larger bearish implications.
USD/JPY Daily Outlook
Daily Pivots: (S1) 133.24; (P) 133.85; (R1) 134.33; More...
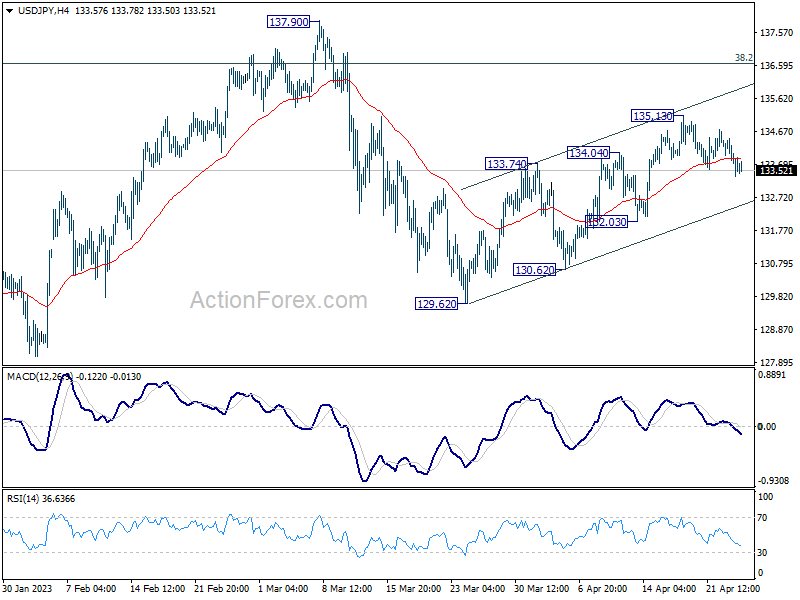
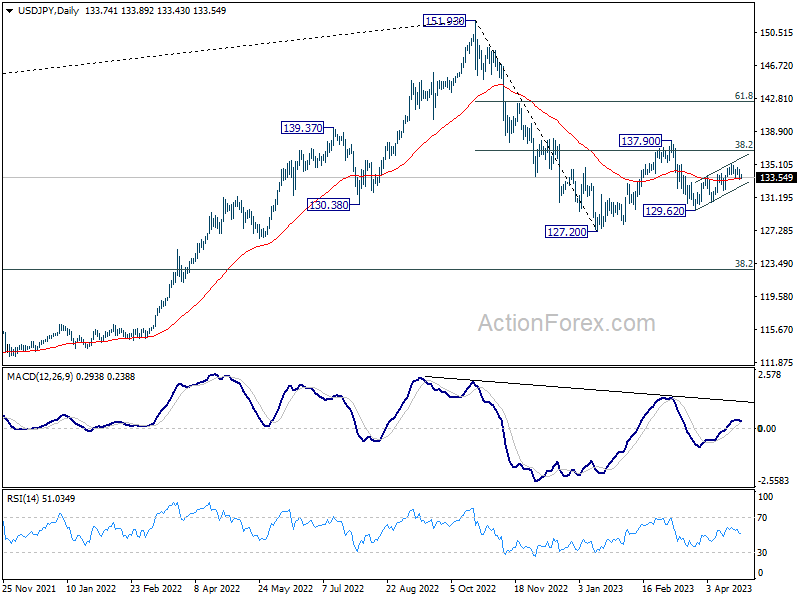
USD/JPY is still extending the consolidation from 135.13 and outlook is unchanged. Intraday bias remains neutral for the moment. Further rally is expected as long as 132.03 support holds. On the upside, break of 135.13 will resume the choppy rebound from 129.62 towards 137.90 resistance next. However, break of 132.03 will argue that the rebound has completed already and turn bias back to the downside for 129.62 and below.
In the bigger picture, corrective pattern from 127.20 might be extending. But after all, down trend from 151.93 is expected to resume at a later stage. Break of 127.20 will resume this down trend and target 61.8% projection of 151.93 to 127.20 from 137.90 at 122.61. This will now be the favored case as long as 137.90 resistance holds.
USD/CAD Daily Outlook
Daily Pivots: (S1) 1.3552; (P) 1.3600; (R1) 1.3675; More....
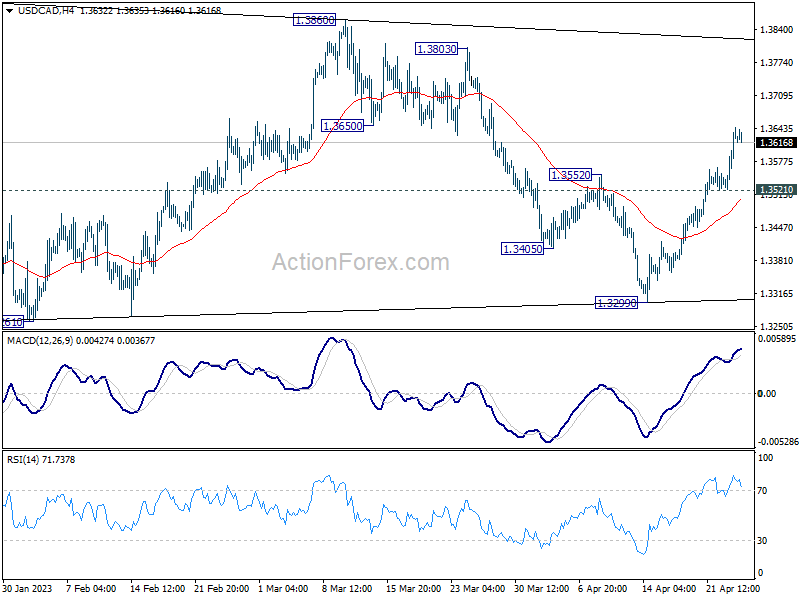
Intraday bias in USD/CAD stays on the upside at this point. As note before, the correction pattern from 1.3976 could have completed with three waves to 1.3299. Further rally should be seen to 1.3860/3976 resistance zone. Decisive break there will resume larger up trend. On the downside, below 1.3521 minor support will delay the bullish case and turn intraday bias neutral first.
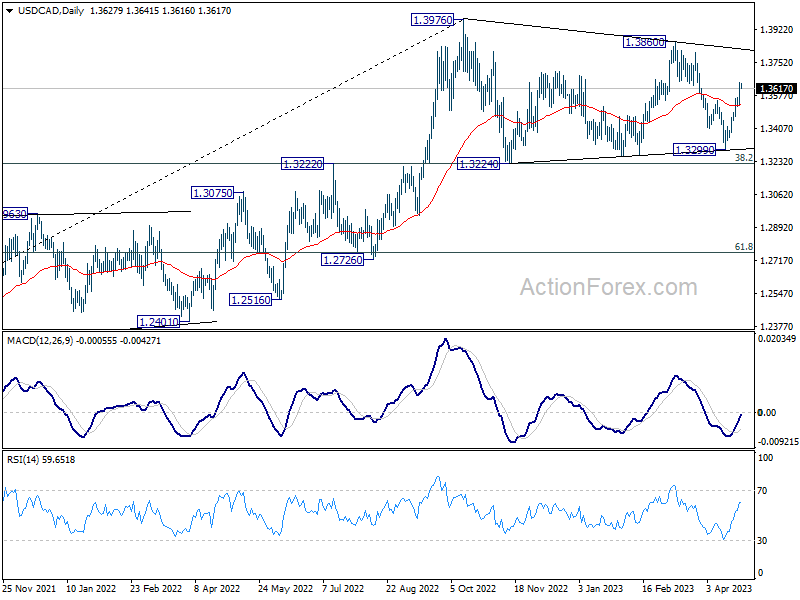
In the bigger picture, the up trend from 1.2005 (2021 low) is still in progress. Break of 1.3976 will confirm resumption and target 61.8% projection of 1.2401 to 1.3976 from 1.3261 at 1.4234. Firm break there will pave the way to long term resistance zone at 1.4667/89 (2016, 2020 highs). On the downside, sustained break of 55 W EMA (now at 1.3302) is needed to confirm medium term topping. Otherwise, outlook will remain bullish even in case of deep pull back.
GBP/USD Technical Analysis
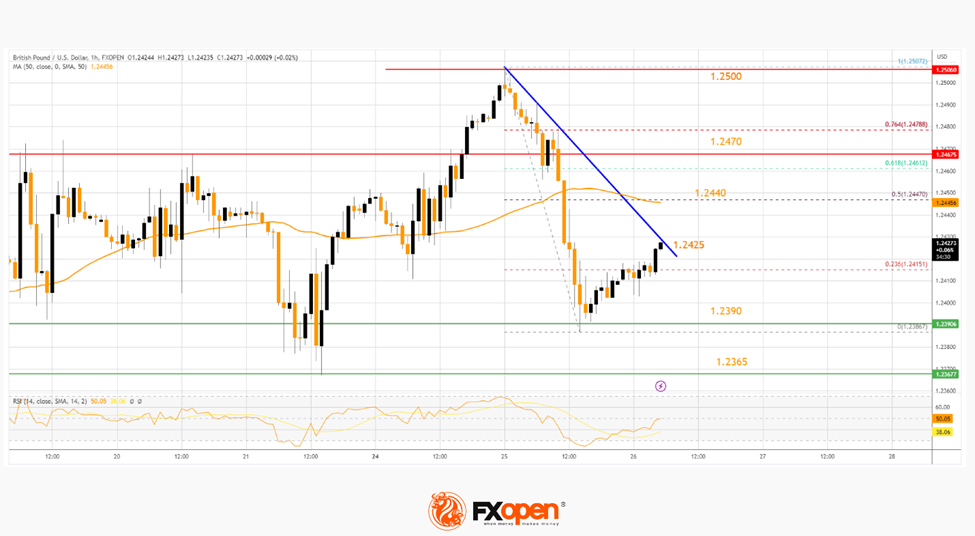
On the hourly chart of GBP/USD at FXOpen, the pair started a fresh decline from the 1.2500 zone. The British Pound declined heavily below the 1.2470 level against the US Dollar.
Finally, it tested the 1.2390 support and recently started an upside correction. The pair is now facing resistance near a connecting bearish trend line at 1.2425. The next major resistance is near the 50% Fib retracement level the downward move from the 1.2507 swing high to the 1.2386 low at 1.2440 and the 50-hour simple moving average.
If there is a clear upside break above the 1.2440 resistance, the pair could rise steadily toward the 1.2470 level in the near term. The next major resistance sits near the 1.2500 level.
On the downside, the first major support is near the 1.2390 level. The main support is forming near the 1.2365 level. A break below the 1.2365 support could push the pair toward the 1.2320 support.
Australia March CPI – Goods Deflation Greater than Anticipated
Headline CPI 1.4%qtr/7.0%yr; Trimmed Mean 1.2%qtr/6.6%yr; Weighted Median 1.2%qtr/5.8%yr. The more modest rise in the Trimmed Mean is highlighting that the current disinflationary force, particularly for goods, appears to be greater than we thought.
The March quarter CPI came in as broadly as expected rising 1.4%qtr (true it was above market expectation of 1.3% but it was on Westpac’s 1.4%) taking the annual pace down to 7.0%. The Trimmed Mean surprised coming in softer than expected rising just 1.2%qtr for an annual pace of 6.6%. Our end 2023 target for the Trimmed Mean is 3.7%yr. The ABS noted that while prices continued to rise for most goods and services, many of these increases were smaller than they have been in recent quarters.
The more modest rise in the Trimmed Mean is highlighting that the current disinflationary force, particularly for goods, appears to be greater than we thought. For while services inflation is holding up, and is likely to prevent inflation falling back within the band in 2023 (and even in 2024 as per our current forecasts) it is not enough to prevent goods disinflation taking the annual pace of inflation back to close to the band by the first half of 2024.
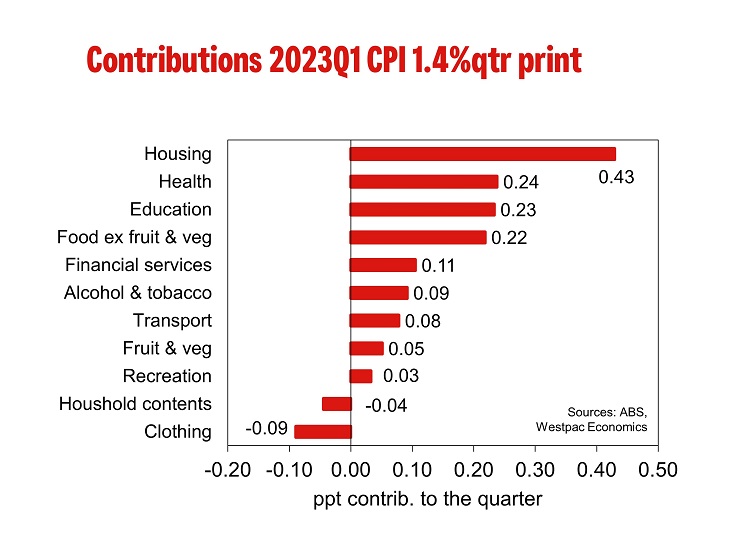
The most significant contributors to the March quarter rise were medical & hospital services (+4.2%), tertiary education (+9.7%), gas & other household fuels (+14.3%) and domestic holiday travel & accommodation (+4.7%). Partially offsetting the rise was international holiday travel & accommodation (-8.2%), as some destinations entered their off-peak seasons following significant rises in recent quarters. Also discounting by retailers resulted in falls across furniture (-4.6%), major & small appliances (-3.8%) and clothing (-3.2%).
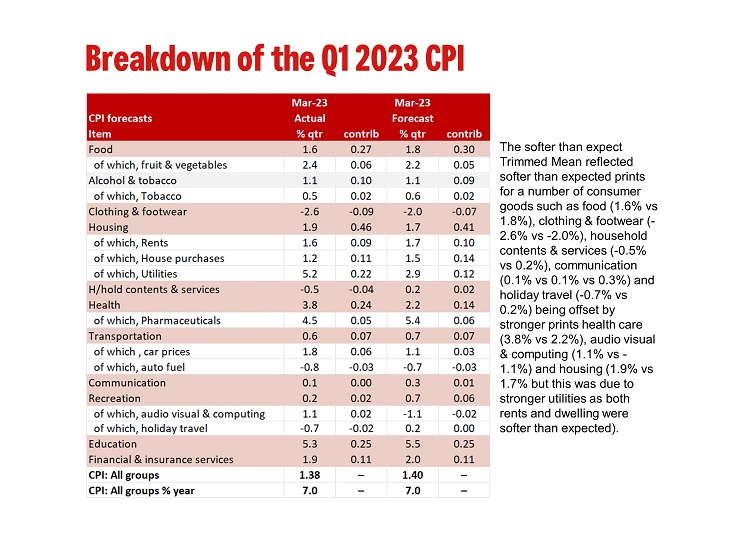
We have included a table comparing our forecasts to the actual print. While the headline print came in as we expected the softer than expect Trimmed Mean reflected softer than expected prints for a number of consumer goods such as food (1.6% vs 1.8%), clothing & footwear (-2.6% vs -2.0%), household contents & services (-0.5% vs 0.2%), communication (0.1% vs 0.1% vs 0.3%) and holiday travel (-0.7% vs 0.2%) being offset by stronger prints health care (3.8% vs 2.2%), audio visual & computing (1.1% vs -1.1%) and housing (1.9% vs 1.7% but this was due to stronger utilities as both rents and dwelling were softer than expected).
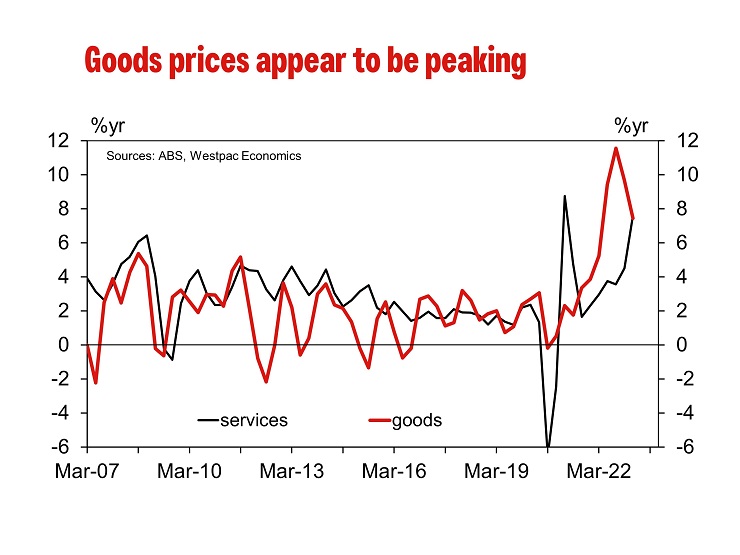
Annual goods inflation eased after two years of steady increases, from 9.5%yr to 7.6%yr, due to discounting on furniture, appliances and clothes and lower automotive fuel. Annual services inflation recorded its largest annual rise since 2001, driven by higher prices for holiday travel, medical services, rents and restaurant meals. Core market services excluding volatile items gain 0.9% in the quarter, a step down from the 2.7%qtr increase in December but historically March is a soft quarter. This is why the annual pace lifted to 6.8%yr from 6.4%yr (and compared to 2.5%yr in March 2022) with the six-month annualised pace lifting to 9.3%yr from 6.1%yr.
As noted earlier the pace of new dwellings inflation continues to ease following a record annual pace the September quarter. Lifting 1.2% this was softer than our forecast of 1.5% and well down on the 3.7% increase in December, 5.6% in September and 5.75 increase in March. The recent moderation in prices reflects improvements in the supply of construction materials, a softening in demand and the unwinding of various government construction grants.
There was no surprise in rents recording their fastest annual pace since 2010, reflecting strong demand amid low vacancy rates across the country; Sydney and Melbourne both recorded their strongest annual pace since 2012. In the quarter, the 1.6% gain was a gain from the 1.2% increase in December and the strongest increase since March 2009.
For gas & other fuels price reviews reflecting higher wholesale gas prices led to rises across all capital cities. In the quarter gas & other fuels lifted 14.3%, the strongest since September 2012 (14.2%) taking the annual pace to 26.2%yr, the strongest on record.
Electricity prices reviews hit the CPI in the September quarter. However, the respect price rises were partially offset by the introduction of electricity rebates in WA, QLD and the ACT. The unwinding of these rebates has seen the full effects of higher electricity prices reflected in the March quarter (3.0%qtr/15.5%yr).
Auto fuel fell 0.8%qtr with unleaded fuel unchanged and diesel prices –10.3%qtr. While fuel prices remain high it has been a year since Russia invaded Ukraine which saw prices jump 11.0% in the quarter so prices are up just 1.1% in the year to March 2023; it was 13.2%yr in December.
Non-discretionary inflation includes goods & services that households are less likely to reduce their consumption of, such as food, automotive fuel, housing and health costs. Non-discretionary goods & services rose 1.9%qtr/7.2%yr due to medical 7 hospital services (+4.2%), gas & other household fuels (+14.3%) and new dwellings (+1.2%). Discretionary goods & services lifted 0.6%qtr/6.8%yr driven by tertiary education (+9.7%), domestic holiday travel (+4.7%) and motor vehicles (+1.8%).
JPY Carry trade: Downside Pressure Mounts as Global Demand Faces Headwinds
- Commodities and growth proxies JPY crosses are leading the decline in G10 JPY carry trade basket.
- A widening of the US high-yield corporate bonds credit spread may spark a higher volatile movement in the JPY crosses.
- Key US earnings releases from Visa, Microsoft, and Alphabet are indicating slower global demand spending despite expectations beat.
FX volatility may start to increase as G10 JPY crosses have shaped significant reversal movements
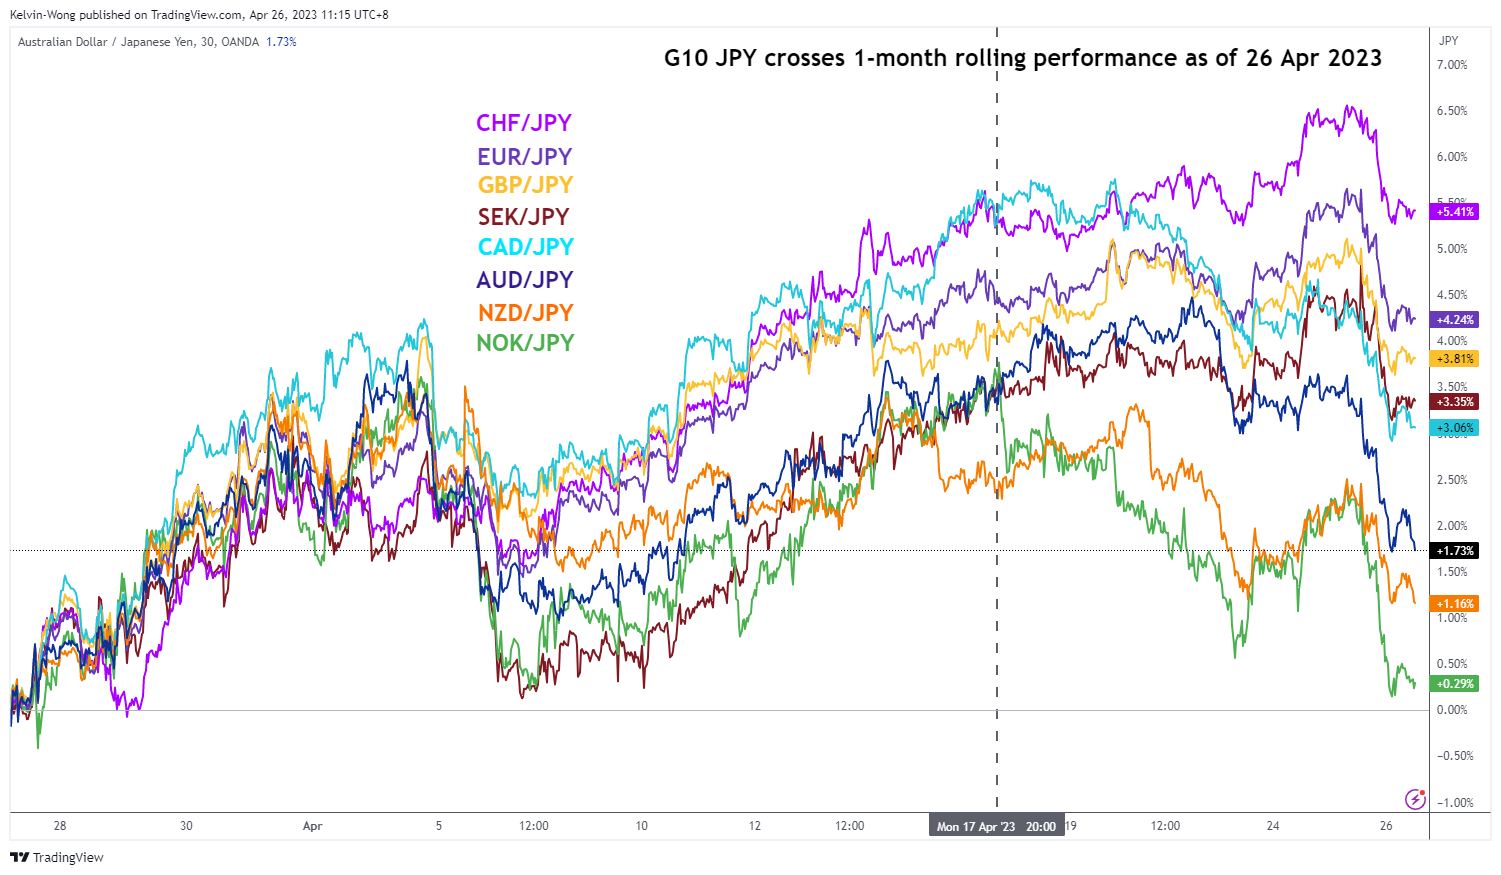
Fig 1: G10 JPY crosses 1-month rolling performances as of 26 Apr 2023 (Source: TradingView, click to enlarge chart)
The G10 JPY crosses have started to exhibit a risk-off liked behaviour due to concerns about global growth expansion.
As for the concerns about global growth, the focus is on the will of China policymakers to implement further liquidity measures to boost domestic economic growth which in turn drives up Chinese consumers and corporate’s spending and investment in international goods and services. That’s a very much needed “support” for the global economy given that the rest of the developed nations’ central banks are still in a tightening mode on their respective monetary policies (except Japan for now, at least in the near term).
The latest guidance from China’s central bank PBoC has indicated that it prefers a “wait and see” approach before implementing any further accommodative measures as recent key economic data such as housing, consumer spending, and industrial production are now in recovery mode.
Therefore, it is interesting to note that the commodities-related JPY crosses (proxies of global growth); NOK/JPY, NZD/JPY, and AUD/JPY have led the recent downside reversal since 17 April 2023 as illustrated on the above chart.
Widening of US high-yield corporate bonds credit spread precedes significant movements on a JPY carry trade basket
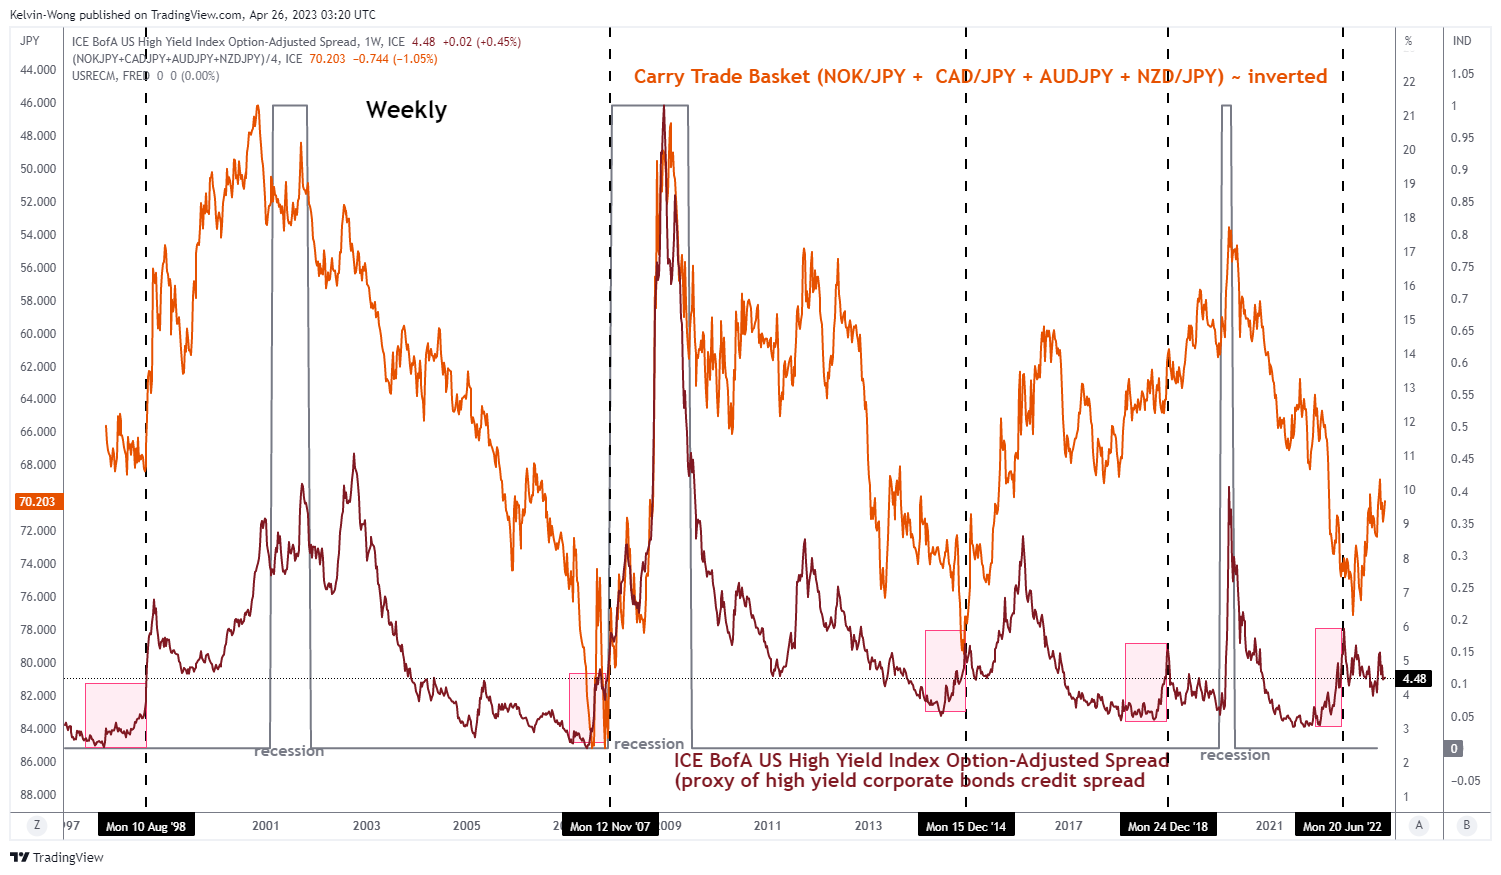
Fig 2: ICE BofA US high yield index option-adjusted spread & JPY carry trade basket as of 24 Apr & 26 Apr 2023
(Source: TradingView, click to enlarge chart)
We have highlighted earlier in a previous article the elements that may trigger an imminent widening of the US high-yield corporate bonds credit spread.
Right now, the focus is on inter-market analysis; the pink-coloured shaded boxes in the above chart highlighted previous episodes in the significant widening of the credit spread in the weekly periods of 10 August 1998, 12 November 2007, 15 December 2014, 24 December 2018, and 20 June 2022 have led to a similar movement of the inverted commodities and growth proxies related JPY carry trade basket (equal weightage of NOK/JPY, CAD/JPY, AUD/JPY & NZD/JPY).
The above-mentioned correlation also has logical economic reasoning as a widening of high-yield corporate bonds credit spread indicates a rising default risk. For such a scenario to take shape, we need to have a credit crunch that led to a slowdown in global growth, which eventually tends to have a negative feedback loop into the JPY crosses due to JPY being a “traditional safe haven and funding currency” of choice by market participants.
Key US earnings releases point to global growth deceleration despite expectations beat by Microsoft, Alphabet & Visa
Visa Inc is a market leader in the online payment business space where its financial data can be used as a proxy to gauge global consumer spending. Its overall net revenue growth for fiscal Q2 2023 slowed to 11% year-on-year from 12% in fiscal Q1 2023, its slowest revenue growth since fiscal Q3 2021.
Microsoft’s crown jewel cloud services business segment; Azure recorded a slower growth for fiscal Q3 2023 at 27% year-on-year from 31% in fiscal Q2 2023, its cloud business revenue growth has recorded four consecutive quarters of slowdown.
Alphabet, the parent company of Google has reported a second consecutive quarter of slowdown in Google advertising revenue that decrease by less than 1% year-on-year in Q1 2023 from a decline of close to 4% posted in Q4 2022.
CAD/JPY Technical Analysis – short-term downside momentum intact below 99.00 key resistance
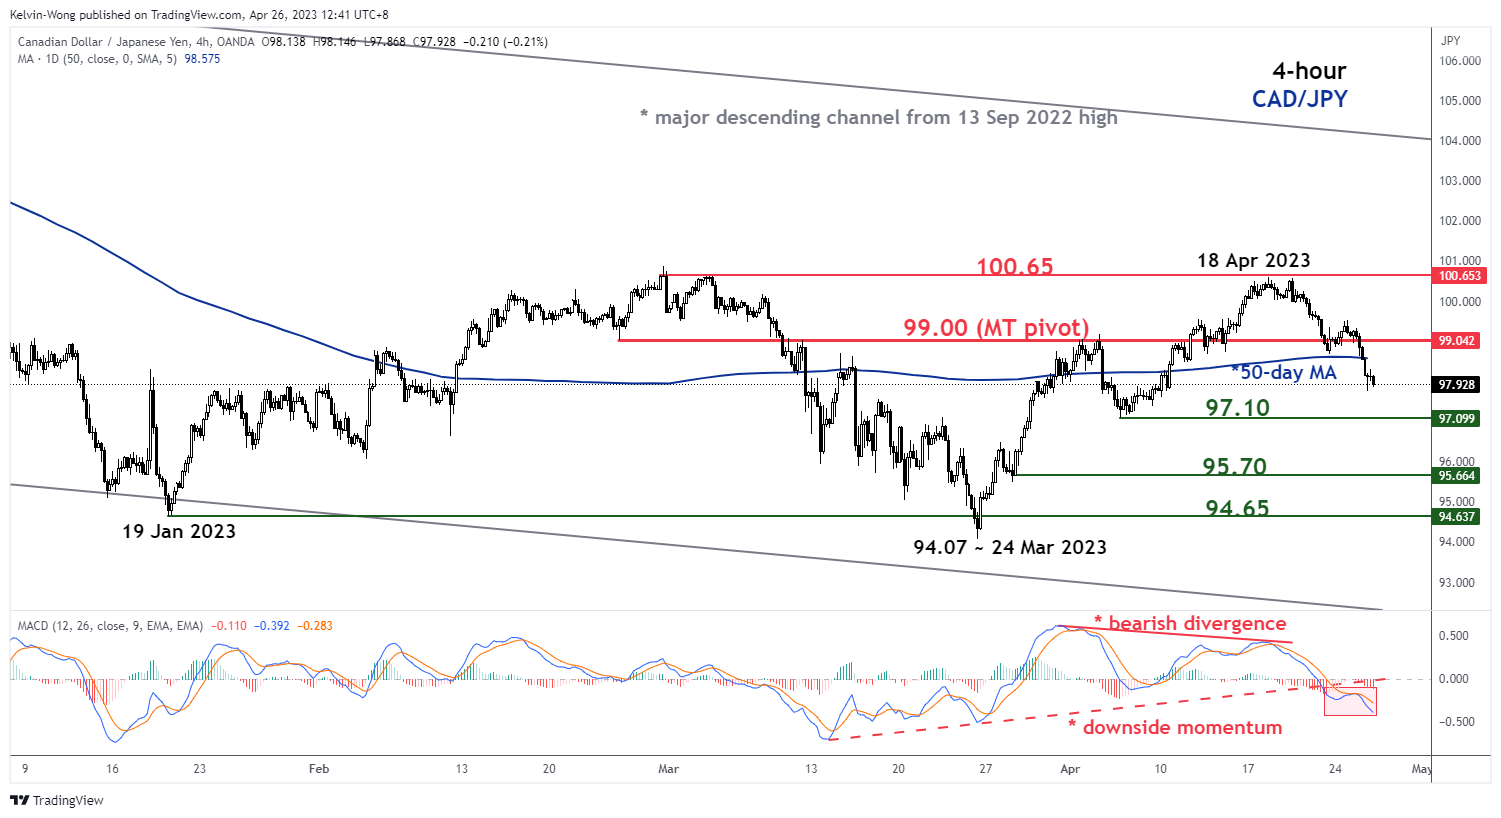
Fig 3: CAD/JPY trend as of 26 Apr 2023 (Source: TradingView, click to enlarge chart)
The minor uptrend phase of the CAD/JPY cross pair from its 24 March 2023 low of 94.07 to its recent 18 April 2023 high has been damaged and the current observations seen on the 4-hour MACD indicator have indicated a revival of short-term downside momentum.
A break below the intermediate support of 97.10 exposes the next supports at 95.70 and 94.65 (the lower limit of the medium-term sideways range configuration in place since the 19 January 2023 low).
On the other hand, a clearance with a 4-hour close above 99.00 key medium-term pivotal resistance negates the bearish tone to see the next resistance coming in at 100.65 (the upper limit of the sideways range configuration).
Nasdaq (NQ) Buyers Can Appear Soon According to Elliott Wave
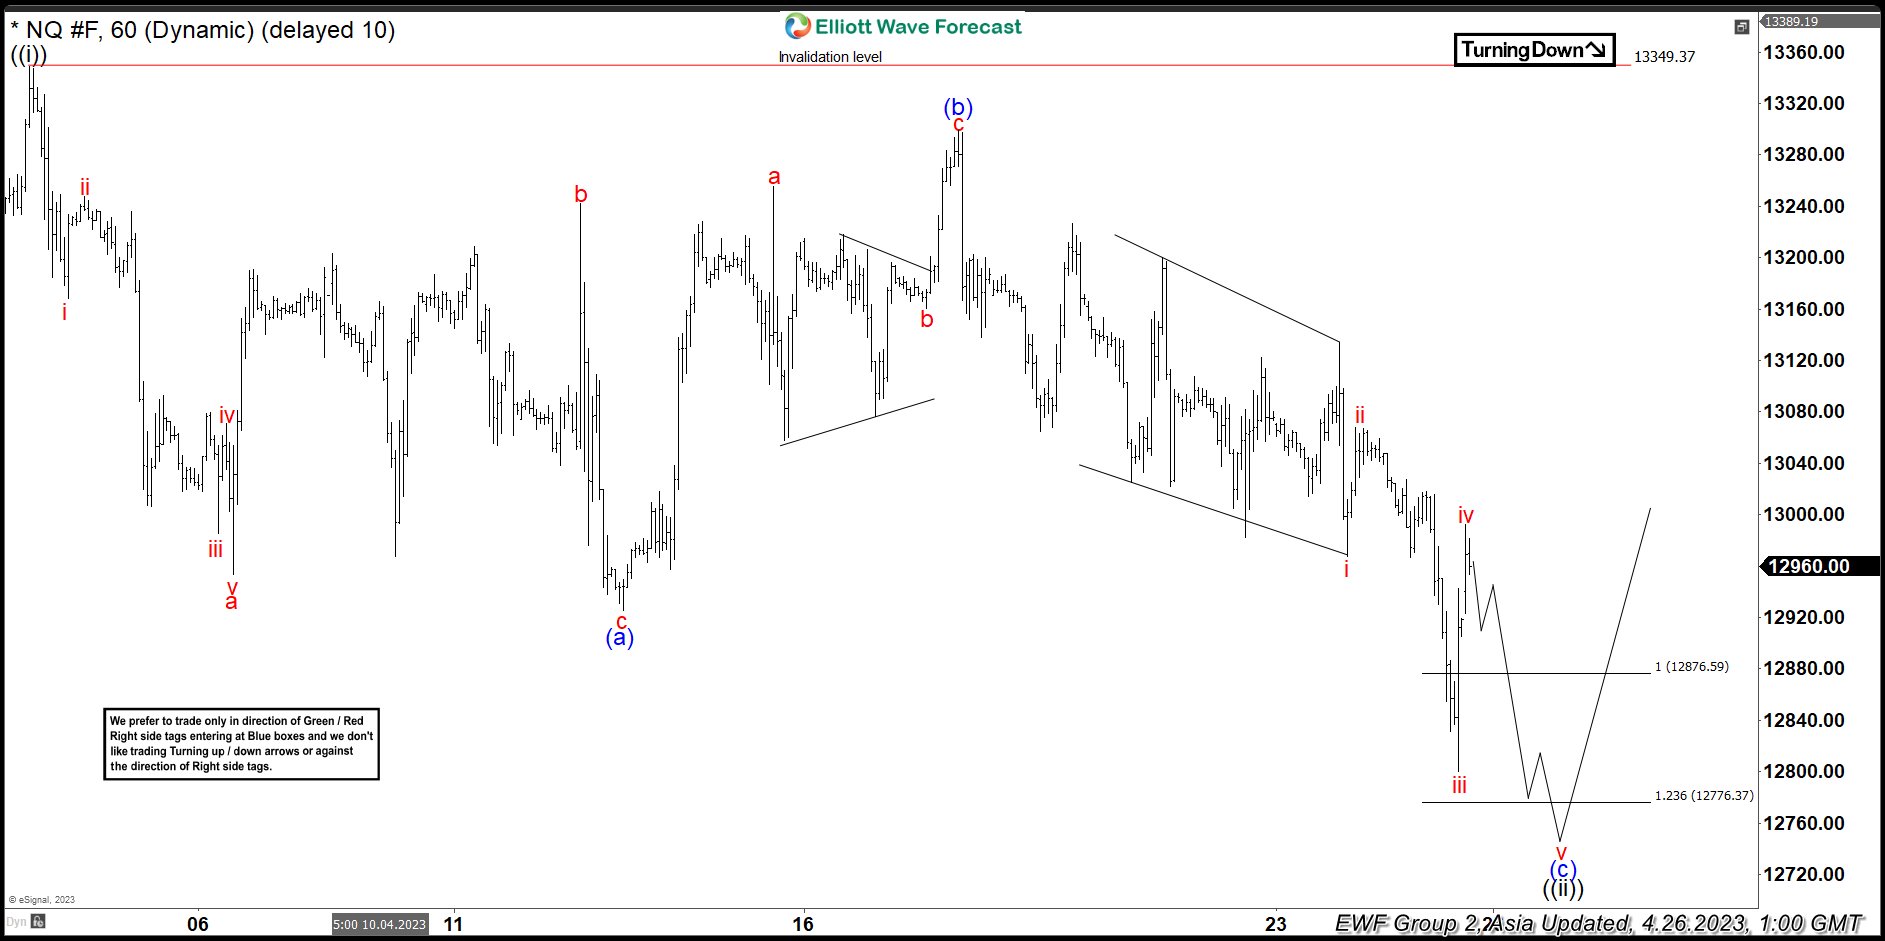
Short Term Elliott Wave in Nasdaq (NQ) suggests the Index is cycle from 3.13.2023 low ended in wave ((1)) at 13349.37 as the 1 hour chart below shows. Wave ((ii)) pullback is currently in progress to correct cycle from 3.13.2023 low. Internal subdivision of wave ((ii)) is unfolding as a double three Elliott Wave structure.
Down from wave ((i)), wave a ended at 12953.25 and wave b ended at 13241.75. Wave c lower ended at 12925.50 which completed wave (a) in higher degree. Wave (b) rally ended at 13298.75 with internal subdivision as a zigzag. Up from wave (a), wave a ended at 13255 and dips in wave b ended at 13160.25. Wave c ended at 13297.75 which completed wave (b). Wave (c) lower is in progress as 5 waves. Down from wave (b), wave i ended at 13065 and rally in wave ii ended at 13226.75. Wave iii ended at 12800. Expect wave iv to end soon and Index to turn lower in wave v to complete wave (c) of ((ii)). Potential target for wave (c) of ((ii)) is 100% – 161.8% Fibonacci extension of wave (a) which comes at 12614.1 – 12876.5.
NQ 60 Minute Elliott Wave Chart
Nasdaq Elliott Wave Video
https://www.youtube.com/watch?v=aJVUCAKTqEY
Greenback Tried to Bank on Safe Haven Status, But Didn’t Really Shine
Markets
Q1 First Republic earnings sent the regional lender’s stock price in a tail spin. Huge deposit outflows (>$100bn) and a refusal to take analyst questions or provide guidance for the remainder of the year confirm that the company is on death row “exploring strategic options” in the end game. First Republic is the exception to the rule for now, with other regional lenders managing to restore confidence after the mid-March panic. PacWest was the latest example, reporting a small deposit increase yesterday and propelling its share price. The First Republic earnings nevertheless put a bad taste in investors’ mouth. Especially in combination with some disappointing US eco data. US consumer confidence reached its lowest level since July last year in April (101.3 from 104 vs 104 expected). The decline was solely due to a more pessimistic outlook as the fallout from the mid-March regional banking crisis took its toll (expectations down to 68.1 from 74) while the present situation index, focusing on current labour market etc., rose from 148.9 to 151.1. The April Richmond Fed manufacturing index fell from -5 to -10 (vs -8 expected). The combination of both created a risk-off market environment especially from the start of US dealings. US yields lost 5.3 bps (30-yr) to 13.5 bps (2-yr) in a daily perspective. Changes on the German curve varied between 10.7 bps (30-yr) and 13.5 bps (2-yr). Part of the European moves were catching-up with US action on Monday evening (publication Q1 First Republic results around US close). Main European equity indices lost 0.5% or more with key US gauges tumbling 1% (Dow) to 2% (Nasdaq). The greenback tried to bank on its safe haven status, but didn’t really shine. The US nature of yesterday’s market stress serves as strong counterweight. EUR/USD closed at 1.0973 after testing the YTD highs around 1.1070 early on. The tradeweighted dollar rebounded from 101.26 to 101.95. Technical USD pictures didn’t improve. Today’s eco calendar is less enticing with only march US durable goods orders. The US Treasury continues its end-of-month refinancing operation with a $43bn 5-yr Note auction. Yesterday’s $42bn 2-yr sale tailed slightly with the 2.68 bid cover in line with the recent average (2.66). Overall market sentiment will be the key driver ahead of European and US GDP and inflation numbers tomorrow and on Friday. For the moment, we don’t read too much into yesterday’s risk scare.
News and views
Australian Q1 headline inflation slowed slightly less than expected to 1.4% Q/Q and 7% Y/Y, down from 1.9% Y/Y and 7.8% in Q4 2022. Measures of core inflation printed below consensus though (trimmed mean 1.2% Q/Q and 6.6% Y/Y from 6.9% in Q4). The Australian Bureau of Statistics said that most significant price rises (quarterly) were recorded in medical and hospital services (+4.2%), tertiary education (+9.7%), gas and other household fuels (+14.3%), and domestic holiday travel and accommodation (+4.7%). Goods annual inflation eased after two years of steady increases, from 9.5% to 7.6%. However, services annual inflation recorded its largest rise since 2001 (6.1% Y/Y). The market currently expects the RBA to keep its policy rate unchanged at 3.6% next week, but persistently high services inflation might be a source of debate. The 2-y Australian government bond yield this morning dropped 19 bps, but part of this move already occurred before the CPI release. AUD/USD dropped to the 0.661 area.
The Hungarian Central Bank (MNB) yesterday took a first step in winding down emergency measures put in place in October last year. The significant improvement of the risk environment, including Hungary’s risk perception, triggered the decision to narrow the interest rate corridor by reducing the overnight collateralized borrowing rate to 20.5% from 25.%. The MPC still deems it necessary to maintain the current level of the base rate (13%) over a prolonged period to ensure that inflation expectations are anchored and the inflation target is achieved in a sustainable manner. The MNB also closely monitors the effects of international financial market developments. The central bank will take into account the persistence of improvements in risk perception at the following policy meetings before making a decision to setting the interest rate conditions of overnight instruments. So, the O/N deposit rate for now is kept unchanged at 18%. Vice governor Virage indicated that the MNB will be cautious when assessing changes at upcoming meetings. The forint weakened from an intraday top of EUR/HUF 374.5 to close near EUR/HUF 377.75. However, given the global risk-off the loss was reasonable.
Riksbank to Deliver 50bp Rate Hike Today
Market movers today
The main event today will be the Riksbank Policy Rate decision at 9.30 CET, where we expect a 50bp hike in line with the market pricing. We also expect Riksbank to signal an additional hike in June, see more in the Nordic section below.
On the data front, Swedish and Norwegian March unemployment rates will be released this morning alongside German consumer confidence. This afternoon, US durable goods orders are due for release.
Markets pay close attention to any final ECB comments ahead of the silent period starting tomorrow; de Guindos is scheduled to be on the wires today.
The 60 second overview
Macro: Risk-off dominated global markets with equities lower across the board and core yields lower amid intra-euro area spreads widening. Mixed corporate earnings and concerns over First Republic Bank were the main sources of the risk-off. The sour risk sentiment continued overnight in the Asian session.
Banking turmoil: The earnings report from First Republic Bank showed a deposit outflow of 41% to just above USD 100bn in Q1 and also looks into divest part of its business, which reminded markets of the significant banking turmoil in March.
US Politics: Incumbent President Biden formally announced his campaign to be democratic nominee in the 2024 presidential election.
EU debt: in an FT op-ed yesterday, German Finance Minister Lindner repeated his case that sound public finances need clear fiscal rules. He is opposed to the Commission proposal of country-specific debt plans and instead calls for common fiscal rules that include numerical debt reduction targets, as well as additional measures that ensure compliance and better enforcement. Overall, clearly hawkish overtones from Germany, that makes EU fiscal rules reform seem increasingly like an uphill struggle, as we also discussed in Euro macro notes - Germany is falling back into old habits, 14 April.
Equities pulled back on Tuesday with losses accelerating into the US session. S&P500 closed down -1.8% and Russell 2000 as much as -2.5%. The latter was dragged down by First Republic Bank that plunged 40% after showing a -35% contraction in deposits. Markets shifted to recession fear mode with all sectors lower and a classic defensives-over-cyclicals preference. Let's call it risk off, with VIX rising all the way up to 19, yields falling in tandem with equities (the good old correlation) and industrial metals and oil down 2-3%. Solid tech earnings have bid up the Nasdaq futures this morning, so a shift in sentiment is in the cards.
FI: The sour risk sentiment sent 10y German yields 10bp lower despite the significant supply to markets yesterday from EU and Germany as well as hawkish commentary from Schnabel, who clearly favours a 50bp rate hike next week in our reading. Uncertainty is high for the upcoming ECB meeting whether ECB will deliver a 25bp or 50bp rate hike. Markets price 3.82%, which is 6bp less than on Monday.
FX: USD rebounded yesterday and notably EUR/USD was on a roller-coaster ride. First rising above 1.1060 before falling to around 1.0970 and despite a narrowing of the spread between short-term USD and EUR interest rates. Sour risk sentiment, i.e. a drop in US equities and oil price, looked to be the main culprit.
Credit: Overall the secondary credit markets remained calm while primary markets remained active. The iTraxx Main was unchanged while the iTraxx Xover widened 6bp from yesterday.
Nordic macro
We expect the Riksbank to deliver a rate hike of 50bp bringing the policy rate to 3.50% and to signal an additional rate hike in June, somewhere between 25bp and 50bp. This view is well aligned with current market pricing, which indicates 50+30+15bp=95bp for three upcoming meetings. We still expect a final 50bp in June and a peak rate at 4.0%. After near-term hikes, the Riksbank's rate path projections from the last two meetings have shown a completely flat profile until the end of the forecast period (which will now include Q2 26). If the Riksbank opts to do this again we would find it natural for the market to continue to ignore it. Notably, the market is pricing in the first full 25bp cut by Q1 2024 and close to another 25bp cut in Q2 2024. A signal of eventual rate cuts towards the end of the rate path would make more sense in our view, as the policy rate otherwise would be too restrictive for too long. While March inflation was lower than expectations, the gap to the Riksbank's forecast remains too wide (1.4pp for core). In addition, macro developments have also been stronger than expected at the start of the year. Even the housing market is showing resilience, although we deem this to be temporary. With regards to the active QT, it is still early days so we would not expect any changes at this point. As for the SEK, there is little room for the Riksbank to underwhelm market expectations. The KIX-weighted SEK is back close to February levels, which then prompted the U-turn with regard to krona communication. Board members have then made it clear that their increased focus on the SEK should not be interpreted as them having an exchange rate target. That said, too much FX complacency runs the risk of spurring further SEK weakness. Given current market pricing a 50bp hike should be SEK neutral. Forward guidance and overall communication will be more important.
USD Makes Comeback
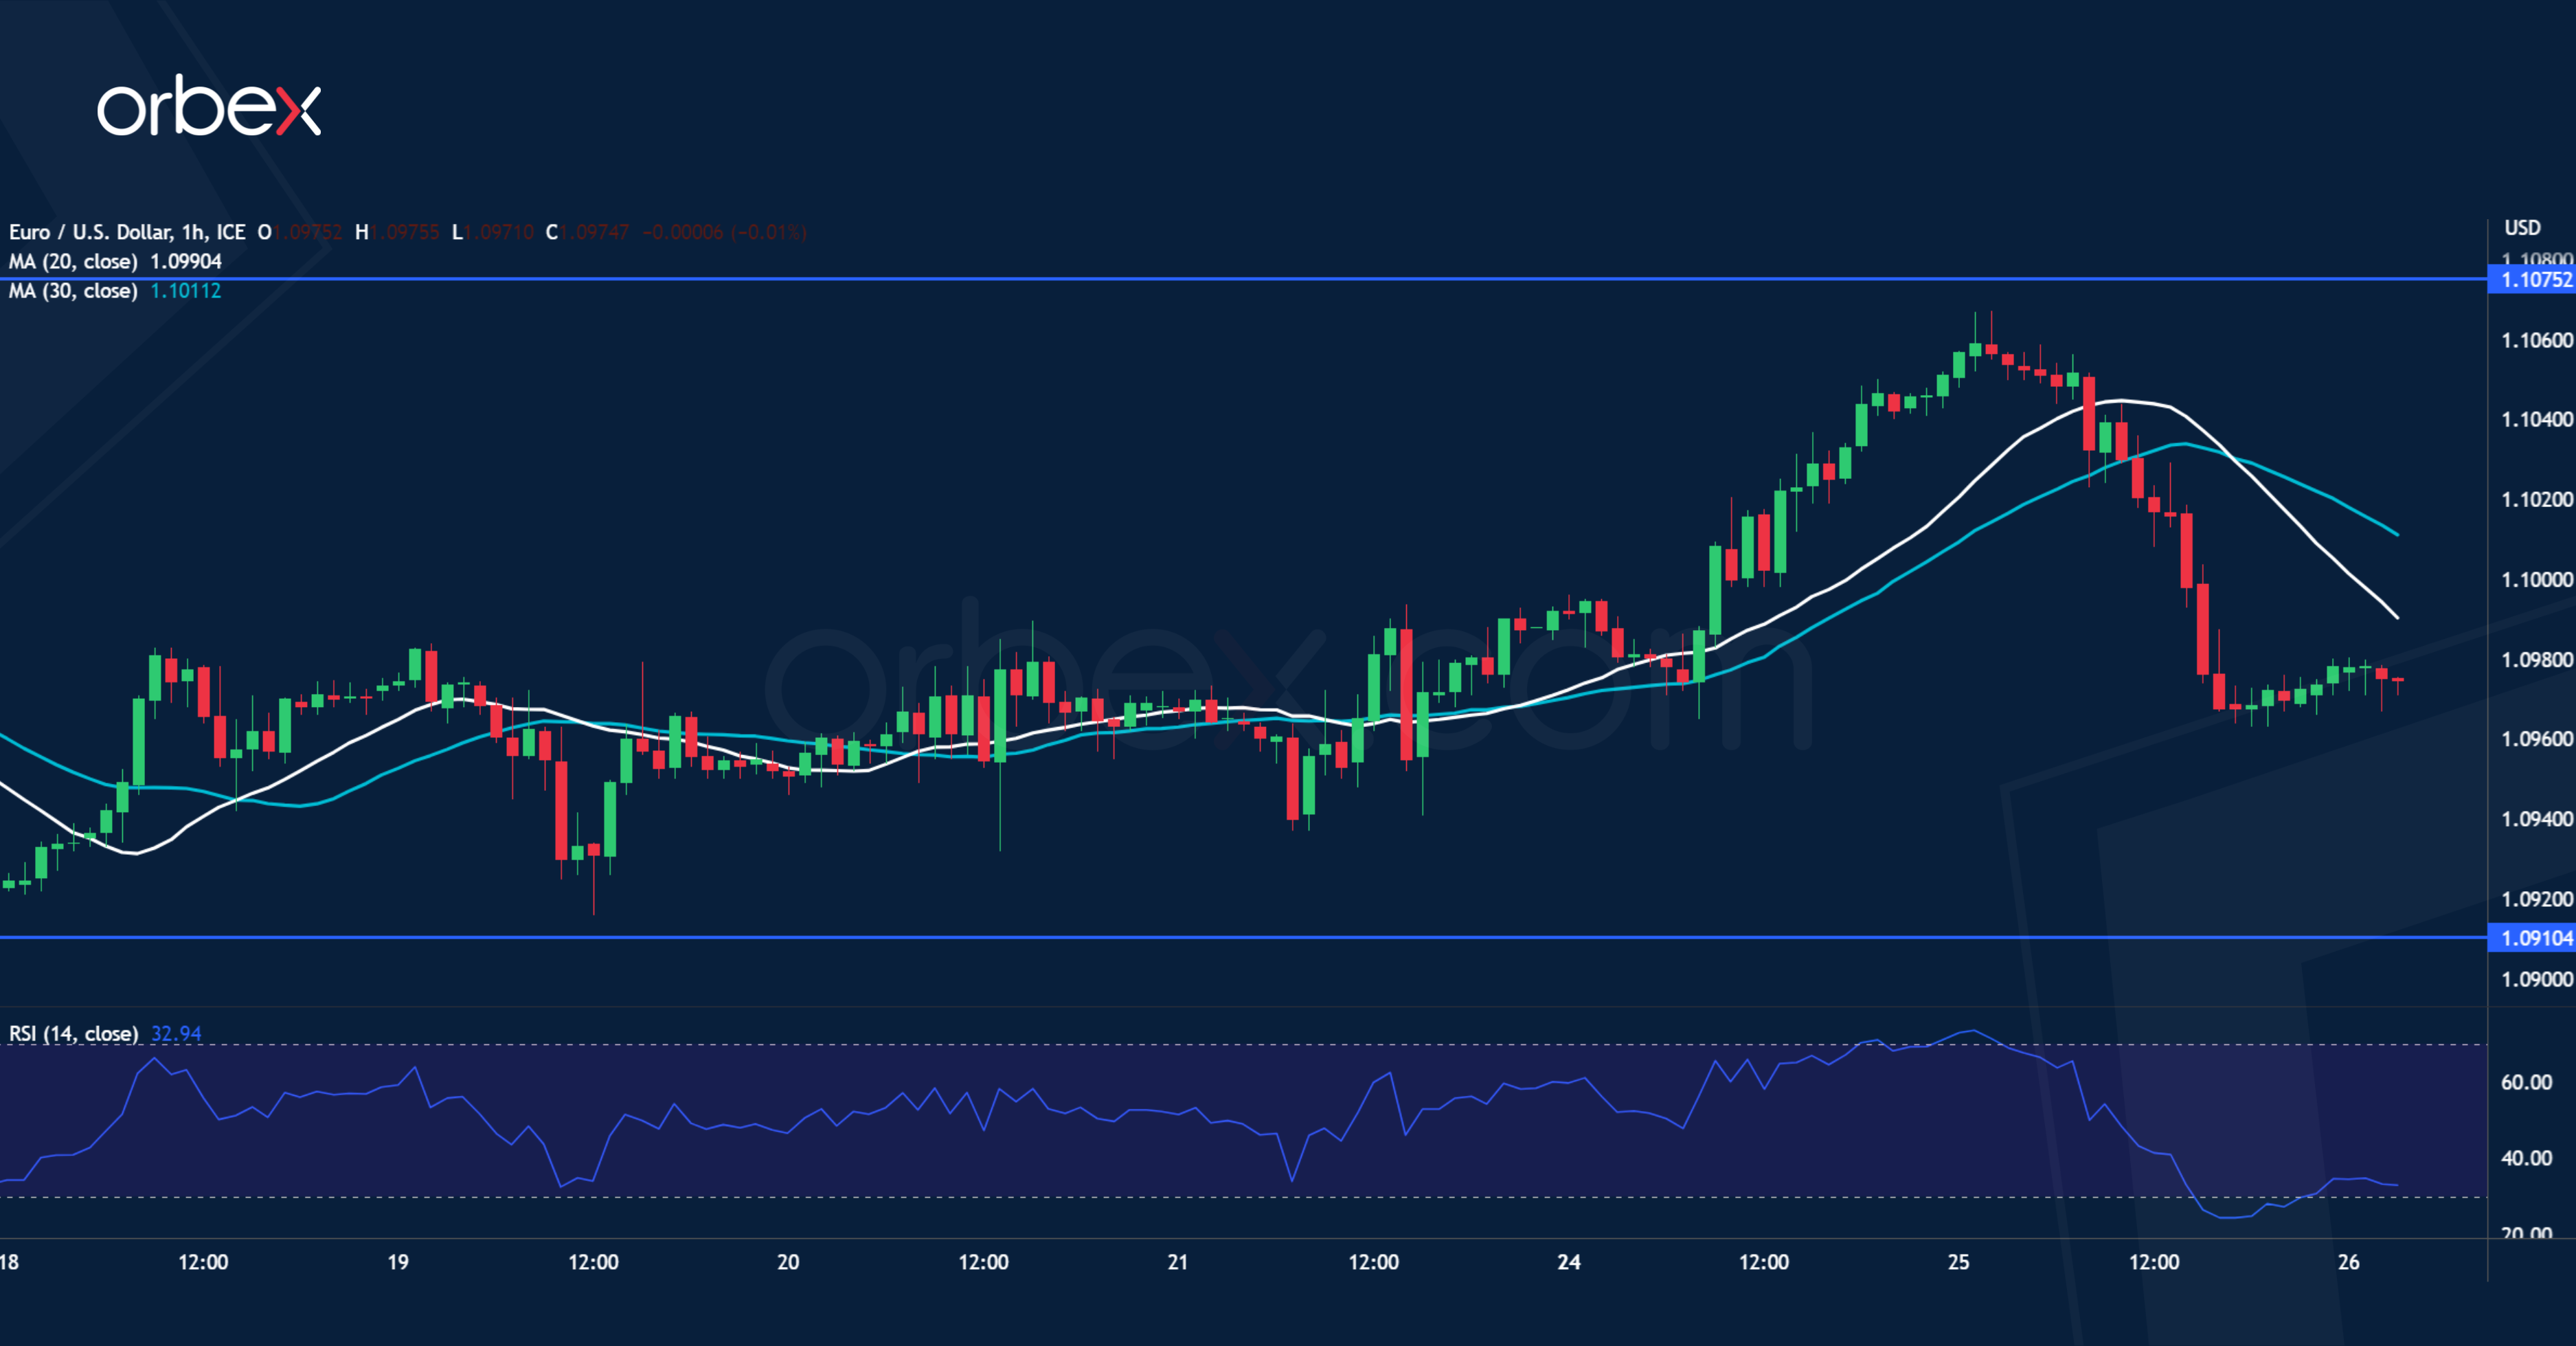
EUR/USD hits resistance
The US dollar clawed back losses with robust new home sales in March. The price is still trying to hold on to recent gains after rallying above this year’s high of 1.1000. A drop below the closest support at 1.0970 has broken the latest momentum and may push short-term buyers to the sidelines. With the RSI showing an oversold condition, 1.0910 at the base of a previous bullish breakout and over the 20-day SMA is likely to be tested. The recent high of 1.1075 is the key hurdle to lift before the bulls could regain control.
AUD/USD breaks lower
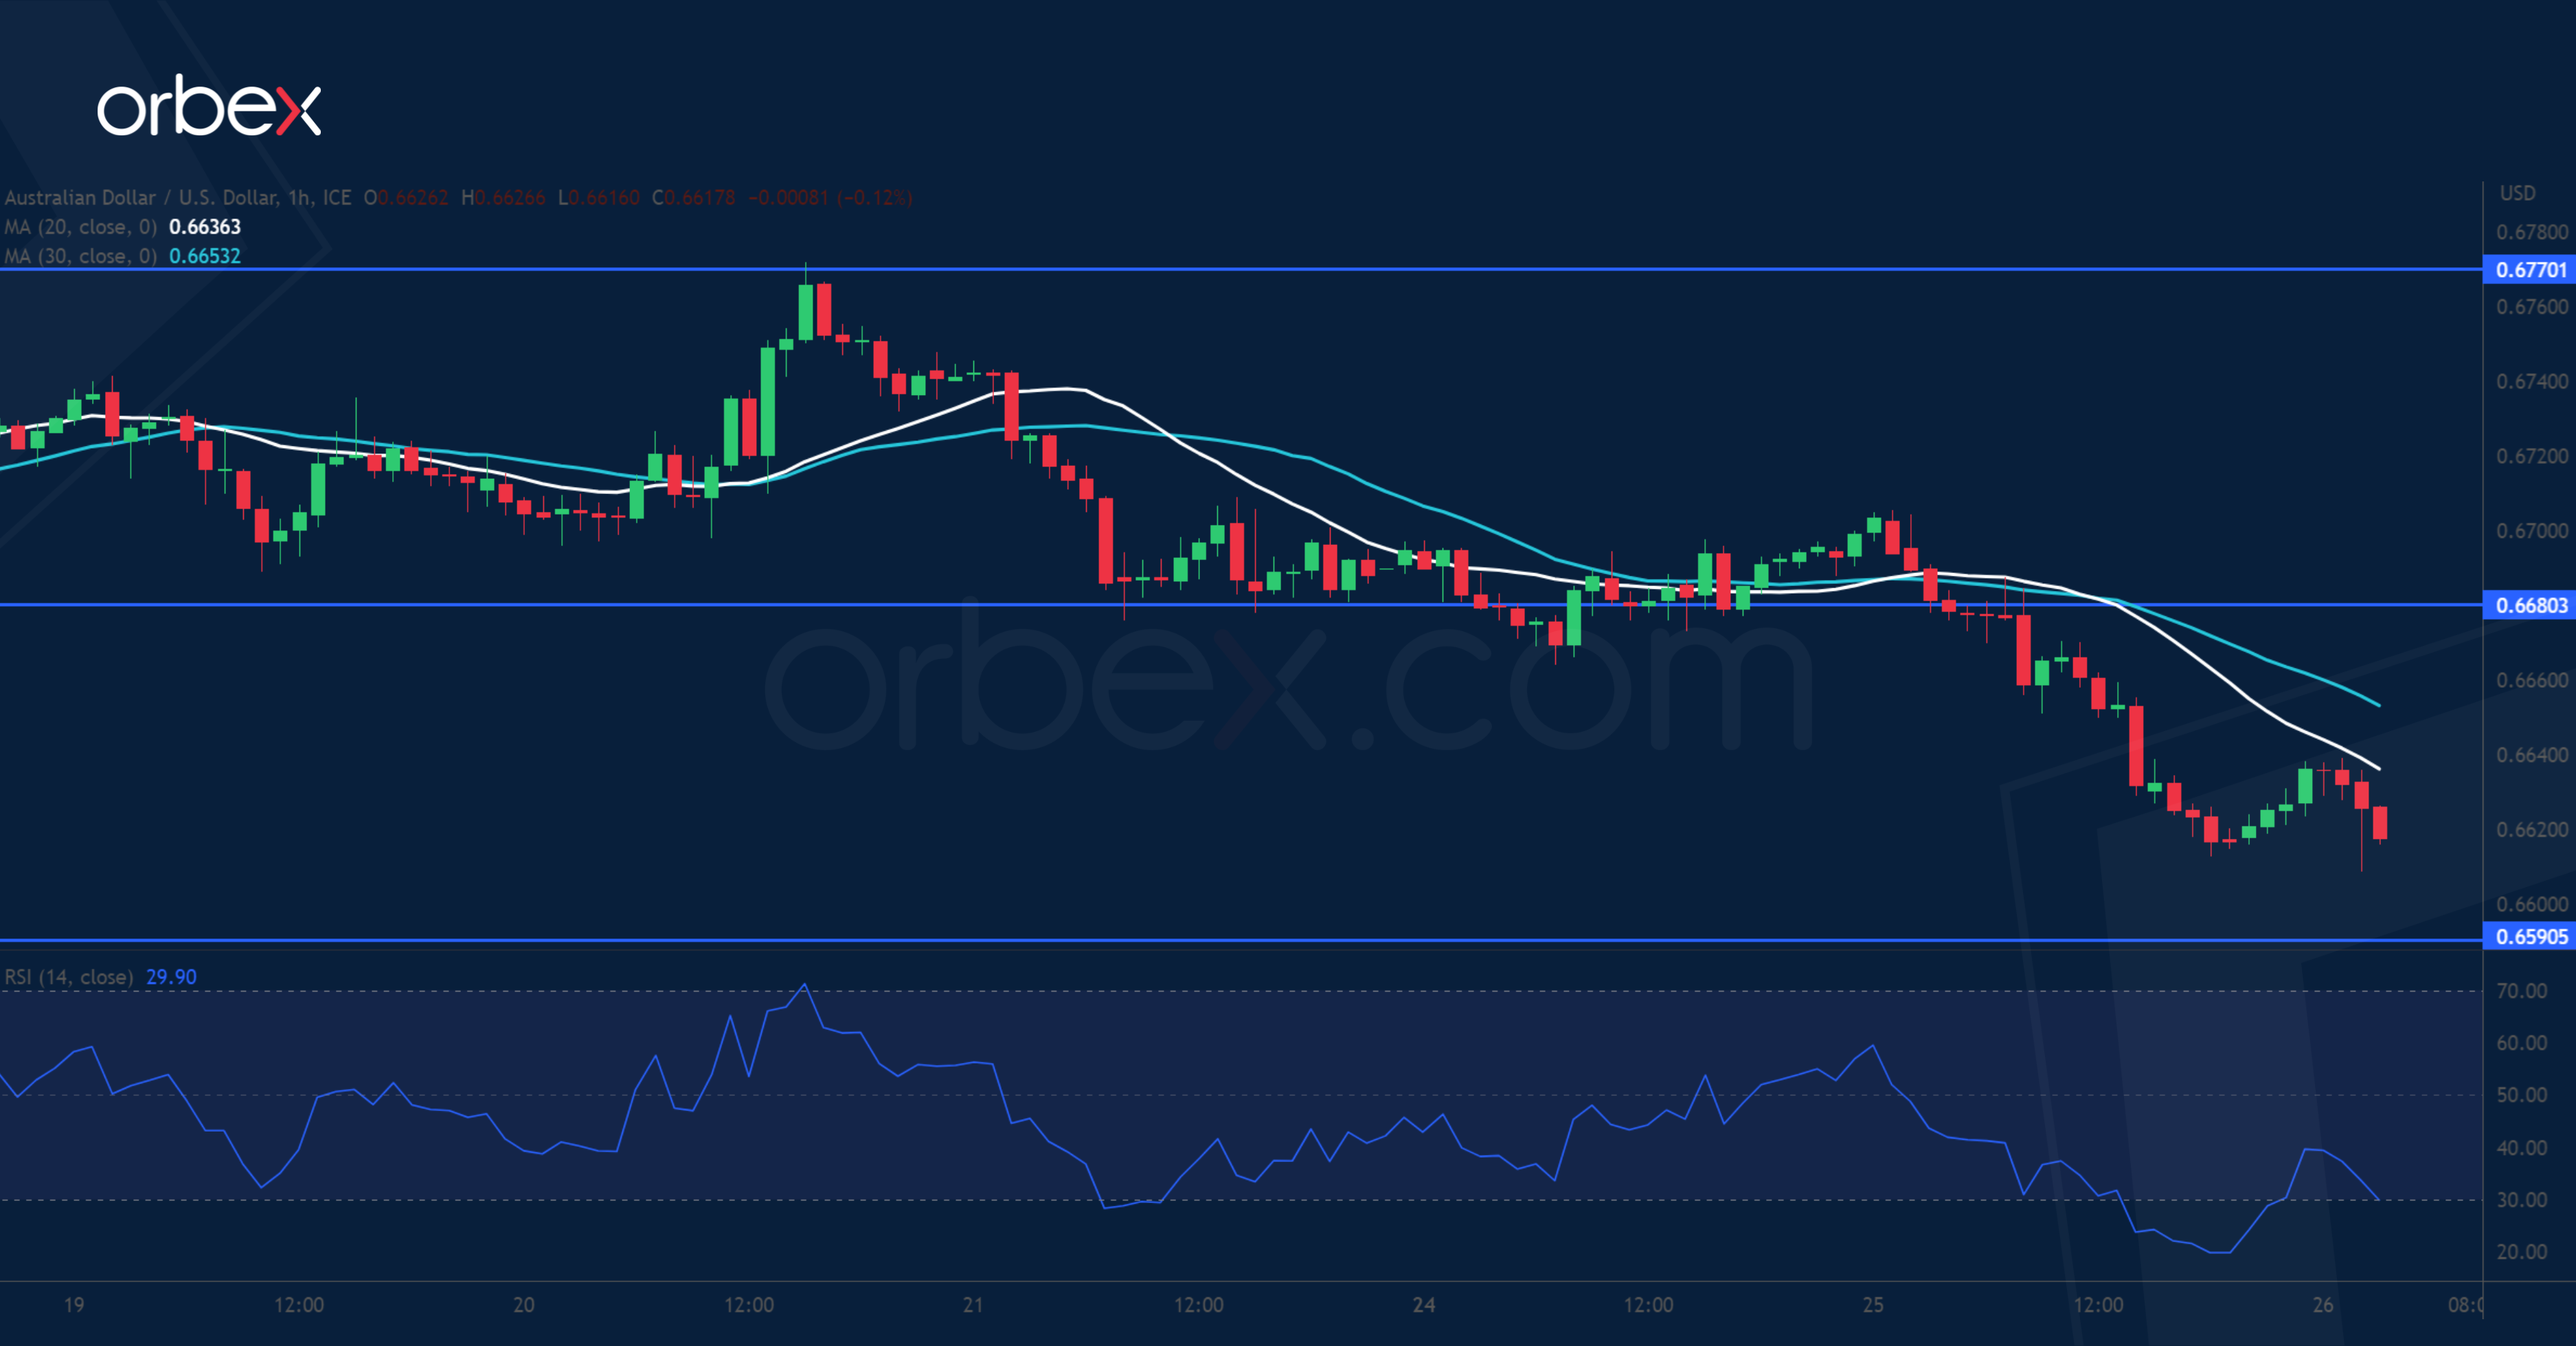
The Australian dollar slipped over a slowdown in Q1 inflation. The pair continues to struggle to stand its ground against growing selling interest despite an upward consolidation for a month and half. The bulls will need to clear 0.6770 before a meaningful recovery could take shape. Instead, a drop below 0.6620 showed little commitment from the buy side, and could potentially lead to a broader liquidation below the March lows of 0.6590. 0.6680 is a fresh resistance as the RSI attempts to recover into the neutral zone.
UK 100 drifts lower
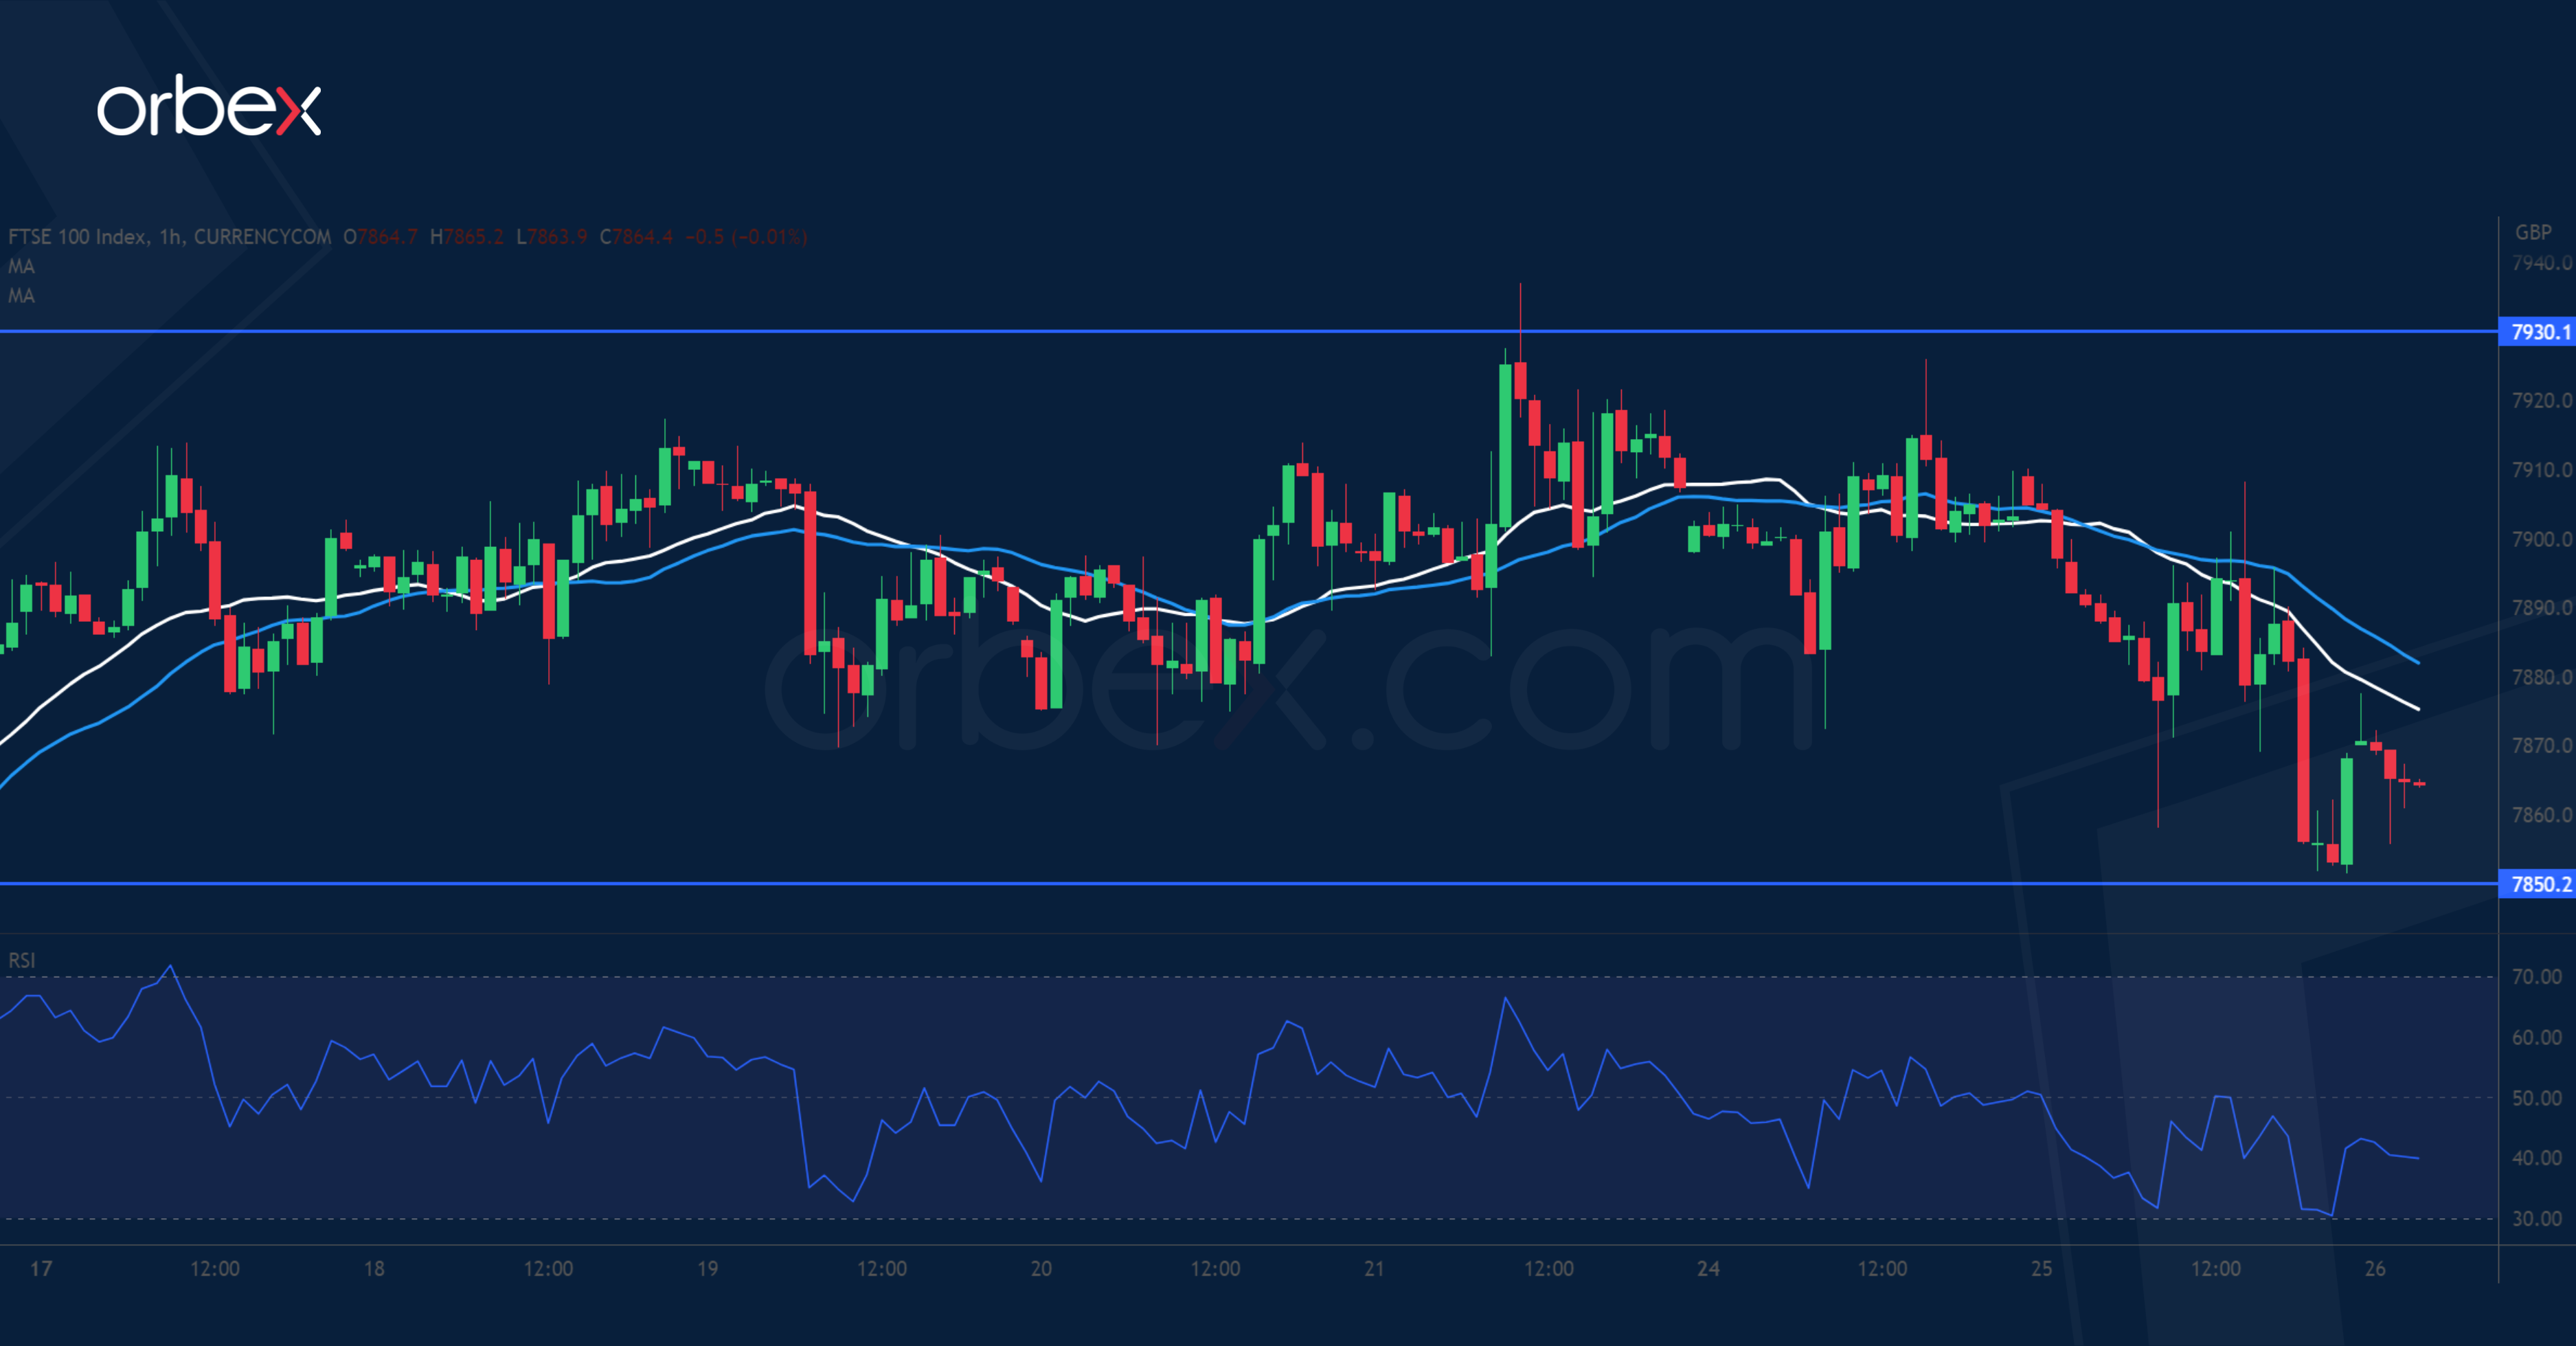
The FTSE 100 softened as tumbling deposits at First Republic Bank renewed fears about the banking sector. The V-shaped rally has put the index back right under this year’s high with the supply zone 7930-7970 being the bears’ last stronghold. A bullish breakout would signal a continuation to a new all-time high above 8040. However, the bulls would need to catch their breath and consolidate their gains. 7850 is first to assess follow-up interest as the price goes horizontal. A deeper correction would test 7775 on the 20-day SMA.