Sample Category Title
EUR/AUD Daily Outlook
Daily Pivots: (S1) 1.6331; (P) 1.6371; (R1) 1.6441; More...
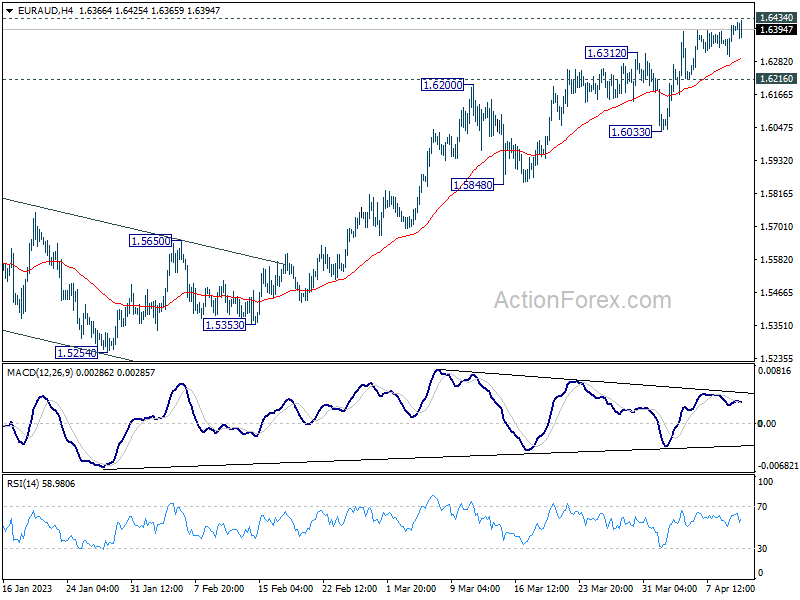
Focus is back on 1.6434 key resistance with EUR/AUD trading to resume recent rally. Decisive break there will carry larger bullish implications. Nevertheless, considering bearish divergence condition in 4H MACD, firm break of 1.6216 should confirm short term topping, after rejection by 1.6389/6434 cluster resistance zone. Intraday bias will be back on the downside in this case, to 1.6033 support and possibly below.
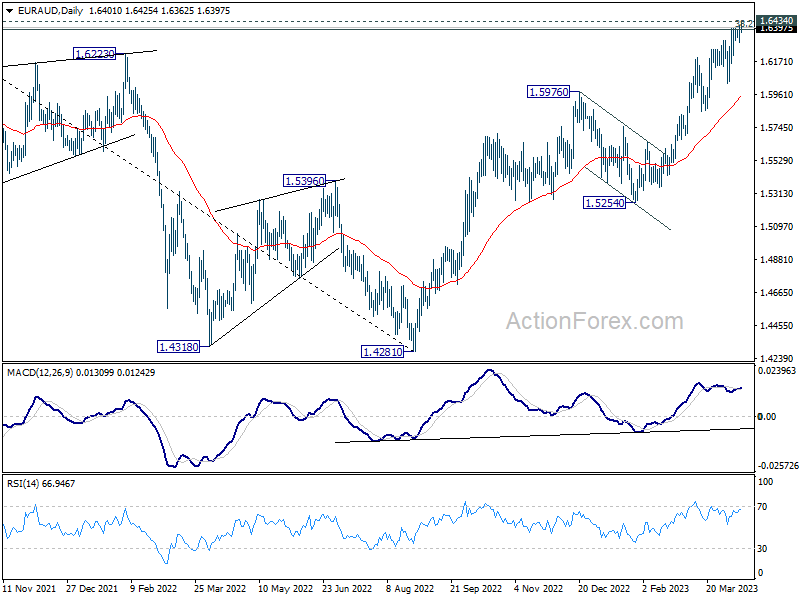
In the bigger picture, focus stays on 1.6389/6434 cluster resistance (38.2% retracement of 1.9799 to 1.4281 at 1.6389). Sustained break there should confirm that whole down trend from 1.9799 (2020 high) has completed. Further rally should then be seen to 61.8% retracement at 1.7691. However, rejection by this cluster resistance will make medium term outlook neutral at best.
EUR/CHF Daily Outlook
Daily Pivots: (S1) 0.9861; (P) 0.9875; (R1) 0.9891; More...
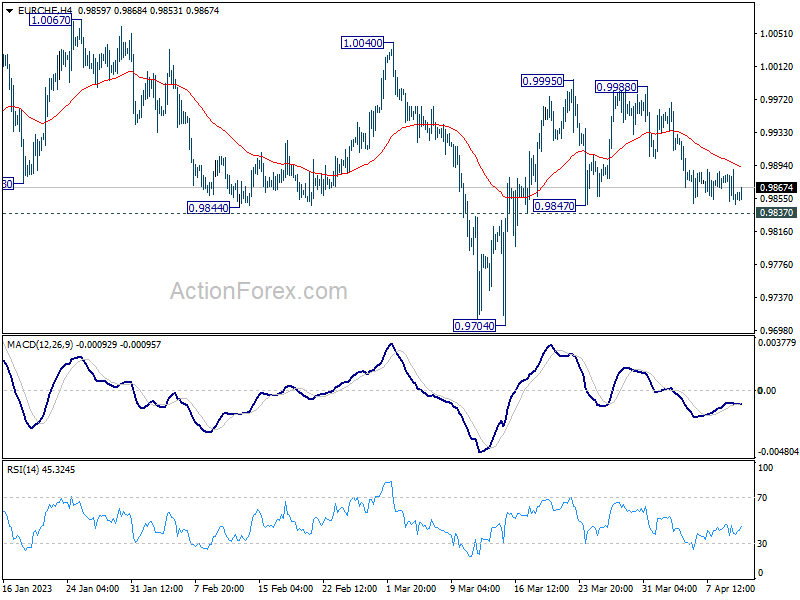
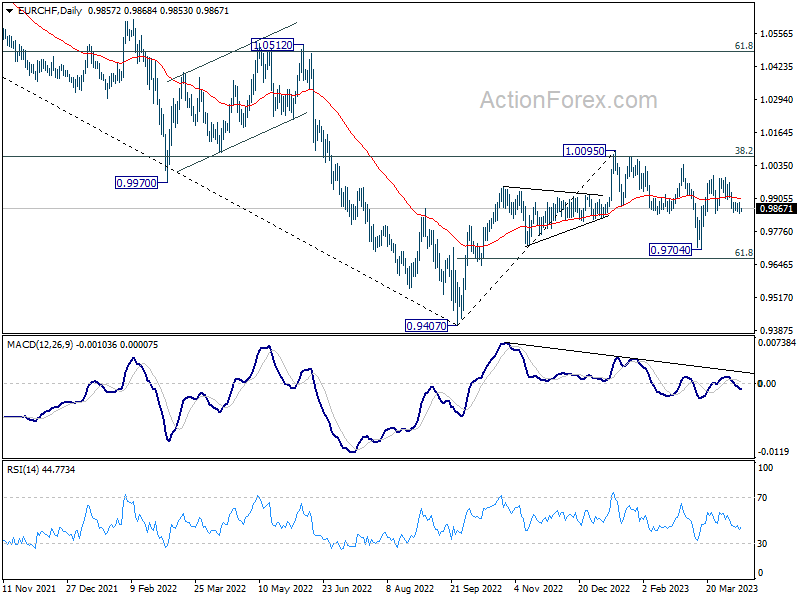
Range trading continues in EUR/CHF and intraday bias remains neutral for the moment. With 0.9837 support intact, rise from 0.9704 is still in favor to resume later. Break of 0.9995 will target a retest on 1.0067 high. However, firm break of 0.9837 will indicate that the rebound has completed, and turn bias back to the downside for retesting 0.9704 low.
In the bigger picture, prior rejection by 55 week EMA (now at 1.1002) and 38.2% retracement of 1.1149 to 0.9407 at 1.0072 suggests that medium term outlook is staying bearish. That is, down trend from 1.2004 is not completed yet and is in favor to resume through 0.9407 at a later stage. However, decisive break of 1.0095 resistance will raise the chance of bullish trend reversal. Rise from 0.9407 should then target 1.0505 cluster resistance (2020 low at 1.0505, 61.8% retracement of 1.1149 to 0.9407 at 1.1484).
GBP/USD Starts Fresh Increase While EUR/GBP Eyes Upside Break
GBP/USD started a fresh increase above the 1.2400 resistance zone. EUR/GBP is struggling and facing resistance near 0.8790.
Important Takeaways for GBP/USD and EUR/GBP
- The British Pound started a fresh increase above the 1.2400 barrier against the US Dollar.
- There was a break above a key bearish trendline with resistance near 1.2410 on the hourly chart of GBP/USD.
- EUR/GBP is struggling to break the 0.8790 resistance zone.
- There is a major bullish trendline forming with support near 0.8770 on the EUR/GBP hourly chart.
GBP/USD Technical Analysis
This past week, the British Pound saw a downside correction below the 1.2400 support against the US Dollar. The GBP/USD pair tested the 1.2345 zone before the bulls took a stand.
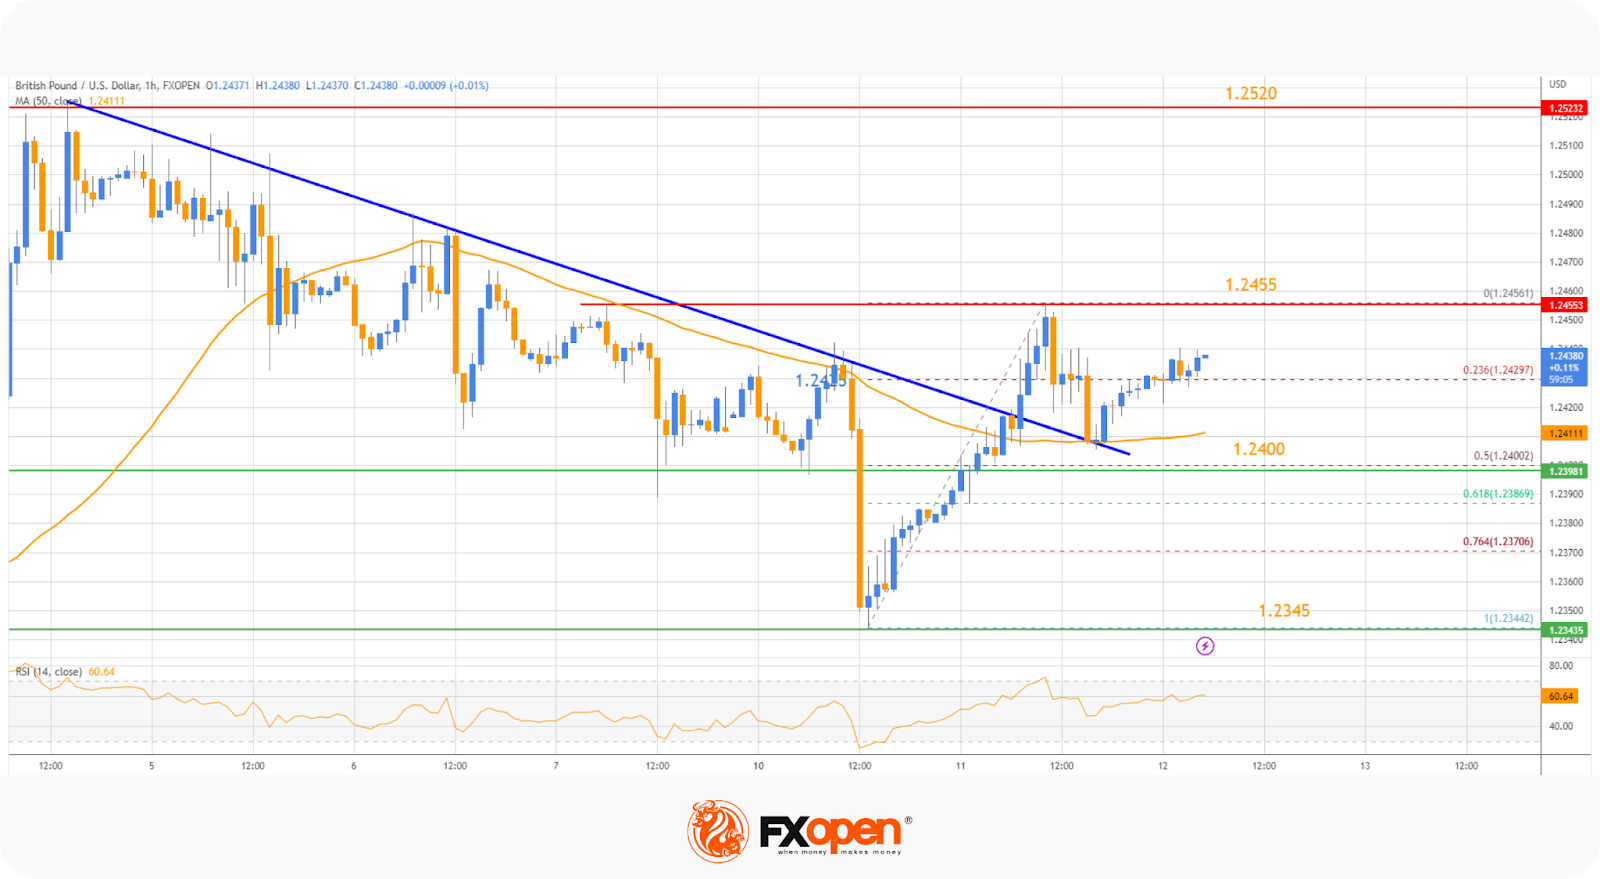
On the hourly chart at FXOpen, a low was formed near 1.2344, and the pair started a fresh increase. There was a clear move above the 1.2400 resistance zone. More importantly, there was a break above a key bearish trendline with resistance near 1.2410.
The pair traded at 1.2456 and settled above the 50-hour simple moving average. There was a minor downside correction below the 23.6% Fib retracement level of the upward move from the 1.2027 swing low to the 1.2205 high.
However, the pair remained well-bid above the 50% Fib retracement level at 1.2400.
If there is a downside break below the 1.2400 support, there is a risk of a sharp decline. In the stated case, GBP/USD may revisit the 1.2355 support. Any more losses could lead the pair toward 1.2300.
On the upside, resistance is near the 1.2355 level, above which the pair might resume its increase (considering the RSI is above 50). The next major resistance is near the 1.2520 level. A clear move above 1.2520 could trigger a rally toward 1.2600.
EUR/GBP Technical Analysis
On the hourly chart at FXOpen, the Euro traded in a small range below the 0.8790 resistance zone against the British Pound. The EUR/GBP pair made a couple of attempts to break the 0.8790 resistance but failed.
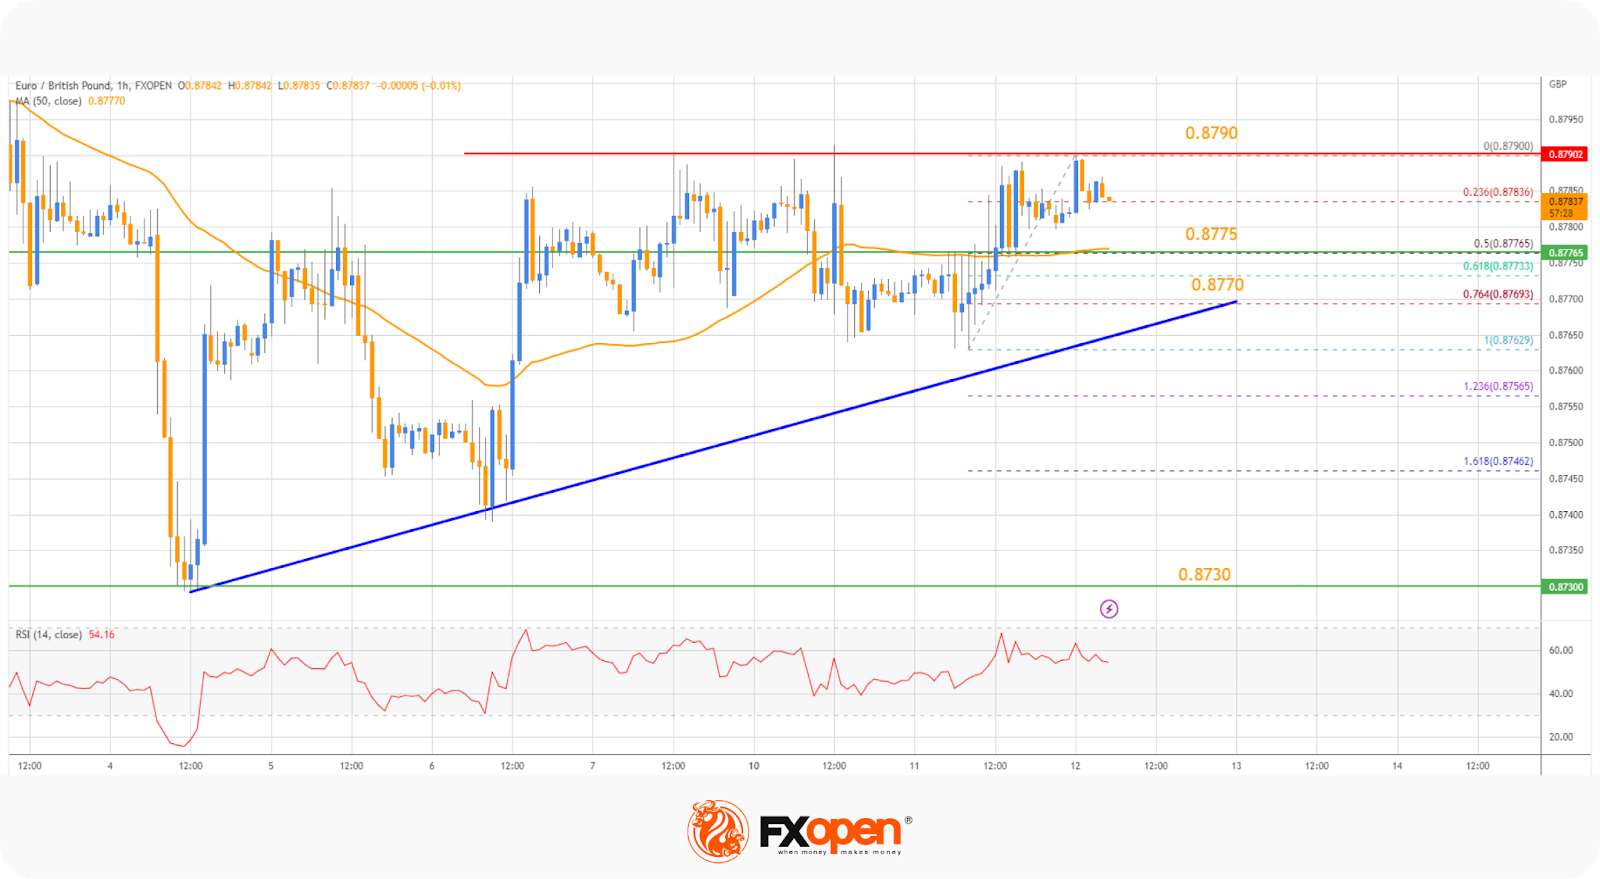
The recent high was formed near 0.8790, and the pair is now consolidating. If there is a bearish reaction and RSI falls below 50, the pair might find bids near the 50-hour simple moving average at 0.8755. The stated support coincides with the 50% Fib retracement level of the upward move from the 0.8762 swing low to the 0.8790 high.
The next major support is near a bullish trendline at 0.8770. A downside break below it may lead to more downward moves. In the stated case, the pair could decline toward the 0.8730 support level in the near term.
Conversely, the bulls could break above the 0.8790 resistance. The next major barrier for the bulls is near 0.8825, above which EUR/GBP could accelerate higher. In the stated case, the bulls may perhaps aim for a test of 0.8880. Any more gains might send the pair toward the 0.8900 level.
Mixed Trade as Focus Turns to US CPI and Fed Minutes
Most Asian stocks struggled for direction on Wednesday as investors turned cautious ahead of key U.S inflation data that may impact the Fed’s monetary policy path. European and US equity futures are both pointing to a mixed open in what feels like the calm before a potential storm. In the currency space, the dollar edged lower this morning weakening against almost every single G10 currency excluding the Japanese yen. Gold prices jumped over 0.7% during early trade while oil prices were mostly steady, holding near their highest close since January.
It is safe to say that markets are waiting for the pending US inflation data before making the next big move. Minutes from the Federal Reserve’s March policy meeting are also due to be released this evening, which could offer further clarity about the Fed’s 25-basis point hike after the collapse of Silicon Valley Bank and general banking fears that rattled financial markets.
Spotlight on US CPI data
Today’s big event and potential market shaker will be the latest US inflation data. US headline CPI is forecast to slow to 5.2% in March compared to the 6% witnessed in February with the key core monthly reading expected to cool modestly but remain elevated. Traders are currently pricing in a 70% probability of a 25-basis point rate hike in May, according to Fed funds futures with today’s inflation data expected to reinforce these bets. Ultimately further evidence of US inflation slowing could fuel the disinflation story that Fed Chair Jerome Powell has talked about recently, sending the dollar lower. Alternatively, stubborn core figures may dampen expectations around the Fed pausing its policy tightening anytime soon, which could offer support to dollar bulls.
A few hours after the US inflation data, the focus will shift to the FOMC minutes. Investors will closely scrutinise the language and whether any fresh clues are offered on future Fed rate moves. If the minutes strike a dovish tone similar to the March meeting decision, this could reinforce market expectations around the Fed's hiking cycle nearing an end.
Regarding the technical picture, the Dollar Index (DXY) remains in a downtrend on the daily chart. There have been consistent lower lows and lowers highs while the MACD trades below zero. A strong move back below 102.00 could encourage a decline towards this month’s low. Should prices stay above 102.00, this may signal a move back towards 102.80 and 103.30, respectively.
Bank of Canada to keep rates steady
The Bank of Canada (BoC) is expected to keep interest rates unchanged at 4.5% for a second straight meeting. The annual inflation rate in Canada continues to show signs of cooling, falling sharply to 5.2% in February compared to 5.9% in the previous month. However, some economic data has surprised to the upside with the job market still piping hot and wage pressures strong. Much attention will be directed towards the BoC's updated forecasts and Governor Mackem’s word for fresh clues on the central bank's policy path. Looking at the technical picture, USDCAD could be injected with fresh volatility due to the BoC meeting, US CPI, and Fed minutes. Prices are under pressure on the daily chart and may descend towards the 200-day SMA around 1.3395.
Commodity spotlight – Gold
Gold prices extended gains on Wednesday morning, finding comfort above $2000 as caution reigned ahead of the US inflation data. The precious metal continues to draw strength from a weaker dollar despite last Friday’s jobs report boosting expectations for one more Fed rate hike. Despite the positive performance this week, everything could come crashing down for gold if the US inflation figures exceed market expectations. Expect the precious metal to also be influenced by the FOMC minutes which could provide clues on future Fed moves. Talking technicals, prices remain bullish on the daily charts and could be heading toward the $2032 recent high. Beyond this point, the next levels of interest are $2070 and the all-time high at $2075.47. Should prices slip back under $2000, gold could retest $1950 and $1900, respectively.
USD/CNH: First Part of the Zigzag is Similar to the Leading Diagonal
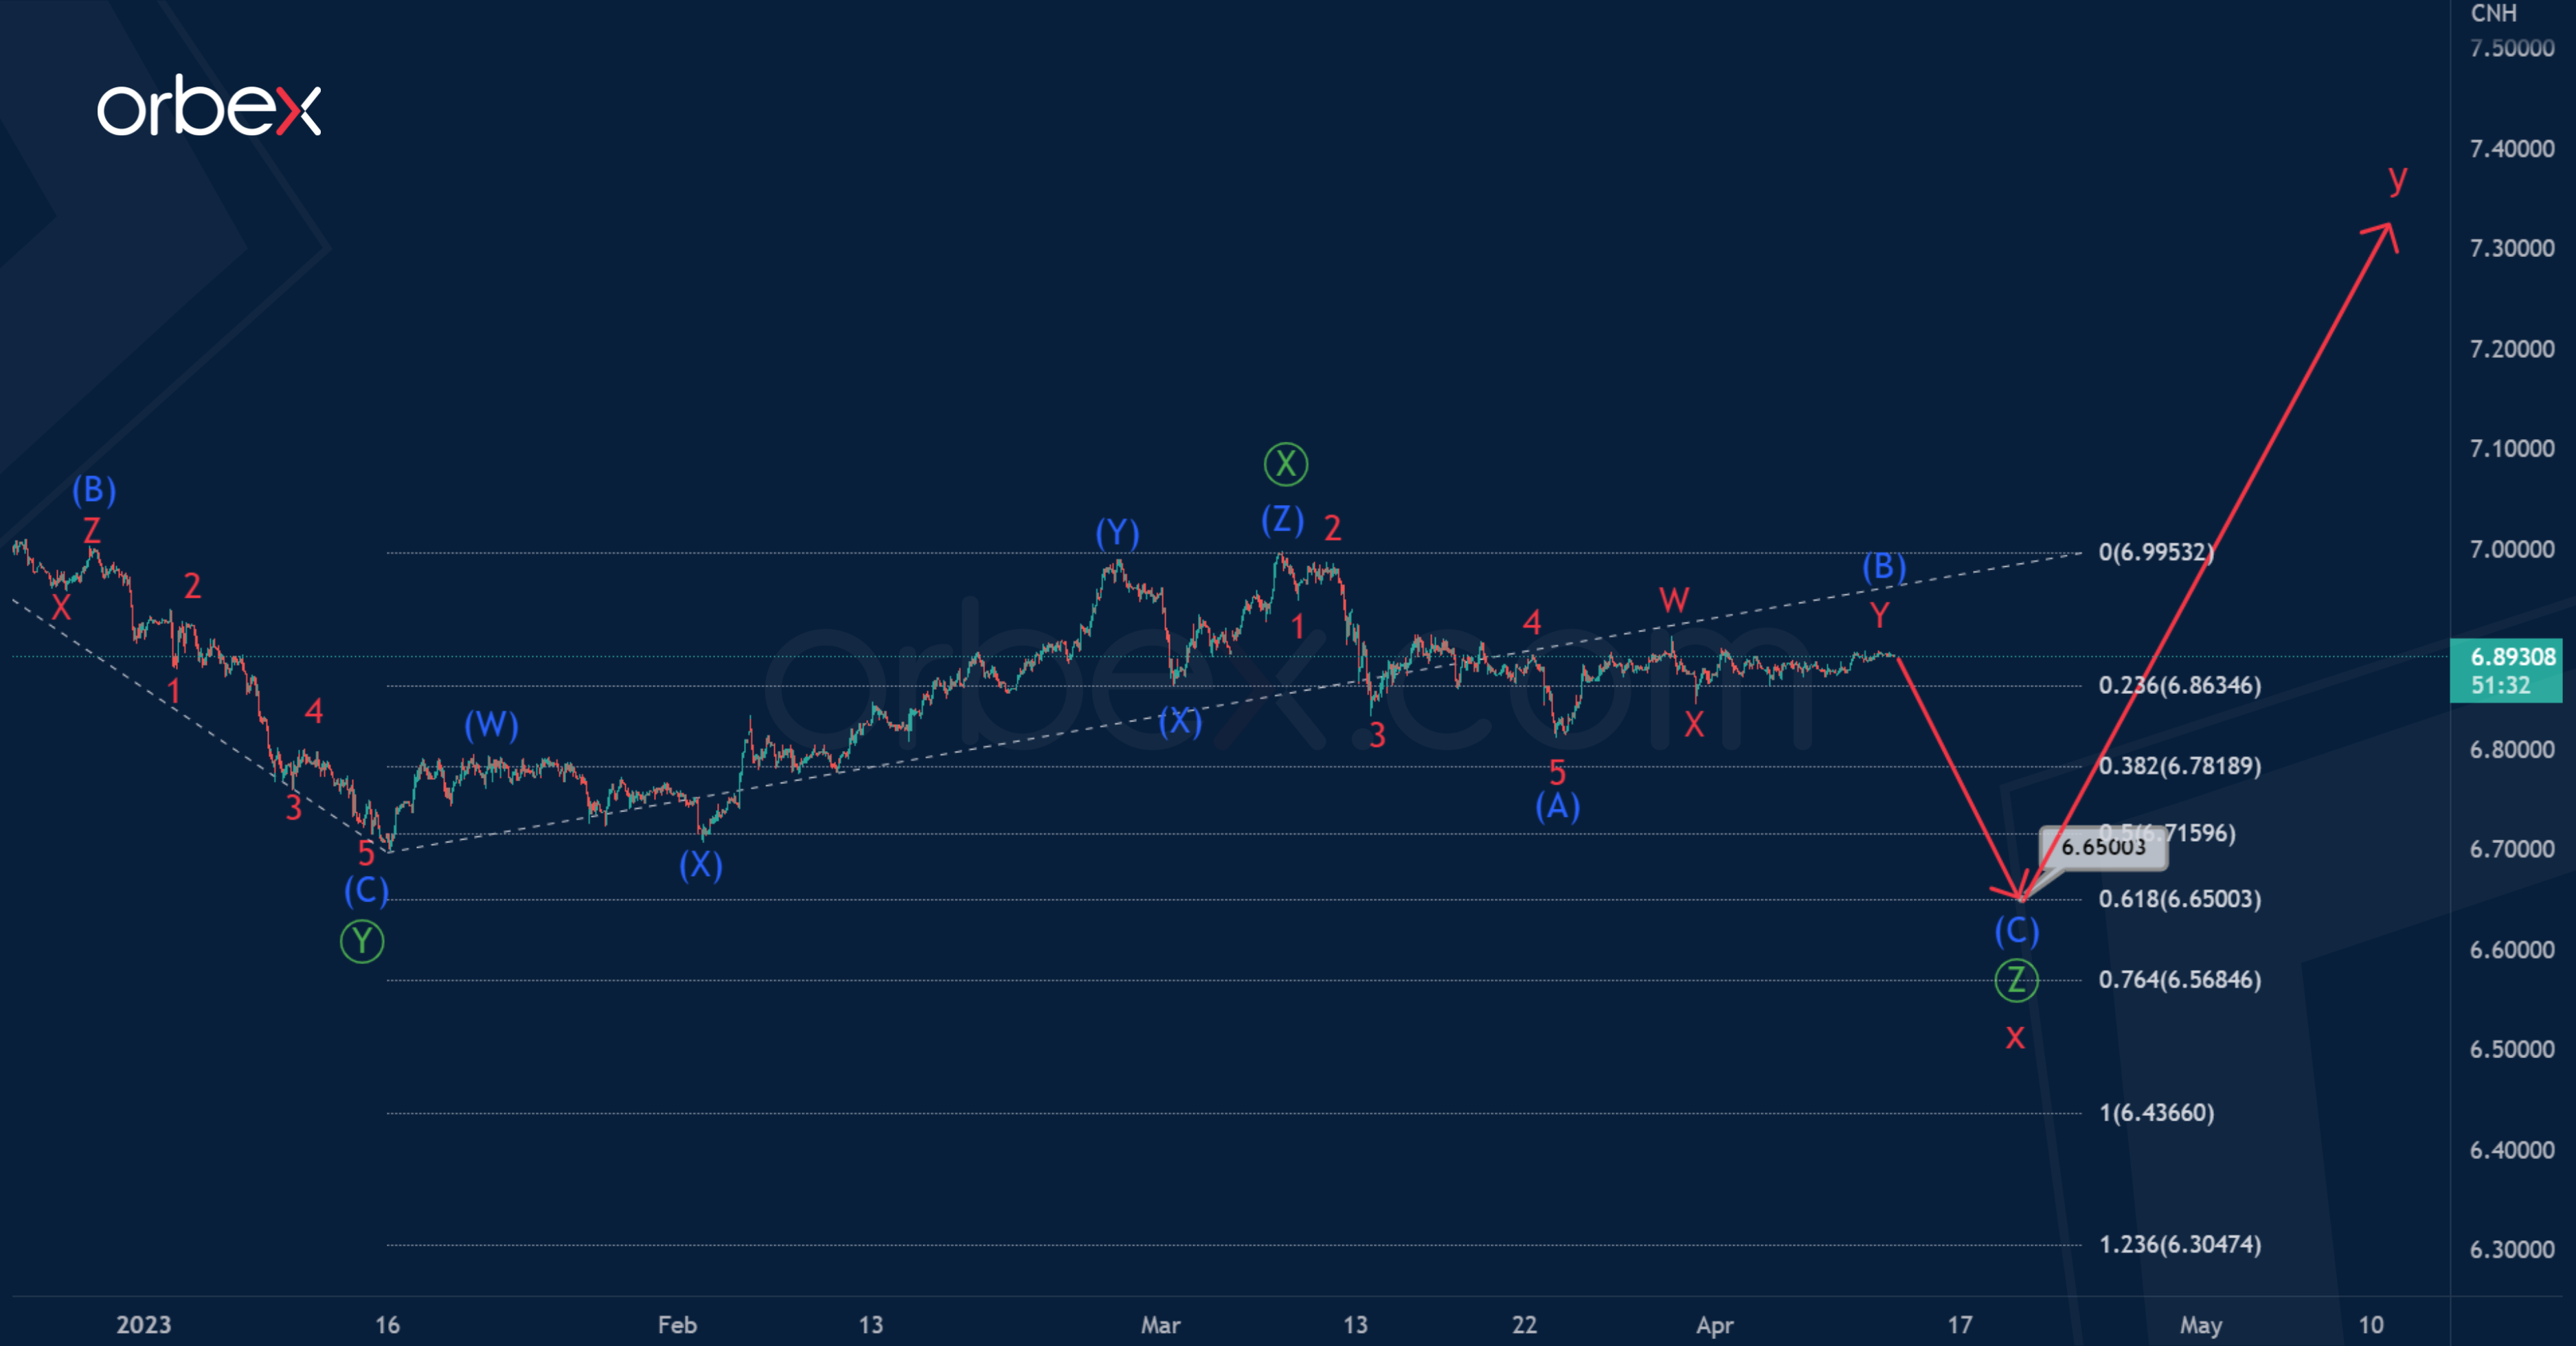
The USDCNH currency can build a double zigzag w-x-y of the cycle degree. On the current chat, we see that the intervening wave x has been completed, which has the form of a double zigzag of the primary degree.
It is assumed that the initial part of the actionary wave Y is being constructed on the last section of the chart. Perhaps it will take the form of a standard zigzag.
Now the first wave is being formed, most likely, it takes the form of a leading diagonal.
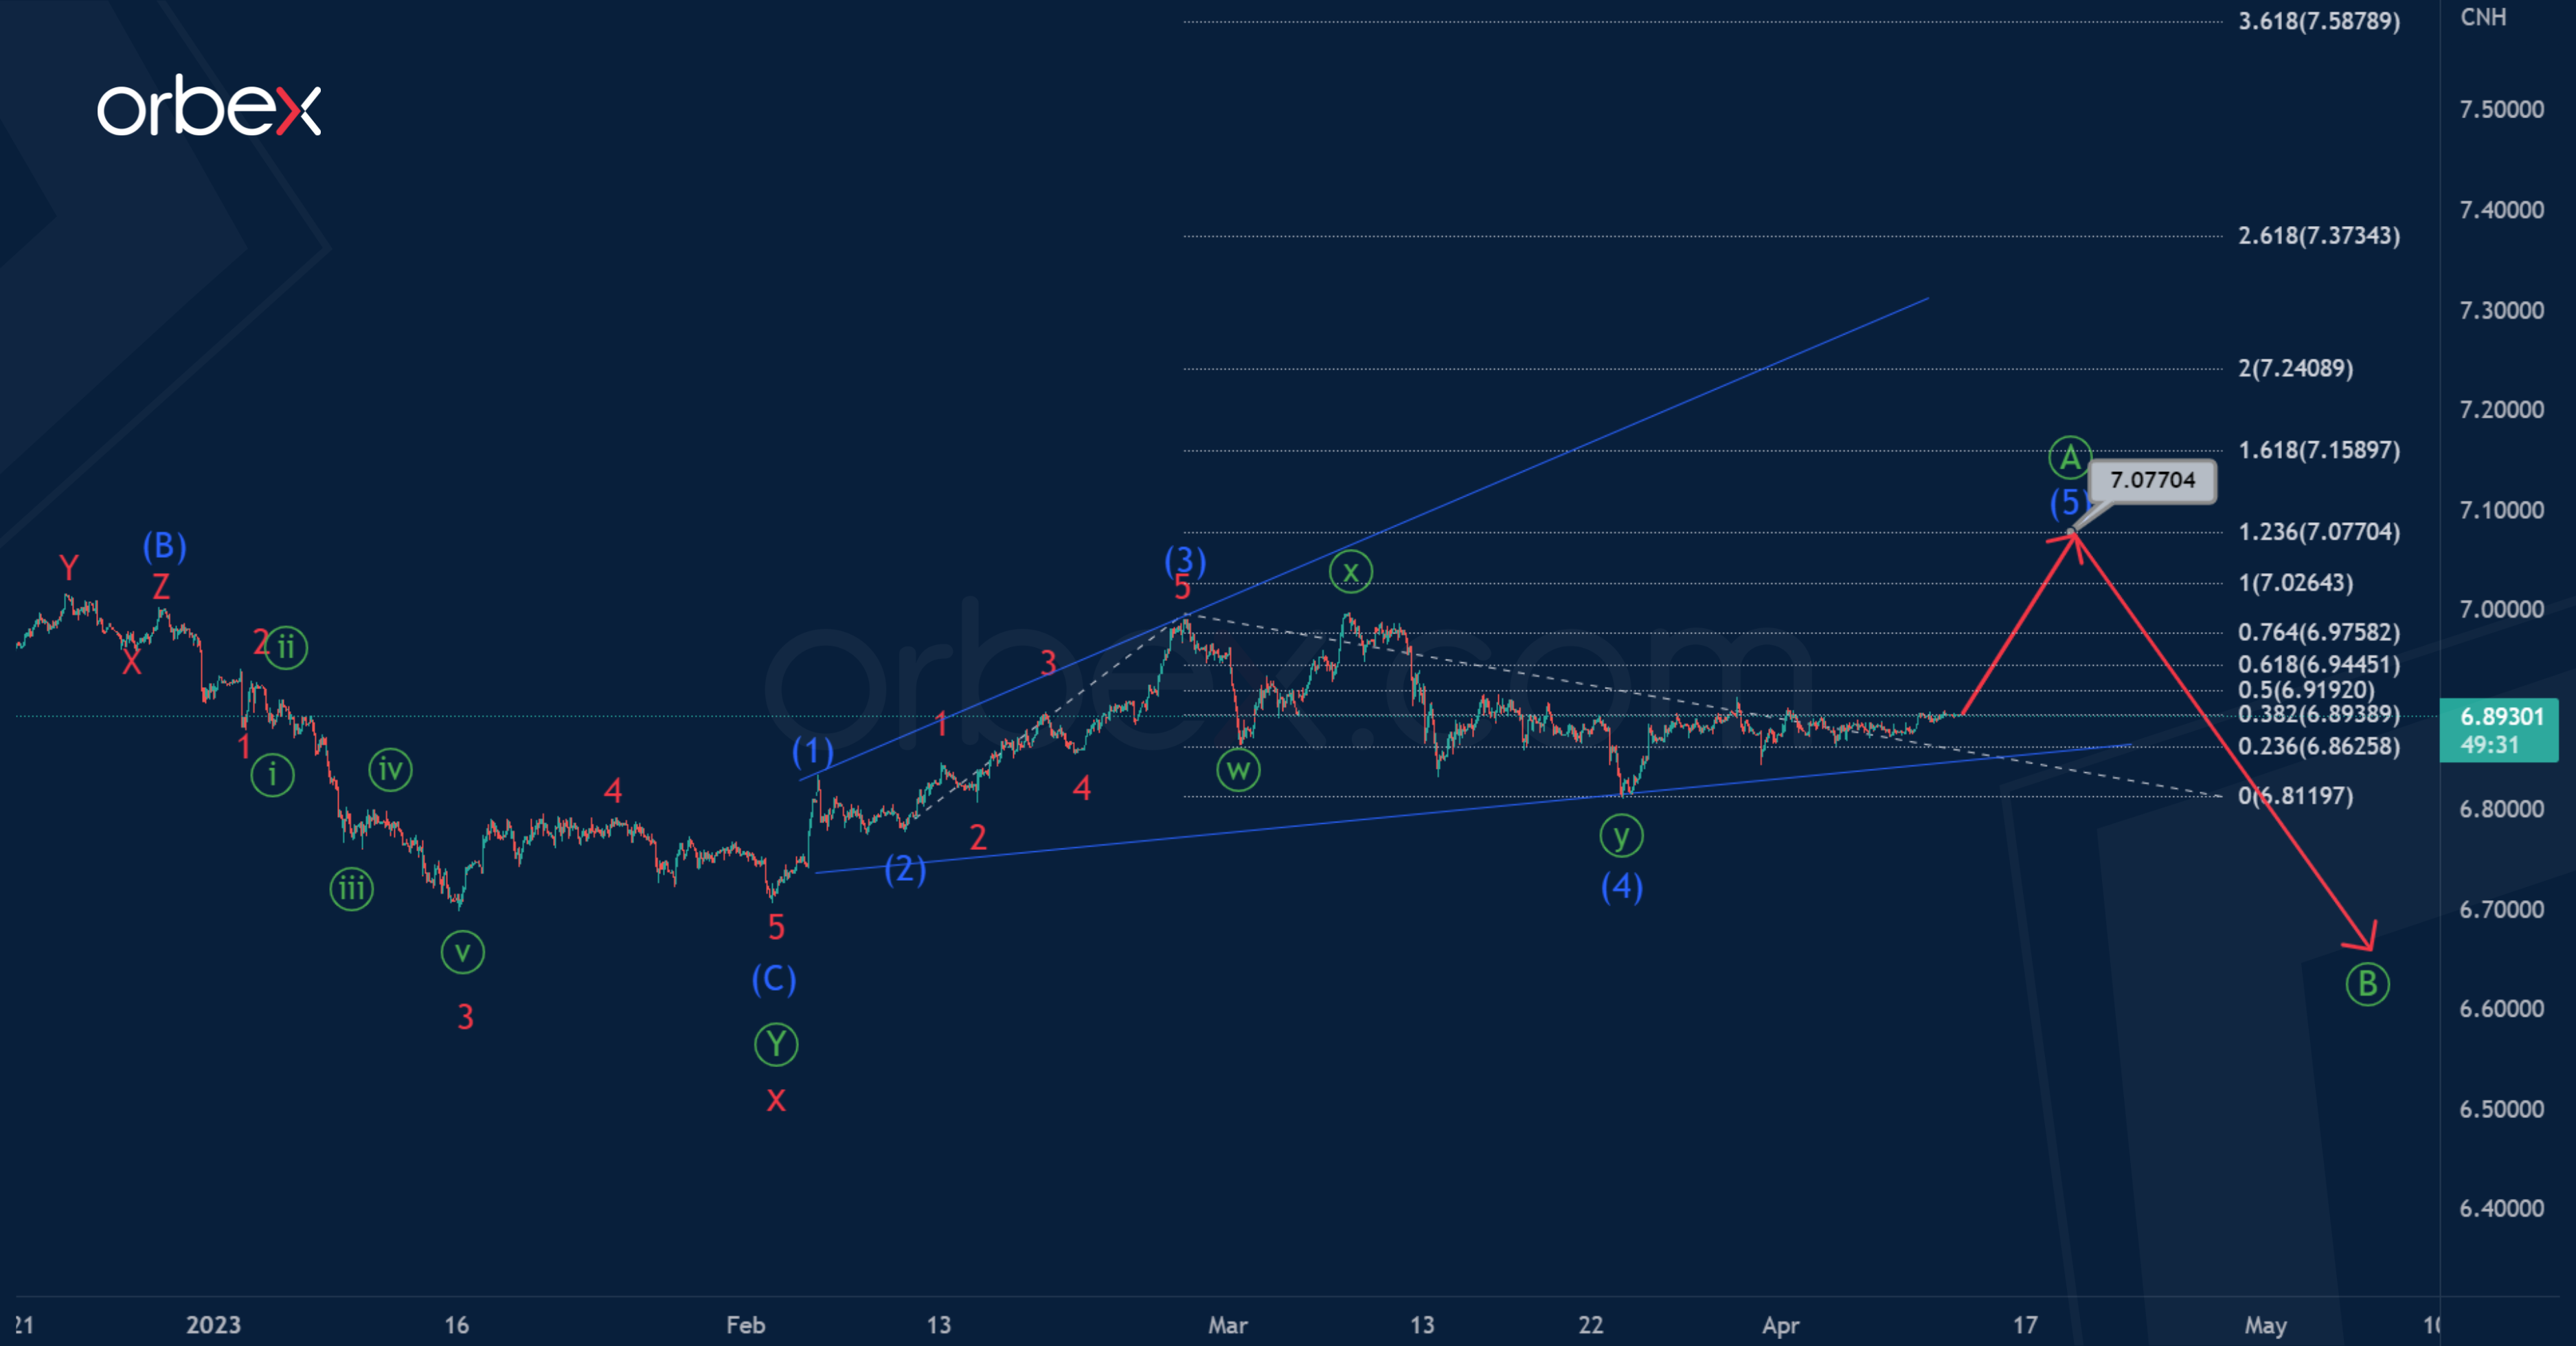
The price in the last intermediate wave (5) may rise to 7.077. At that level, wave (5) will be at 123.6% of impulse (3). Let's consider an option in which the construction of the cycle intervening wave x will continue. It may take the form of a triple zigzag.
In this case, the primary intervening wave, which has the form of an intermediate triple zigzag (W)-(X)-(Y)-(X)-(Z), could end. At the time of writing, the price is in the actionary wave.
It is possible that will take the form of a standard zigzag, as shown in the chart. Its end is expected near 6.650. At that level, it will be at 76.4% of wave.
USD Awaits Catalyst
EUR/USD bounces back
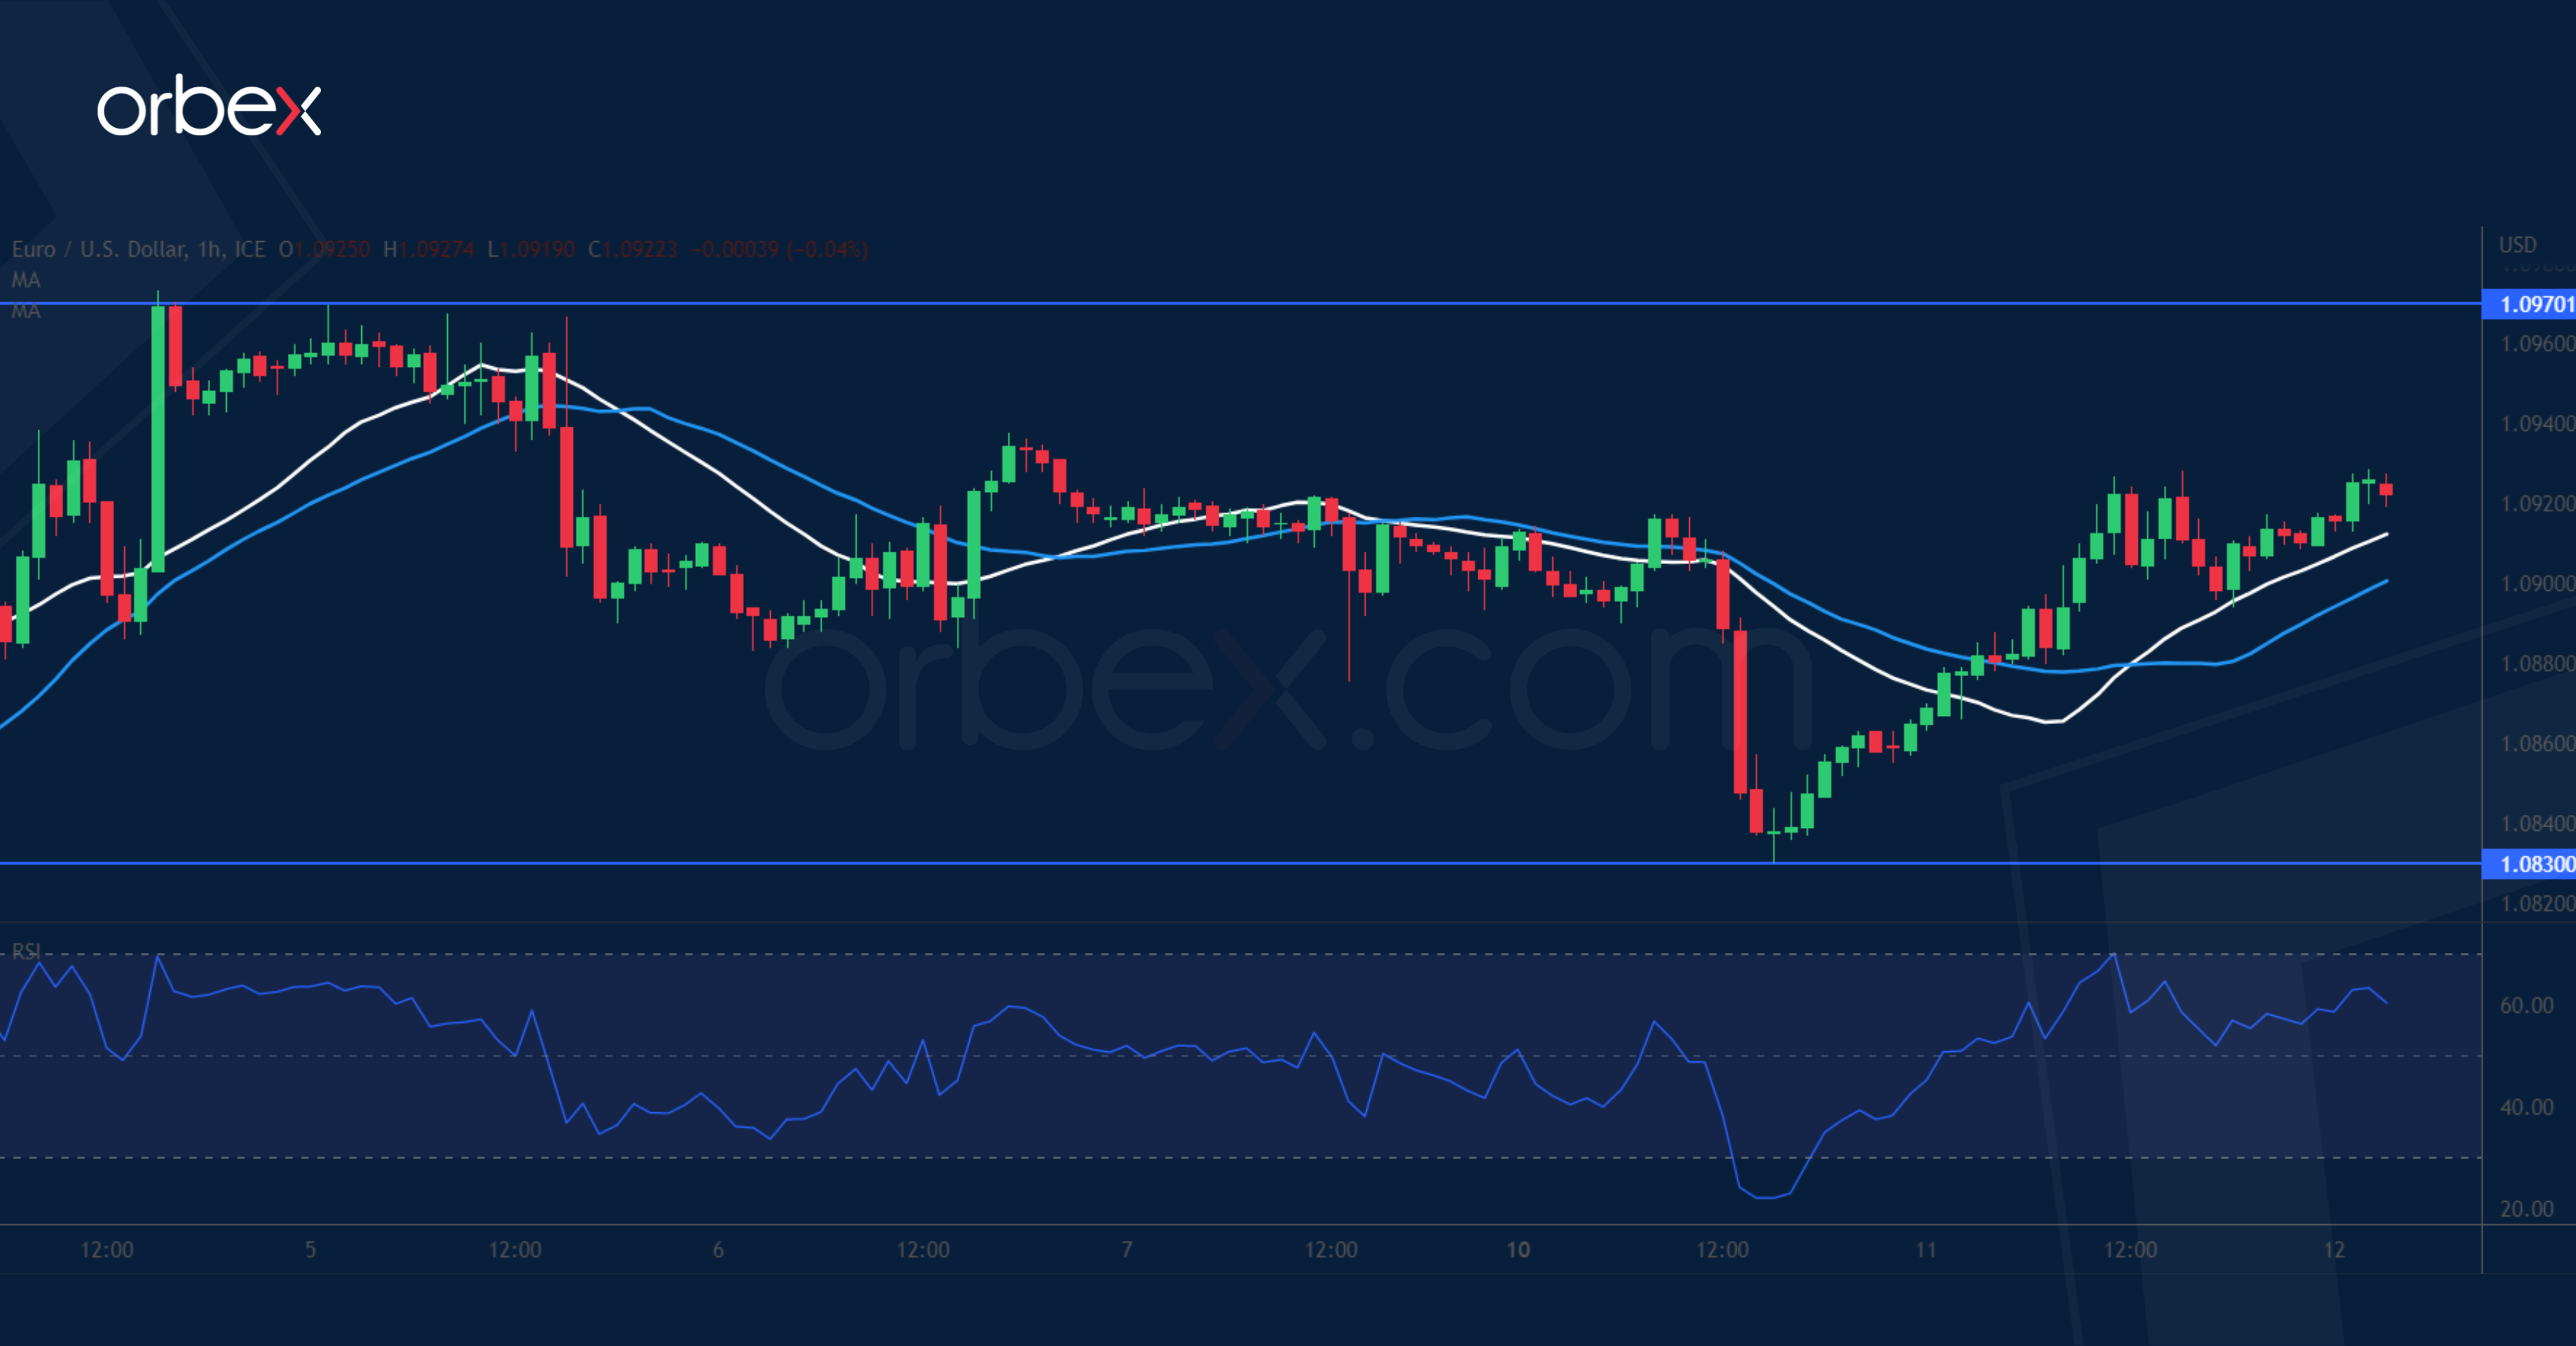
The euro inched higher as retail sales across the bloc beat expectations in March. After bouncing off the daily swing low of 1.0540 the single currency is striving to resume its uptrend from last November. The latest pullback has found bids over the 20-day SMA (1.0830) and a break above the immediate resistance at 1.0920 suggests that buyers are still committed to the game. A close above 1.0970 would expose this year’s peak at 1.1030, potentially giving the bulls a decisive edge. 1.0750 on the 30-day SMA is a major floor.
NZD/USD struggles to hold
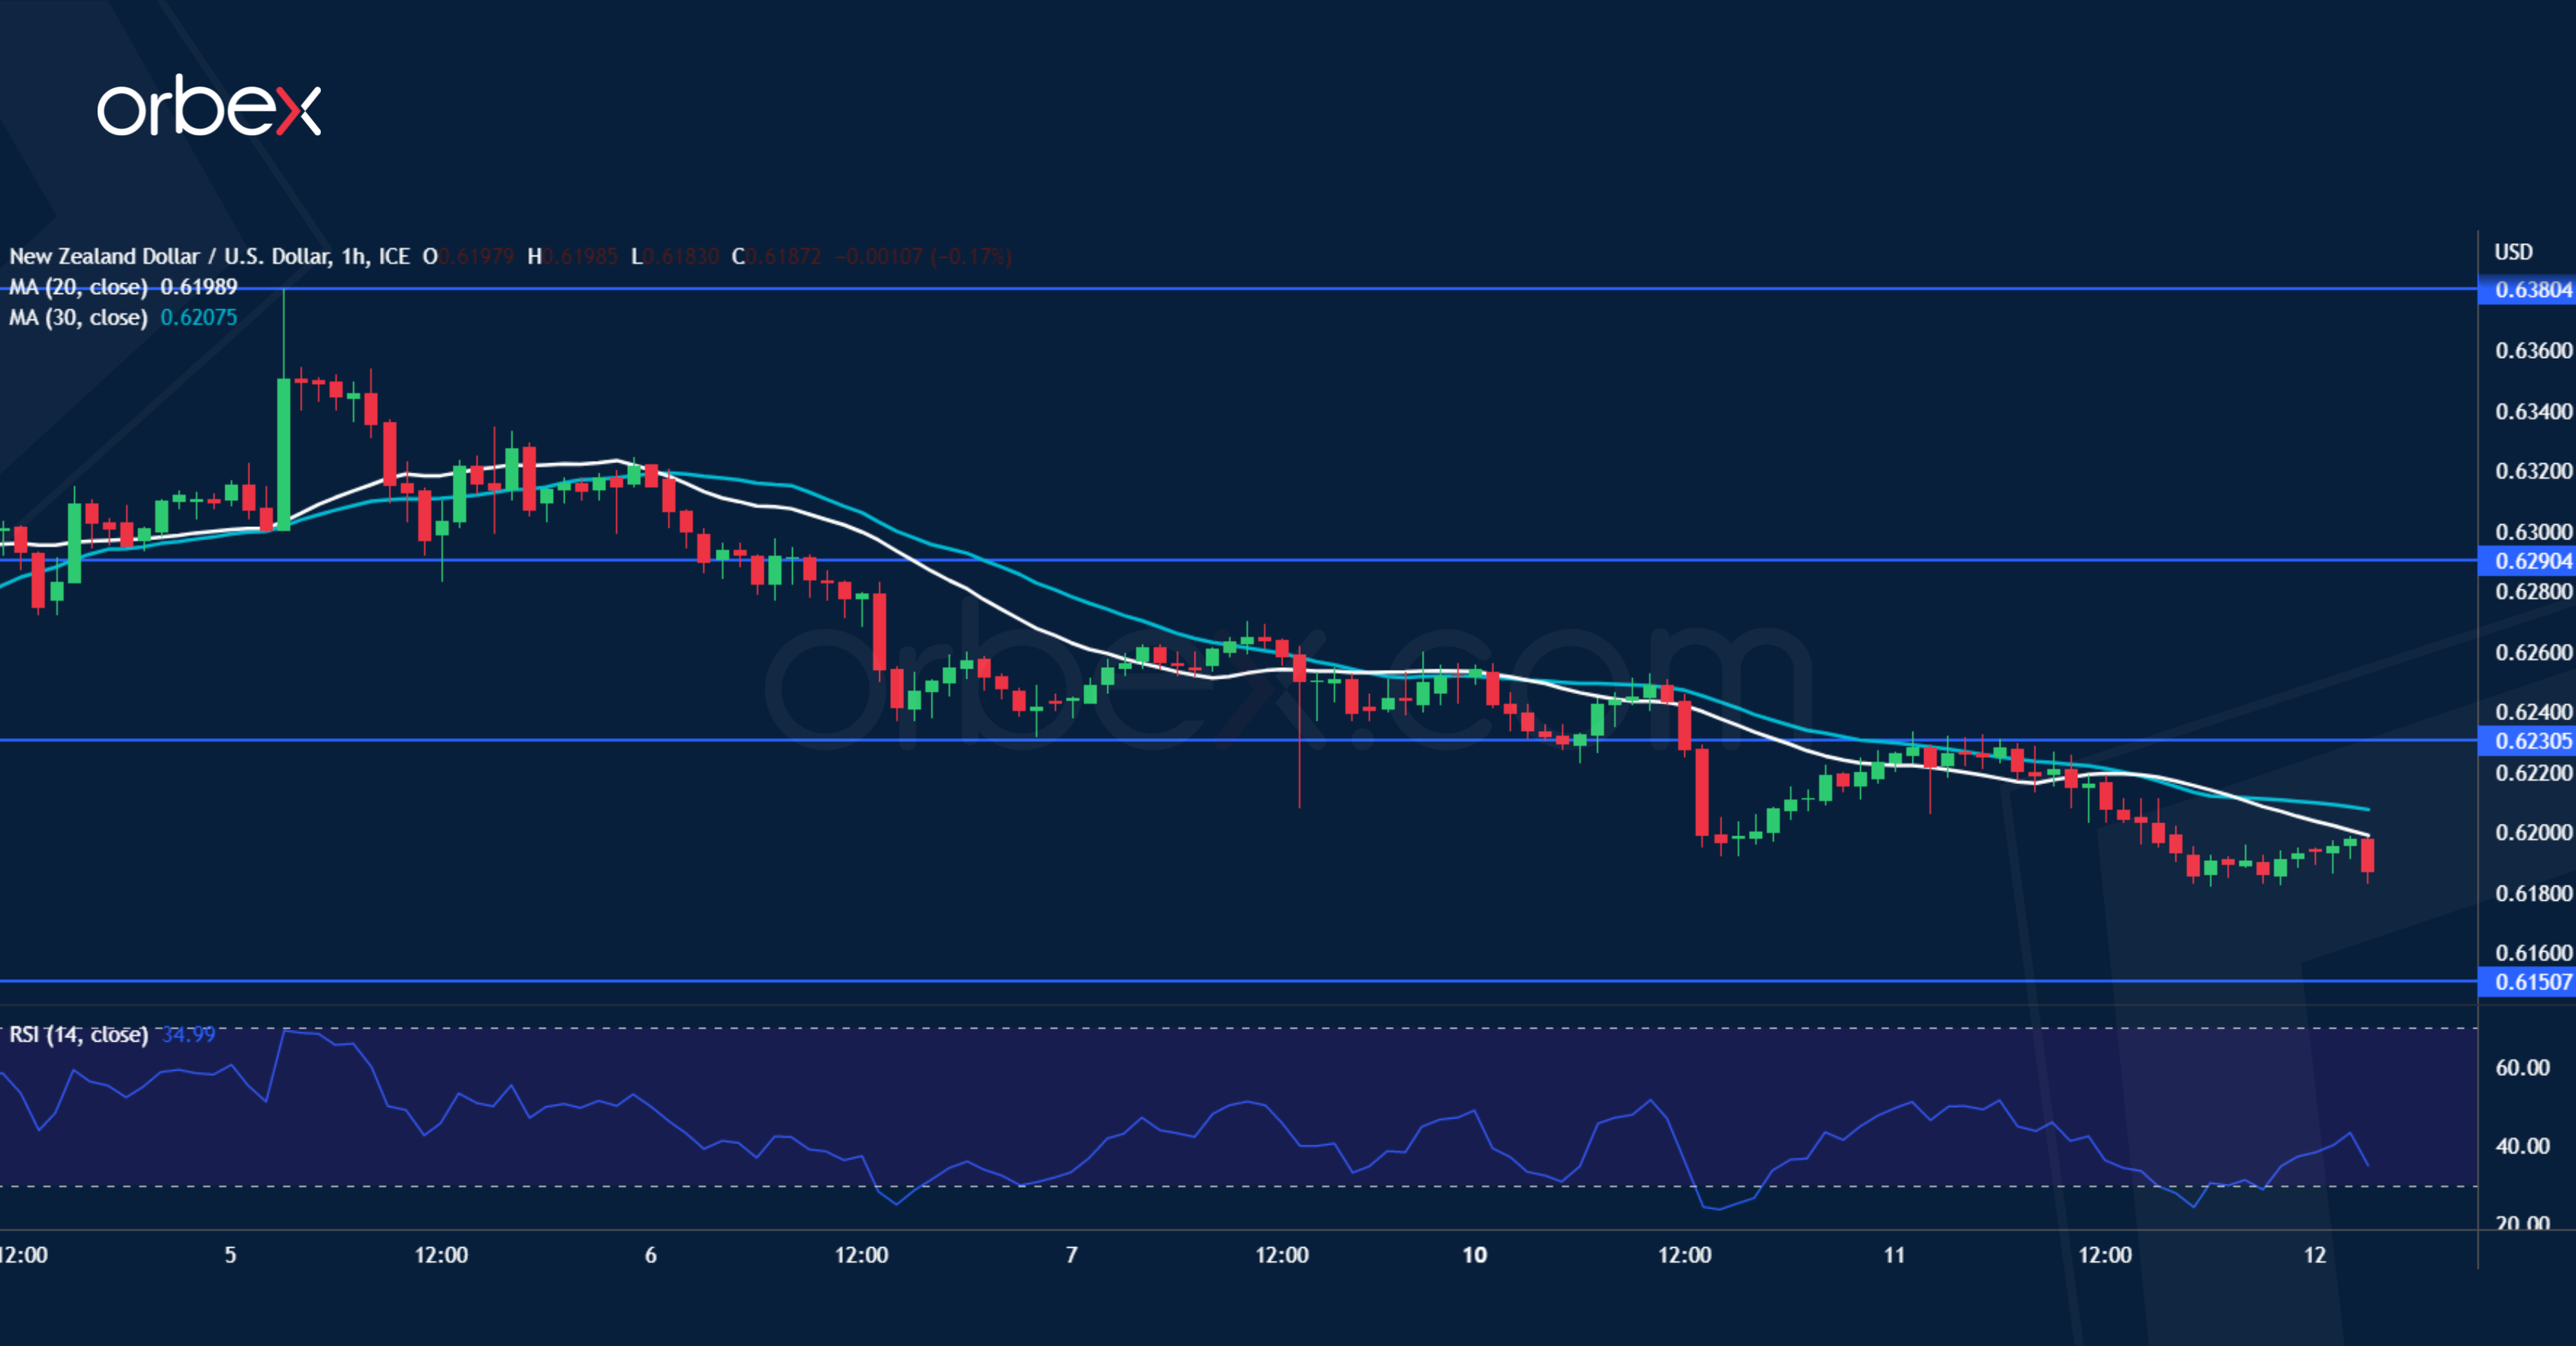
The US dollar claws back losses as traders wait to see whether inflation has been brought down. 0.6380 has once again proved to be a tough level to crack after the first two bullish attempts back in February. A drop below the twice-tested support at 0.6210 has prompted more buyers to bail out. 0.6230 is the first hurdle and a break above 0.6290 would turn sentiment around. Failing that, 0.6150 is the critical level to keep the pair afloat as its breach would make the kiwi vulnerable to a bearish reversal in the weeks to come.
US 30 holds high ground
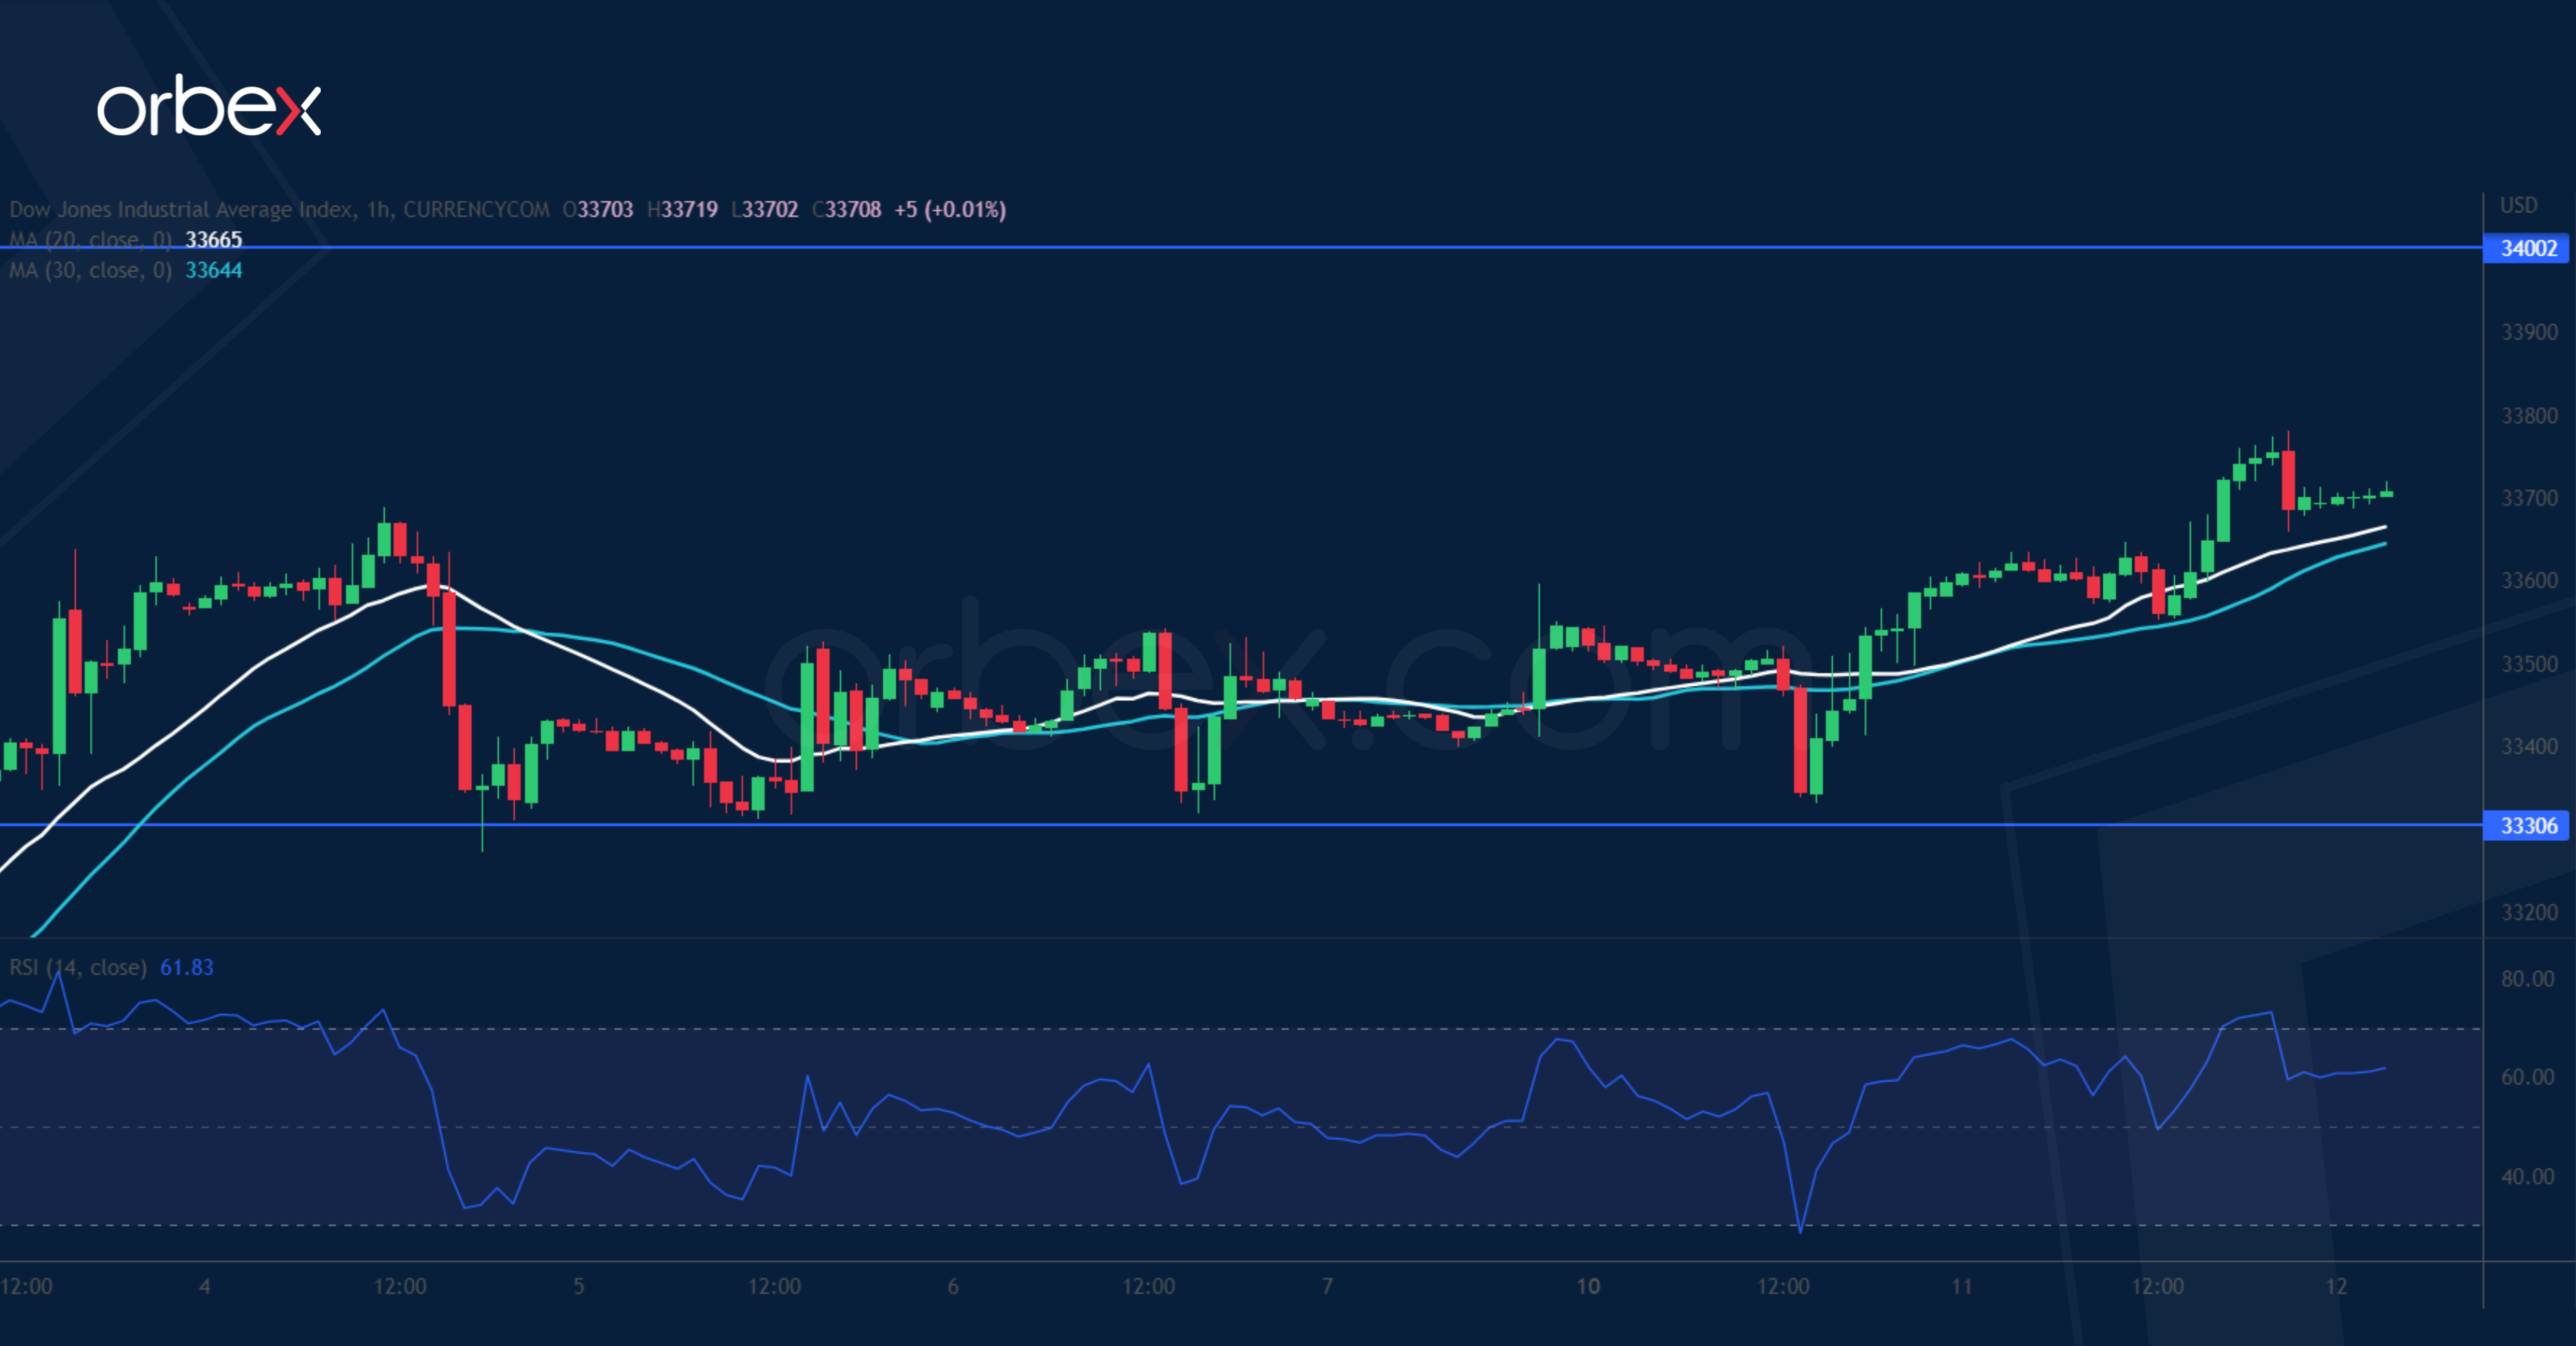
The Dow Jones 30 rallied after Chicago Fed President Goolsbee warned about raising rates too aggressively. On the daily chart, a close above the March high of 33500 and a bullish MA cross are signs that the market’s optimism has taken hold. A brief consolidation above 33300 has allowed the bulls to hold on to their gains and a close above 33680 may extend the rally to the psychological level of 34000, a step closer towards this year’s peak at 34400. 32900 would be the bulls’ second line of defence in case of a correction.
Barring a Downside Surprise, Today’s CPI in Any Case Should Support Yields
Markets
Several Fed and ECB speakers hit the wires yesterday and provided some distraction during an otherwise news calm trading session. There’s a divide growing among Fed officials to hike rates further or not. The likes of Chicago Fed president Goolsbee call for “prudence and patience” and first want more data to assess the impact of potentially tighter credit conditions following the collapse of several regional US banks. That’s clearly the minority view though. NY Fed Williams said one more hike as suggested by the dot plot is a “reasonable starting place” but that the actual path depends on incoming data. Kashkari from the Minneapolis Fed sees hopeful signs that calm has returned and said that the central bank has more work to do. Bullard (St Louis), Harker (Philadelphia) and Mester (Cleveland) struck a similar tone and added that rates would have to stay at their peak for some time. ECB’s Villeroy is worried about inflation becoming even more widespread and potentially more persistent. He referred to underlying inflation rising steadily even as headline inflation has topped off. This requires raising rates further, though possibly not as aggressive as before, and in any case keeping them at a high enough level for a sustained period. Core bonds lost ground with German Bunds hugely underperforming USTs yesterday. In a catch-up move with the US after being closed on Friday and Monday, German rates rallied 10.7-15.2 bps with the front underperforming. American yields only added 1.3 bps at the front but that’s hiding an intraday recovery move that went as far as 12 bps. European equity sentiment was especially good. The Euro Stoxx 50 closed at the highest level since begin 2022. With the yield and sentiment advantage, EUR/USD rose to 1.091. That combo is also what weighed the yen down. EUR/JPY extended gains beyond 145 to finish at 145.89. USD/JPY held stable around 133.6. EUR/GBP again used support from the upward sloping trend line to close somewhat higher at 0.8783.
Asian markets show no clear direction going into today’s main event: US CPI. Headline inflation in March is expected to ease from 6% to 5.1% but core inflation could increase from 5.5% to 5.6% on a strong 0.4% m/m pace. An in-line or higher-than-expected outcome should further strengthen the case for a May rate hike by the Fed. Markets currently attach a 75% probability to such a scenario. We doubt it will change their thinking about rate cuts later on though. Current market pricing shows the cutting cycle to begin in September. It will take more strong data points for that to be priced out. Barring a downside surprise, today’s CPI in any case should support yields, especially at the front end of the curve. The $32bn 10y auction tonight might be interesting for the long(er) end. First resistance in the 10y yield is located at 3.50%, followed by 3.64%. UST underperformance vs Bunds may give the dollar some much-needed breathing space. This morning’s move included, the small USD uptick vs the euro over the past few days gets wiped out already. Support for the dollar kicks in at EUR/USD 1.0973/1.1033. USD resistance levels are located around the 1.08 big figure, followed by 1.0735.
News Headlines
Climate think thank Ember published its fourth annual global electricity review. Wind and solar reached a record 12% of global electricity in 2022. We might as well have seen the peak of fossil fuel electricity generation last year which was unexpectedly boosted by the rush for energy security in the wake of the Russian invasion in Ukraine. Wind and solar are set to expand enough that total electricity production from fossil fuels will decline slightly and continue downward through at least 2026, according to the Ember forecasts. The share of fossil fuel electricity generation is set to decline from currently around 60% to slightly over 50% by 2026. The International Energy Agency earlier said that renewable power sources in 2022 helped to meet the vast majority of additional power needs.
Italian PM Meloni yesterday evening unveiled the 2023 budget which included slightly more tax cuts (€3bn) than expected. The budget deficit is set to reach 4.5% of GDP with growth predicted at 1% this year (vs 0.6% previously) and 1.5% in 2024 (vs 1.9%). Critical to next year’s outlook will be receiving EU instalments under the EU Recovery Fund which are at risk of delay over discussions on some of the projects, milestones and targets to be reached.
USD/CAD Daily Outlook
Daily Pivots: (S1) 1.3445; (P) 1.3482; (R1) 1.3503; More....
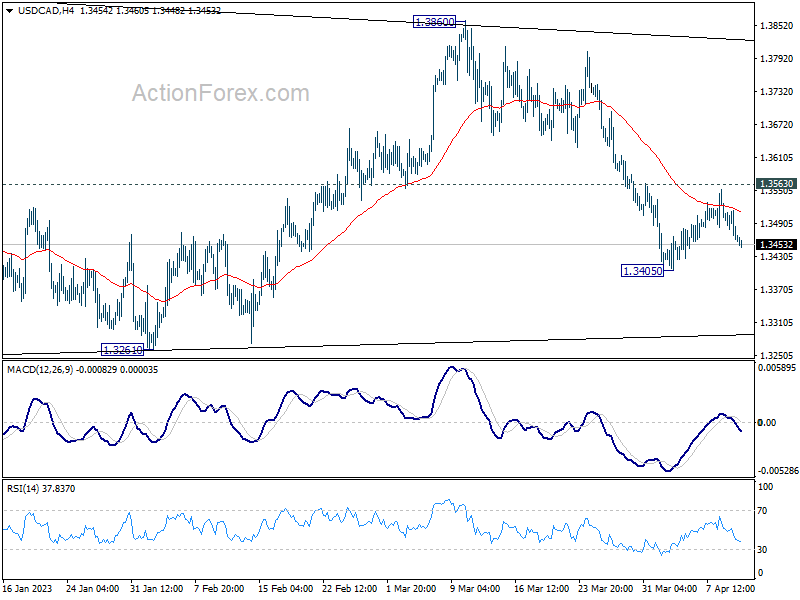
Intraday bias in USD/CAD remains neutral and another fall is in favor with 1.3563 minor resistance intact. On the downside, break of 1.3405 will resume the decline from 1.3860, as the third leg of the corrective pattern from 1.3976, to 1.3224/61 support zone. Strong support should be seen around there to bring rebound. Meanwhile, firm break of 1.3563 will turn bias back to the upside for 1.3860 resistance instead.
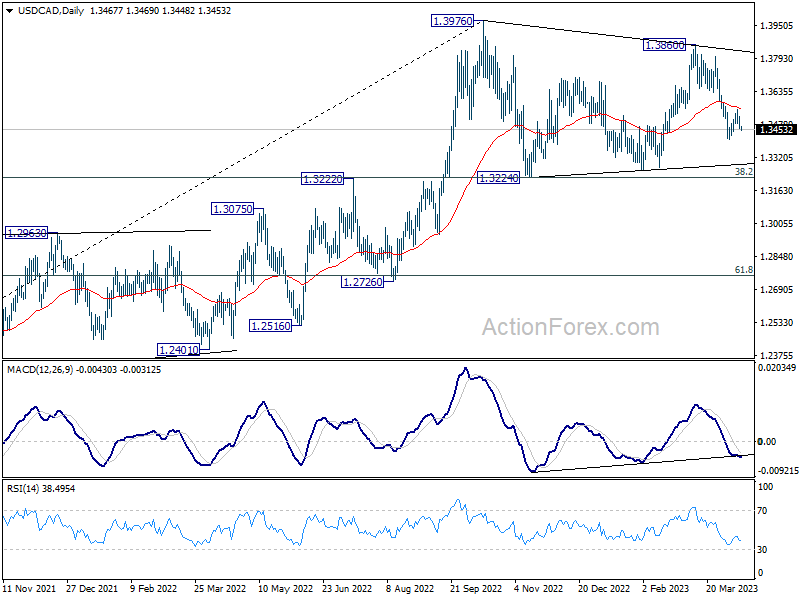
In the bigger picture, the up trend from 1.2005 (2021 low) is still in progress. Break of 1.3976 will confirm resumption and target 61.8% projection of 1.2401 to 1.3976 from 1.3261 at 1.4234. Firm break there will pave the way to long term resistance zone at 1.4667/89 (2016, 2020 highs). On the downside, sustained break of 55 week EMA (now at 1.3282) is needed to confirm medium term topping. Otherwise, outlook will remain bullish even in case of deep pull back.
AUD/USD Daily Report
Daily Pivots: (S1) 0.6631; (P) 0.6656; (R1) 0.6678; More...
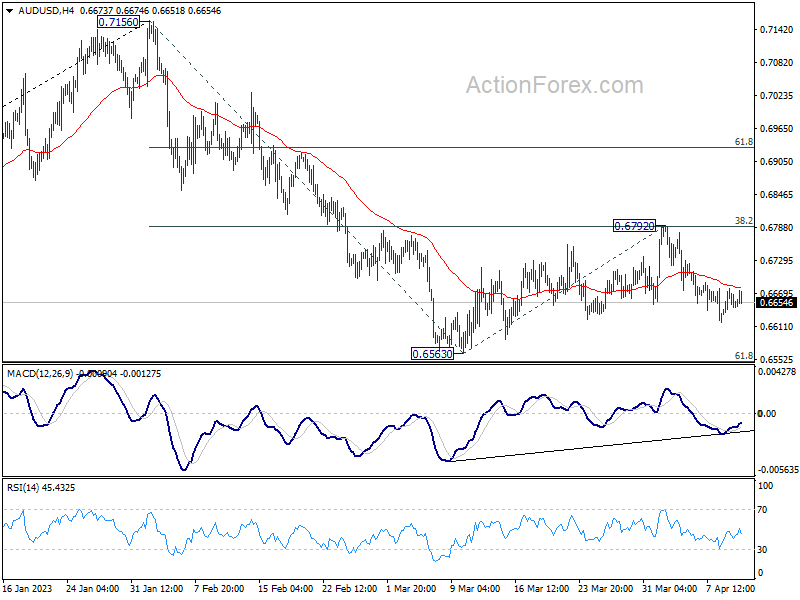
Intraday bias in AUD/USD remains neutral for the moment. Overall, risk will stay on the downside as long as 0.6792 resistance holds. On the downside, sustained break of 0.6563 support will resume the decline from 0.7156 to 61.8% projection of 0.7156 to 0.6563 from 0.6792 at 0.6426.
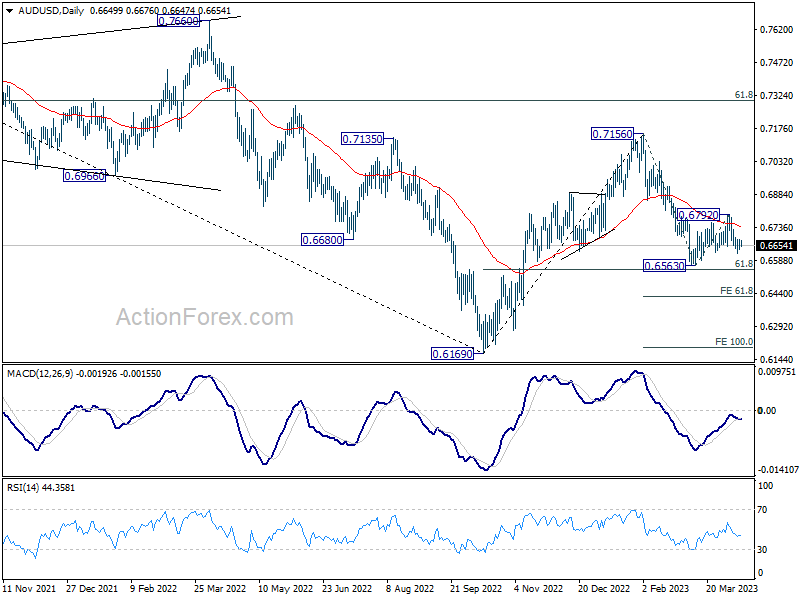
In the bigger picture, as long as 61.8% retracement of 0.6169 to 0.7156 at 0.6546 holds, the decline from 0.7156 is seen as a correction to rally from 0.6169 (2022 low) only. Another rise should still be seen through 0.7156 at a later stage. However, sustained break of 0.6546 will raise the chance of long term down trend resumption through 0.6169 low.
EUR/USD Daily Outlook
Daily Pivots: (S1) 1.0868; (P) 1.0898; (R1) 1.0943; More...
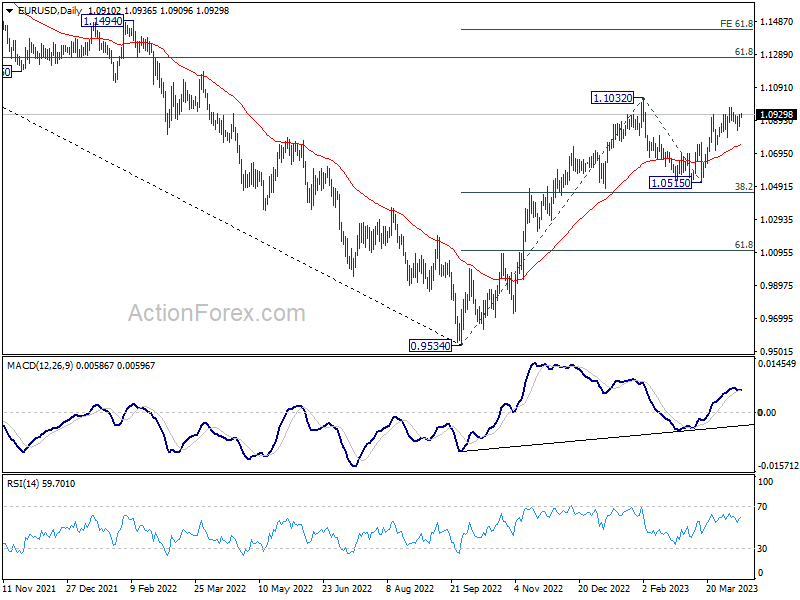
Intraday bias in EUR/USD stays neutral as consolidation from 1.0972 is still extending. With 1.0787 support intact, further rally is expected. On the upside, above 1.0972 will resume the rally from 1.0515 to retest 01.1032 high. Firm break there will resume larger up trend from 0.9534. However, break of 1.0787 will turn bias back to the downside for 1.0711 support instead.
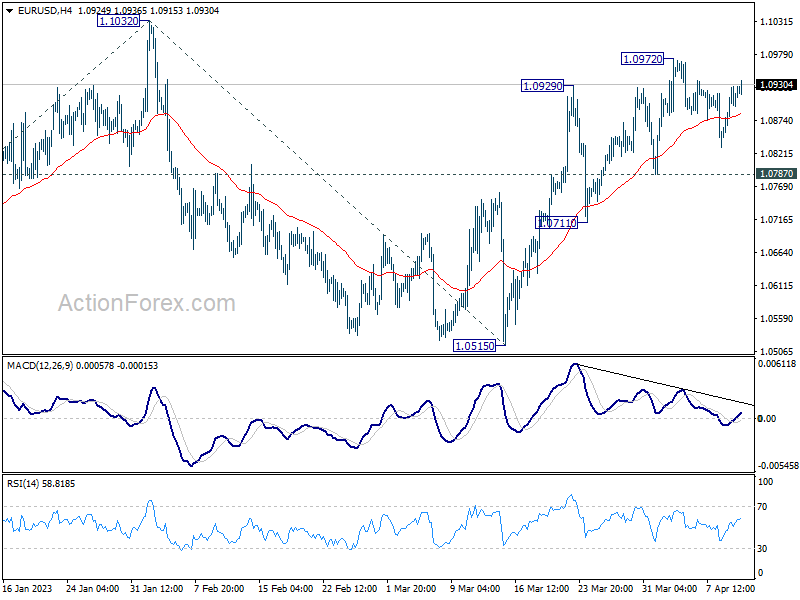
In the bigger picture, rise from 0.9534 (2022 low) is in progress with 38.2% retracement of 0.9534 to 1.1032 at 1.0460 intact. The strong support from 55 week EMA (now at 1.0625) was also a medium term bullish sign. Next target is 61.8% retracement of 1.2348 (2021 high) to 0.9534 at 1.1273. Sustained break there will solidify the case of bullish trend reversal and target 1.2348 resistance next (2021 high).