

Sample Category Title
Fed’s Goolsbee urges prudence and patience amid financial stress
Chicago Fed President Austan Goolsbee stressed the importance of a cautious approach to monetary policy during times of financial stress. He stated yesterday, "At moments like this, of financial stress, the right monetary approach calls for prudence and patience - for assessing the potential impact of financial stress on the real economy."
Goolsbee highlighted the need to understand credit tightening before Fed's next meeting in May, saying, "The foremost thing on my mind before our next meeting in May is trying to get a handle on this question about credit: is it actually credit tightening?"
Emphasizing the current uncertainty, Goolsbee urged caution, adding, "We should gather further data and be careful about raising rates too aggressively until we see how much work the headwinds are doing for us in getting down inflation." He noted that if the response to recent banking issues leads to financial tightening, "monetary policy has to do less."
Crude Oil Price Rally Could Extend As Market Awaits FOMC Minutes
Key Highlights
- Crude oil prices gained pace and cleared the $80 resistance.
- It is now facing resistance near $81.60 on the 4-hour chart.
- EUR/USD and GBP/USD are showing signs of more gains.
- The US CPI could decline from 6% to 5.2% in March 2023 (YoY).
Crude Oil Price Technical Analysis
Crude oil prices started a fresh increase above the $74 resistance against the US Dollar. The price was able to clear the $78 resistance to move further into a positive zone.
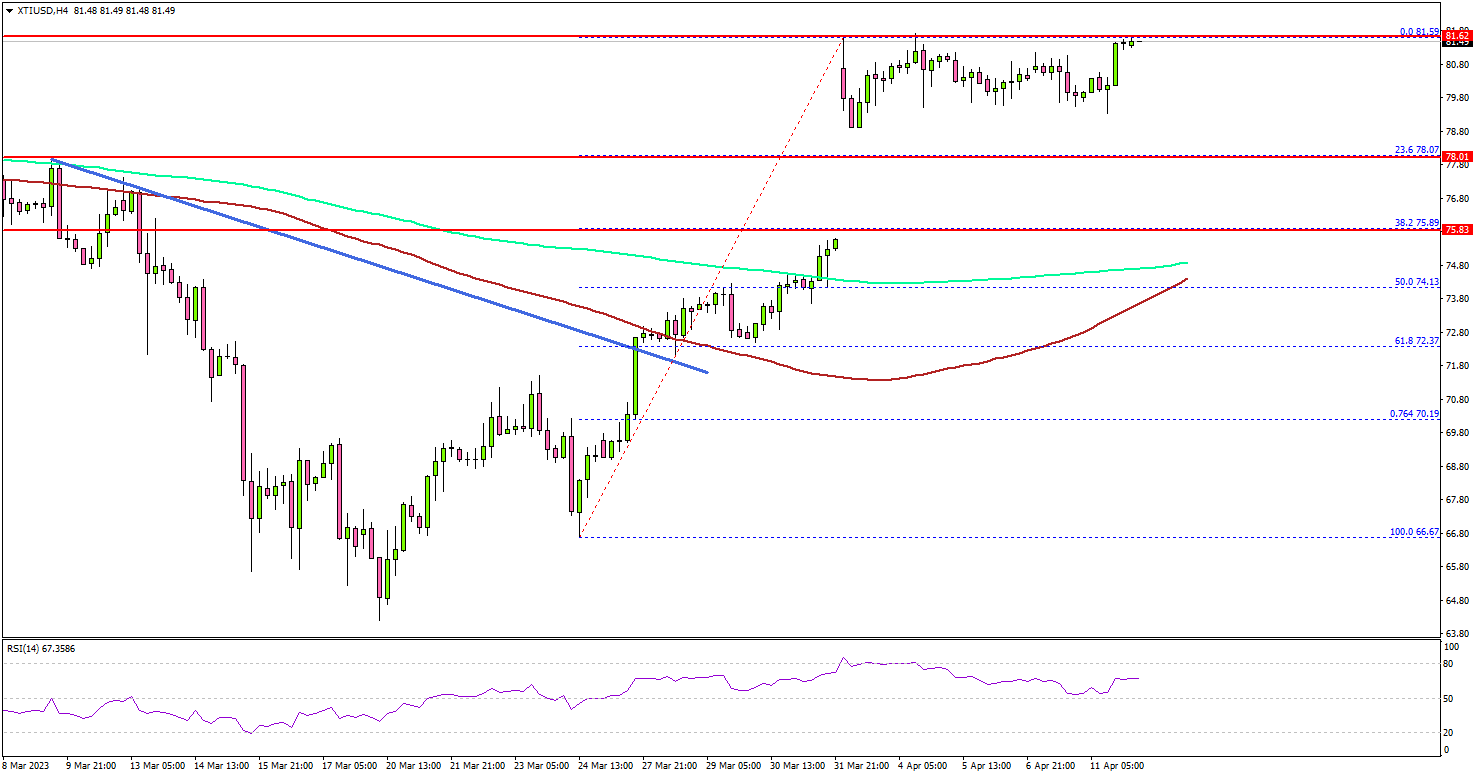
Looking at the 4-hour chart of XTI/USD, the price even settled above the $78.50 pivot level, the 100 simple moving average (red, 4-hour), and the 200 simple moving average (green, 4-hour).
Finally, there was a break above the $80 barrier. The price is now facing resistance near the $81.60 zone and recently started a consolidation phase. The next major resistance is near the $82.50 zone.
A clear move above the $82.50 resistance could open the doors for another steady increase toward $83.80 or even $84.00. If not, there is a risk of a downside correction after the FOMC meeting minutes.
Immediate support is now forming near the $78.00 zone. The next major support sits near the $76.00 level. Any more losses might call for a test of the $74.00 support zone or the 100 simple moving average (red, 4-hour) in the coming days.
Looking at EUR/USD, the pair is holding gains above the 1.0820 level and might aim for a fresh increase above the 1.0925 level.
Economic Releases to Watch Today
- US Consumer Price Index for March 2023 (MoM) – Forecast +0.3%, versus +0.4% previous.
- US Consumer Price Index for March 2023 (YoY) – Forecast +5.2%, versus +6.0% previous.
- US Consumer Price Index Ex Food & Energy for March 2023 (YoY) – Forecast +5.6%, versus +5.5% previous.
- BoC Interest Rate Decision – Forecast 4.5%, versus 4.5% previous.
- FOMC Minutes.
NZDUSD Found Sellers After Elliott Wave Double Three Pattern
Hello fellow traders. In this technical article we’re going to take a look at the Elliott Wave charts charts of NZDUSD published in members area of the website. As our members know NZDUSD has recently made recovery against the 0.6538 peak that has unfolded as Elliott Wave Double Three Pattern. It made clear 7 swings from the lows and completed correction at the extreme zone. In further text we’re going to explain the Elliott Wave pattern and forecast
Before we take a look at the real market example, let’s explain Elliott Wave Double Three pattern.
Elliott Wave Double Three Pattern
Double three is the common pattern in the market , also known as 7 swing structure. It’s a reliable pattern which is giving us good trading entries with clearly defined invalidation levels.
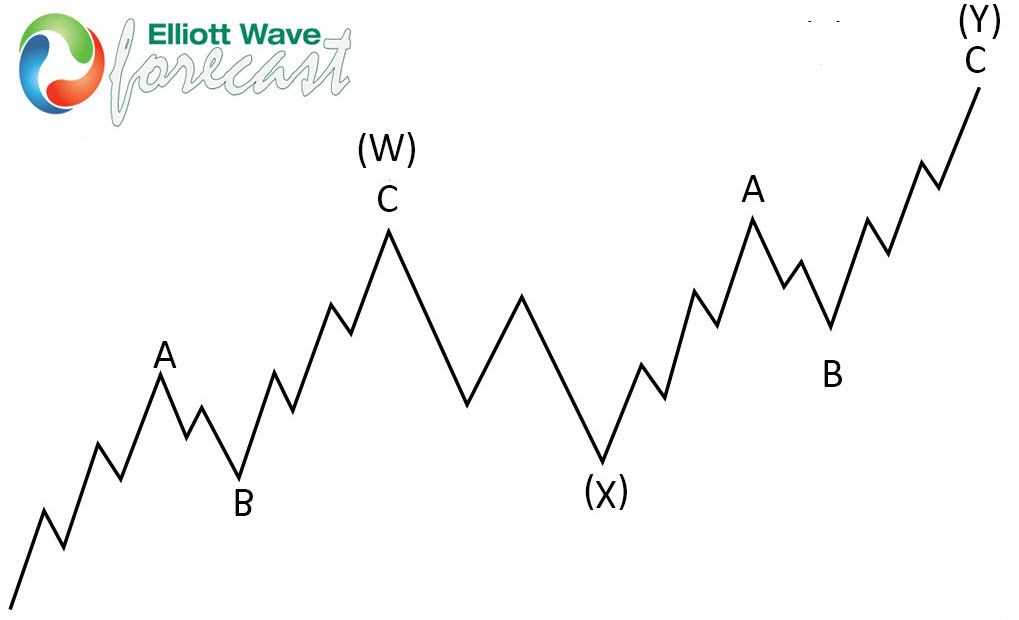
The picture below presents what Elliott Wave Double Three pattern looks like. It has (W),(X),(Y) labeling and 3,3,3 inner structure, which means all of these 3 legs are corrective sequences. Each (W) and (Y) are made of 3 swings , they’re having A,B,C structure in lower degree, or alternatively they can have W,X,Y labeling.
NZDUSD 1h Hour Elliott Wave Analysis 04.04.2023
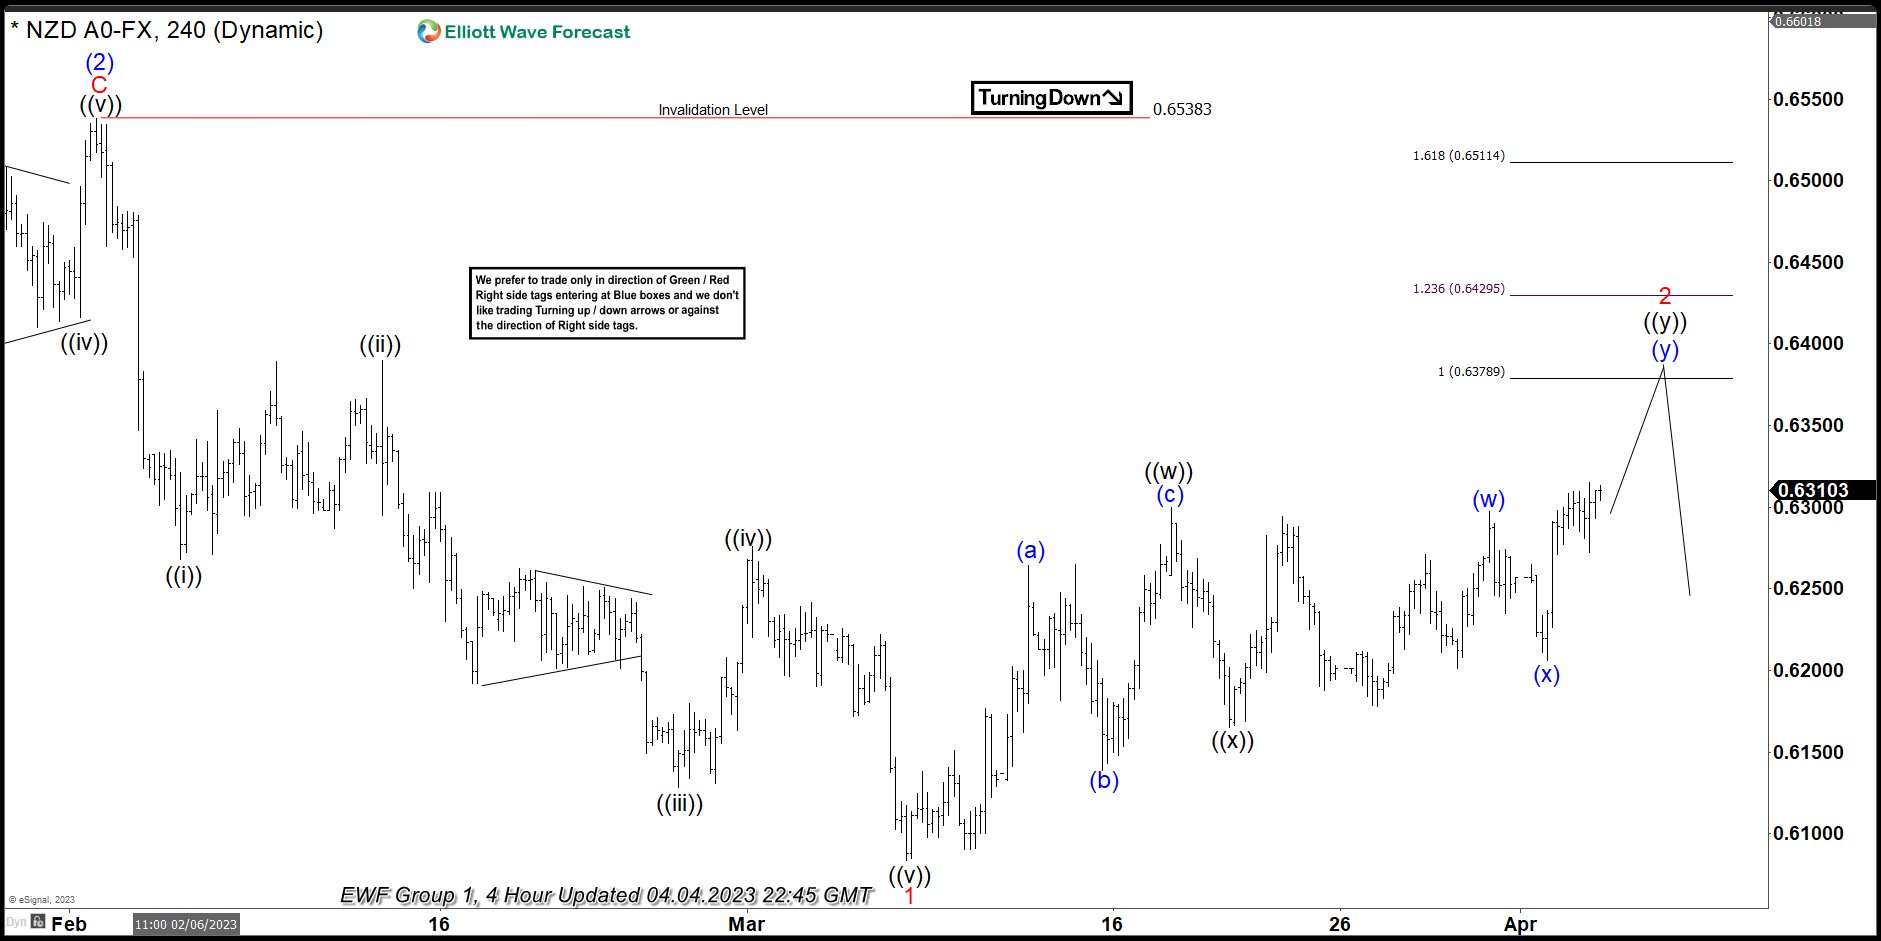
NZDUSD is giving us 2 red recovery that is unfolding as Elliott Wave Double Three Pattern. Correction has ((w))((x))((y)) black inner labeling. The price structure is still incomplete. We expect to see more short term strength in 7th swing toward 0.63789-0.64295 area to complete proposed correction. At that zone buyers should be ideally taking profits and sellers can appear again. Consequently , we expect to see reaction from the marked area. The pair can give us either decline toward new lows or larger 3 waves pull back at least.
NZDUSD 1h Hour Elliott Wave Analysis 04.11.2023
The pair made extension higher and sellers appeared right at the marked extreme zone : 0.63789-0.64295 . So far NZDUSD is giving us a good reaction from the equal legs area. Current view suggests 2 red recovery completed at 0.63817 high. We could be ending short term cycle from the mentioned peak as 5 waves structure and expecting to see 3 waves bounce. The price now must hold below 0.63817 high peak in order to keep proposed view intact, otherwise larger correction can be taking place. We should wait for a break of 1 red low , which will confirm next leg down is in progress.
USDCHF Wave Analysis
- USDCHF reversed from resistance level 0.9095
- Likely to fall to support level 0.9000
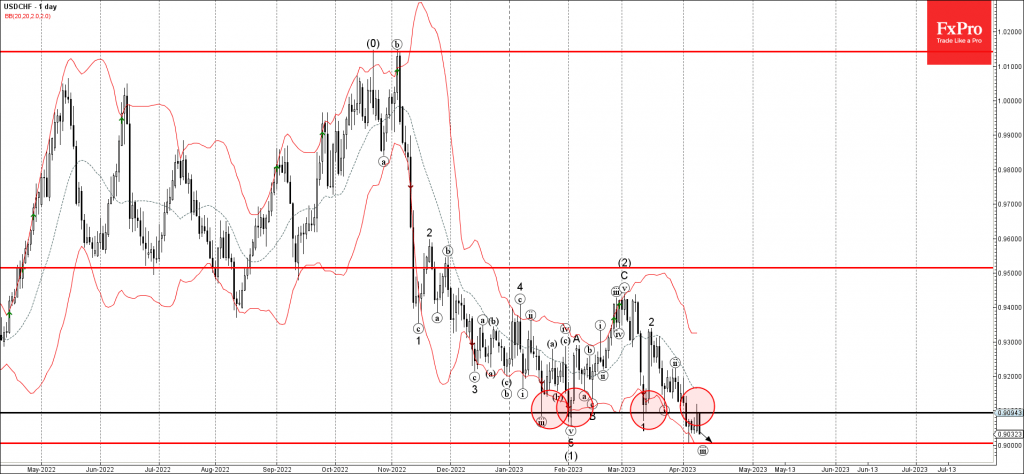
USDCHF currency pair recently reversed down from the key resistance level 0.9095 (former powerful support which has been reversing the price from the middle of January).
The downward reversal from the resistance level 0.9095 continues the active short-term impulse wave (iii) – which belongs to the impulse waves 3 and (3).
Given the long-term downtrend, USDCHF can then be expected to fall further toward the next round support level 0.9000 (low of the earlier Hammer from the start of this month).
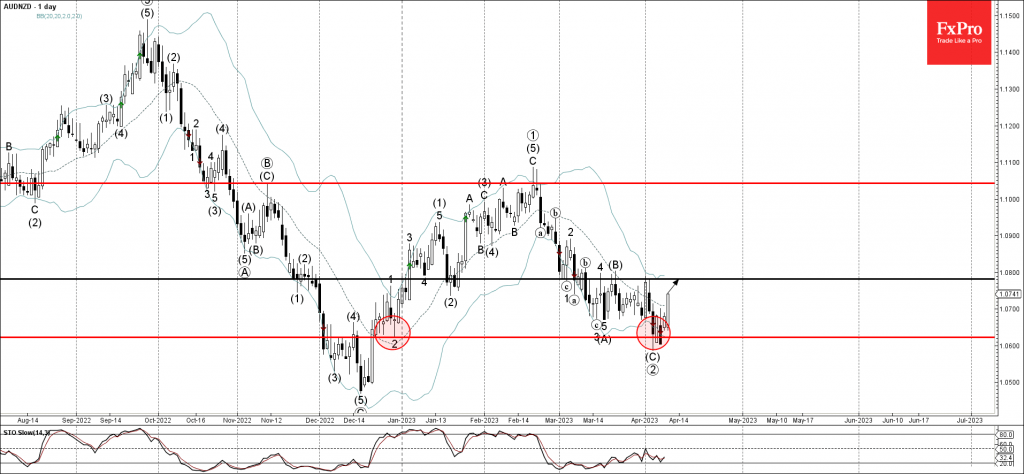
AUDNZD Wave Analysis
- AUDNZD reversed from support level 1.0625
- Likely to rise to resistance level 1.0780
AUDNZD currency pair recently reversed up from the key support level 1.0625 (which has been reversing the price from last December).
The upward reversal from the support level 1.0625 created the two consecutive upward reversal candlesticks patterns Bullish Engulfing – signalling the strength of this support level.
AUDNZD can then be expected to rise further toward the next resistance level 1.0780 (which stopped the previous waves 4 and (B)).
US CPI Inflation Takes Center Stage as May Policy Decision Looms
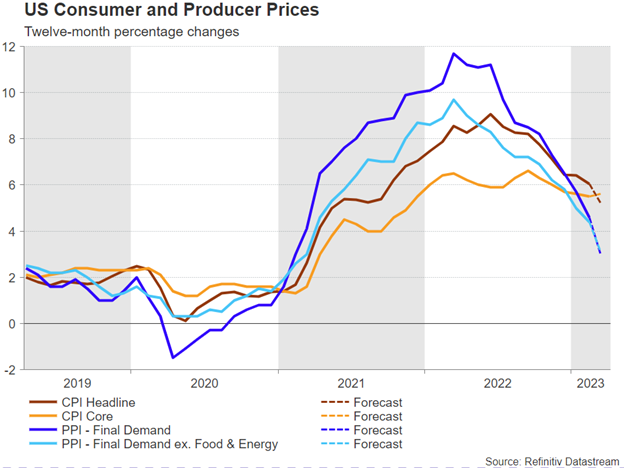
The US calendar will be packed this week after the Easter holiday break, but CPI inflation figures will be at the center of attention on Wednesday at 12:30 GMT as monetary policy remains primarily a function of price stability. A pause in monetary tightening came into the Fed’s consideration during its previous policy meeting and the data might be indicative of whether a peak in interest rates will come sooner rather than later. Yet, forecasts suggest that there might be some way to go before we reach a terminal rate. If that proves to be the case, the dollar could stay resilient above its recent lows.
Another rate hike may come soon
Friday’s US nonfarm payrolls report revealed a slightly weaker but still a solid addition of 236k jobs, with the unemployment rate easing closer to previous record lows and the participation rate marking a new three-year high.
Rate expectations for a 25bps rate hike spiked to 70% from 50% previously in the aftermath. Still, the details warranted some caution in hiring as jobs growth came in below the six-month average of 334k, while the retail and construction sectors, which are more sensitive to rate increases, faced job losses. Moreover, the survey was completed a few days after the collapse of the California-based Silicon Valley Bank and New York’s Signature Bank. Hence, the effects from the baking turmoil and the announced layoffs may take some time before they show up in the data.
Meanwhile, the latest spike in weekly jobless claims is already increasing speculation for softer job prints in the coming months, though we can easily argue that the US labor market has been inelastic to the tightening cycle so far. In other words, it has barely weakened in response to continuous rate increases, making the rate cut pricing at the end of this year look premature.
CPI inflation to ease further but not at the target yet
Likewise, CPI inflation data could also play down lower interest rate expectations and hint at additional tightening ahead of May’s policy announcement. Although projections see headline inflation falling for the ninth consecutive month to 5.2% y/y from 6.0% previously, that would still be more than double the Fed’s symmetrical 2.0% average inflation target.
Strikingly, the core CPI measure, which excludes volatile prices such as food and energy, is expected to outstrip the headline measure, arriving marginally higher at 5.6% y/y. The latter could be a warning sign that inflation is becoming entrenched in the domestic price dynamics and interest rates may remain high for longer until price stability is achieved. A similar incident occurred during the 1970-1980 period when the then Federal Reserve chair Paul Volcker held interest rates high for an extended period of time, spurring a recession, though ultimately bringing inflation to the target.
US dollar outlook
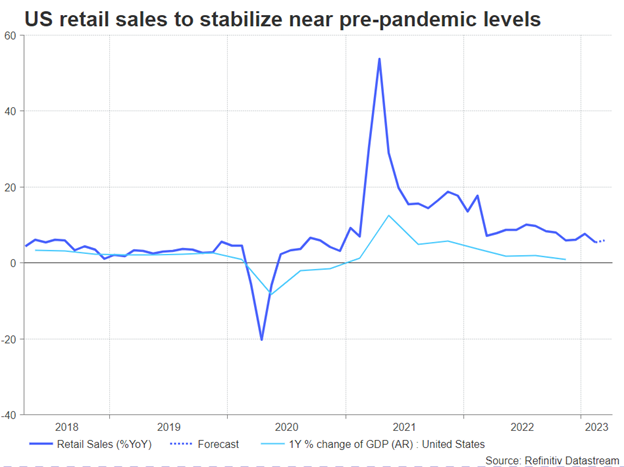
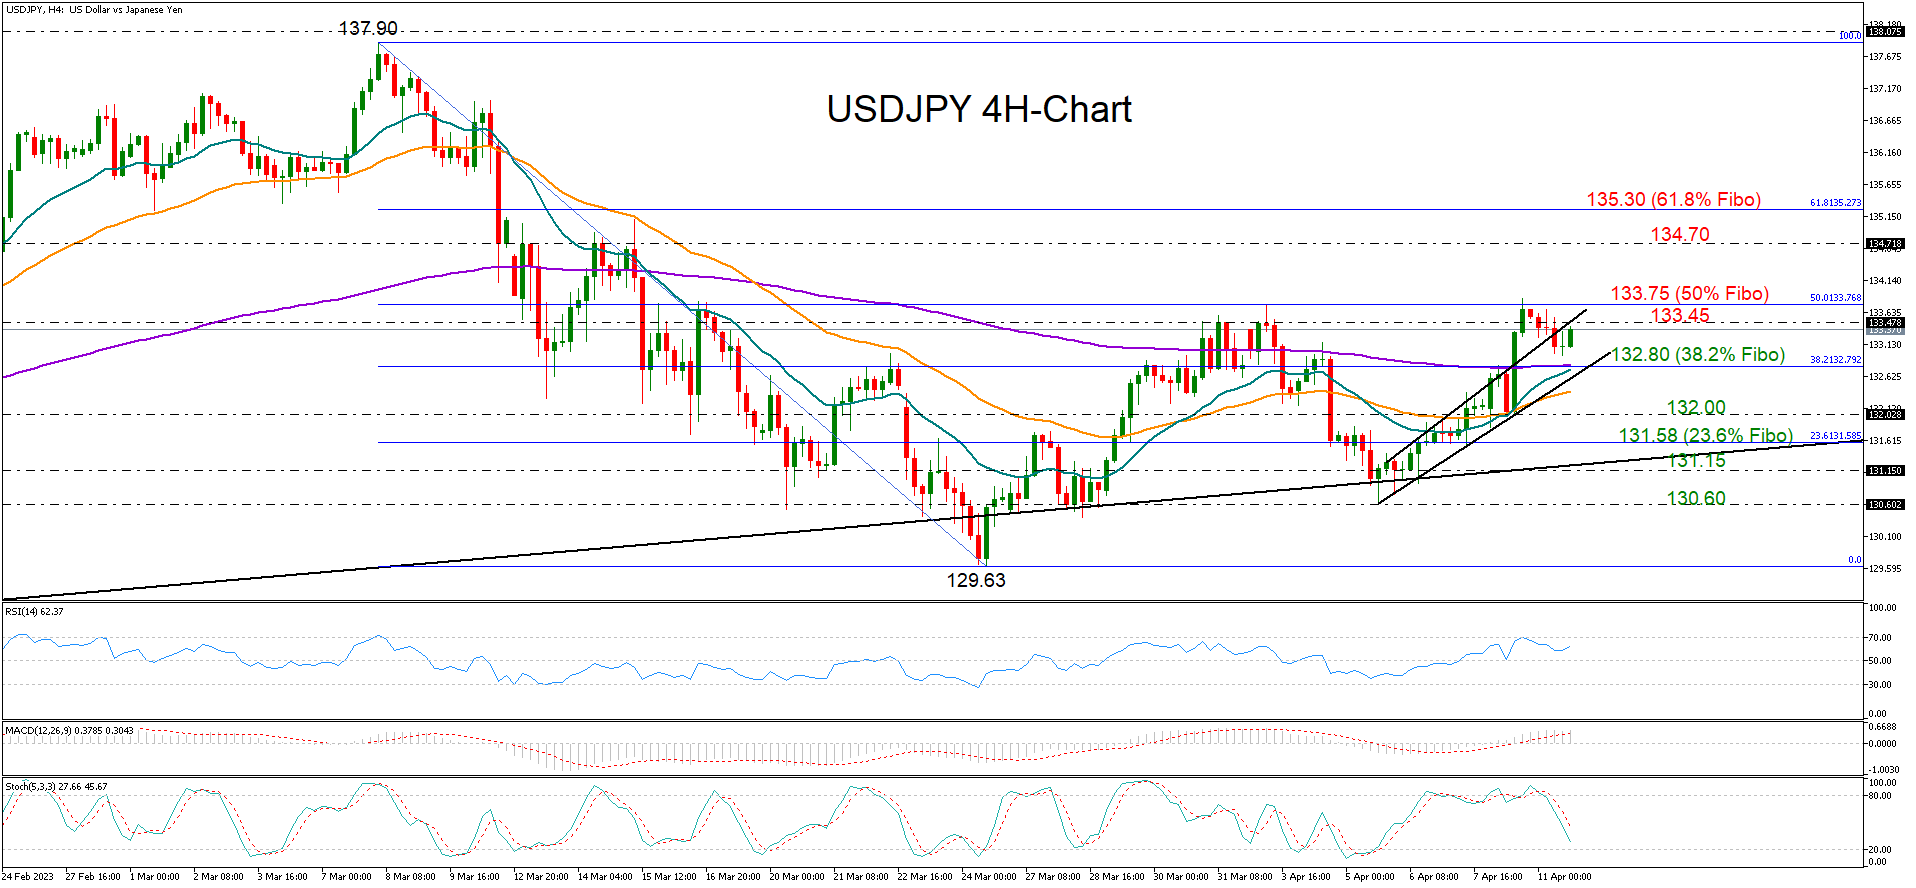
As regards the US dollar, stronger-than-expected inflation readings could bode well for the currency. From a technical perspective, a break above the 133.45-133.75 region is required for dollar/yen to extend its recovery towards the next resistance area seen between 134.70 and 135.30. Monthly retail sales could add more fuel to the rally on Friday too if they beat expectations for a monthly decline of 0.3% and an annual expansion of 5.90%. Otherwise, a rapid downfall in retail sales would reflect fizzling demand, creating new downside pressures in the market at the end of the week, especially if the pair crosses below the 132.80 support region.
All in all, the Fed has not entirely abandoned its hawkish talk despite discussing the potential for a pause during its March gathering. Fed officials, including John Williams and James Bullard, returned to the wires recently to remind investors that the central bank will not abandon its task of getting inflation to the target, while seeing no need to adjust its balance sheet policy anytime soon. That leaves little room for surprises from the FOMC meeting minutes due on Wednesday at 18:00 GMT.
BTCUSD Technical Analysis
Bitcoin continues its bullish momentum from last week, and after touching a low of $27,717 on April 6, we can see a bull run, which managed to push the prices of BTCUSD above the $30,000 handle today in the early European trading session.
The resistance of the channel is broken in the daily timeframe, indicating the strength of the bulls.
We can clearly see a hammer pattern above the $27,717 handle.
Bitcoin continues to move in a range-bound motion between the $29,800 and $30,200 levels, which is indicative of a consolidation phase in the markets.
Both the STOCH and Williams Percent Range indicate overbought levels, which means that in the immediate short term, a decline in the price is expected.
The relative strength index is at 74.02, indicating a strong demand for Bitcoin and the continuation of the buying pressure in the markets.
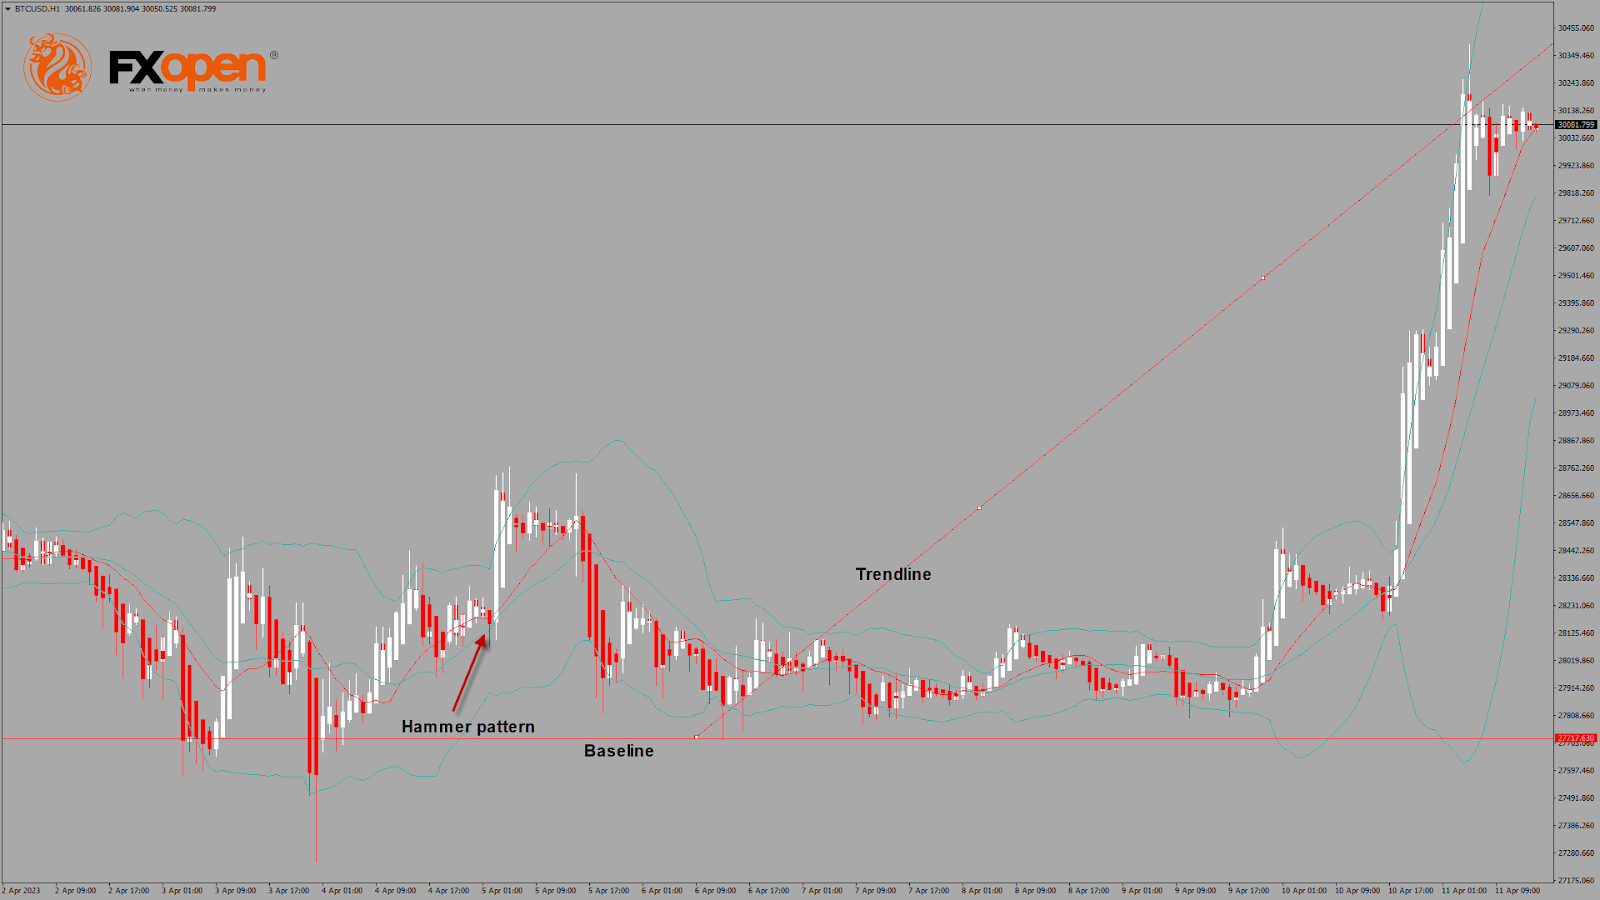
Bitcoin is now moving above its 100-hour simple moving average and above its 200-hour exponential moving average.
Most of the major technical indicators are giving a bullish signal, which means that in the immediate short term, we are expecting targets of $31,000 and $32,500.
The average true range indicates low market volatility with strong bullish momentum.
- Bitcoin bullish continuation is seen above $27,717.
- The RSI remains above 50, indicating a bullish market.
- The price is now trading above its pivot level of $30,088.
- The short-term range is strongly bullish.
- Some major technical indicators signal that the price may move to $30,500 and $31,000 soon.
Bitcoin Bullish Continuation Seen Above $27,717
The price of Bitcoin has been successful in crossing the $30,000 resistance, and now we are looking for fresh upsides in the range of $31,000 and $32,000.
We can see the formation of the bullish harami pattern in the 2-hour timeframe.
The price of Bitcoin indicates the formation of a bullish rally.
A support zone is located at $27,919, where the price crosses the 18-day moving average, and at $28,394, at which the price crosses the 9-day moving average.
BTCUSD is now facing its classic resistance level of $30,168 and Fibonacci resistance level of $30,211, breaking which the price will be able to move to $31,000.
There is an increase of 92.13% in the daily trading volume, which suggests that long-term investors are now coming back into the markets. The short-term outlook for Bitcoin is super bullish, the medium-term outlook has turned bullish, and the long-term outlook remains neutral under present market conditions.
The Week Ahead
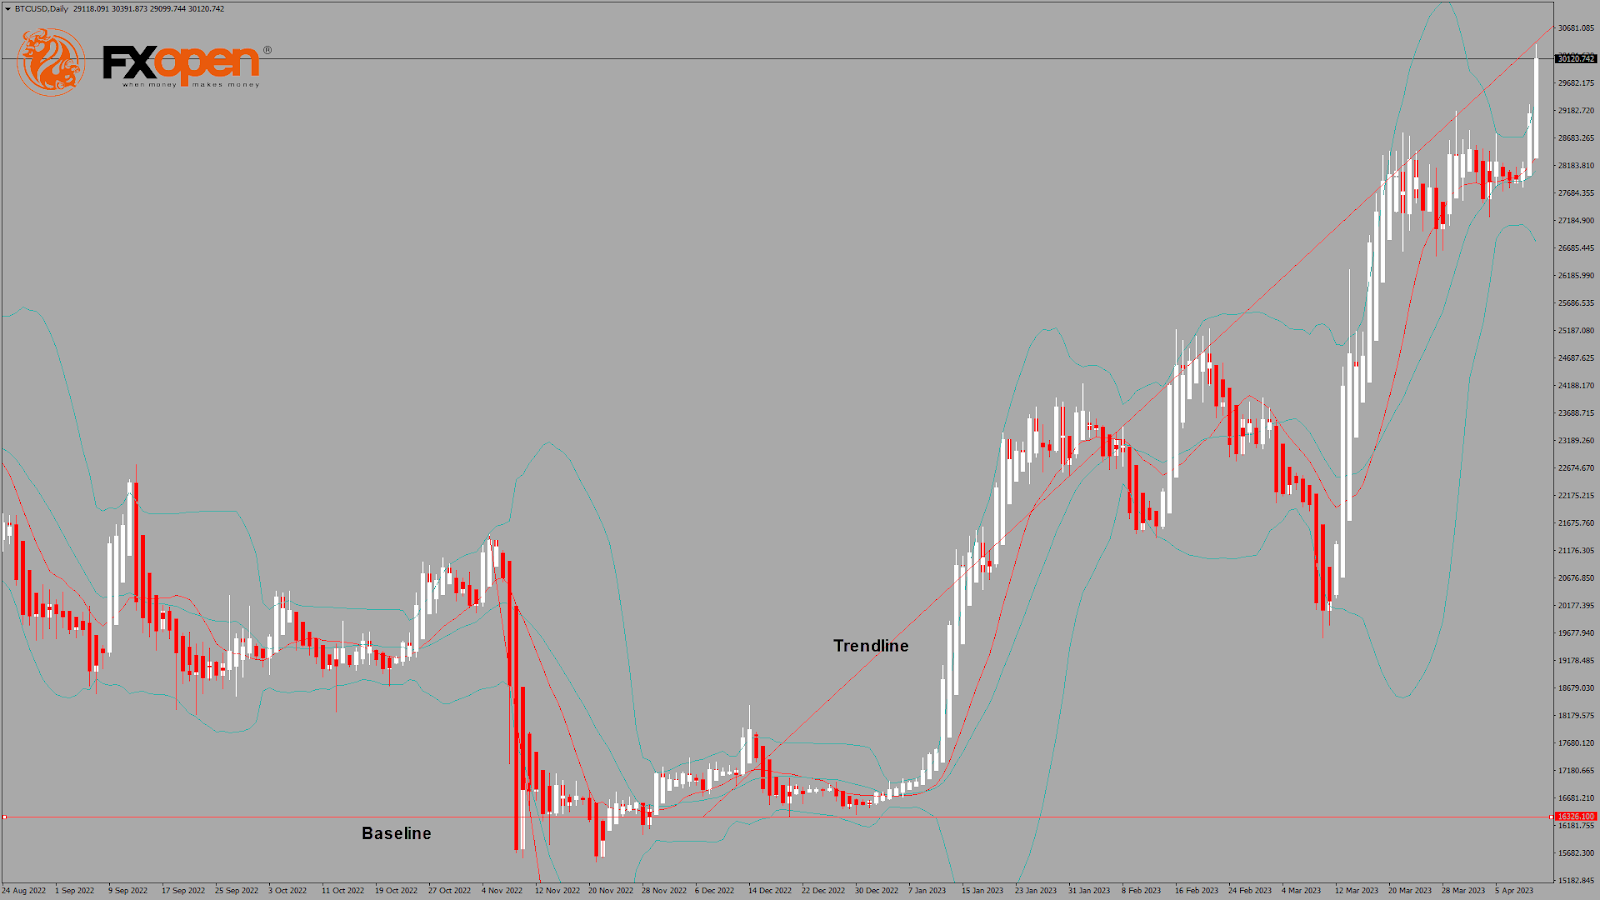
We can see that Bitcoin continues its winning streak against the US Dollar, now trading above the $30,000 handle, with the current support at $26,566, which is a 14-day RSI at 50.
The MACD crosses up its moving average in the daily timeframe, indicating the bullish nature of the market.
We can also see the formation of three white soldiers pattern in the daily timeframe.
The immediate expected target is $32,000, after which we may see some consolidation in the zone of the $31,500 level.
Daily RSI is at 70.79, which indicates the continuation of the bullish trend and the formation of super bullish demand for Bitcoin in the medium-term range.
We can see the formation of a bullish trendline from $27,717 to $30,356.
The BTCUSD is now facing resistance at $31,150, which is a pivot point’ third resistance level, and at $32,468, which corresponds to a 61.8% retracement from the 52-week low.
Stalled European Recovery
Investor confidence and retail sales data released on Tuesday beat average market forecasts but showed no improvement over recent months.
The Sentix investor confidence index rose from -11.1 to -8.7 in April. This is roughly where the index was in February. However, it has been in negative territory for 13 months and has shown no positive trend in the last three months.
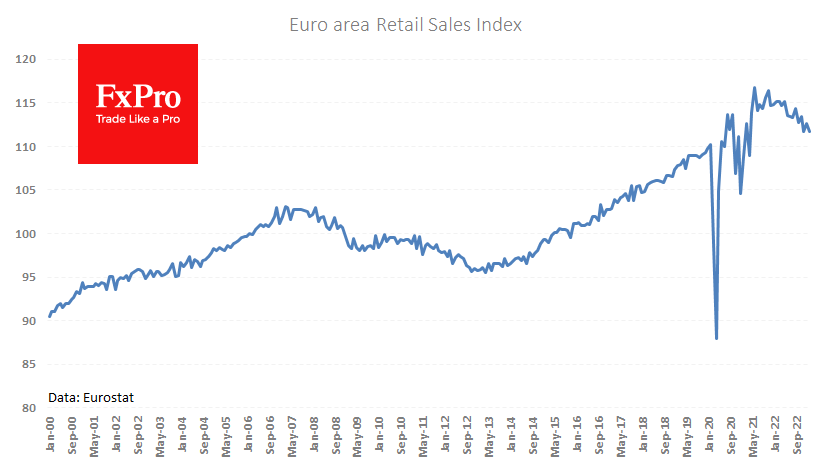
Eurostat reported that retail sales fell by 0.8% in February, after the same increase in the previous month. On a yearly basis, sales are down by 3%. The retail sales index has been downward since November 2021, breaking the long-term upward trend that began around ten years ago.
Melting retail sales and investor pessimism cast doubt on whether the ECB still needs to raise interest rates. However, everything is relative in the currency market, and expectations are now much higher that the Fed will end its hikes sooner and be the first to start easing, supporting the euro’s rise against the dollar.
Japan Recovering, But What About Yen?
After last year’s shock, Japan’s economic indicators are slowly returning to normal. But conditions are still unsuitable for raising interest rates for the Bank of Japan. This is not good news for the Yen. The interest rate differential, which has risen sharply over the past year, creates the conditions for carry trade. The only obstacle to an active interest rate differential play is the uncertainty surrounding monetary policy due to the change in the central bank governor.
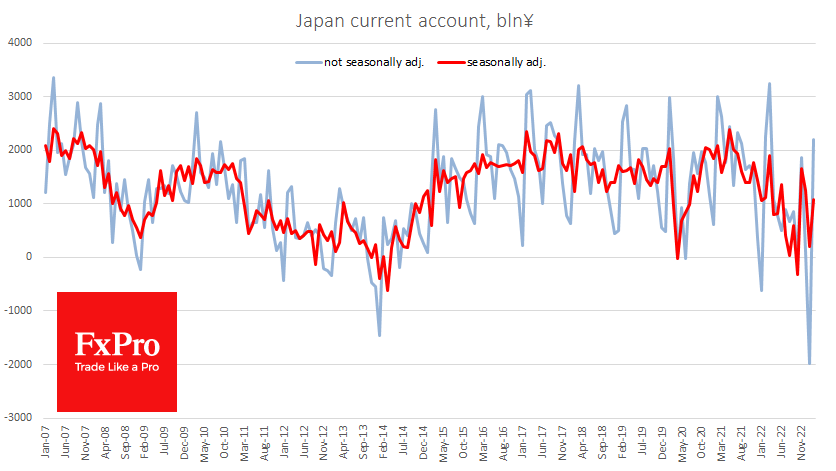
The balance of payments rebounded from last month’s record deficit as the February trade deficit fell to its lowest level in 11 months. The balance of payments appears to have turned around. This is supported by lifting China’s export restrictions and falling container prices, which should boost demand for goods from Japan.
In addition, consumer optimism is on the rise. Household consumer confidence has risen every month since November, from 31.3 to 33.9 in March, the highest level since May last year. The “economy watchers” survey also returned to last year’s highs in current conditions and was at its highest level since October 2021 in terms of forecasts.
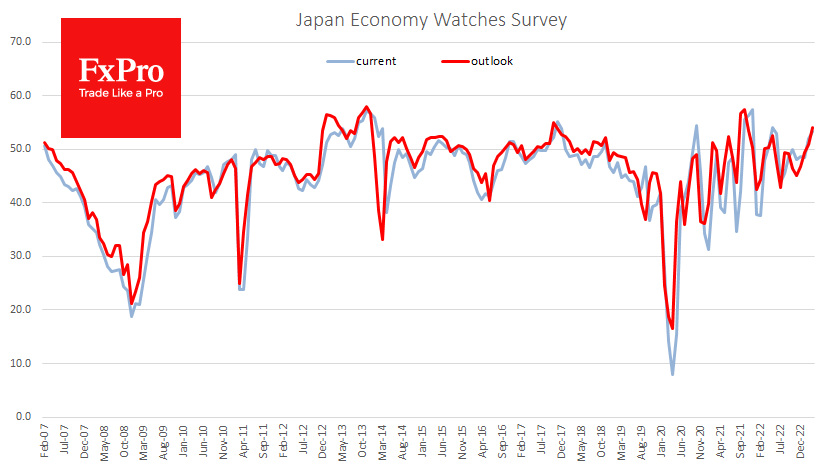
A key driver of the Yen’s appreciation in recent months has been speculation about a change in monetary policy. Expectations have grown that Kuroda’s resignation as governor of the Bank of Japan would trigger a tightening of monetary policy. But so far, there has been no real change or even a hint in that direction from the new BoJ governor, who formally took office on 9 April. His latest speech signalled that he would continue to ease policy.
He has not been seen as a proponent of tightening policy, but a confirmation after his inauguration could potentially trigger a new wave of pressure on the Japanese currency. The USDJPY jumped more than 1% on Monday, taking advantage of the dollar’s general bullishness. Today, however, the Yen is in no hurry to regain its losses, as the Pound and Euro are doing. And this may not be the end of the samurai path.
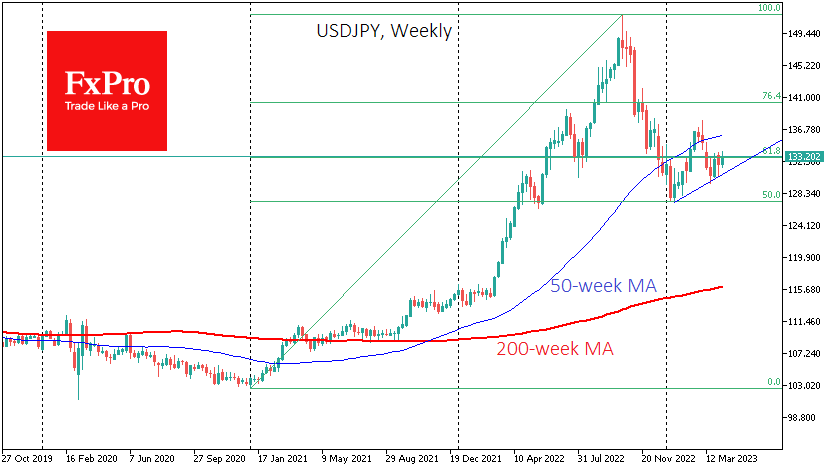
Lower inflation eases the pressure on the BoJ to raise interest rates. The USDJPY’s pullback from 151 to 127 corrected 50% of the rally on the monetary policy change and stopped the pair’s uncontrolled rise. Technically, the path to the upside for the pair is now clear, but it is difficult to identify a clear technical target for this path. The 140 level could be a medium-term target.
Much more helpful is the dynamics of interest rate expectations. The fundamental pressure on the Yen may continue as long as the spread between the Yen’s government bond yields and those of its major rivals widens.