

Sample Category Title
EUR/USD Daily Outlook
Daily Pivots: (S1) 1.0868; (P) 1.0898; (R1) 1.0943; More...
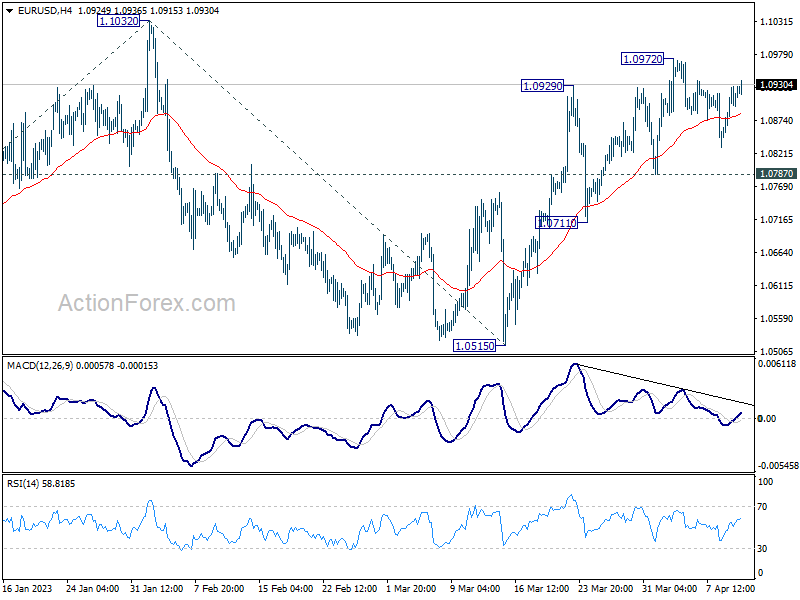
Intraday bias in EUR/USD stays neutral as consolidation from 1.0972 is still extending. With 1.0787 support intact, further rally is expected. On the upside, above 1.0972 will resume the rally from 1.0515 to retest 01.1032 high. Firm break there will resume larger up trend from 0.9534. However, break of 1.0787 will turn bias back to the downside for 1.0711 support instead.
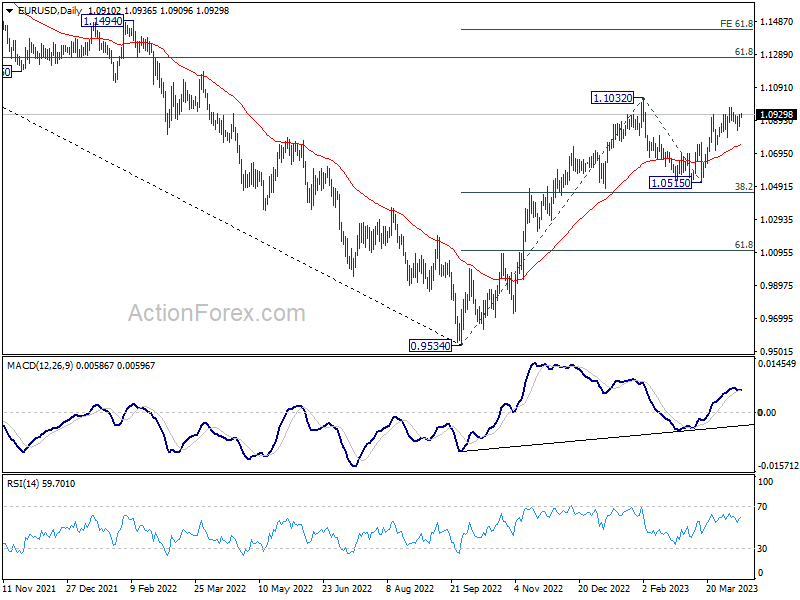
In the bigger picture, rise from 0.9534 (2022 low) is in progress with 38.2% retracement of 0.9534 to 1.1032 at 1.0460 intact. The strong support from 55 week EMA (now at 1.0625) was also a medium term bullish sign. Next target is 61.8% retracement of 1.2348 (2021 high) to 0.9534 at 1.1273. Sustained break there will solidify the case of bullish trend reversal and target 1.2348 resistance next (2021 high).
GBP/USD Daily Outlook
Daily Pivots: (S1) 1.2385; (P) 1.2420; (R1) 1.2461; More...
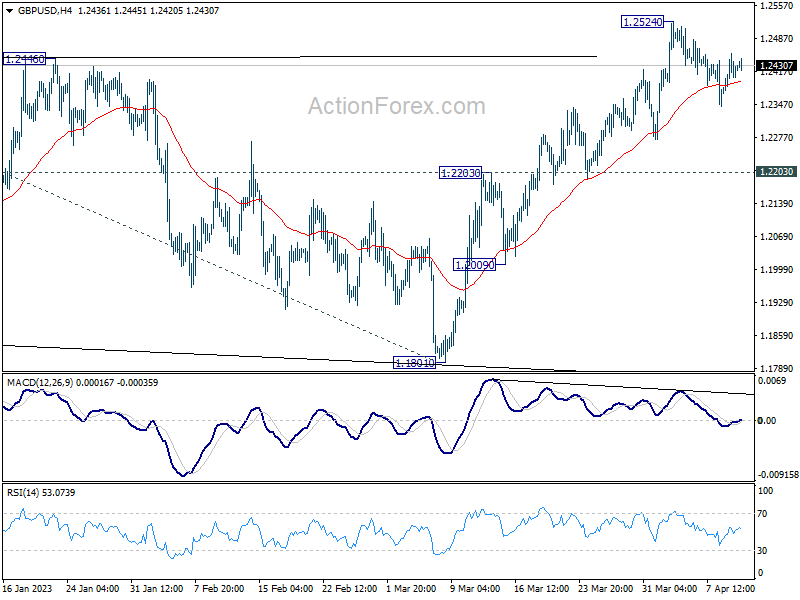
GBP/USD is still extending the consolidation pattern from 1.2524 and intraday bias remains neutral. Further rally is expected with 1.2203 resistance turned support intact. On the upside, break of 1.2524 will target 1.2759 fibonacci level first. Firm break there will target 61.8% projection of 1.0351 to 1.2445 from 1.1801 at 1.3095.
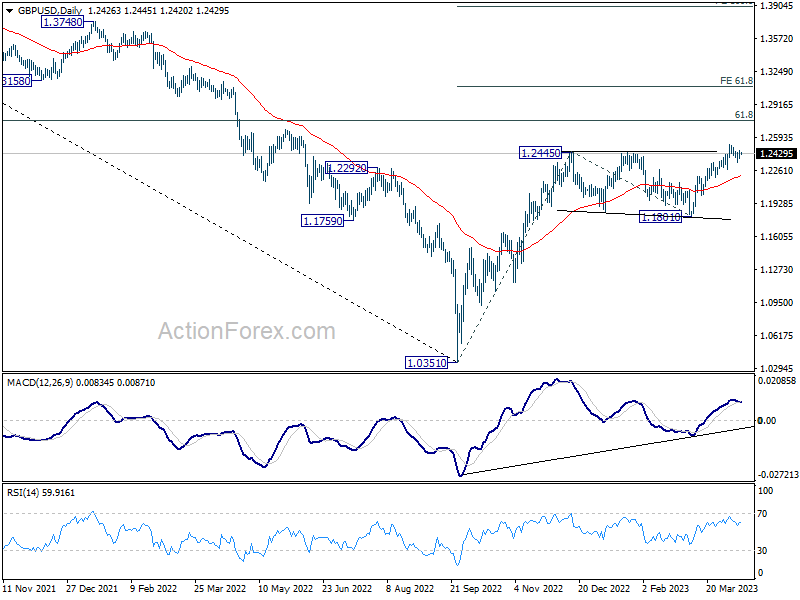
In the bigger picture, the rise from 1.0351 medium term term bottom (2022 low) is in progress for 61.8% retracement of 1.4248 (2021 high) to 1.0351 at 1.2759. Sustained break there will add to the case of long term bullish trend reversal. Further break of 61.8% projection of 1.0351 to 1.2445 from 1.1801 at 1.3095 could prompt upside acceleration to 100% projection at 1.3895. For now, this will remain the favored case as long as 1.1801 support holds, even in case of deep pull back.
USD/JPY Daily Outlook
Daily Pivots: (S1) 133.18; (P) 133.50; (R1) 134.01; More...
Intraday bias in USD/JPY is back on the upside as rebound from 129.62 is resuming by breaking 133.74 resistance. Further rise would be seen towards 137.90 resistance again. On the downside, though, below 132.92 minor support will turn intraday bias neutral first. Further break of 130.62 should resume the fall from 137.90 through 129.62 to retest 127.20 low.
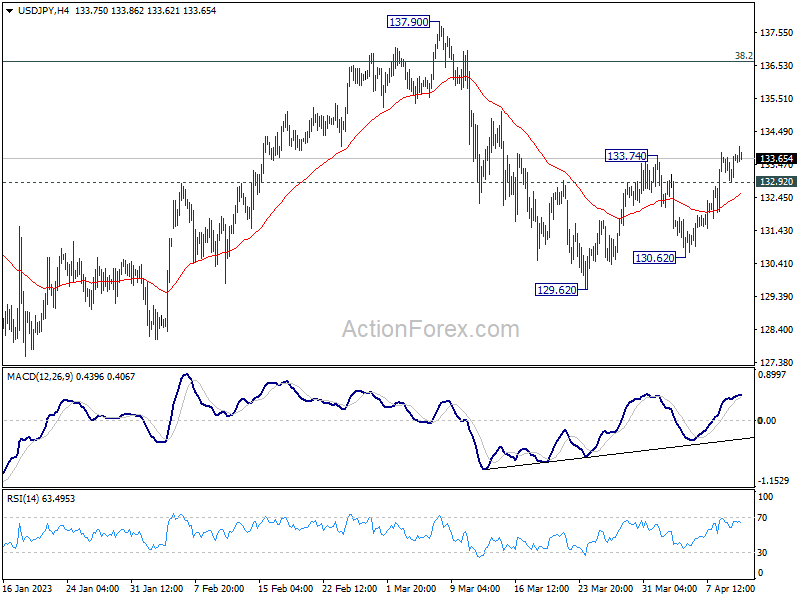
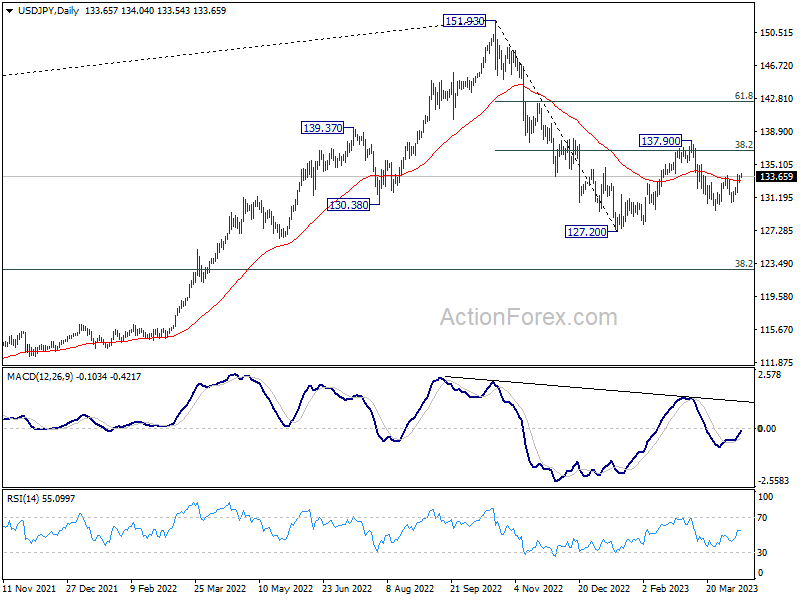
In the bigger picture, corrective pattern from 127.20 might be extending. But after all, down trend from 151.93 is expected to resume at a later stage. Break of 127.20 will resume this down trend and target 61.8% projection of 151.93 to 127.20 from 137.90 at 122.61. This will now be the favored case as long as 137.90 resistance holds.
Focus on US CPI
Market movers today
The highlight of today will be US CPI for March. We look for 0.4% m/m on the core CPI, in line with consensus. It is a decline from 0.5% m/m in February but still too high for the Fed with respect to reaching the 2% target. Hence, we believe it would seal another hike on 3 May barring any new bad news on the banking front.
Bank of Canada is widely expected to keep rates unchanged at todays' meeting at 4.5%.
Tonight at 20.00 CET we get the FOMC minutes from the 22 March meeting. It will be interesting to read their discussion of the banking issues. However, since then the banking stress has calmed down but we still need to see the effect of any tightening of lending standards, not least towards commercial real estate.
The 60 second overview
Fed-speak: FOMC participants reiterated focus on getting inflation down ahead of the key CPI data today. NY Fed's Williams noted that 'one more rate hike is a reasonable starting place', while Harker called for getting 'rates above 5%' and staying there, in line with our view. Kashkari also said that a recession is possible, yet it is better than allowing inflation to prolong. On the more dovish side, Chicago Fed's Goolsbee emphasized caution regarding the banking sector uncertainty, and said the right monetary policy stance calls for 'prudence and patience'.
Market outlook: As we see both ECB and the Fed remaining on a tightening bias, one of our long-standing market views has been that stronger USD remains a prerequisite for a return to low inflation. In FX Strategy - Throwback monetary analysis to lose its appeal again, 11 April, we highlight that as the rise and fall of the excess money supply ends over the coming months, we expect the focus to increasingly shift back to actual inflation and inflation expectations.
IMF: The International Monetary Fund released the updated World Economic Outlook yesterday, downgrading the global growth outlook by 0.1 percentage point for both 2023 (2.8%) and 2024 (3.0%).
Equities: No news is good news, as the lower vol in bonds is just good enough to lift equities. Thereby, cheerful markets in Europe and Nordics. Meanwhile, the US session struggled a bit for direction but with the same rotation taking place: Into cyclicals - and especially value cyclicals - and out of defensives and tech. Banks outperformed tech by 2p.p. Futures are a tad higher today.
FI: Yesterday, European government bond yields caught with the rise in US Treasury yields from Friday. Hence, the negative sentiment in the European bond market was a reflection of the rise Treasury yields on Friday. However, the 10Y BTPS-Bund spread has been remarkably more stable in a fairly tight range from 170bp to 200bp.
FX: FX markets are relatively quiet this morning, ahead of today's important US inflation numbers, yet with a pinch of risk on. USD/JPY continues testing the topside, now just below 134; EUR/USD still above 1.09, now at 1.0925; EUR/SEK down below 11.40, though ever so slightly; and EUR/NOK off yesterday's highs, now at 11.52.
Credit: With equities in green CDS indices were somewhat tighter yesterday as iTraxx Main closed the day 4bp tighter at 85bp and Xover 14bp tighter at 445bp. Supply was limited though the primary market saw one EUR covered bond being printed and a further five being mandated, while the corporate sphere saw euro deals mandated by Australian telecom Telstra and Sydney Airport.
Nordic macro
Norway: We expect the Norwegian mainland GDP fell 0.2% m/m in February, on weaker consumption and headwinds to both manufacturing and construction.
USD/CHF Daily Outlook
Daily Pivots: (S1) 0.9006; (P) 0.9055; (R1) 0.9081; More...
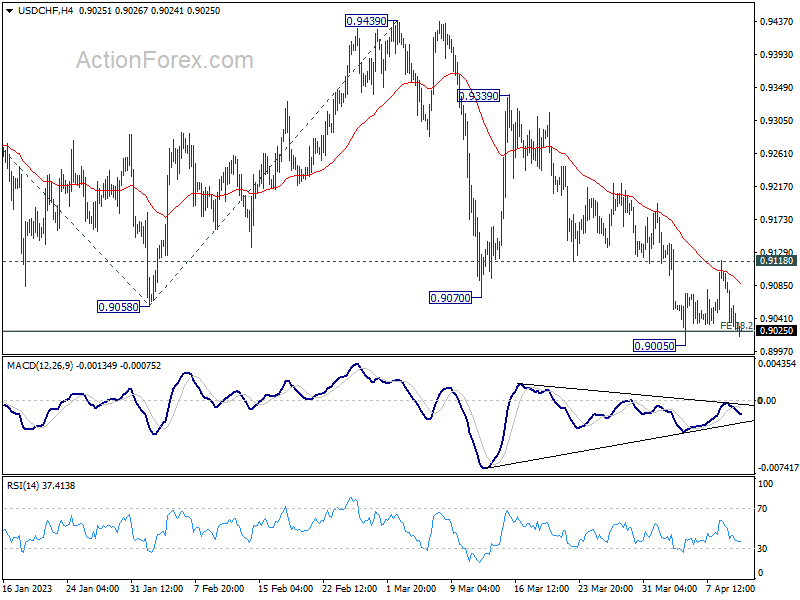
USD/CHF is staying in range above 0.9005 and intraday bias stays neutral first. With 0.9118 resistance intact, further decline is expected. On the downside, break of 0.9005 and sustained trading below 38.2% projection of 1.0146 to 0.9058 from 0.9439 at 0.9023 will extend the down trend from 1.0146 to 61.8% projection at 0.8767. However, firm break of 0.9118 will indicate short term bottoming, and turn bias to the upside for stronger rebound.
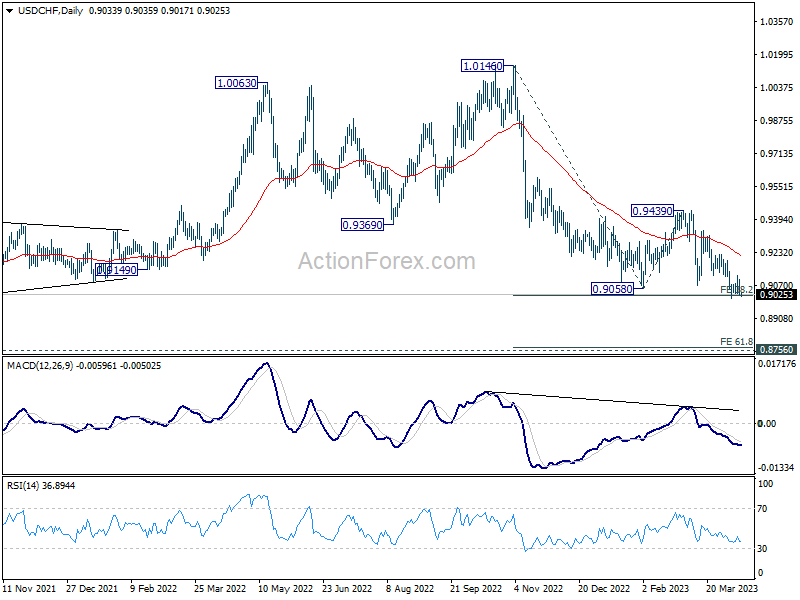
In the bigger picture, outlook will stay bearish as long as 0.9439 resistance holds, and fall from 1.1046 (2022 high) is still in progress. Prior rejection by 55 week EMA was a medium term bearish sign. Sustained of 0.9058 will resume such decline towards 0.8756 support (2021 low). But overall, this fall is still as a leg in the long term range pattern from 1.0342 (2016 high). So, downside should be contained by 0.8756 to bring reversal.
Market Volatility to Pick Up With US CPI and BoC Decision Featured
Market volatility could see a significant uptick today with three heavyweight events on the schedule. US consumer inflation data for March has the potential to shift market expectations regarding the Fed's rate path. While headline CPI is expected to drop for the ninth consecutive month to 5.2%, core inflation is forecast to break its five-month downward trend and rise to 5.6%. Currently, fed funds futures indicate a 67% chance of another 25bps hike in May. But more importantly, there is also near 57% chance a cut in July. Both probabilities could be influenced notably by today's data.
As for central bank events, BoC is widely expected to continue its pause and keep interest rates at 15-year high of 4.50%. Given Governor Tiff Macklem's indication that an "accumulation of evidence" would be necessary before considering resuming tightening, the odds of a surprise move are slim. Nevertheless, the tone of the statement may provide hints regarding the possibility of an additional rate hike later this year. Meanwhile, the release of FOMC's March meeting minutes is unlikely to reveal anything substantial.
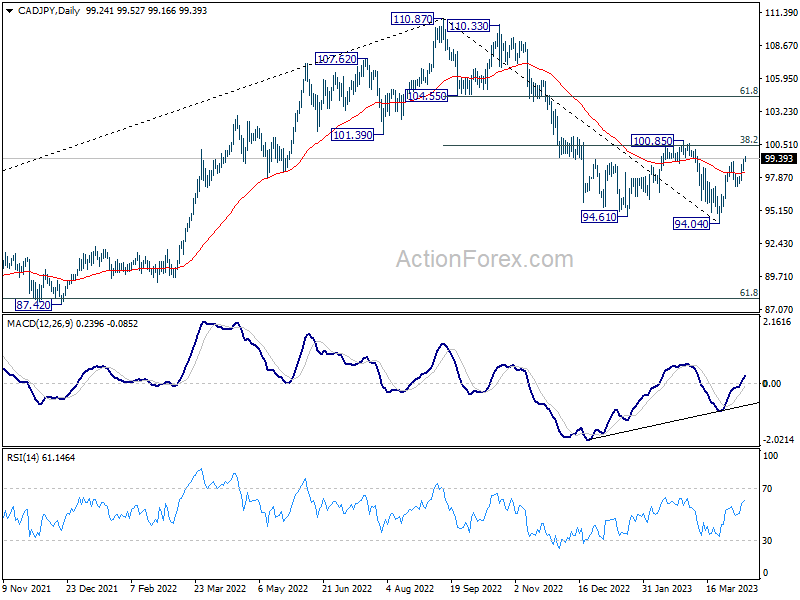
In currency markets, Canadian Dollar is currently the strongest performer for the week, followed by Swiss Franc and Euro. Japanese Yen is the weakest, trailed the New Zealand Dollar and US Dollar. Technically, CAD/JPY's rebound from 94.04 low resumed this week by breaking through 99.16 resistance. Further rally is now anticipated to reach 100.85 resistance zone (38.2% retracement of 110.82 to 94.04 at 100.46). Strong resistance should emerge there to limit upside, at least on first attempt. However, sustained break of this level could trigger a more robust rally to 61.8% retracement at 104.44, even just as the second leg of the pattern from 110.87 high.
In Asia, at the time of writing, Nikkei is up 0.62%. Hong Kong HSI is down -0.59%. China Shanghai SSE is up 0.47%. Singapore Strait Times is down -0.40%. Japan 10-year JGB yield is up 0.0129 at 0.467. Overnight, DOW rose 0.29%. S&P 500 closed flat. NASDAQ dropped -0.43%. 10-year yield rose 0.019 to 3.434.
Fed's Goolsbee urges prudence and patience amid financial stress
Chicago Fed President Austan Goolsbee stressed the importance of a cautious approach to monetary policy during times of financial stress. He stated yesterday, "At moments like this, of financial stress, the right monetary approach calls for prudence and patience - for assessing the potential impact of financial stress on the real economy."
Goolsbee highlighted the need to understand credit tightening before Fed's next meeting in May, saying, "The foremost thing on my mind before our next meeting in May is trying to get a handle on this question about credit: is it actually credit tightening?"
Emphasizing the current uncertainty, Goolsbee urged caution, adding, "We should gather further data and be careful about raising rates too aggressively until we see how much work the headwinds are doing for us in getting down inflation." He noted that if the response to recent banking issues leads to financial tightening, "monetary policy has to do less."
Fed's Harker supports hiking rates above 5% before assessing disinflation progress
Philadelphia Fed Bank President Patrick Harker expressed his support for raising interest rates above 5% and then assessing the impact on inflation. He noted yesterday, "I'm in the camp of getting up above 5 and then sitting there for a while."
Harker acknowledged that recent inflation readings showed a slow disinflation process, which he described as "disappointing." Despite this, he pointed out promising signs that Fed's rate hikes are working.
He stated, "If we see inflation not budging, then I think we'll have to take more action. But at this point, I don't see why we would just continue to go up, up, up and then go, whoops! And then go down, down, down very quickly. Let's sit there."
Harker also emphasized the commitment to bringing inflation back down to the 2% target and highlighted that the full impact of monetary policy actions could take up to 18 months to work through the economy. He said, "We will continue to look closely at available data to determine what, if any, additional actions we may need to take."
Fed's Kashkari cautions against potential economic downturn and recession
Minneapolis Federal Reserve Bank President Neel Kashkari warned that tightening credit conditions due to banking stress and monetary policy actions could lead to an economic downturn or even a recession.
He said, "It could be that our monetary policy actions and the tightening of credit conditions because of this banking stress lead to an economic downturn. That might even lead to a recession."
Kashkari acknowledged that bond markets seem to expect a quick drop in inflation, allowing Fed to cut rates. However, he expressed less optimism, predicting inflation to reach "the mid threes" by the end of the year, which remains above the Fed's 2% target.
Regarding recent financial stress, Kashkari cautiously noted that there are hopeful signs that risks are better understood and calm is being restored, but he is not yet ready to declare all clear.
ECB's Villeroy warns of entrenched inflation risk, shifts focus to long-distance race
ECB Governing Council member Francois Villeroy de Galhau has warned of the risk of entrenched inflation yesterday, stating, "We now face the risk of entrenched inflation, which lies in the underlying or core component. In other words, inflation has become more widespread, and potentially more persistent."
Villeroy emphasized that the ECB's monetary policy response to rising inflation has been strong and swift. However, he also noted a shift in focus, saying, "We at the ECB are now moving from a 'sprint' to a 'long-distance race'." He added that the inflation outlook, underlying inflation readings, and the effectiveness of policy transmission will be the key factors in upcoming decisions on potential new rate hikes.
USD/CHF Daily Outlook
Daily Pivots: (S1) 0.9006; (P) 0.9055; (R1) 0.9081; More...
USD/CHF is staying in range above 0.9005 and intraday bias stays neutral first. With 0.9118 resistance intact, further decline is expected. On the downside, break of 0.9005 and sustained trading below 38.2% projection of 1.0146 to 0.9058 from 0.9439 at 0.9023 will extend the down trend from 1.0146 to 61.8% projection at 0.8767. However, firm break of 0.9118 will indicate short term bottoming, and turn bias to the upside for stronger rebound.
In the bigger picture, outlook will stay bearish as long as 0.9439 resistance holds, and fall from 1.1046 (2022 high) is still in progress. Prior rejection by 55 week EMA was a medium term bearish sign. Sustained of 0.9058 will resume such decline towards 0.8756 support (2021 low). But overall, this fall is still as a leg in the long term range pattern from 1.0342 (2016 high). So, downside should be contained by 0.8756 to bring reversal.
Economic Indicators Update
| GMT | Ccy | Events | Actual | Forecast | Previous | Revised |
|---|---|---|---|---|---|---|
| 23:50 | JPY | Bank Lending Y/Y Mar | 3.00% | 3.60% | 3.30% | |
| 23:50 | JPY | PPI Y/Y Mar | 7.20% | 7.10% | 8.20% | |
| 23:50 | JPY | Machinery Orders M/M Feb | -4.50% | -7.80% | 9.50% | |
| 12:30 | USD | CPI M/M Mar | 0.30% | 0.40% | ||
| 12:30 | USD | CPI Y/Y Mar | 5.20% | 6.00% | ||
| 12:30 | USD | CPI Core M/M Mar | 0.40% | 0.50% | ||
| 12:30 | USD | CPI Core Y/Y Mar | 5.60% | 5.50% | ||
| 14:00 | CAD | BoC Interest Rate Decision | 4.50% | 4.50% | ||
| 14:30 | USD | Crude Oil Inventories | -1.0M | -3.7M | ||
| 15:00 | CAD | BoC Press Conference | ||||
| 18:00 | USD | FOMC Minutes |
ECB’s Villeroy warns of entrenched inflation risk, shifts focus to long-distance race
ECB Governing Council member Francois Villeroy de Galhau has warned of the risk of entrenched inflation yesterday, stating, "We now face the risk of entrenched inflation, which lies in the underlying or core component. In other words, inflation has become more widespread, and potentially more persistent."
Villeroy emphasized that the ECB's monetary policy response to rising inflation has been strong and swift. However, he also noted a shift in focus, saying, "We at the ECB are now moving from a 'sprint' to a 'long-distance race'." He added that the inflation outlook, underlying inflation readings, and the effectiveness of policy transmission will be the key factors in upcoming decisions on potential new rate hikes.
Technical Outlook and Review
DXY:
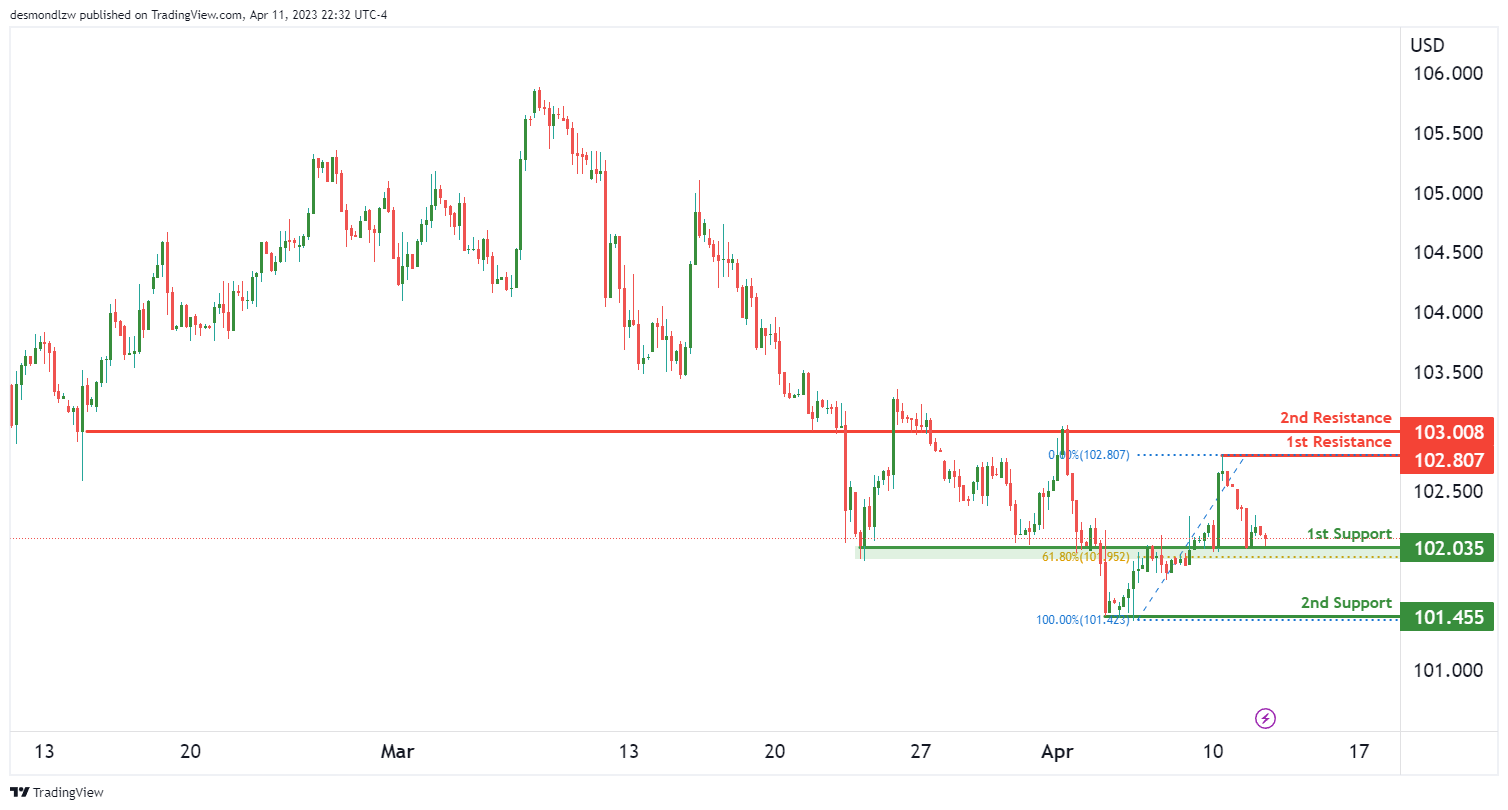
Looking at the DXY chart, the overall momentum of the chart is bearish. There is a potential for a bearish break off the 1st support level at 102.03, which is an overlap support level and coincides with the 61.80% Fibonacci retracement level. If price were to drop from this level, it could potentially fall towards the 2nd support level at 101.45, which is a multi-swing low support level.
On the upside, there are two good resistance levels to watch out for. The 1st resistance level is at 102.80, which is a swing high resistance level. The 2nd resistance level is at 103.00, which is an overlap resistance level.
If the bearish momentum continues, we may see price drop from the 1st support towards the 2nd support. However, if price manages to break above the 1st resistance level, we could see it rise towards the 2nd resistance level. It’s important to note that the overall bias of the chart is bearish, so a bearish breakout from the 1st support level is more likely.
EUR/USD:
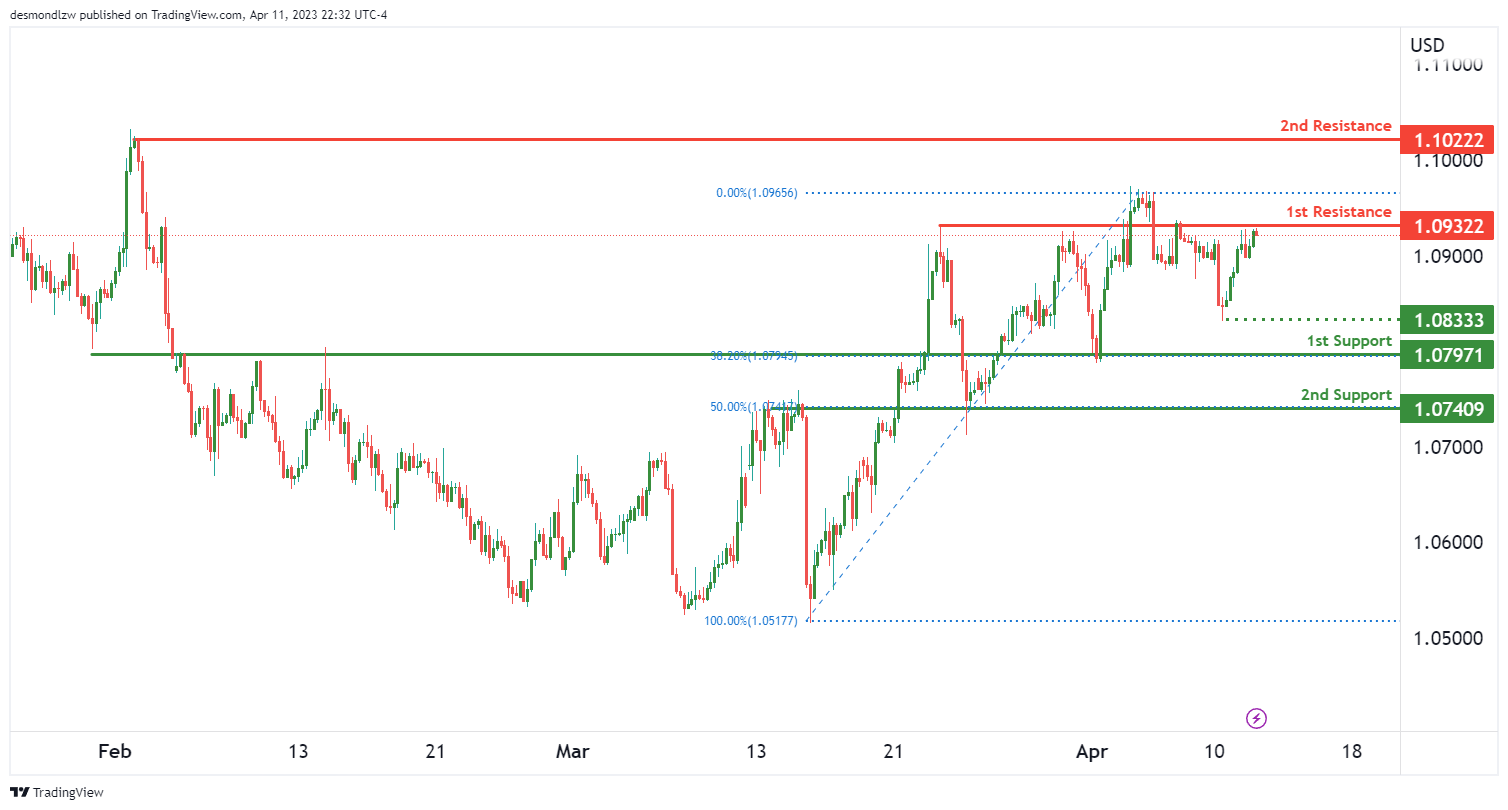
The EUR/USD chart is currently bearish. Price may potentially make a bearish reaction off the 1st resistance level and drop towards the 1st support level.
The 1st support level is at 1.0797, which is a strong overlap support level and also coincides with the 38.20% Fibonacci retracement level. The 2nd support level is at 1.0740, which is another overlap support level and also coincides with the 50% Fibonacci retracement level. These are both good levels for price to potentially bounce off of if it were to drop.
On the other hand, the 1st resistance level is at 1.0932, which is an overlap resistance level. The 2nd resistance level is at 1.1022, which is a swing high resistance level. If price were to break above the 1st resistance, it could potentially rise towards the 2nd resistance. However, if price were to drop below the 1st support, it could fall towards the 2nd support.
In addition to these levels, there is an intermediate support level at 1.0833, which is a swing low support level
GBP/USD:
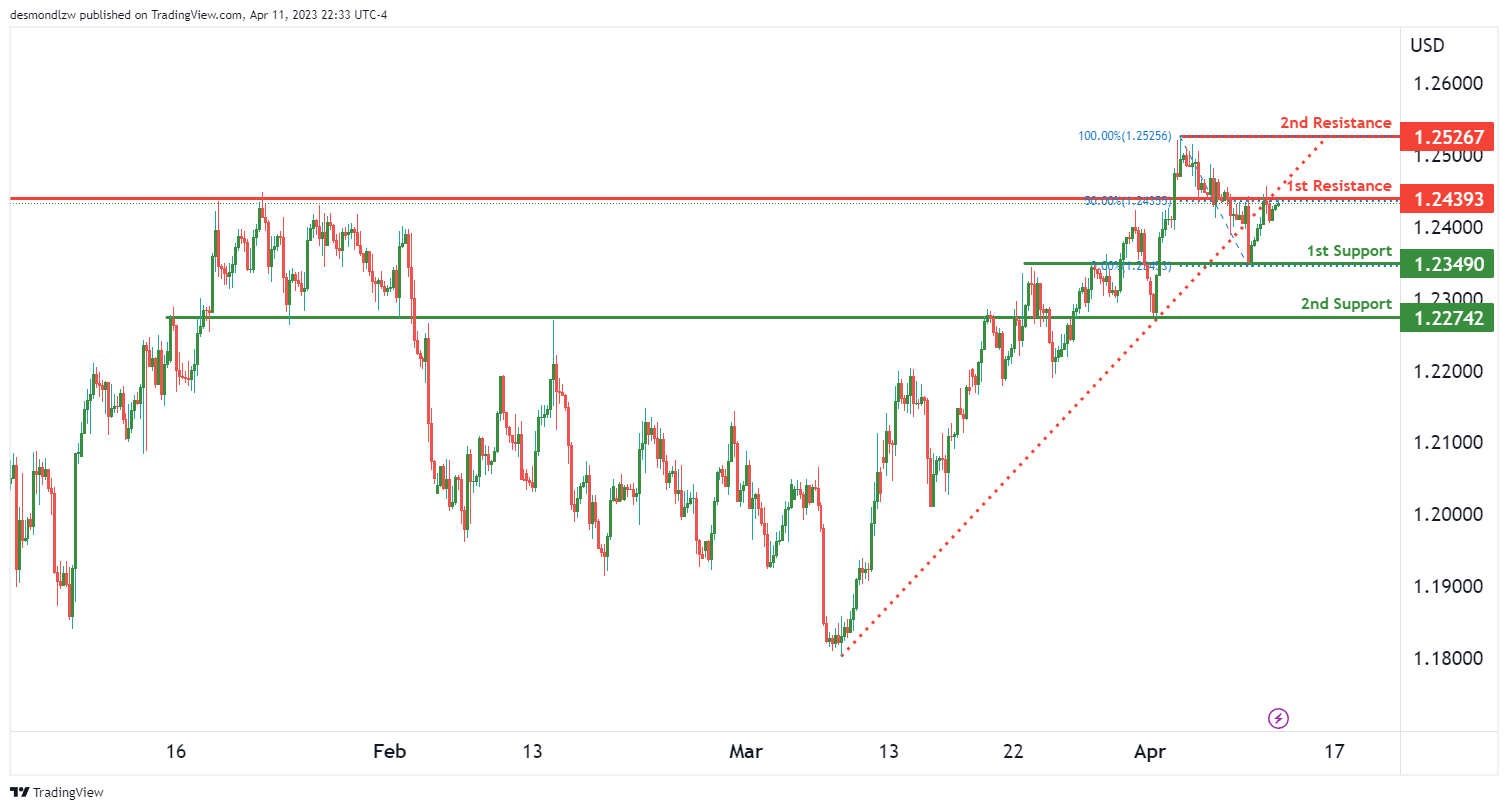
The GBP/USD currency pair is currently showing bearish momentum on the chart, with the price having broken below an ascending support line, which could indicate the potential for a bearish move. If the price continues to trend downwards, it could potentially make a bearish reaction off the first resistance level and drop to the first support level.
The first support level is at 1.2349, and it is an overlap support level, which means that it has acted as support in the past and may do so again in the future.
The second support level is at 1.2274 and is also an overlap support level. If the price were to continue falling, it could potentially find support at this level as well.
The first resistance level is at 1.2439, and it is an overlap resistance level that coincides with the 50% Fibonacci retracement level. If the price were to rise and reach this level, it could potentially face resistance and begin to drop towards the support levels.
The second resistance level is at 1.2526, and it is a multi-swing high resistance level, which means that it has acted as resistance in the past and may continue to do so in the future.
USD/CHF:
USD/CHF Could Potentially Continue its Bearish Momentum
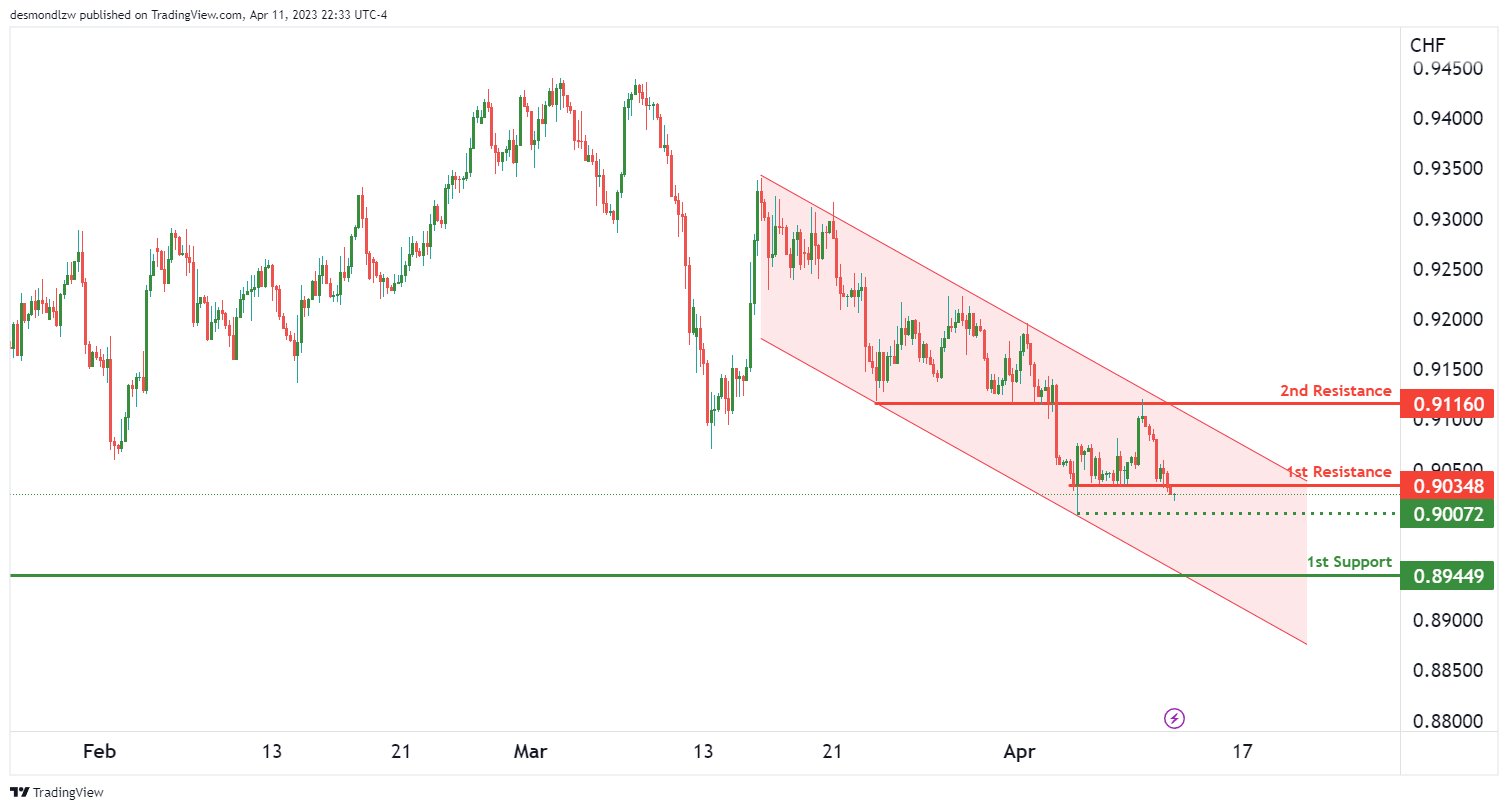
The overall momentum of USD/CHF’s chart is currently bearish, with price currently in a descending channel. This bearish momentum may continue as long as price remains within this channel.
If we take a look at the current price action, it suggests that USD/CHF could potentially drop towards the 1st support level at 0.8944. This level is a strong overlap support, making it a good potential target for a bearish move. Another support level to watch out for is the intermediate support at 0.9007, which is a swing low support.
On the other hand, if price manages to break out of the descending channel, it may rise towards the 1st resistance level at 0.9034. This level is a pullback resistance and could potentially act as a ceiling for bullish price action. A break above this level may push price towards the 2nd resistance level at 0.9116, which is an overlap resistance.
USD/JPY:
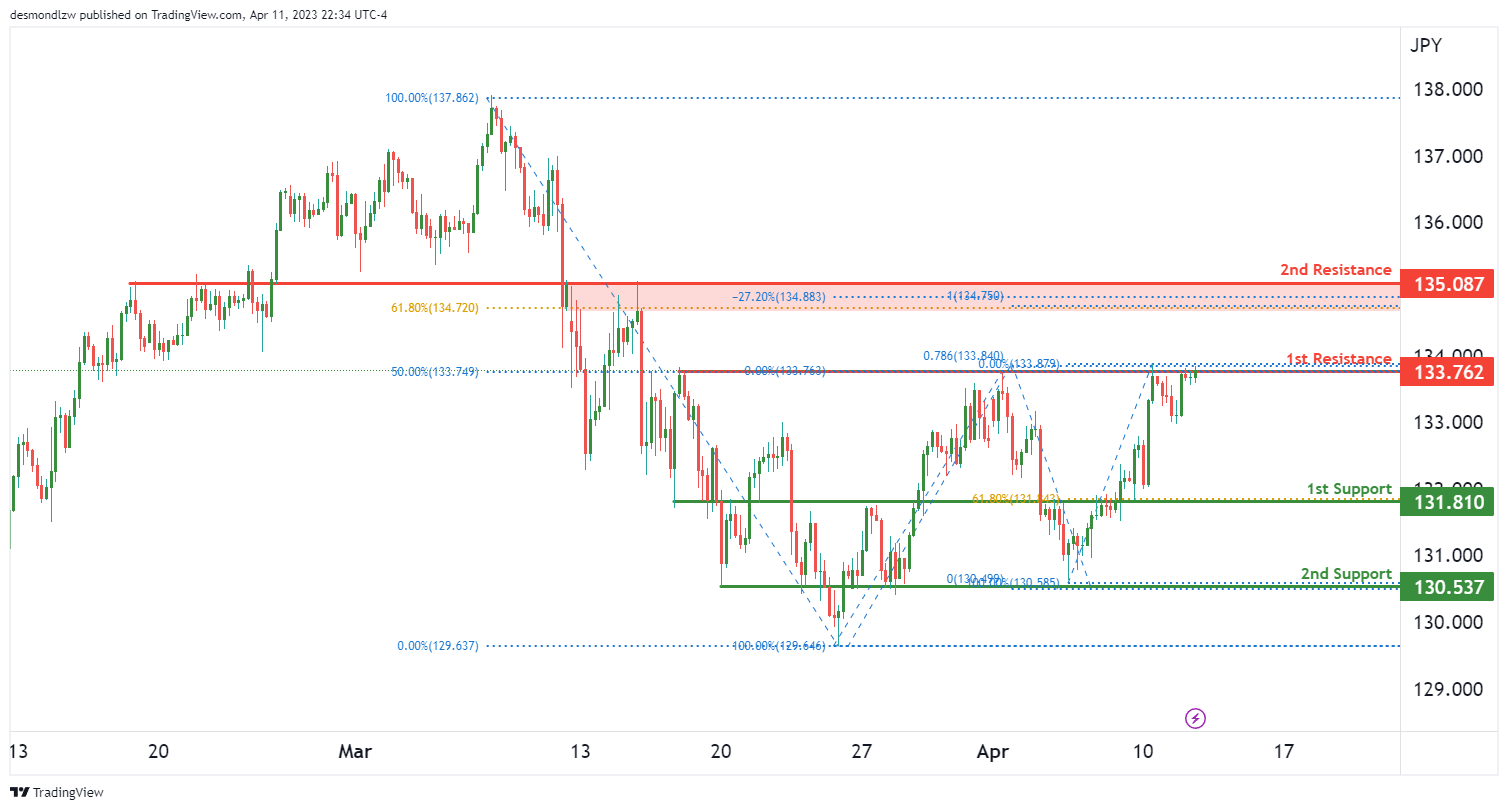
USD/JPY continues to see bearish momentum as the overall bias remains bearish. The price is potentially going to make a bearish reaction off the 1st resistance at 133.7600 and drop to the 1st support at 131.8100.
The 1st support level at 131.8100 is a strong overlap support, and it also coincides with the 61.80% Fibonacci retracement level, which makes it a critical support level for the pair. If the price bounces from this support level, it could potentially rise towards the 1st resistance at 133.7600.
However, if the price fails to hold at the 1st support level, the next support level it could drop to is the 2nd support at 130.5300, which is also an overlap support level.
In terms of resistance, the 1st resistance level at 133.7600 is an overlap resistance level, and it coincides with the 50% Fibonacci retracement level, making it a strong resistance level for the pair. If the price breaks through this resistance level, it could potentially rise towards the 2nd resistance at 135.0800, which is another overlap resistance level and coincides with the 61.80% Fibonacci retracement level.
AUD/USD:
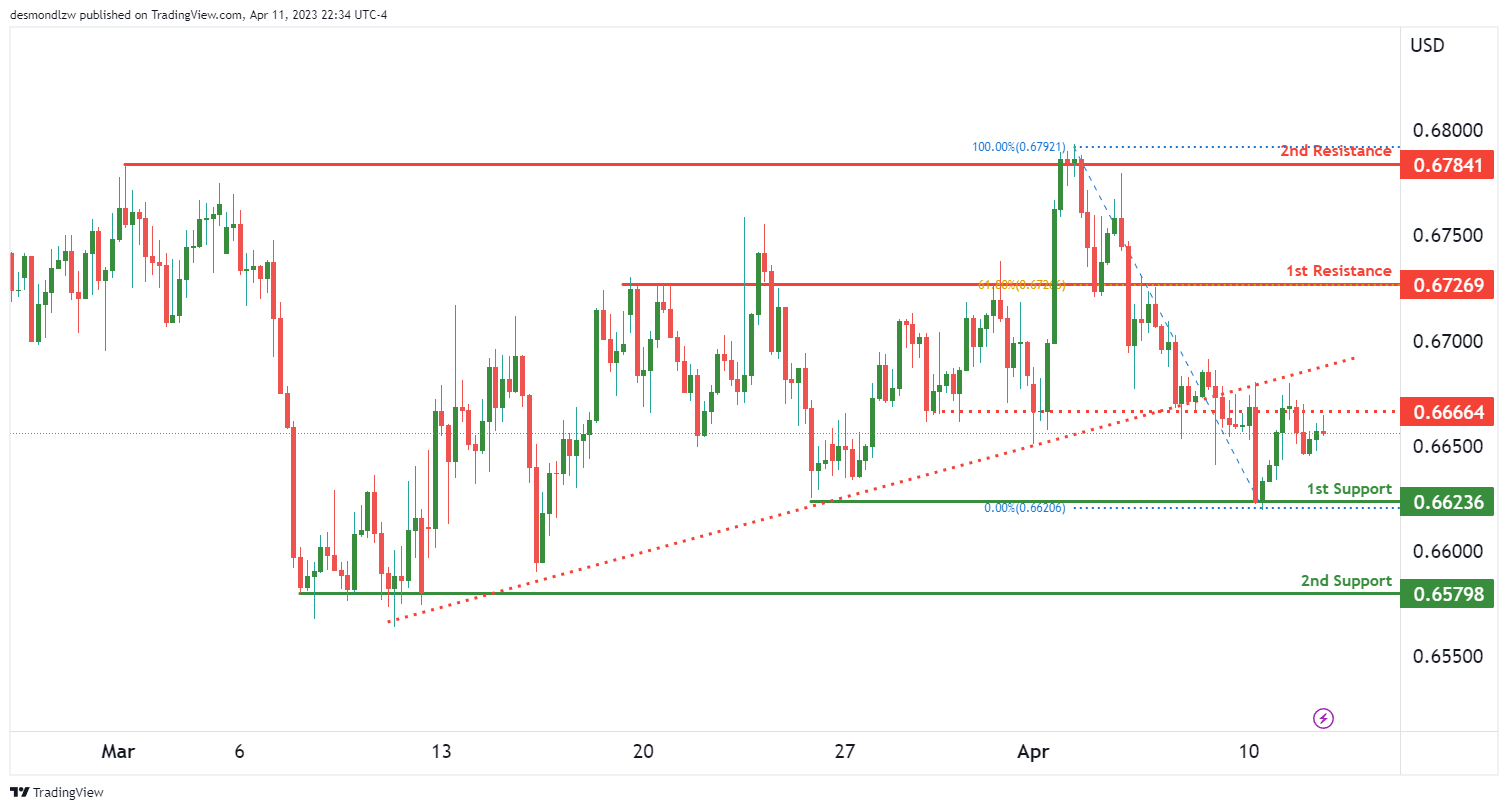
The AUD/USD chart is currently showing a bearish bias, as price is below a major descending trend line, indicating that bearish momentum may be on the horizon.
If price were to continue its bearish trend, it could potentially react off the 1st resistance at 0.6726 and drop towards the 1st support at 0.6623, which is a multi-swing low support level. If this level is broken, the next support could be the 2nd support at 0.6579, which also happens to be a multi-swing low support level.
On the other hand, if price were to break above the 1st resistance, it could potentially rise towards the 2nd resistance at 0.6784, which is a multi-swing high resistance level.
It’s worth noting that there is an intermediate resistance at 0.6666, which is between the current price and the 1st resistance. If price were to break this intermediate resistance, it could potentially trigger a stronger bullish acceleration towards the 2nd resistance.
NZD/USD:
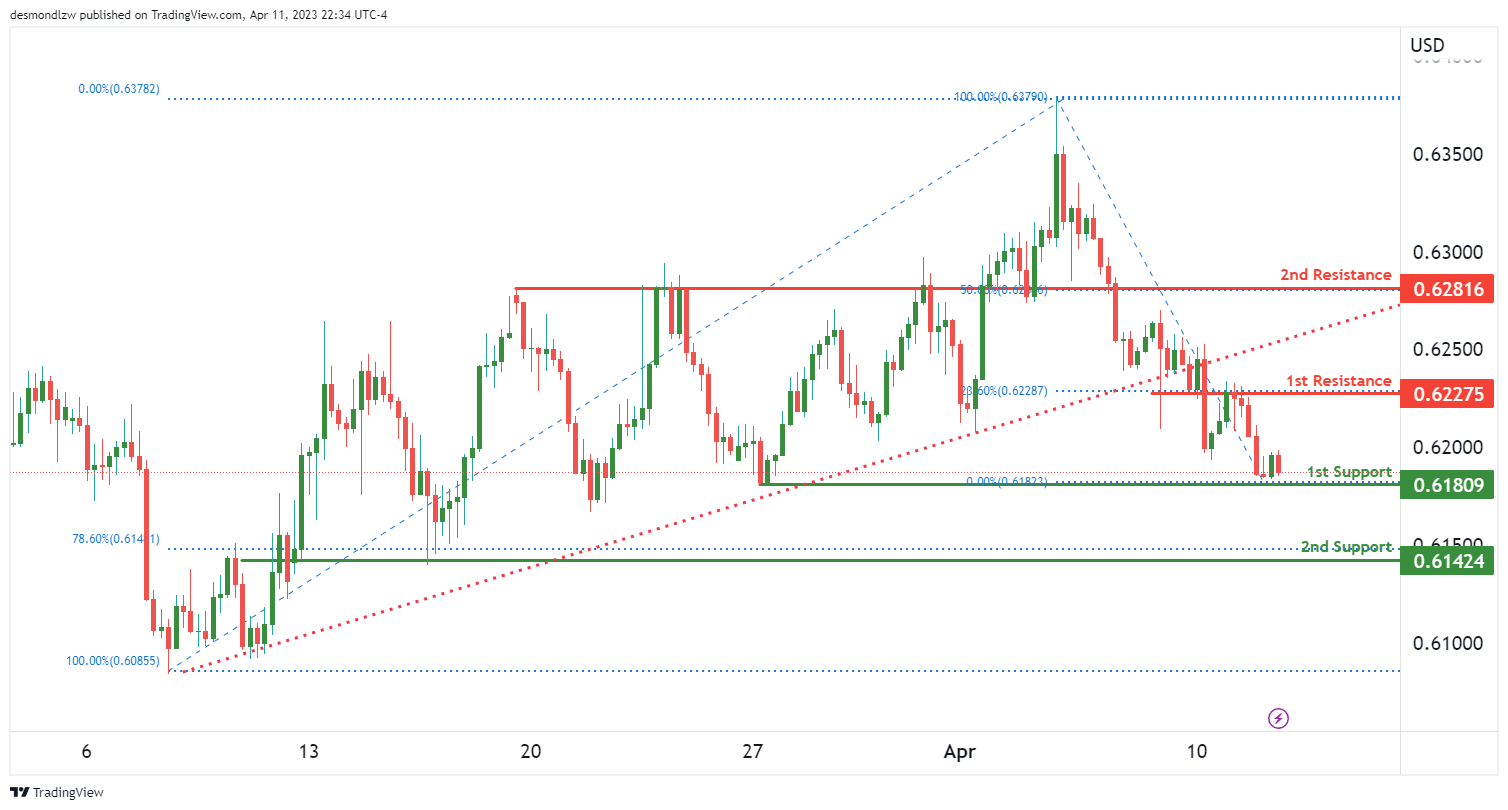
The NZD/USD currency pair has a bearish overall momentum, with the price currently below a major descending trend line. This suggests that bearish momentum is on the cards, and the price could potentially make a bearish break off the first support level and drop towards the second support level.
The first support level for NZD/USD is at 0.6180, which is a multi-swing low support. This level has held as support in the past and could potentially provide a bounce for the price. However, if the price were to break below this level, it could drop towards the second support level at 0.6142. This level is an overlap support and lines up with the 78.60% Fibonacci retracement, making it a strong potential support level.
On the resistance side, the first resistance level for NZD/USD is at 0.6227. This is an overlap resistance level and lines up with the 23.60% Fibonacci retracement. If the price were to break above this level, it could potentially rise towards the second resistance level at 0.6281. This level is also an overlap resistance level and lines up with the 50% Fibonacci retracement.
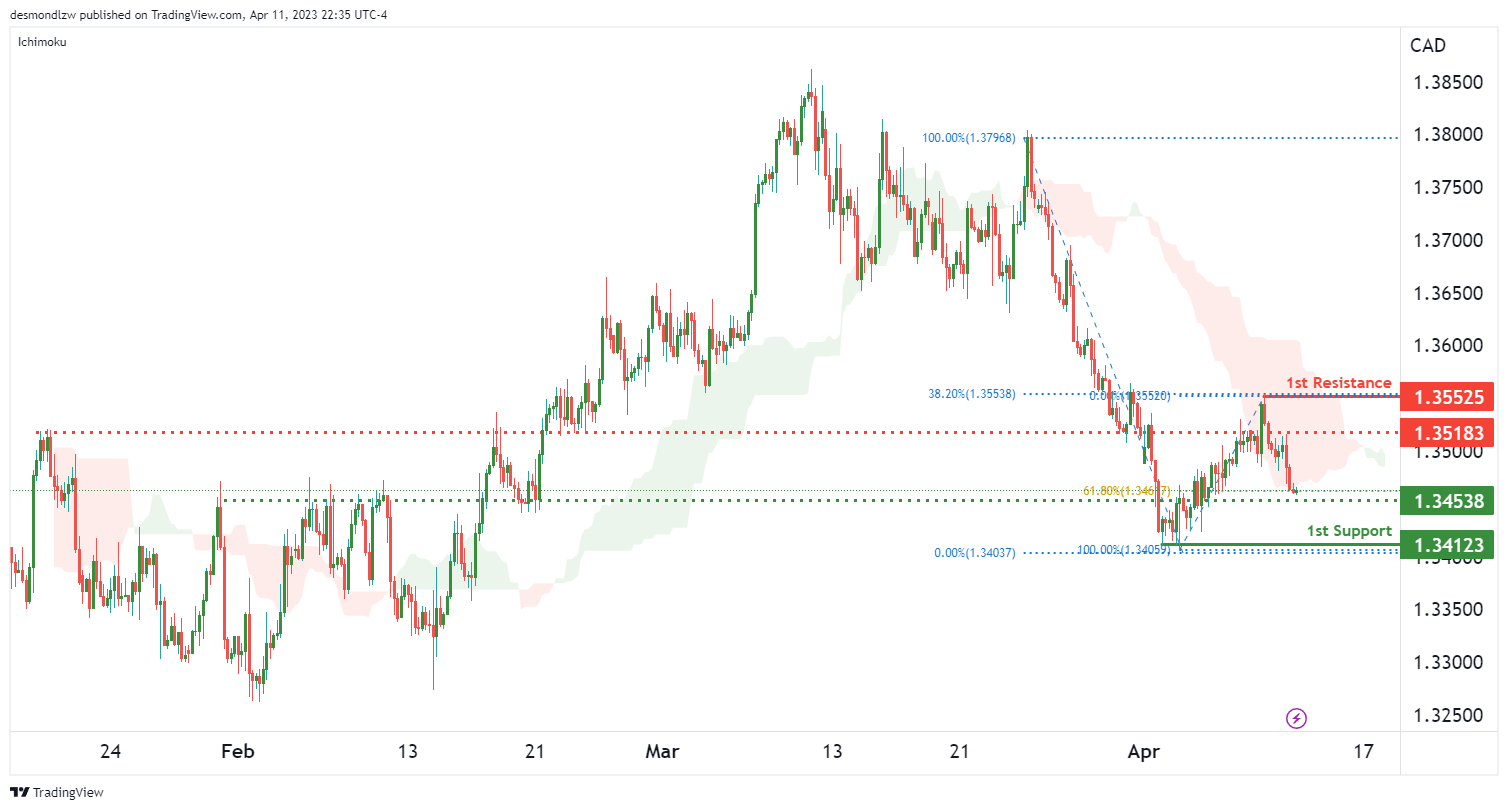
USD/CAD:
USD/CAD is currently exhibiting a bearish momentum, with price below the bearish Ichimoku cloud. This suggests a potential continuation of the downtrend.
If the bearish momentum continues, we may see a potential drop towards the 1st support at 1.3412, which is a multi-swing low support. Another potential support level to watch out for is the intermediate support at 1.3453, which is an overlap support and coincides with a 61.80% Fibonacci retracement.
On the other hand, in the event of a bullish reversal, USD/CAD may encounter resistance at the 1st resistance level of 1.3553. This is an overlap resistance level and lines up with a 38.20% Fibonacci retracement. Another potential resistance level to watch out for is the intermediate resistance at 1.3518, which is also an overlap resistance.
DJ30:
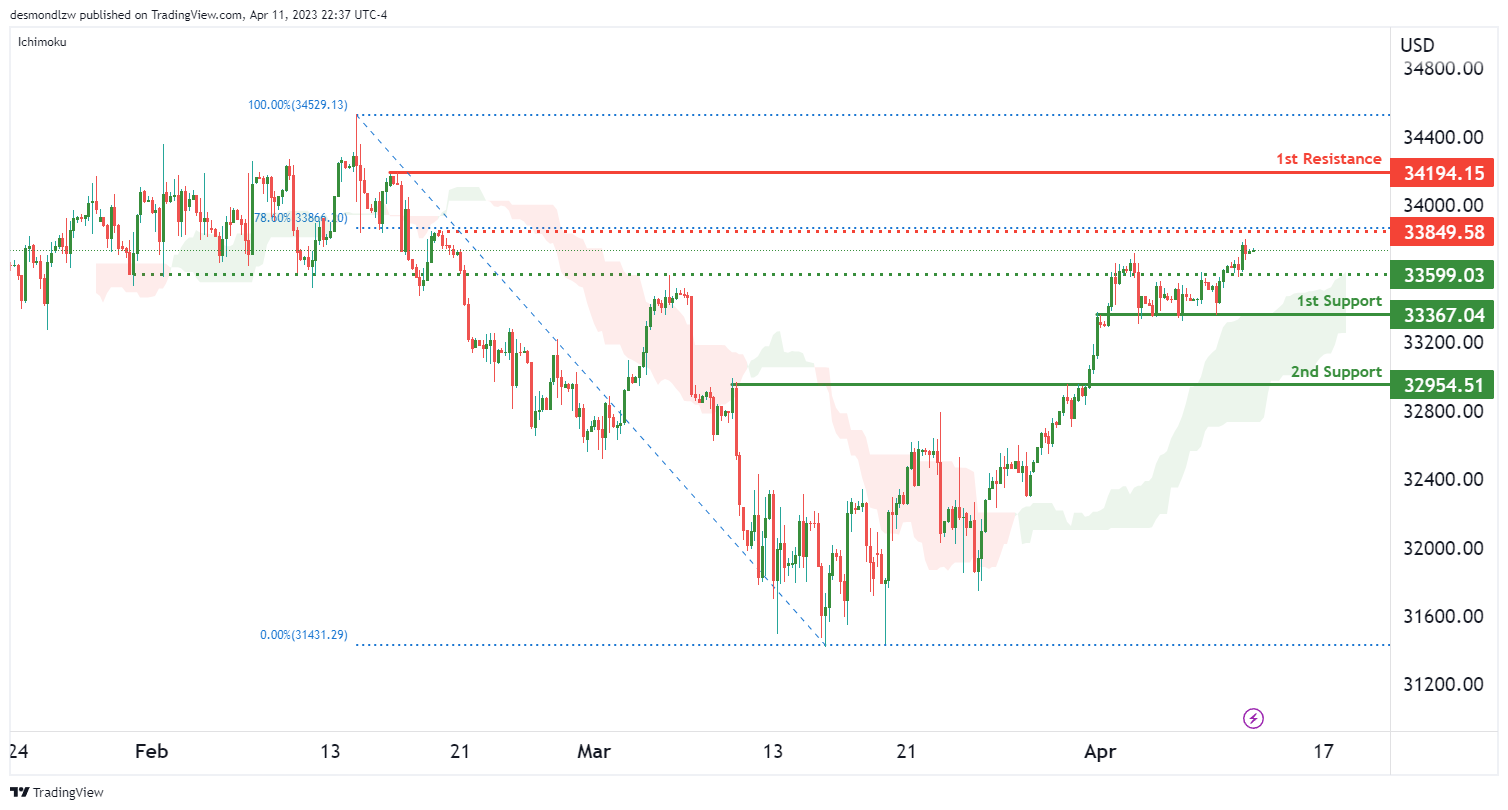
The DJ30 has shown overall bullish momentum as it has remained above the bullish Ichimoku cloud. This suggests that there might be further potential for prices to rise. There are a number of support and resistance levels that could potentially influence price action.
The first support level is at 33367.04, which is a strong overlap support level. Additionally, there is a pullback support level at 32954.51, which could provide further support in case of a price pullback. On the other hand, the first resistance level is at 34194.15, which is a significant swing high resistance level. If price were to break this level, it could potentially trigger a strong bullish momentum. In between the current price and the first resistance, there is an intermediate resistance level at 33849.58, which is an overlap resistance level and also lines up with a 78.60% Fibonacci retracement.
If price were to experience a pullback, it could potentially find support at the intermediate support level of 33567.03, which is also an overlap support level. Overall, the current momentum suggests further bullish continuation towards the first resistance level, but price action around the intermediate resistance and support levels should be closely monitored.
GER30:
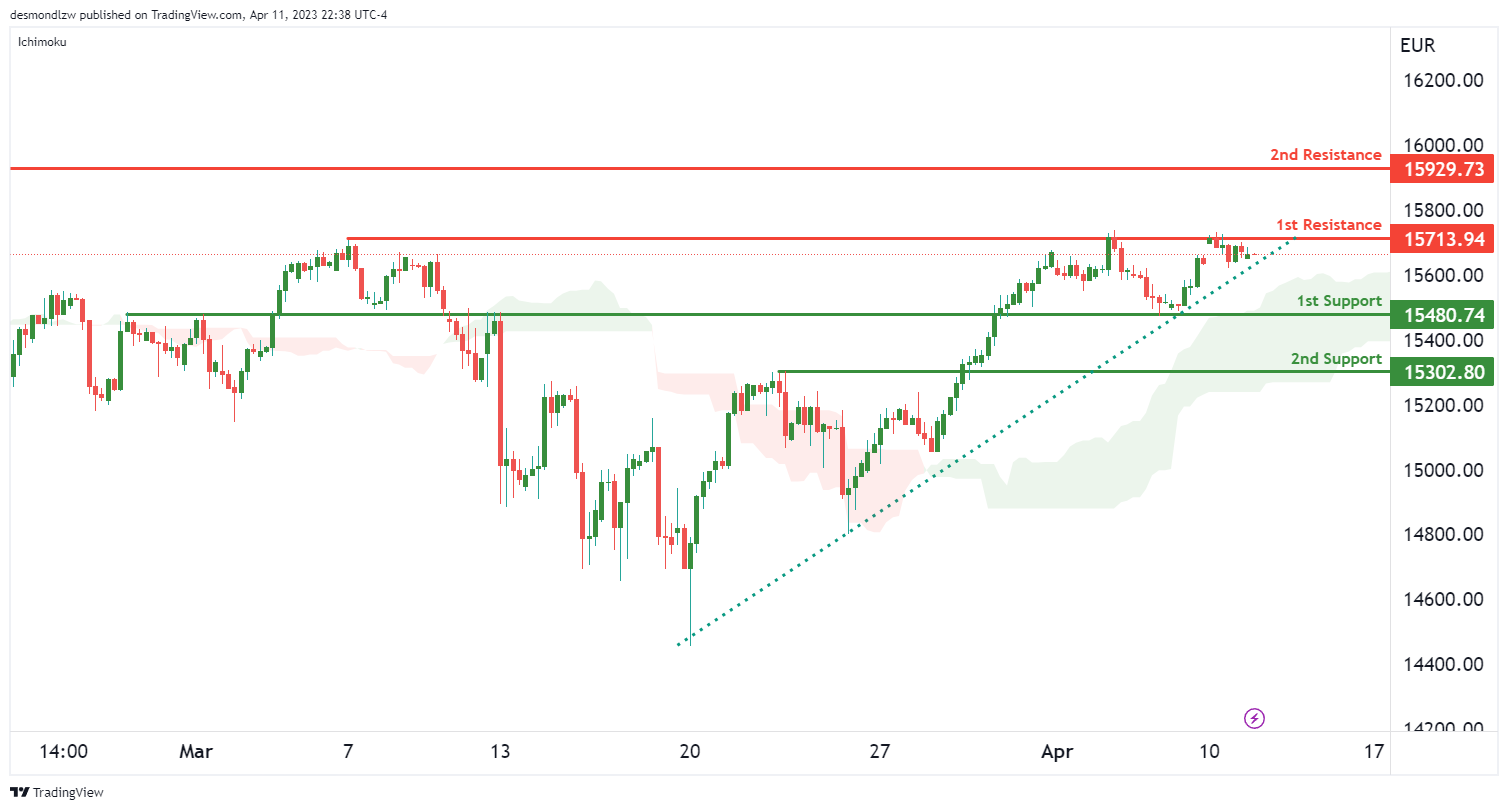
The GER30 chart shows strong bullish momentum, with price currently above the bullish Ichimoku cloud and above a major ascending trend line, which suggests further bullish momentum is likely.
Price could potentially make a bullish continuation towards the 1st resistance level at 15713.94, which is a pullback resistance level. If price manages to break above this resistance, it could move towards the 2nd resistance level at 15929.73, which is a swing high resistance.
On the downside, the 1st support level is at 15480.74, which is an overlap support level on the ascending trend line acting as support. A bounce from this level could lead to a move towards the 1st resistance level. The 2nd support level is at 15302.80, which is a pullback support level.
BTC/USD:
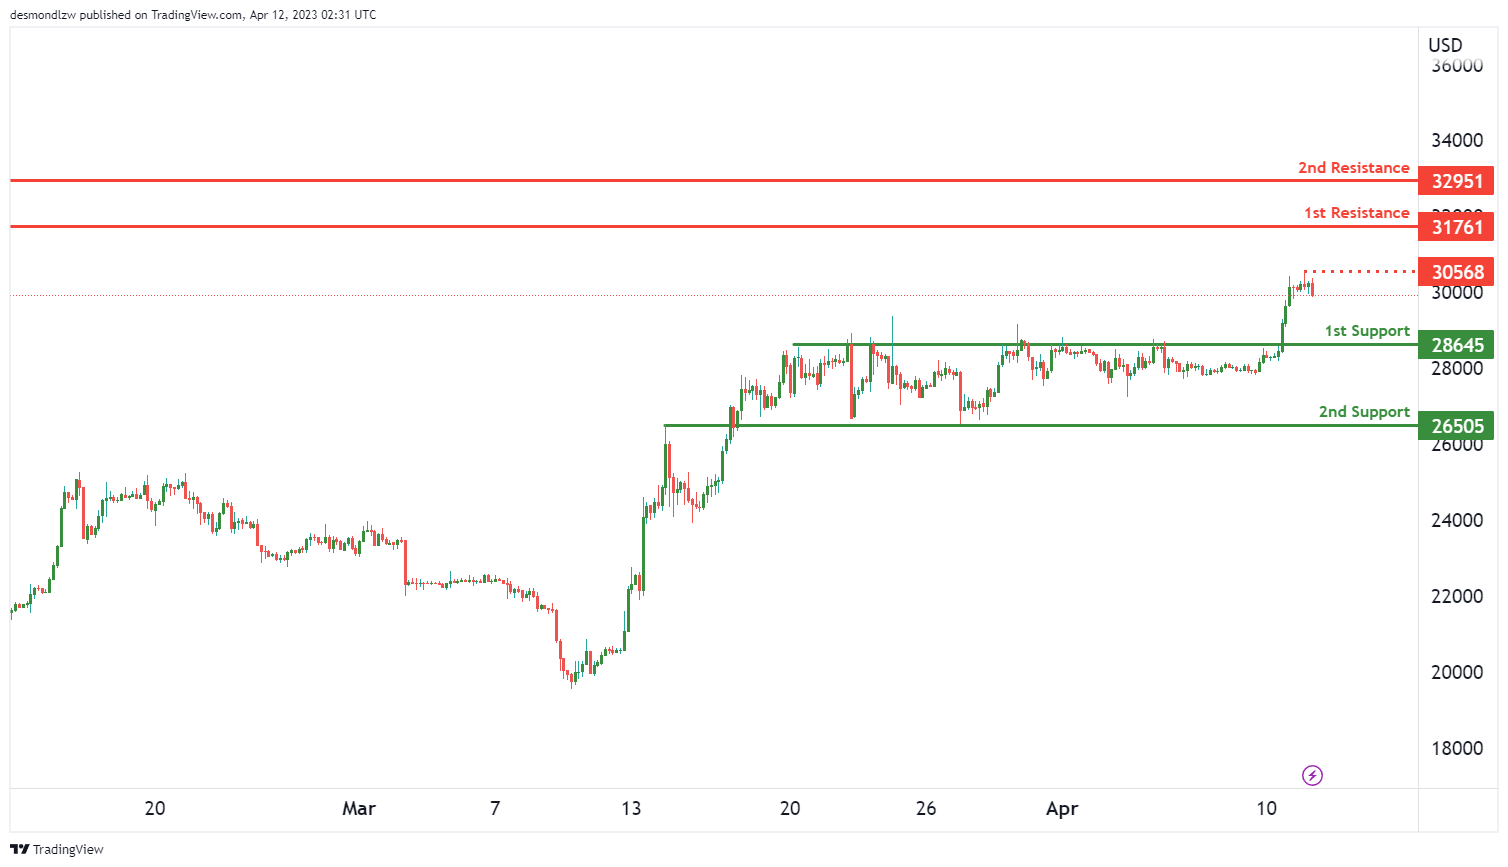
Bitcoin (BTC/USD) is currently experiencing a bullish momentum as seen on the overall chart. Price could potentially continue on this bullish path and aim towards the first resistance level at 31761.00.
In case of a pullback, the first support level is found at 28645.00 which is a strong pullback support. The second support level is at 26505.00 and is an overlap support.
The first resistance level at 31761.00 is a swing high resistance, making it a strong level of resistance. The second resistance level is at 32951.00 and is also a swing high resistance. It is worth noting that there is an intermediate resistance level at 30568.00 which could potentially slow down price action towards the first resistance level.
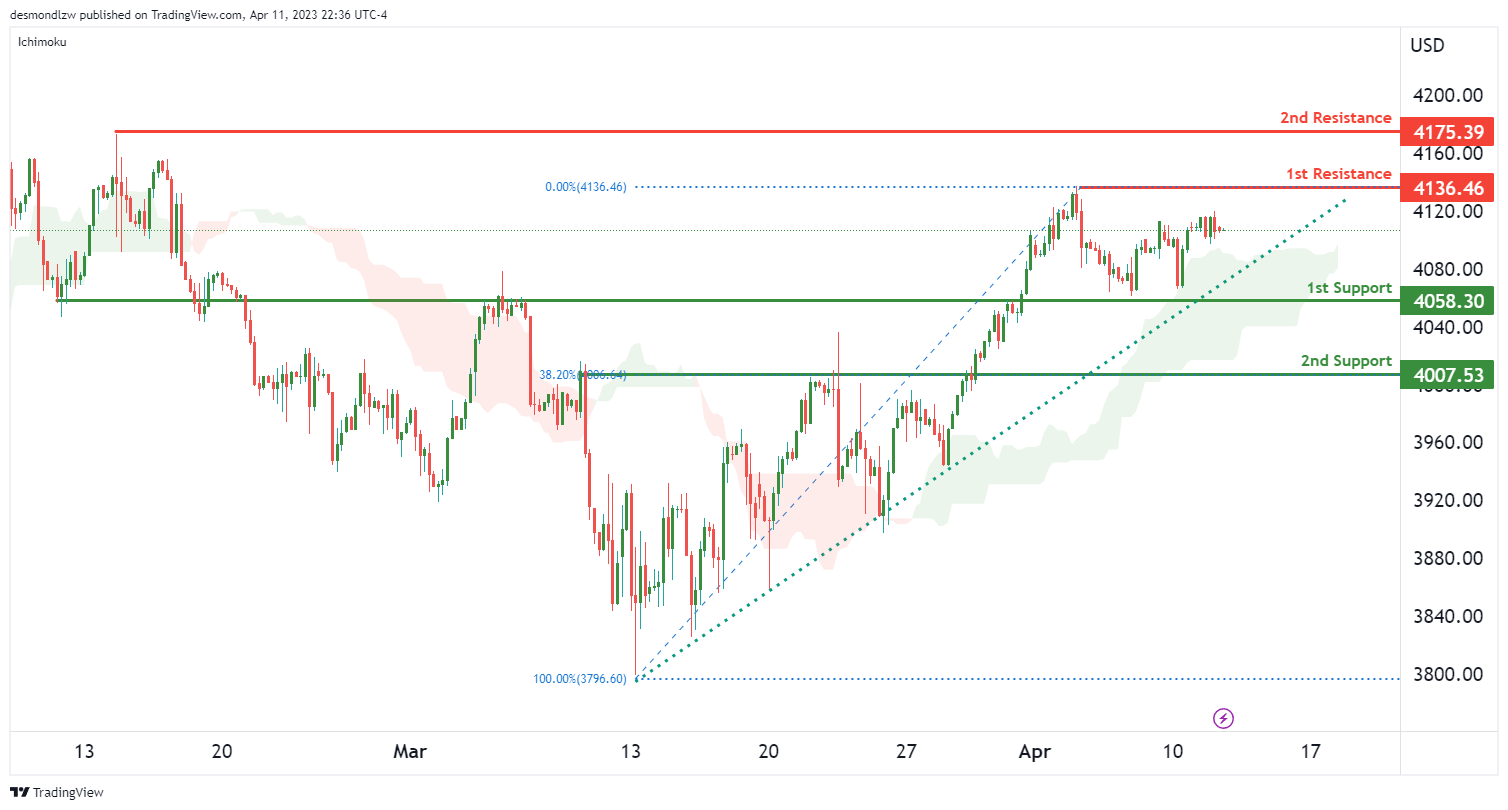
US500
The US500 chart currently displays a strong bullish momentum, as it sits above a major ascending trend line and the bullish Ichimoku cloud. These factors suggest that further bullish momentum could be on the horizon.
In terms of support levels, the first one to consider is the 4058.30 level, which is a strong overlap support and sits on the ascending trend line, further emphasizing its importance. Additionally, it has a 23.6% Fibonacci retracement lining up with it, making it an even stronger level to watch. The second support level to consider is the 4007.53 level, which is a pullback support and has a 38.2% Fibonacci retracement lining up with it.
On the other hand, there are also important resistance levels to watch. The first one is the 4136.46 level, which is a swing high resistance. This level could prove challenging for price to break through, but if it does, it may lead to a bullish continuation towards the next resistance level at 4175.39, another swing high resistance level.
ETH/USD:
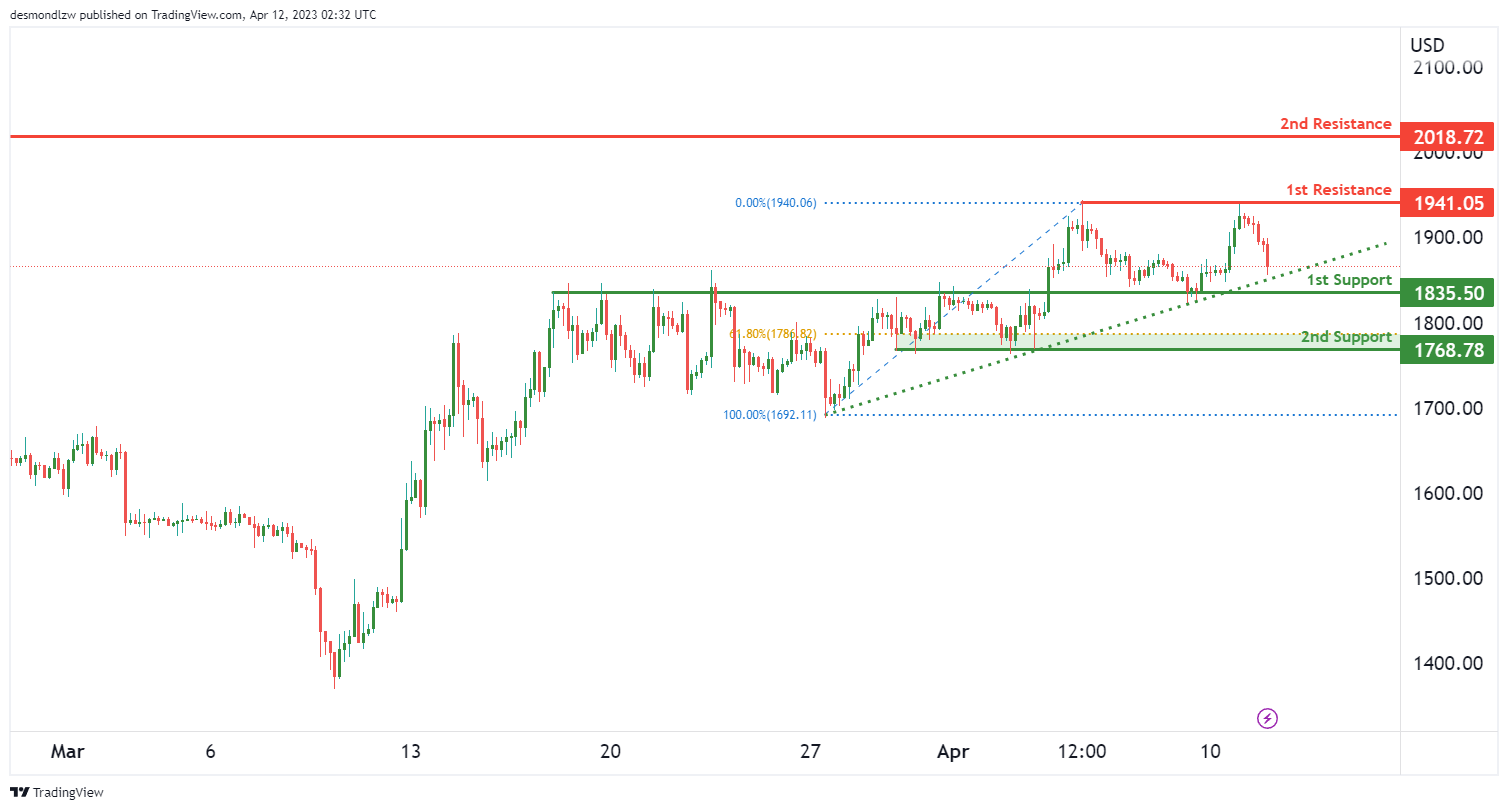
ETH/USD is currently exhibiting bullish momentum, supported by an ascending trend line. However, in the short term, the price could potentially drop to the 1st support level before bouncing back and rising to the 1st resistance level.
The first support level is at 1835.50, and it is a good level for a bounce because it coincides with an overlap support and an ascending trend line that acts as support. If the price drops to this level, it could potentially bounce back up.
The second support level is at 1768.78, and it is also a good level for a bounce because it coincides with a multi-swing low support and a 61.80% Fibonacci retracement.
On the other hand, the first resistance level is at 1941.05, and it is a multi-swing high resistance level. If the price breaks above this level, it could potentially rise to the second resistance level at 2018.72, which is a swing high resistance level.
WTI/USD:
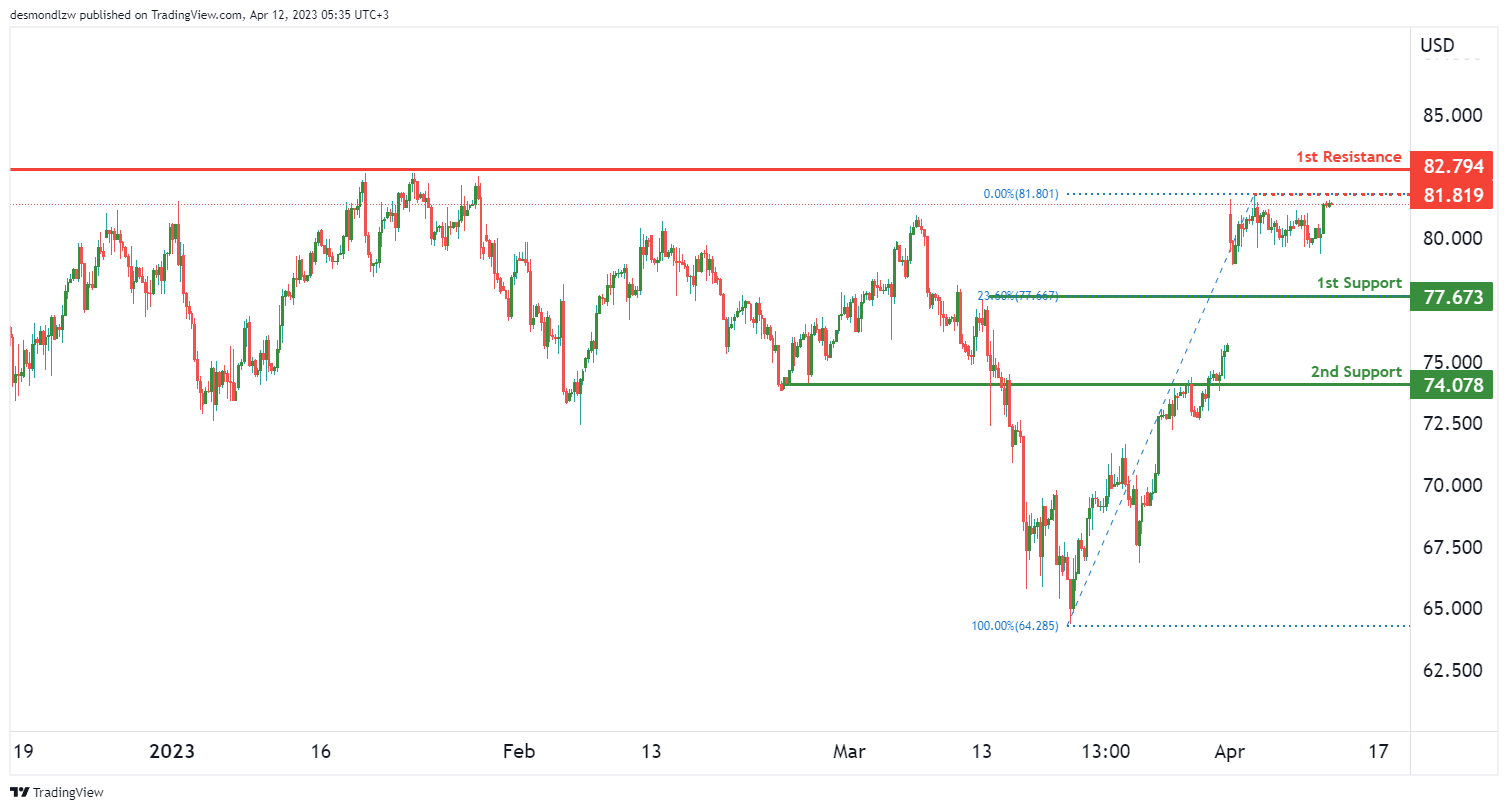
WTI prices have been moving sideways, indicating a neutral momentum. There’s potential for price to continue fluctuating between the 1st resistance at 82.79 and the 1st support at 77.67. The 1st support level is an overlap support and is supported by a 23.60% Fibonacci retracement. A break of the 1st support could trigger a further drop towards the 2nd support at 74.07 which is also an overlap support. On the other hand, a break of the 1st resistance might lead to a bullish acceleration towards the intermediate resistance at 81.81 which is a swing high resistance. Above that, we have the 2nd resistance level at 82.79 which is a multi-swing high resistance. It’s important to note that since the momentum is neutral, there isn’t a clear trend pushing price in a certain direction, therefore breakouts of these levels might not be high conviction in nature
XAU/USD (GOLD):
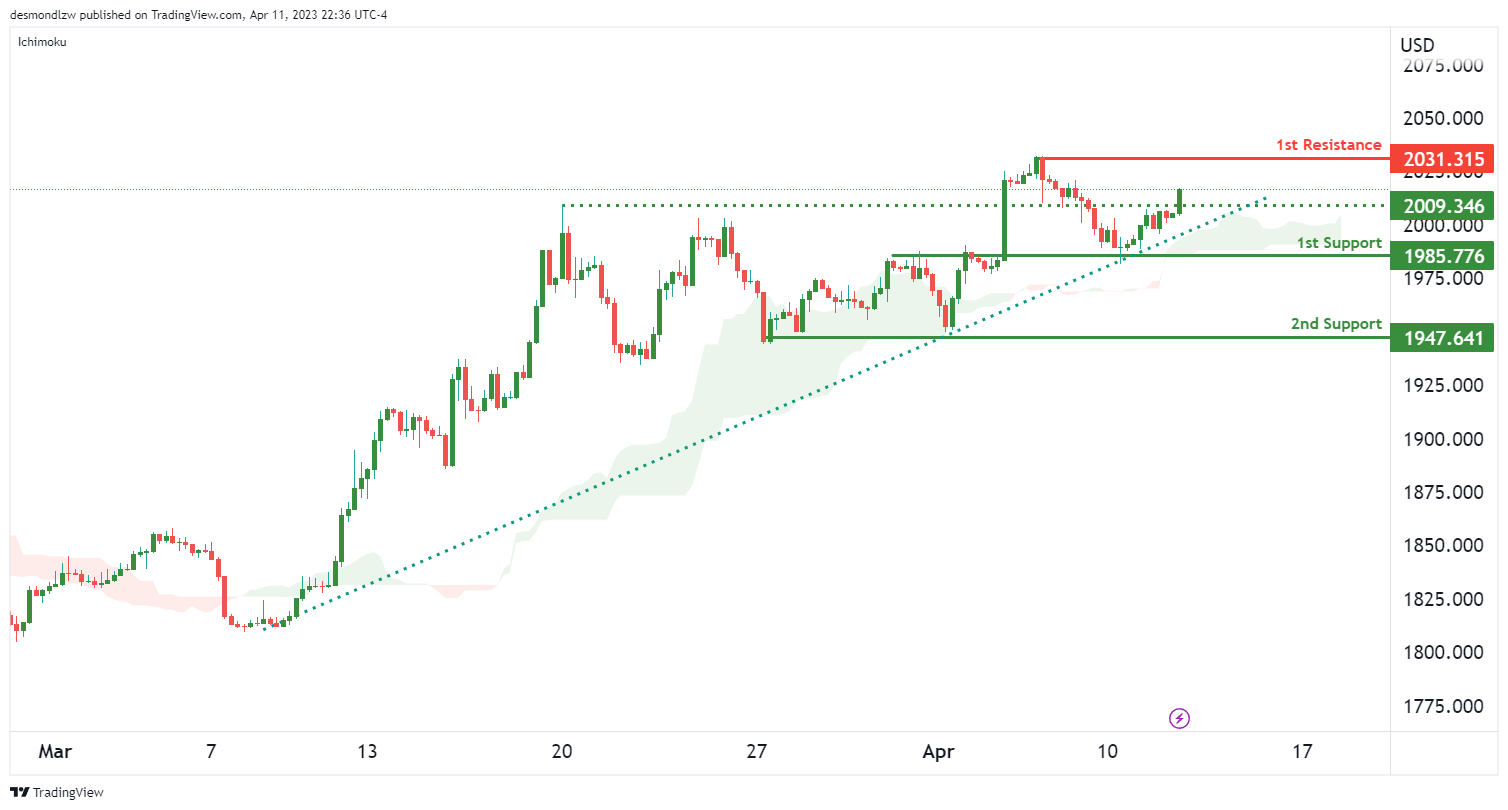
Gold prices have been showing a bullish momentum, being above the Ichimoku cloud and an ascending trend line. This suggests that prices may rise further. In the short term, prices could potentially make a bullish continuation towards the 1st resistance level. The 1st support level is currently at 1985.77, which is a strong overlap support and also lies on the ascending trend line, further supporting its validity. The 2nd support level is at 1947.64, which is a multi-swing low support that price has bounced off multiple times in the past.
On the upside, the 1st resistance level is at 2031.31, which is a swing high resistance that could act as a potential barrier for prices. Additionally, there is an intermediate support at 2009.34, which is a pullback support. If prices were to break below this intermediate support, it could trigger a move down towards the 2nd support at 1947.64.
Overall, the bias for Gold prices is bullish and prices could continue to rise towards the 1st resistance level. However, a break below the intermediate support level could potentially signal a shift in momentum towards the downside.
Fed’s Kashkari cautions against potential economic downturn and recession
Minneapolis Federal Reserve Bank President Neel Kashkari warned that tightening credit conditions due to banking stress and monetary policy actions could lead to an economic downturn or even a recession.
He said, "It could be that our monetary policy actions and the tightening of credit conditions because of this banking stress lead to an economic downturn. That might even lead to a recession."
Kashkari acknowledged that bond markets seem to expect a quick drop in inflation, allowing Fed to cut rates. However, he expressed less optimism, predicting inflation to reach "the mid threes" by the end of the year, which remains above the Fed's 2% target.
Regarding recent financial stress, Kashkari cautiously noted that there are hopeful signs that risks are better understood and calm is being restored, but he is not yet ready to declare all clear.
Fed’s Harker supports hiking rates above 5% before assessing disinflation progress
Philadelphia Fed Bank President Patrick Harker expressed his support for raising interest rates above 5% and then assessing the impact on inflation. He noted yesterday, "I'm in the camp of getting up above 5 and then sitting there for a while."
Harker acknowledged that recent inflation readings showed a slow disinflation process, which he described as "disappointing." Despite this, he pointed out promising signs that Fed's rate hikes are working.
He stated, "If we see inflation not budging, then I think we'll have to take more action. But at this point, I don't see why we would just continue to go up, up, up and then go, whoops! And then go down, down, down very quickly. Let's sit there."
Harker also emphasized the commitment to bringing inflation back down to the 2% target and highlighted that the full impact of monetary policy actions could take up to 18 months to work through the economy. He said, "We will continue to look closely at available data to determine what, if any, additional actions we may need to take."