Sample Category Title
Eurozone PMI services finalized at 51.6, cost pressures stay on ECB radar
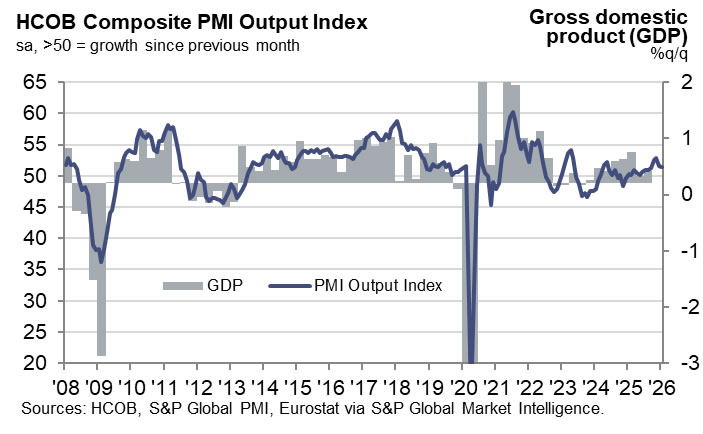
Eurozone PMI Services was finalized at 51.6 in January, easing from December’s 52.4. PMI Composite edged lower to 51.3 from 51.5. The data still point to ongoing expansion, but momentum softened slightly at the start of the year.
At the country level, the picture was mixed but broadly supportive. Spain was the strongest performer with PMI Composite at 52.9, despite slipping to a seven-month low. Germany (52.1) and Italy (51.4) both posted modest improvements. France (49.1) stood out as the laggard, with activity remaining in contraction territory.
According to Cyrus de la Rubia of Hamburg Commercial Bank, service sector growth has been “decent” but far from comfortable, with weak new business growth and limited hiring highlighting the recovery’s vulnerability.
While headline inflation is close to the ECB’s 2% target, services inflation remains sticky. Rising energy prices linked to cold weather, alongside a marked pickup in service sector input costs and selling prices flagged by the PMI, could reawaken concerns.
Gold is Back in the Black: Geopolitics Dictates Conditions Again
Gold, on Wednesday, returned above the key level of 5000 USD per ounce and has already approached 5067 USD. The precious metal continues to grow after jumping more than 6% in the previous session, marking the strongest daily increase since 2008. The quotes were supported by purchases following a decline after a sharp correction at the beginning of the week.
Geopolitical risks gave an additional impetus to the precious metal. After US forces shot down an Iranian drone near an aircraft carrier in the Arabian Sea, demand for defensive assets intensified. At the same time, President Donald Trump stated that diplomatic contacts continue, and the White House confirmed the US-Iran talks scheduled for Friday.
Expectations of rapid Fed rate cuts have eased somewhat since the nomination of Kevin Warsh to head the Fed. Nevertheless, the markets are still pricing in two rate cuts – probably in the middle of the year and later in 2026.
Separately, it is noted that the publication of key US labour market statistics, including JOLTS data and the monthly employment report, will be postponed due to the partial government shutdown. The House voted on Tuesday on the Senate-approved stopgap budget.
Technical Analysis
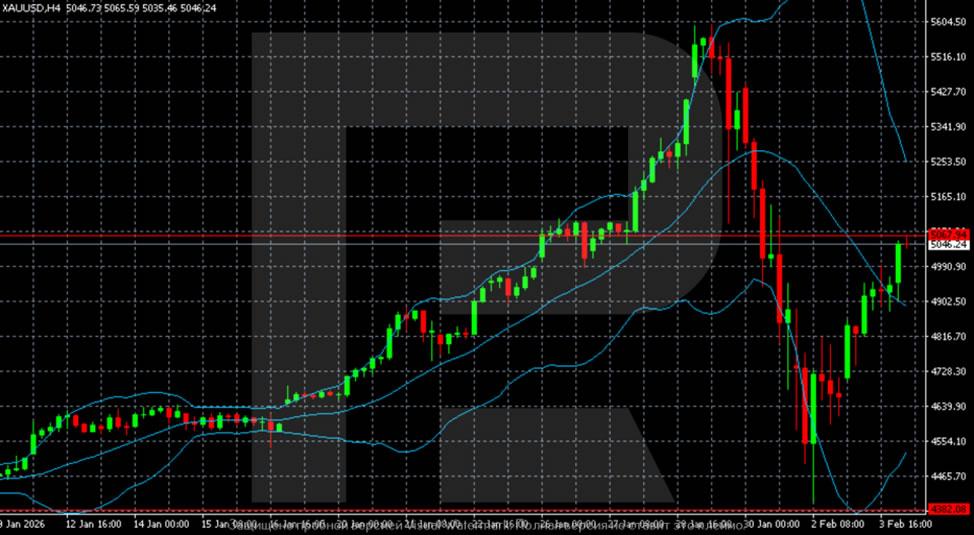
On the H4 chart for gold, after completing a powerful uptrend and reaching a peak around 5600, the market entered a sharp correction. The decline was impulsive, as evidenced by the expansion of Bollinger Bands – a sign of panic selling. The minimum was noted in the 4440–4450 zone, from where the technical rebound began. Current prices are recovering but remain below the Bollinger median line. The structure is still corrective, with increased volatility and a predominance of downside risks.
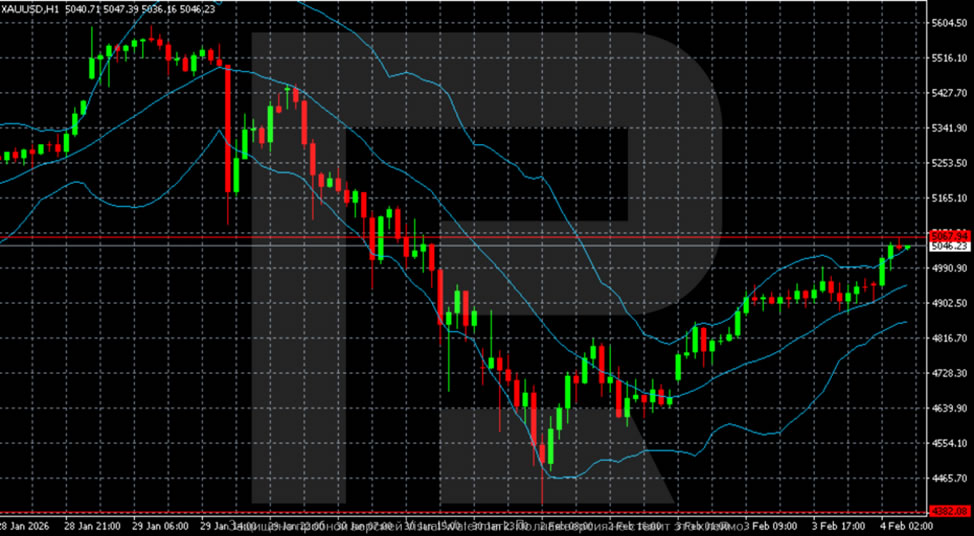
On the H1 chart, after a landslide downward movement, a base and a sequence of higher minima have formed – local stabilisation. The price is trading in a narrow upward channel and gradually moving towards the 5050-5100 resistance zone. However, the recovery looks technical. As long as the quotes are below key resistance and the median line of the higher timeframe, the rebound remains vulnerable to a resumption of selling.
Conclusion
In summary, gold's sharp recovery is primarily a technical rebound from oversold conditions, supercharged by a sudden flare-up in geopolitical tensions. While the move is significant, the technical structure across timeframes suggests it remains a corrective bounce within a larger downtrend, not a confirmed reversal. The rally is vulnerable as long as prices trade below key higher-timeframe resistance. The fundamental landscape remains mixed, with delayed US data creating uncertainty and revised, but still present, Fed easing expectations providing a floor. Near-term direction will hinge on the evolution of Middle East diplomacy and gold's ability to breach critical technical ceilings.
Euro’s Double-Edged Moment: ECB Set to Hold Rates Despite Strength and Growth Drag
- The European Central Bank (ECB) is widely expected to hold key interest rates steady.
- January's inflation hitting the 2% target supports this "wait-and-see" approach, with the focus now on "how long" rates will remain at this level.
- The Euro's recent strength helps suppress imported inflation but creates a "Growth Drag" that threatens Eurozone exports.
- Market participants will closely watch President Lagarde's press conference for clues on future policy.
As the European Central Bank (ECB) prepares for its first major meeting of 2026 on February 5, the Governing Council finds itself in a delicate balancing act. After a series of rate cuts in late 2024 and 2025 that brought the deposit facility rate down to 2.00%, the central bank now faces a "neutral" landscape where the next move is far from certain.
The Decision: Steady hands amidst stability
Market consensus is overwhelmingly in favor of a hold. The ECB is expected to maintain its key interest rates, the Deposit Facility at 2.00%, the Main Refinancing Operations at 2.15%, and the Marginal Lending Facility at 2.40%.
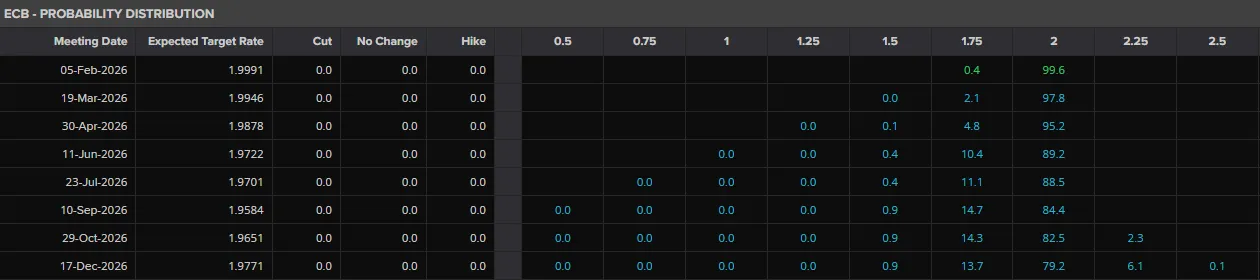
Source: LSEG
This "wait-and-see" approach is bolstered by January’s inflation data, which landed right on the ECB's 2% target. While some economists suggest that headline inflation could actually dip as low as 1.7% in the coming weeks, the Governing Council appears content to let the current restrictive-to-neutral policy simmer. Following the "plateau" narrative that emerged in late 2025, the February meeting is less about the immediate decision and more about the "policy signals" for the rest of the year.
The Euro’s "Moment": Strength vs. Competitiveness
The euro enters February 2026 in a position of renewed strength but this has introduced a new layer of complexity to the ECB’s deliberations. In early 2026, the euro broke above the 1.19 mark against the US dollar, briefly testing the psychological resistance level of 1.20.
However, this Euro strength is a double-edged sword for Frankfurt.
The Deflationary Hedge: A stronger euro helps suppress imported inflation—particularly energy and raw materials priced in dollars. This gives President Christine Lagarde more breathing room to keep rates steady even if global commodity prices fluctuate.
The Growth Drag: The "global euro moment" also brings risks. A potent currency threatens the competitiveness of Eurozone exports, particularly for the German industrial sector, which is already struggling with a modest 2026 growth forecast of 0.8% to 1.2%. If the euro’s appreciation becomes too aggressive, it could "import deflation" to the point of undershooting the 2% target, potentially forcing the ECB to resume rate cuts earlier than the "hold through 2026" crowd expects.
Market Outlook: Looking beyond the decision
Market participants are looking past the February announcement to the ECB’s Survey of Professional Forecasters (SPF) and the subsequent March projections. Currently, swap markets are pricing in very little movement for the remainder of 2026, signaling that the "rate cut cycle" that defined 2025 has likely reached its conclusion.
However, the tone of the press conference will be vital. Any emphasis on "downside risks to growth" or concerns regarding the "undershooting of inflation" will be interpreted as a dovish tilt. Conversely, if Lagarde maintains that service-sector inflation remains sticky, the Euro could see further gains as traders price out any remaining hopes for a mid-year cut.
President Lagarde’s press conference will be closely watched for clues on balancing inflation, growth, and market risks.
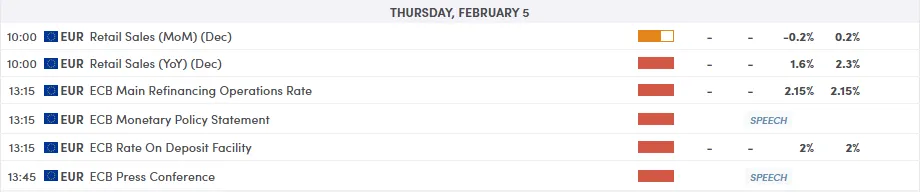
Source: For all market-moving economic releases and events, see the MarketPulse Economic Calendar. (click to enlarge)
Implications for the Currency
For the Euro, the February meeting is likely to consolidate its recent gains unless the ECB explicitly expresses discomfort with the currency's level. With the US Federal Reserve also reaching a potential pause in its own cycle, the EUR/USD pair is finding a new equilibrium.
The primary takeaway for February 2026 is that the ECB has successfully navigated the "soft landing." The focus has shifted from "how high" or "how low" to "how long", how long will rates stay at 2% before the next economic shift dictates a new direction.
For now, stability is the name of the game in Frankfurt.
Technical Analysis - EUR/USD
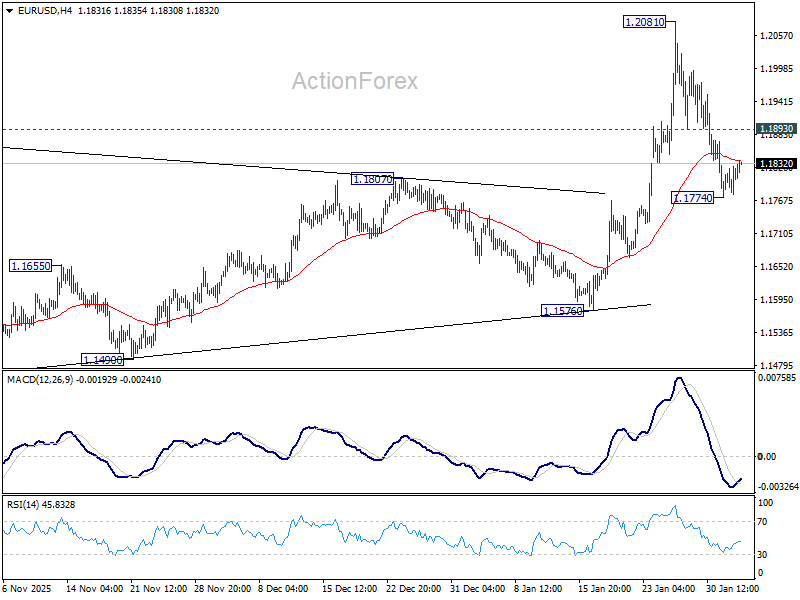
From a technical standpoint, EUR/USD has seen a significant pullback since the January 27 high at 1.2082.
The pullback is just over 50% of the initial upside move which started at the 1.1572 handle on January 19.
Heading into the meeting, EUR/USD rests at a key area of support which was the swing high in December 2025 around the 1.1794.
If this level holds, then a run back toward the psychological 1.2000 handle may be on the cards.
The period 14-RSI bodes well, having bounced off the neutral 50 level which hints at bullish momentum remaining in play.
A break lower from here may bring the 100-day MA back into focus around the 1.1678 handle.
EUR/USD Daily Chart, February 4, 2026
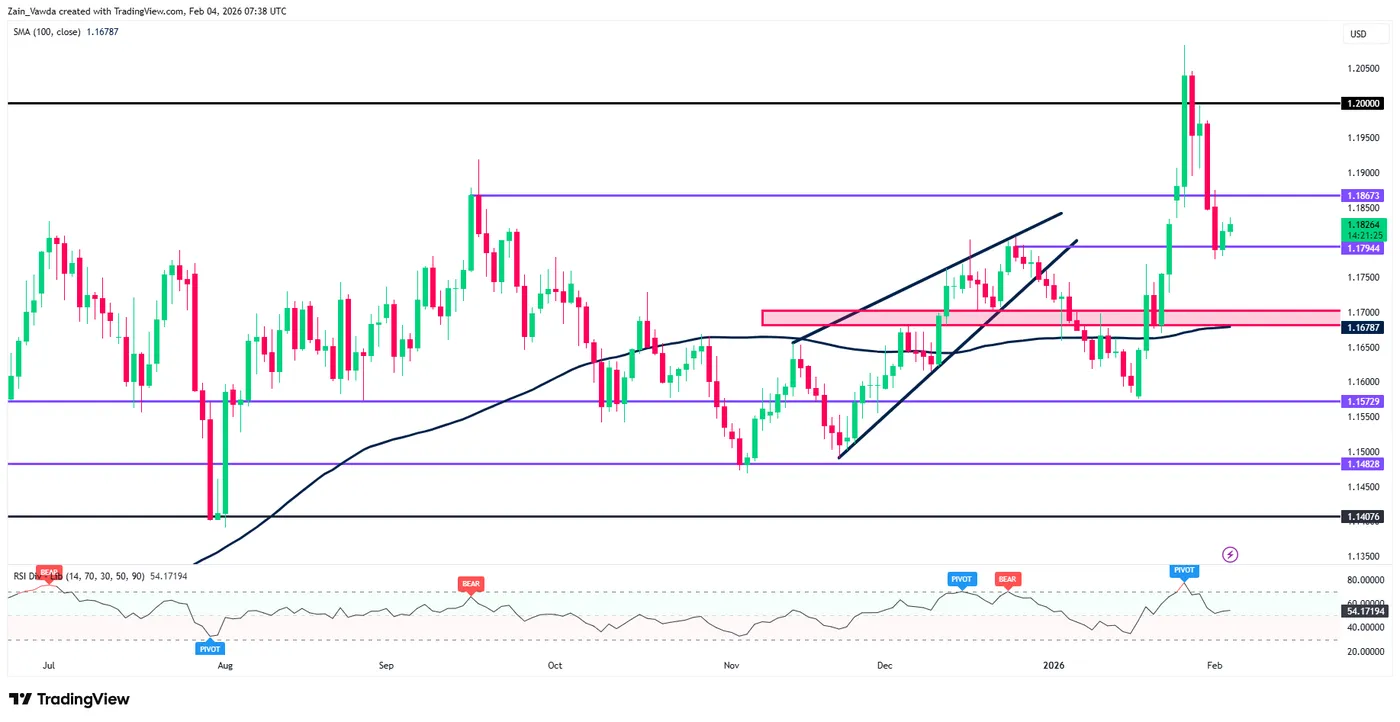
Source: TradingView (click to enlarge)
Gold and WTI Crude Oil Set Sights On Another Leg Higher
Gold prices started a fresh increase from $4,400 and moved above $5,000. WTI Crude oil prices are gaining bullish momentum and might even test $65.00.
Important Takeaways for Gold and WTI Crude Oil Prices Analysis Today
- Gold prices started another increase from $4,400 after a sharp decline.
- A connecting bullish trend line is forming with support at $5,000 on the hourly chart of gold at FXOpen.
- WTI Crude climbed above the $61.50 and $62.00 levels.
- There is a key bearish trend line forming with resistance at $64.65 on the hourly chart of XTI/USD at FXOpen.
Gold Price Technical Analysis
On the hourly chart of Gold at FXOpen, the price found support near $4,400 after a massive selloff. The price formed a base and started a fresh increase above $4,800.
The bulls cleared the $5,000 barrier and the 50-hour simple moving average. There was also a move above the 50% Fib retracement level of the downward move from the $5,595 swing high to the $4,402 low. The RSI is now above 50, and the price could aim for more gains.
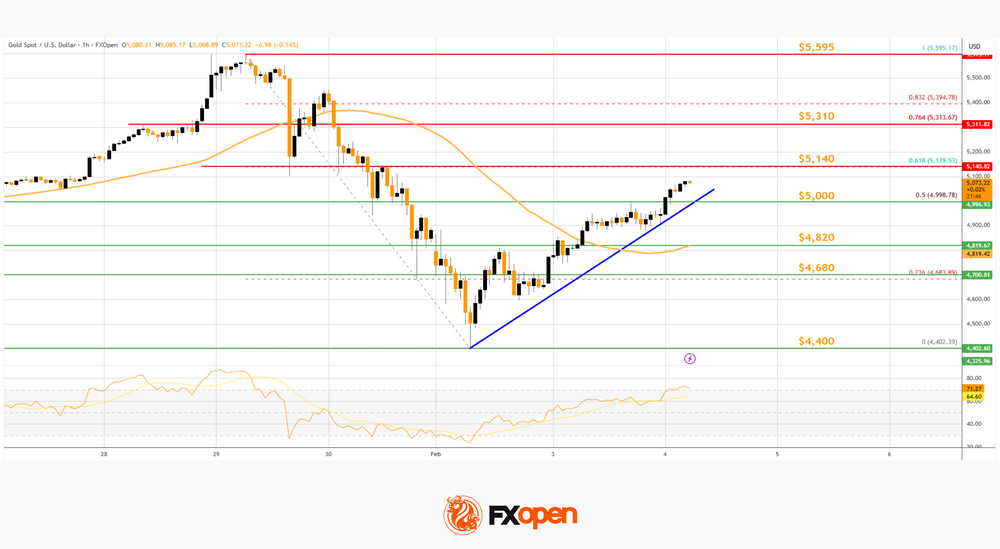
An immediate hurdle is near the 61.8% Fib retracement at $5,140. The first key area of interest might be $5,310. An upside break above $5,310 resistance could send Gold toward $5,500. Any more gains may perhaps set the pace for an increase toward the $5,595 high.
An initial bid zone on the downside is near a connecting bullish trend line at $5,000. If there is a downside break below $5,000, the price might decline further.
In the stated case, the price might drop toward $4,820. The next key zone for the bulls might be $4,680. Any more losses might send the price toward $4,400.
WTI Crude Oil Price Technical Analysis
On the hourly chart of WTI Crude Oil at FXOpen, the price started a fresh upward move from $60.85 against the US Dollar. The price gained bullish momentum after it broke $62.00.
The bulls pushed the price above the 50% Fib retracement level of the downward move from the $65.83 swing high to the $60.84 low. The price even climbed above the 50-hour simple moving average. The price is now facing hurdles near the 61.8% Fib retracement level at $63.90.
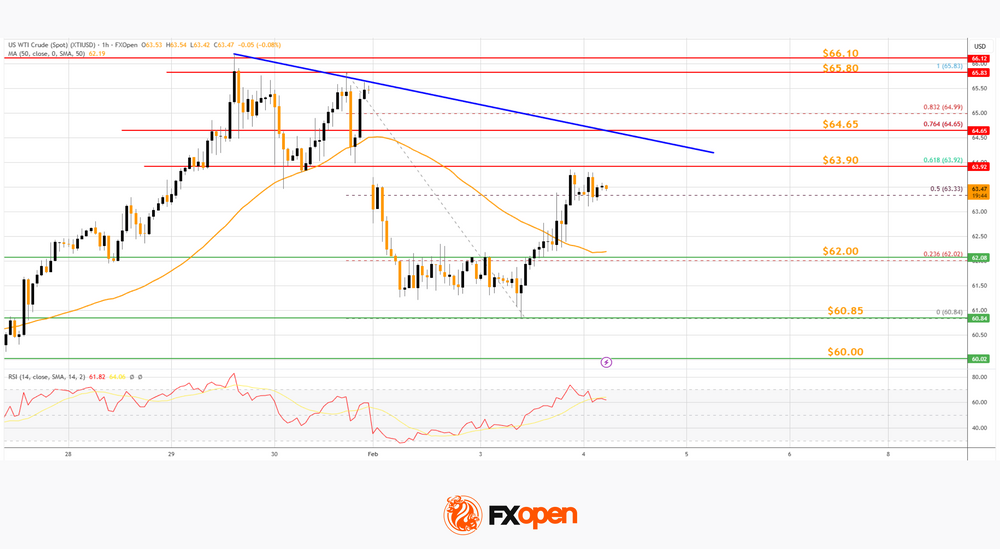
The RSI is now near the 60 level, and the price could aim for more gains. If the price climbs higher again, it could face resistance near a key bearish trend line at $64.65.
The next major hurdle for the bulls sits at $65.80. Any more gains might send the price toward the $66.10 zone or even $67.20. Conversely, the price might correct gains and test $62.00.
The next major breakdown zone on the WTI crude oil chart is $60.85, below which the price could test $60.00. If there is a downside move below $60.00, the price might decline toward $58.50. Any more losses may perhaps open the doors for a move to $55.00.
Start trading commodity CFDs with tight spreads (additional fees may apply). Open your trading account now or learn more about trading commodity CFDs with FXOpen.
This article represents the opinion of the Companies operating under the FXOpen brand only. It is not to be construed as an offer, solicitation, or recommendation with respect to products and services provided by the Companies operating under the FXOpen brand, nor is it to be considered financial advice.
Software Drama
The relief that came with the easing selloff across the metals space lasted until news broke that Anthropic, an AI startup backed by Amazon and Google, had rolled out a new AI tool designed to handle legal and research work traditionally done using paid databases. The announcement spooked markets, triggering a sharp selloff in software companies that sell data analytics and decision-making tools to lawyers, banks and corporates, on fears that AI and new players are coming for their lunch — and at an accelerated pace.
Yesterday was therefore marked by panic and a fresh wave of selling, particularly among software companies. In Europe, RELX and London Stock Exchange Group plunged 14% and 12% respectively in the FTSE 100. Thomson Reuters lost 15%, while Experian, Pearson and Sage also saw their shares caught up in the move. Across the Atlantic, FactSet, Salesforce and Adobe sold off. Adobe, for example, fell to its lowest levels in around six years, as the arrival of AI raised competition to a level that threatens parts of its core business severely. Bigger names were hit too: Microsoft lost 2.87% and is now down roughly 25% from its November peak.
Broader tech also suffered. VanEck’s Semiconductor ETF fell 2.5%. Even Google, one of the rising AI stars of the moment, slipped 1.22% after hitting a fresh record high. The selloff spread to parts of Asia as well. Tencent, for example, fell around 3%.
However, South Korea’s Kospi largely escaped the bloodbath, as its champions Samsung Electronics and SK Hynix continue to benefit from tight memory markets and strong pricing power.
On the earnings front, AMD delivered a solid beat, with revenue above $10 billion and adjusted earnings per share of $1.53, both comfortably above Wall Street expectations. Top-line growth was driven by strong demand for data-center and AI-related products, alongside solid momentum in PCs and gaming. However, despite the headline beat — 39% growth in data-center revenue and 34% growth in the PC segment — and a confident tone from CEO Lisa Su, the outlook fell short of lofty market expectations. AMD shares fell around 8% in after-hours trading.
Nasdaq futures are slightly lower at the time of writing, suggesting no immediate escalation of yesterday’s software-led selloff. Still, the reaction to recent tech earnings raises a broader concern: stocks are being punished even after earnings beats, as investors demand more to match the sky-high valuations.
Up next, Google and Qualcomm report after the bell, while Amazon is due to release its results on Thursday after the close. By the end of the week, we should have a clearer sense of where the AI hype is heading. So far, markets have barely cheered good results — even Meta, despite delivering revenue growth tied to its AI investments, failed to hold on to its post-earnings gains.
It increasingly feels as though the AI rally is being retraced, regardless of how strong the results are.
Elsewhere, geopolitical tensions between the US and Iran have intensified after reports that the US Navy shot down an Iranian drone heading toward a US aircraft carrier in the Arabian Sea. That development pushed US crude prices up around 2.4% yesterday, with prices now consolidating just below the $64 per barrel level. As always, geopolitically driven spikes can create tactical short-term opportunities, but upside risks currently dominate given how tense the situation with Iran remains.
Zooming out, gold is back above the $5’000-per-ounce level. A few months ago, this might have been interpreted as a classic flight to safety amid equity stress and geopolitical risk. Today, however, it is less clear whether this reflects risk aversion or a quick jump from one hot trade — AI — into another — metals.
In the broader safe-haven space, options are increasingly limited. Gold has been volatile, US 10-year yields remain elevated amid US debt concerns and the prospect of further balance-sheet tightening by the Federal Reserve (Fed), and the Japanese yen continues to struggle. The USDJPY is testing its 50-day moving average to the upside near 156.30 and could extend gains into the weekend’s snap election. That leaves the Swiss franc, with the USDCHF facing resistance near the 0.78 level. The EURUSD is gently recovering after finding support near 1.1780 following last week’s dollar strength, while Cable is consolidating above 1.37.
The latter two moves are largely a US dollar story. The dollar index has come under renewed selling pressure this week ahead of US jobs data. However, the BLS has announced it will not release the latest payrolls report on Friday due to a partial government shutdown. So, today’s ADP report will take on added importance and is expected to show around 46K private-sector job additions — a weak number relative to US’ headline growth, reinforcing the view that US economic strength remains concentrated in AI-related investment rather than broad-based momentum. It is a two-speed economy, and that’s complicated to navigate for the Fed.
Hence, soft jobs data will certainly support a more dovish Fed outlook, which — in the absence of policy moves from the European Central Bank (ECB) and the Bank of England (BoE) — could lend further support to the euro and sterling versus the greenback. I continue to expect EURUSD to move back toward, and eventually above, the 1.20 level.
Euro Area Inflation to Show Drop
In focus today
In the euro area, focus turns to flash HICP inflation data from January. We track euro area HICP at 1.7% y/y (Dec: 1.94% y/y) in line with consensus estimates as lower French inflation averages out higher inflation in Germany and Spain. We anticipate the entire decline to be explained by energy inflation, which is set to fall due to very large base effects despite higher energy prices in January relative to December. We expect core inflation to remain at 2.3% y/y due to unchanged goods and services inflation.
In the US, the ADP private sector employment report will provide markets with the first sense of what to expect about the delayed January Jobs Report. ADP's weekly employment estimates showed steadily positive jobs growth over the reference period. ISM Services index will also be released for January. Finally, we will also be looking out for the Quarterly Refunding Announcement, where we expect the Treasury to maintain the current nominal coupon auction sizes.
In Poland, the National bank of Poland will announce their policy rate decision. The market expects the interest rate to be maintained at 4.00%.
In Sweden, the Riksbank will release a summary of last week's meeting at 9:30 CET today. We are curious about how the individual Board members assessed a more stable labour market in relation to the lower inflation outcome and disinflationary risks associated with a sustainably stronger krona. Last week's press release reiterated that "The policy rate is expected to remain at this level for some time to come".
Also in the euro area, the final services and composite PMI for December is up for release. We expect it to confirm flash data in line with Monday's release of final manufacturing PMI.
Economic and market news
What happened overnight
In China, the Ratingdog Service PMI was released at 52.3, up from 52.0 in December and the highest reading since October, as hiring reached its highest levels since July and strong new orders.
In Japan, the service sector continued its expansion as the final service PMI came in at 53.7, slightly above the flash estimate of 53.4 and up from 51.6 in December. This marks the fastest pace of growth in nearly a year in the service sector.
What happened yesterday
In the US, the House of Representatives approved the funding package that ends the partial government shutdown that began on Saturday, as the Senate already approved the bills over the weekend. In the evening, President Trump signed it into law. After this deal, Congress has approved 11/12 of the full-year funding bills. The negotiations over the final remaining bill regarding funding for the Department of Homeland Security (DHS) will continue for at least the next two weeks, but even if the DHS ends up in a shutdown, it will no longer cause any true disruptions in markets. In other words, the shutdown risk is now cleared until the next fiscal year begins on 1 October. This ensures that even though Friday's jobs report will still be delayed, the release will be pushed back only by a few days.
In the euro area, the ECB's quarterly Bank Lending Survey showed that banks tightened credit standards for firms due to higher perceived risks and a lower risk tolerance in Q4 2025. Credit standards tightened mainly for firms in industry, while non-financial services saw no tightening. Banks are also expected to tighten credit standards in the first quarter of 2026.
In France, inflation surprised to the downside in January in contrast to Germany and Spain. The flash release shows HICP inflation at 0.4% y/y (cons: 0.6%, prior: 0.7%) and CPI at 0.3% y/y (cons: 0.6%, prior: 0.8%). The downside surprise was driven by weaker-than-expected prices for manufactured goods, softer services inflation, as well as a continued drag from energy prices.
Equities: Global equities declined 0.3%, in a tech led sell-off. While S&P 500 ended 0.8% lower, and Nasdaq -1.4% the Russell 2000 ended the day higher at 0.3%. Stoxx600 was 0.1% higher. However, calling it a broad-based tech sell-off would be a stretch. The sell-off was focused on software companies (and even some financial services firms), following a new AI tool by Anthropic.
FI and FX: Risk sentiment soured, equities sold off and the oil price rose after news that the US Navy shot down an Iranian drone that headed toward an aircraft carrier. S&P 500 closed -0.84% and Nasdaq -1.4% after recovering from intraday lows of -1.6% and 2.4% respectively. Higher oiled supported the NOK which broke below 11.40. EUR/SEK went south again in a new attempt to take out 10.50, despite unstable-to-adverse risk sentiment. EUR/USD is back above 1.18 and USD/JPY above 156. Fixed income held relatively stable with UST10y hovering around 4.28%.
EUR/USD Daily Outlook
Daily Pivots: (S1) 1.1790; (P) 1.1809; (R1) 1.1839; More….
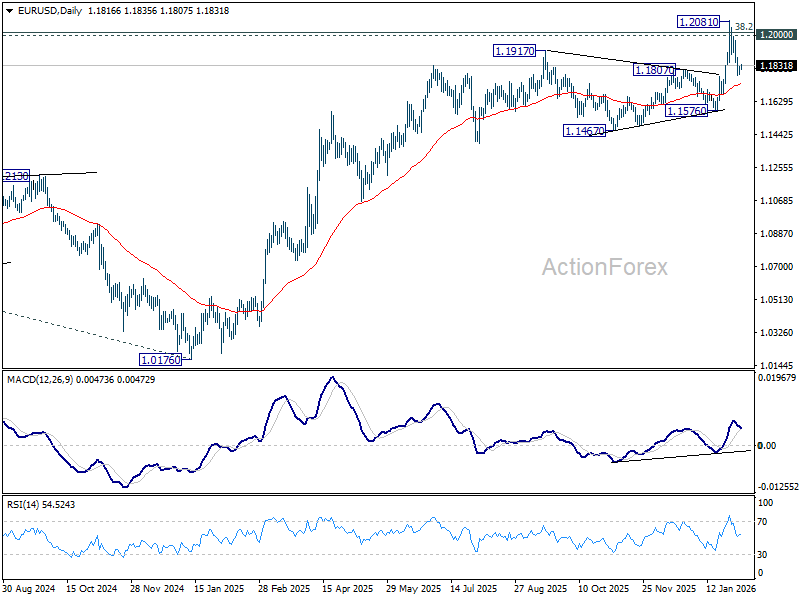
Intraday bias in EUR/USD is turned neutral with current recovery. Below 1.1774 will extend the fall from 1.2081 short term top to 55 D EMA (now at 1.1724). Firm break there will raise the chance of reversal on rejection by 1.2 psychological level, and target 1.1576 support. On the upside, above 1.1893 minor resistance will bring stronger rebound to retest 1.2081. Decisive break above 1.2 will carry larger bullish implications.
In the bigger picture, as long as 55 W EMA (now at 1.1458) holds, up trend from 0.9534 (2022 low) is still in favor to continue. Decisive break of 1.2 key psychological level will add to the case of long term bullish trend reversal. Next medium term target will be 138.2% projection of 0.9534 to 1.1274 from 1.0176 at 1.2581. However, sustained trading below 55 W EMA will argue that rise from 0.9534 has completed as a three wave corrective bounce, and keep long term outlook bearish.
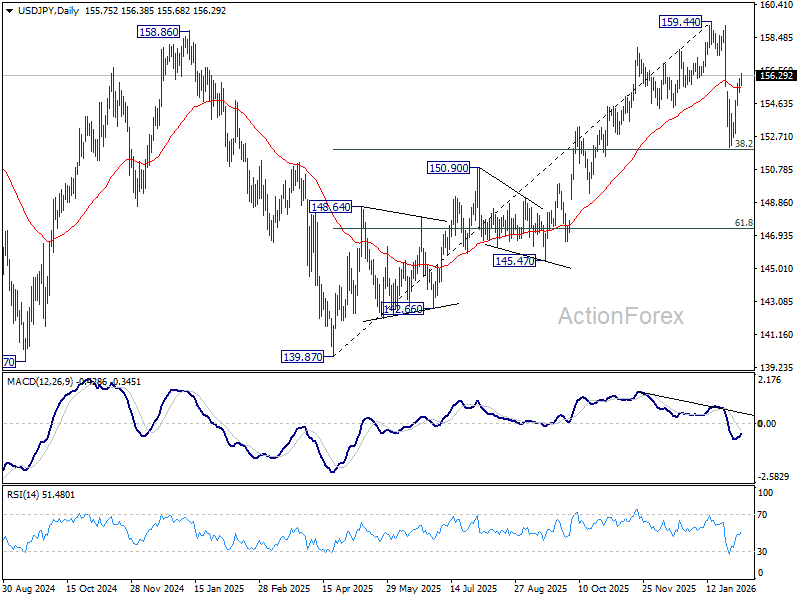
USD/JPY Daily Outlook
Daily Pivots: (S1) 155.35; (P) 155.72; (R1) 156.13; More...
Intraday bias in USD/JPY remains on the upside at this point. Rise from 152.07 is seen as the second leg of the corrective pattern from 159.44. Further rebound should be seen to retest 159.44 next. On the downside, below 154.53 minor support will turn intraday bias neutral first. Sustained break of 38.2% retracement of 139.87 to 159.44 at 151.96 will argue that it is reversing whole rise from 139.87.
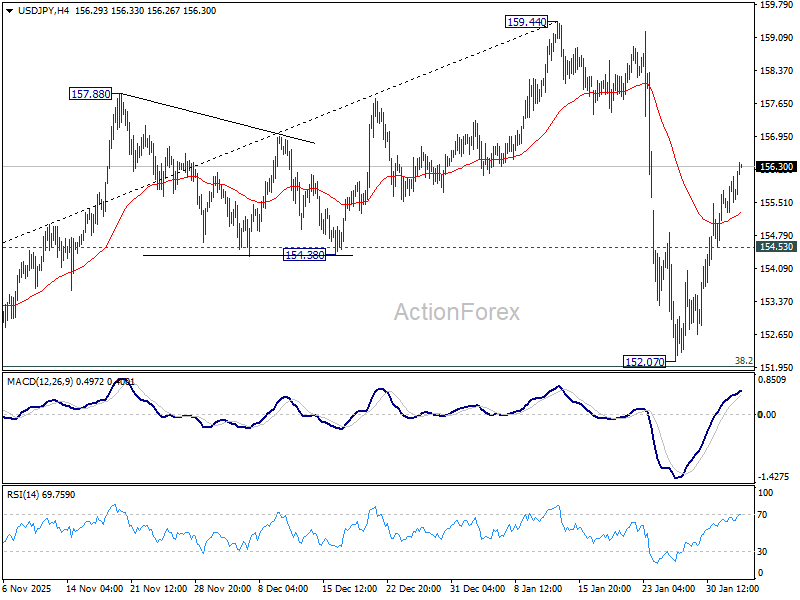
In the bigger picture, outlook is unchanged that corrective pattern from 161.94 (2024 high) should have completed with three waves at 139.87. Larger up trend from 102.58 (2021 low) could be ready to resume through 161.94. This will remain the favored case as long as 55 W EMA (now at 151.59) holds. However, sustained break of 55 W EMA will argue that the pattern from 161.94 is extending with another falling leg.
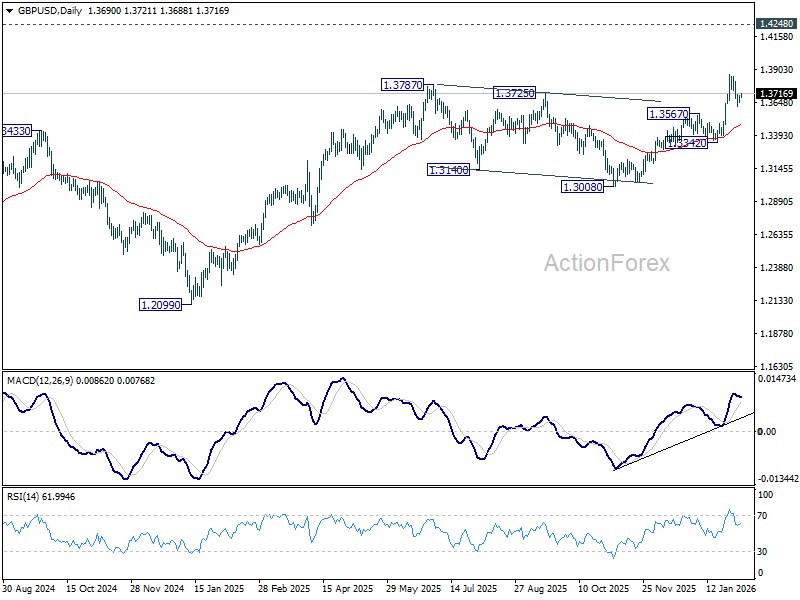
GBP/USD Daily Outlook
Daily Pivots: (S1) 1.3664; (P) 1.3686; (R1) 1.3720; More...
Intraday bias in GBP/USD is turned neutral first with current recovery. Below 1.3621 will extend the pullback from 1.3867 short term top to 55 D EMA (now at 1.3471). On the upside, firm break of 1.3867 will resume larger up trend towards 1.4284 key resistance.
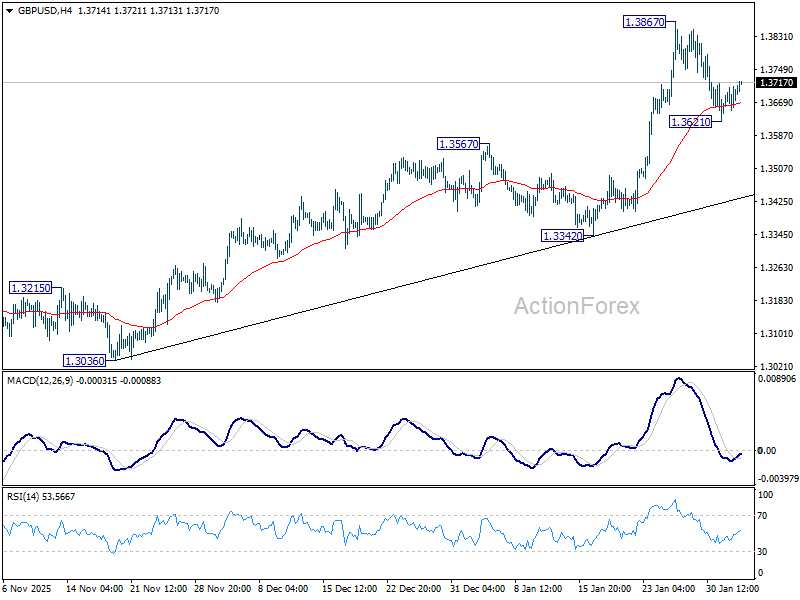
In the bigger picture, rise from 1.0351 (2022 low) is resuming by breaking through 1.3787 high. Further rally should be seen to 1.4284 key resistance (2021 high). Decisive break there will add to the case of long term bullish trend reversal. For now, outlook will stay bullish as long as 1.3008 support holds, even in case of deep pullback.
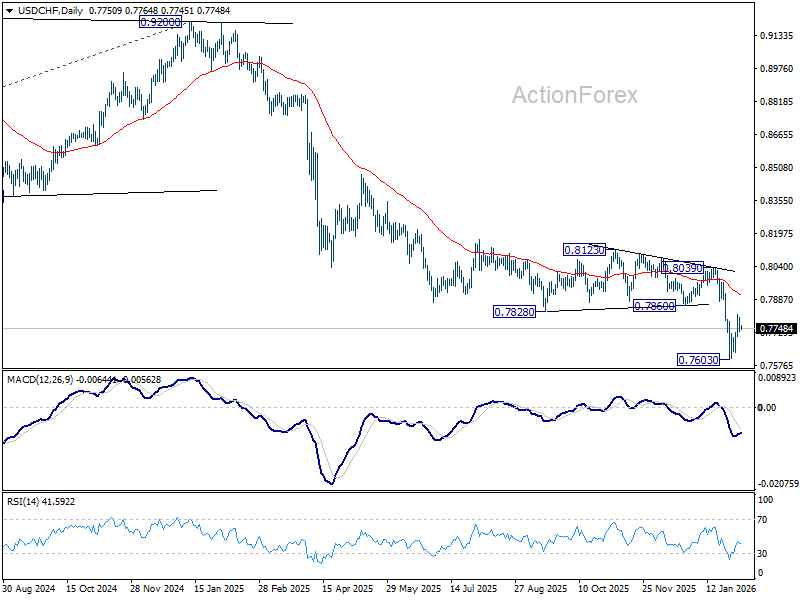
USD/CHF Daily Outlook
Daily Pivots: (S1) 0.7726; (P) 0.7765; (R1) 0.7791; More….
Intraday bias in USD/CHF is turned neutral first with current retreat. Above 0.7816 will resume the rebound from 0.7603 short term bottom to 55 D EMA (now at 0.7905). On the downside, below 0.7713 minor support will bring retest of 0.7603. Firm break there will resume larger down trend to 0.7382 projection level next.
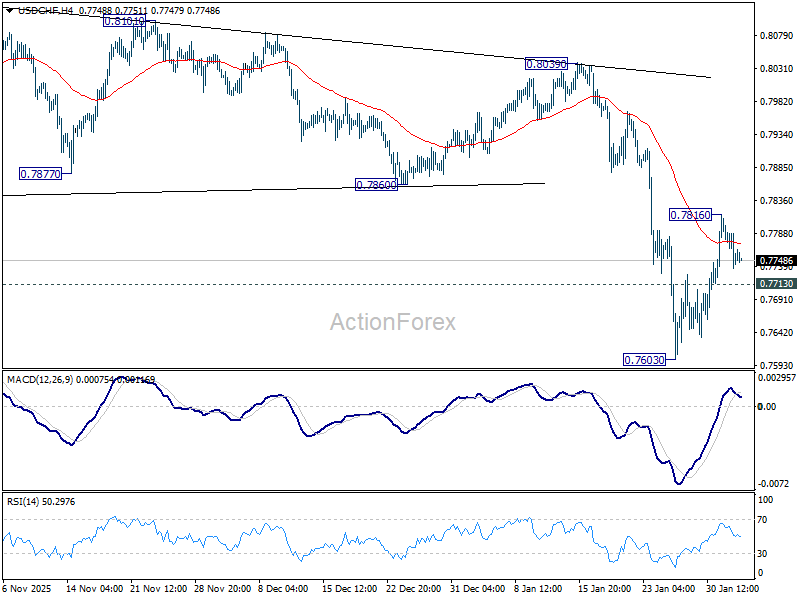
In the bigger picture, larger down trend from 1.0342 (2017 high) is still in progress and resuming. Next target is 100% projection of 1.0146 (2022 high) to 0.8332 from 0.9200 at 0.7382. In any case, outlook will stay bearish as long as 55 W EMA (now at 0.8166) holds.