Sample Category Title
AUD/USD Daily Report
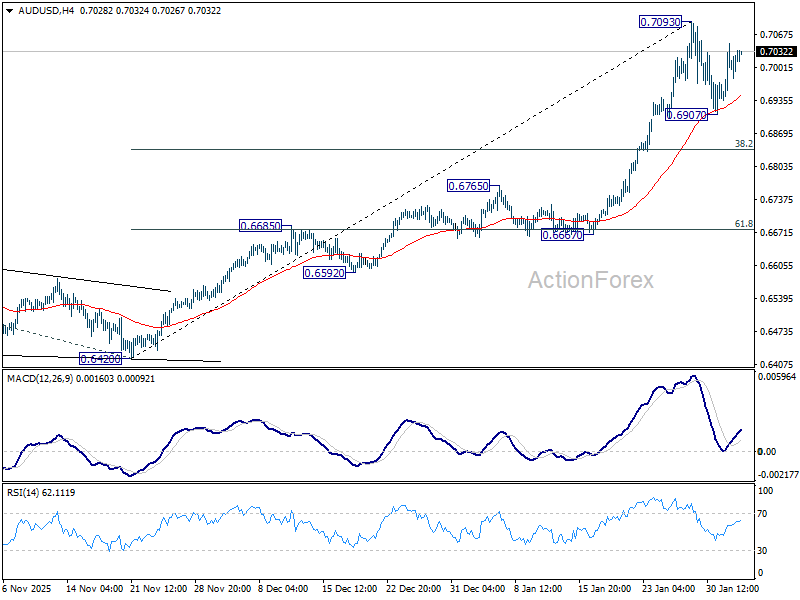
Daily Pivots: (S1) 0.6962; (P) 0.7006; (R1) 0.7067; More...
Intraday bias in AUD/USD remains neutral as range trading continues below 0.7093. Above 0.7093 will extend larger up trend to 100% projection of 0.5913 to 0.6706 from 0.6420 at 0.7213 next. However, break of 0.6907 will bring lengthier consolidations before rally resumption. Deeper pullback would then be seen to 38.2% retracement of 0.6420 to 0.7093 at 0.6836.
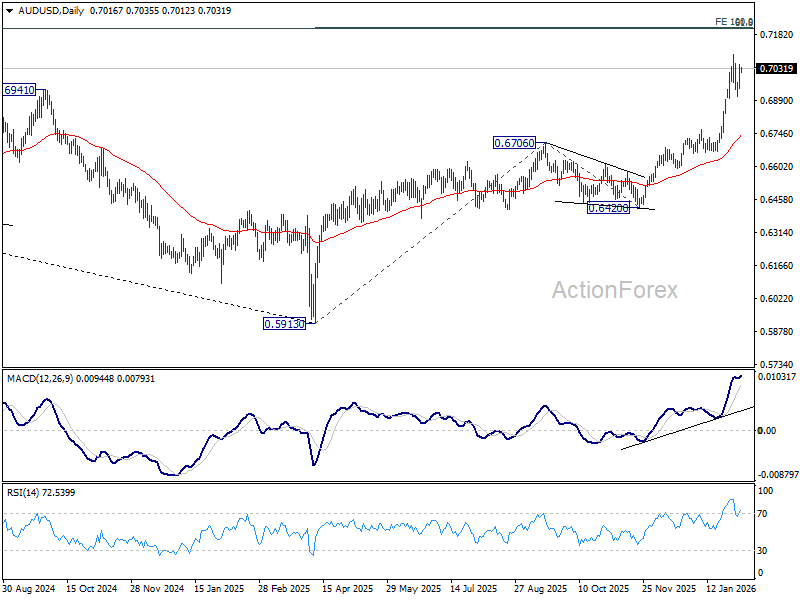
In the bigger picture, current development argues that rise from 0.5913 (2024 low) is reversing whole down trend from 0.8006 (2021 high). Further rally should be seen to 61.8% retracement of 0.8006 to 0.5913 at 0.7206. This will remain the favored case as long as 0.6706 resistance turned support holds, even in case of deep pullback.
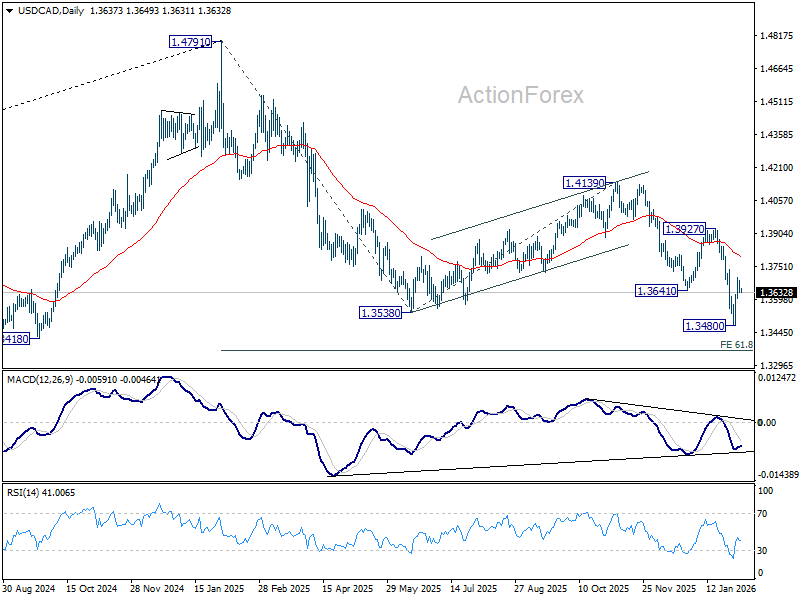
USD/CAD Daily Outlook
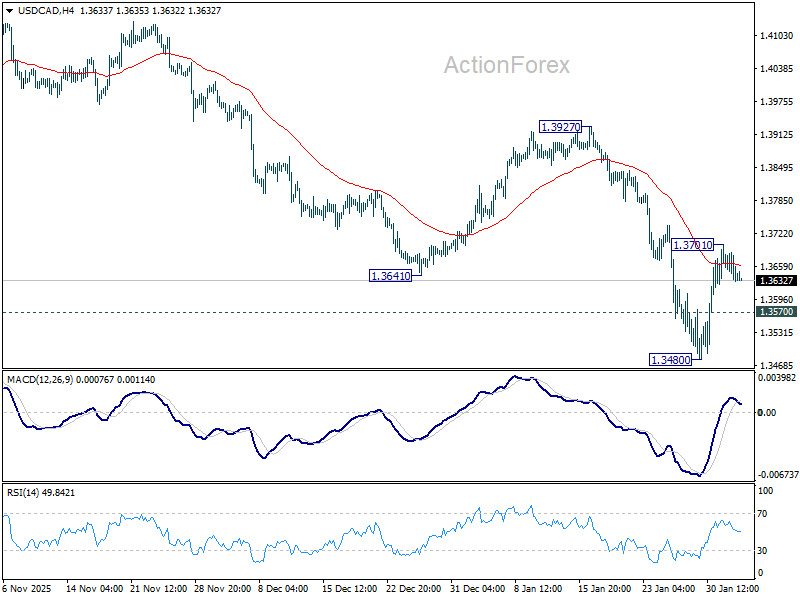
Daily Pivots: (S1) 1.3621; (P) 1.3654; (R1) 1.3674; More...
Intraday bias in USD/CAD is turned neutral with current retreat. On the upside, above 1.3701 will resume the rebound from 1.3480 short term bottom to 55 D EMA (now at 1.3793). On the downside, below 1.3570 minor support will bring retest of 1.3480 low. Firm break there will resume larger fall to 61.8% projection of 1.4791 to 1.3538 from 1.4139 at 1.3365.
In the bigger picture, price actions from 1.4791 are seen as a corrective pattern to the whole up trend from 1.2005 (2021 low). Deeper fall could be seen as the pattern extends, and break of 1.3538 will target 61.8% retracement of 1.2005 to 1.4791 at 1.3069. For now, medium term outlook will be neutral at best, until there are signs that the correction has completed, or that a bearish trend reversal is confirmed.
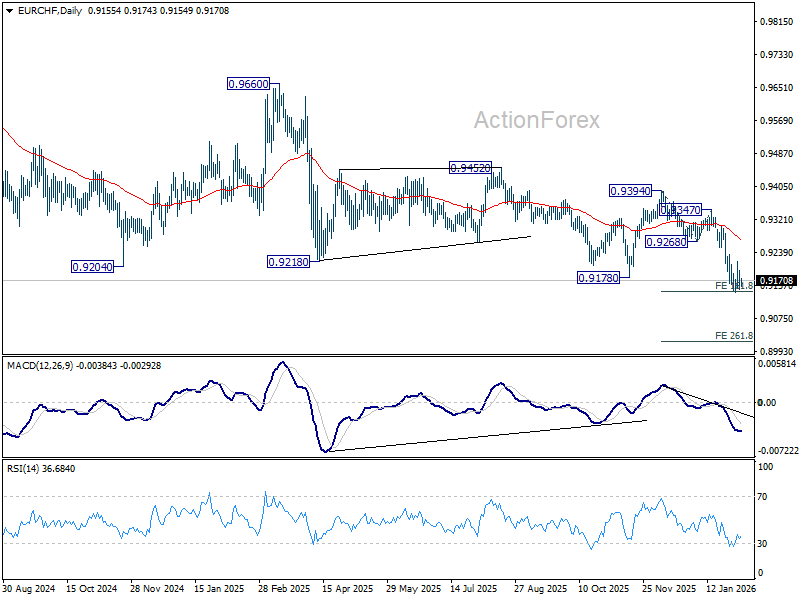
EUR/CHF Daily Outlook
Daily Pivots: (S1) 0.9140; (P) 0.9171; (R1) 0.9193; More....
Intraday bias in EUR/CHF stays neutral for the moment. Consolidations from 0.9141 could extend further, but upside should be limited by 0.9235 to bring another fall. Decisive break of 0.9141 will extend larger down trend to 261.8% projection of 0.9394 to 0.9268 from 0.9347 at 0.9143. However, firm break of 0.9235 resistance will suggest short term bottoming and bring stronger rebound to 55 D EMA (now at 0.9274).
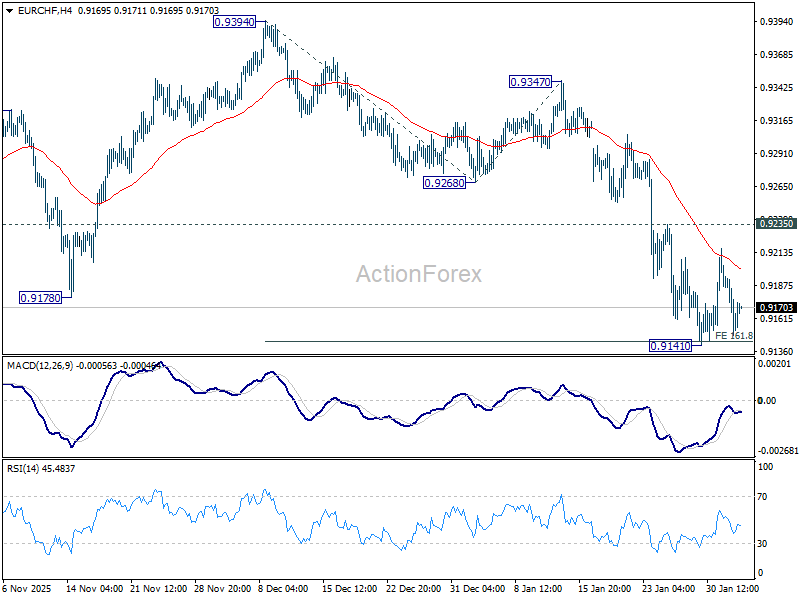
In the bigger picture, another rejection by 55 W EMA (now at 0.9350) keeps outlook bearish. Downtrend from 1.2004 (2018 high) is still in progress. Firm break of 0.9178 will target 61.8% projection of 1.1149 to 0.9407 from 0.9928 0.8851. Outlook will stay bearish as long as 0.9394 resistance holds, in case of recovery.
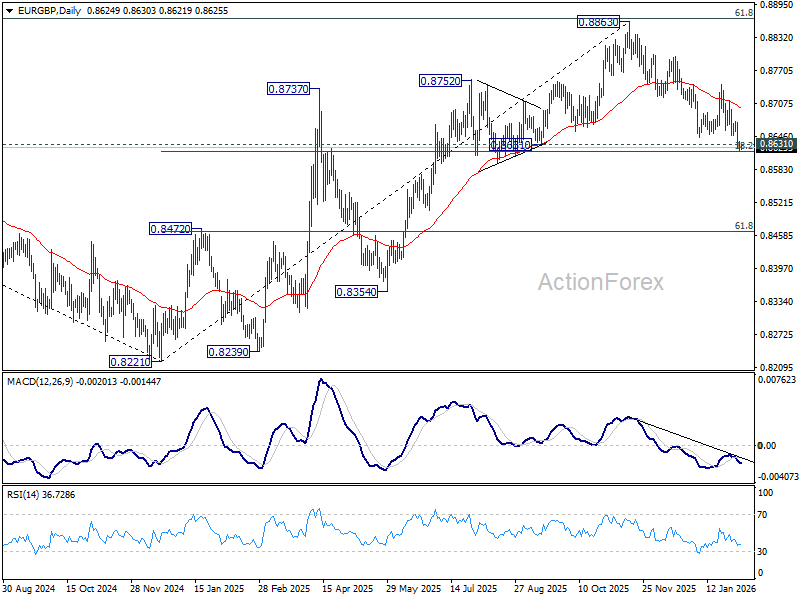
EUR/GBP Daily Outlook
Daily Pivots: (S1) 0.8620; (P) 0.8628; (R1) 0.8637; More…
Intraday bias in EUR/GBP stays on the downside at this point. Decisive break of 0.8631 cluster support (38.2% retracement of 0.8221 to 0.8663 at 0.8618) will carry larger bearish implications. Next target is 61.8% retracement at 0.8466. On the upside, above 0.8674 resistance will turn intraday bias neutral again first.
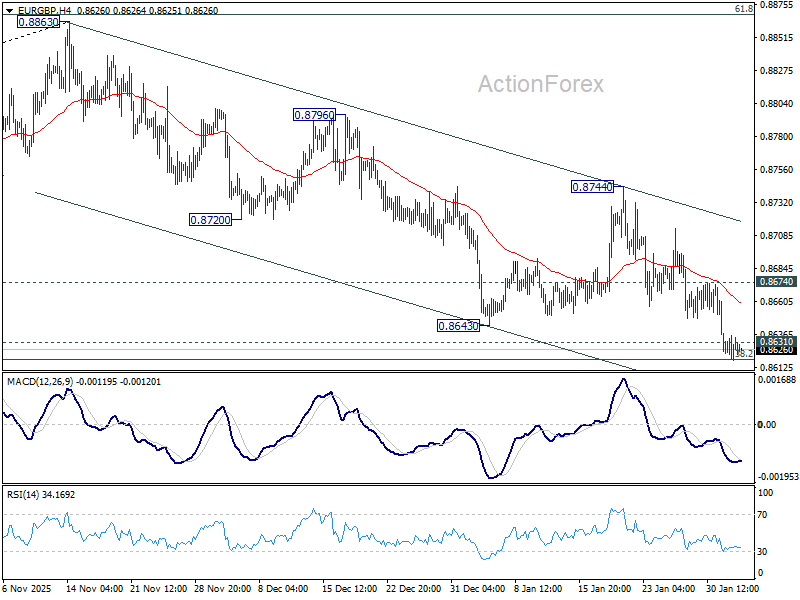
In the bigger picture, rise from 0.8221 medium term bottom (2024 low) is seen as a corrective move. Upside should be limited by 61.8% retracement of 0.9267 to 0.8221 at 0.8867. Sustained trading below 55 W EMA (now at 0.8625) should confirm that this corrective bounce has completed. In this case, deeper fall would be seen back to 0.8201/21 key support zone. However, decisive break of 0.8867 will suggest that EUR/GBP is already reversing whole decline from 0.9267 (2022 high). That should pave the way back to 0.9267.
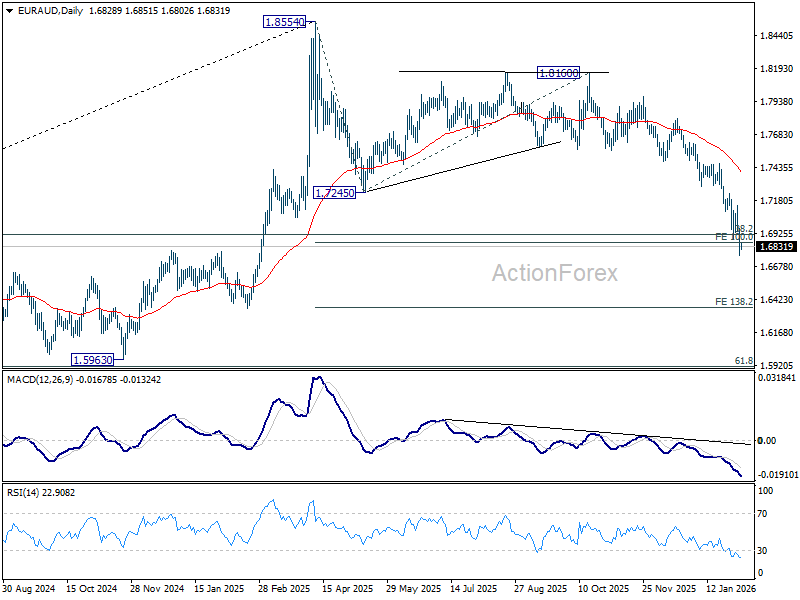
EUR/AUD Daily Outlook
Daily Pivots: (S1) 1.6703; (P) 1.6890; (R1) 1.7019; More...
Intraday bias in EUR/AUD remains on the downside for the moment. Sustained trading below 100% projection of 1.8554 to 1.7245 from 1.8160 at 1.6851 will pave the way to 138.2% projection at 1.6351 next. On the upside, break of 1.7145 resistance is needed to indicate short term bottoming. Otherwise, will remain bearish in case of recovery.
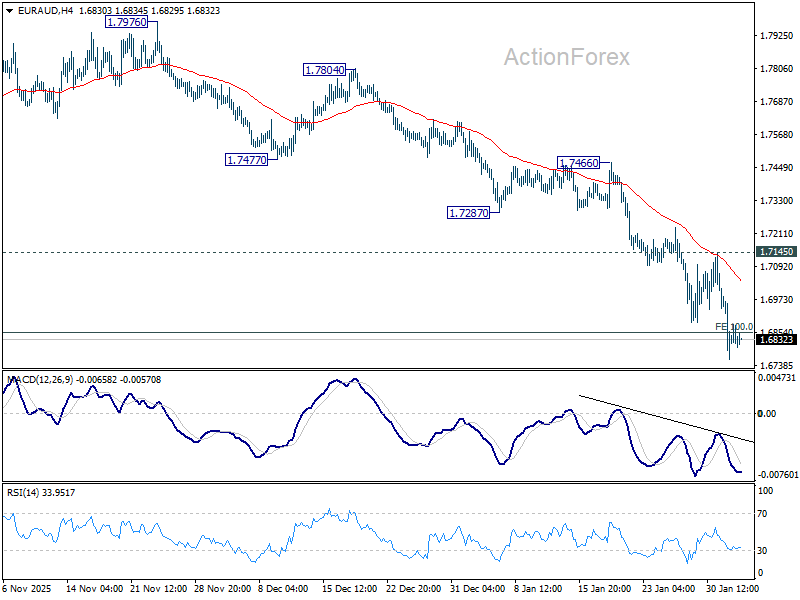
In the bigger picture, fall from 1.8554 medium term top is still in progress. Sustained break of 38.2% retracement of 1.4281 to 1.8554 at 1.6922 will argue that it's already reversing whole up trend from 1.4281 (2022 low). Deeper fall would be seen to 61.8% retracement at 1.5913. For now, risk will stay on the downside as long as 55 D EMA (now at 1.7396) holds even in case of strong rebound.
EUR/JPY Daily Outlook
Daily Pivots: (S1) 183.57; (P) 183.88; (R1) 184.43; More...
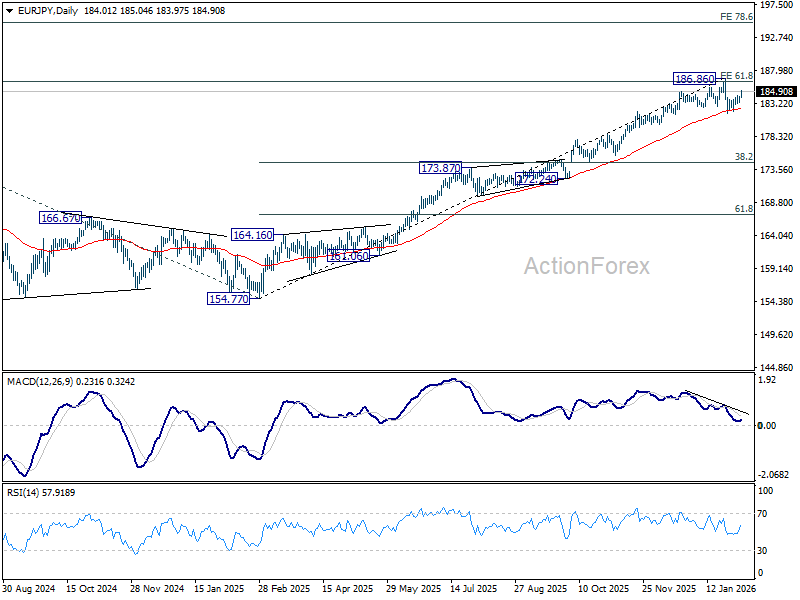
EUR/JPY's rebound from 181.76 accelerates higher today but stays well below 186.86 resistance. Intraday bias remains neutral first. On the downside, below 183.33 will bring retest of 181.76. Sustained trading below 55 D EMA (now at 182.35) should solidify the case that fall from 186.86 medium term top is correcting whole rise from 154.77. Deeper decline should then be seen to 38.2% retracement of 154.77 to 186.86 at 174.60. Nevertheless, firm break of 186.86 will resume larger up trend.
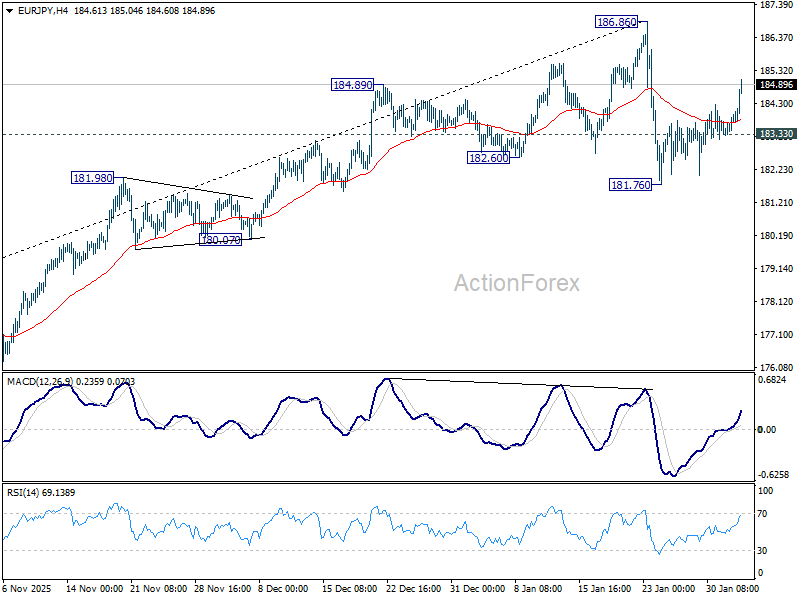
In the bigger picture, up trend from 114.42 (2020 low) is in progress and and met 61.8% projection of 124.37 to 175.41 from 154.77 at 186.31. Considering bearish divergence condition in D MACD, upside could be capped by 186.31 on first attempt. Still, outlook will stay bullish as long as 55 W EMA (now at 173.32) holds, even in case of deep pullback. Sustained break of 186.31 will pave the way to 78.6% projection at 194.88 next.
GBP/JPY Daily Outlook
Daily Pivots: (S1) 211.69; (P) 212.29; (R1) 213.28; More...
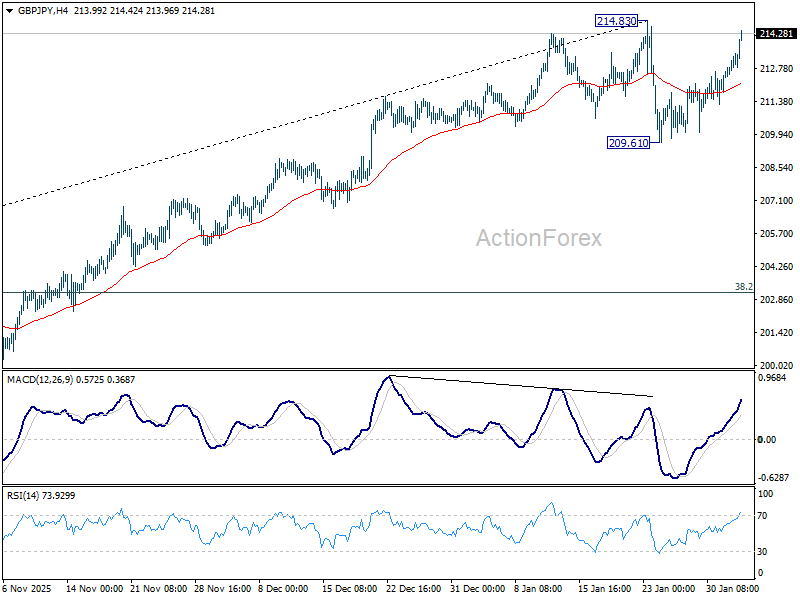
Immediate focus is back on 214.83 as GBP/JPY's rebound accelerates higher. Firm break there will resume larger up trend to 220.90 projection level next. Rejection by 214.83 will bring more consolidations first. But in case of another dip, downside should be contained by 55 D EMA (now at 209.70) to bring rally resumption.
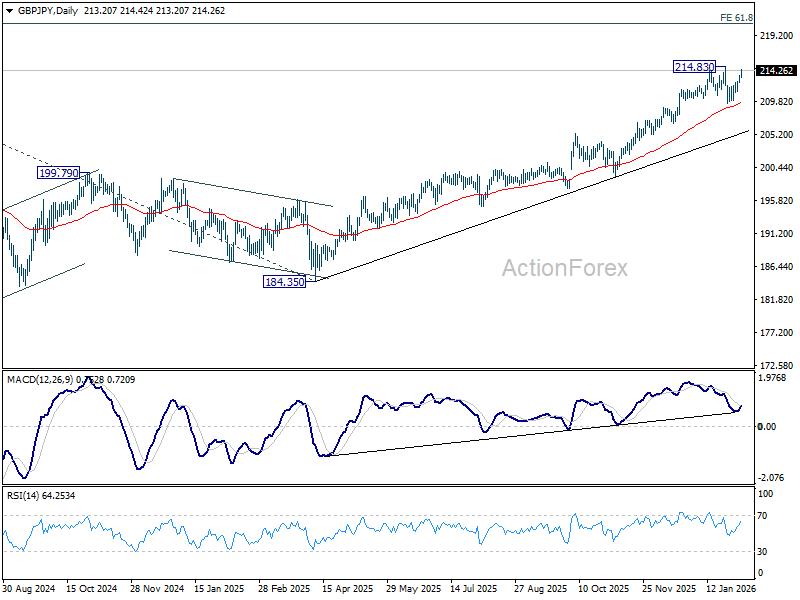
In the bigger picture, up trend from 123.94 (2020 low) is in progress. Next target is 61.8% projection of 148.93 (2022 low) to 208.09 (2024 high) from 184.35 at 220.90. On the downside, break of 205.30 resistance turned support is needed to indicate medium term topping. Otherwise, outlook will stay bullish even in case of deep pullback.
Yen Slides Again as Election Bets Build
Yen selloff returned to focus in Asian trading today as investors positioned ahead of Japan’s snap election this weekend. continues to enjoy solid public support. Although recent polls show a modest dip in approval, her standing remains strong enough to anchor expectations of electoral success.
More importantly for markets, her ruling Liberal Democratic Party appears on track to comfortably exceed the 233-seat threshold needed for a single-party majority in the House of Representatives. A new survey by Asahi Shimbun, conducted between January 31 and February 1, suggests that with coalition partner Nippon Ishin, the ruling bloc could secure more than 300 of the 465 seats at stake in a landslide outcome.
Voting on February 8 will determine the next lower house, but markets are already pricing in the implications of a decisive LDP victory rather than waiting for confirmation. A commanding victory would strengthen Takaichi’s hand in pursuing fiscal stimulus. Investors fear that expanded spending plans would worsen Japan’s already heavy debt load, pressuring government bonds and undermining Yen.
In the US, attention briefly shifted away from shutdown risk after President Donald Trump signed a spending deal into law on Tuesday, ending a partial government shutdown. The legislation ensures full-year federal funding through September, with the exception of the Department of Homeland Security, which receives only a two-week extension as lawmakers debate immigration enforcement measures. The deal passed the Senate with broad bipartisan backing and scraped through the House by a narrow margin, removing a near-term tail risk for markets.
Elsewhere, oil prices rebounded as geopolitical risks intensified. Markets reacted after the US military said it had shot down an Iranian drone that approached the Abraham Lincoln in the Arabian Sea. The incident has raised concerns that efforts to de-escalate US–Iran tensions could falter. Oil markets are rapidly repricing geopolitical risk as the perceived probability of direct US action increases.
For the week so far, Yen sits firmly at the bottom of the FX performance table, followed by Swiss Franc and Euro. Aussie remains the strongest performer, trailed by Kiwi and Sterling. Dollar and Loonie trade in the middle of the pack.
In Asia, at the time of writing, Nikkei is down -0.92%. Hong Kong HSI is down -0.21%. China Shanghai SSE is up 0.12%. Singapore Strait Times is up 0.10%. Japan 10-year JGB yield is down -0.009 at 2.251. Overnight, DOW fell -0.34%. S&P 500 fell -0.84%. NASDAQ fell -1.43%. 10-year yield fell -0.001 to 4.274.
New Zealand jobs grow 0.5% in Q4, unemployment ticks to decade-high
New Zealand’s labor market delivered mixed signals in Q4. Employment rose 0.5% qoq, beating expectations for a 0.3% gain, pointing to continued job creation. Employment rate edged up to 66.7% from 66.6%, reinforcing the view that labor demand remains resilient.
At the same time, unemployment rate climbed to 5.4% from 5.3%, above expectations and the highest since the September 2015 quarter. The rise was accompanied by an increase in the labor force participation rate to 70.5% from 70.3%, suggesting that more people are entering or re-entering the job market, which is adding to slack even as hiring continues.
Wage pressures remained contained. The labor cost index rose 2.0% yoy, with private sector wages up 2.0% and public sector wages up 2.2%. The combination of steady employment growth, rising participation, and moderate wage inflation points to a labor market that is still cooling gradually.
NZD/USD in range awaits upside breakout, as RBNZ outlook holds after job data
NZD/USD is trading steadily in range after New Zealand’s Q4 employment data delivered few surprises for policy expectations. The mixed report offered early hints of stabilization but stopped well short of forcing a rethink at the RBNZ. Interest rate is expected to remain on hold at 2.25% for most of the year.
The next policy move is still expected to be a hike rather than another cut, but timing remains highly uncertain. Whether that comes late in 2026 or slips into early 2027 will depend on how growth, inflation, and labor market slack evolve. For now, it is too early to draw firm conclusions.
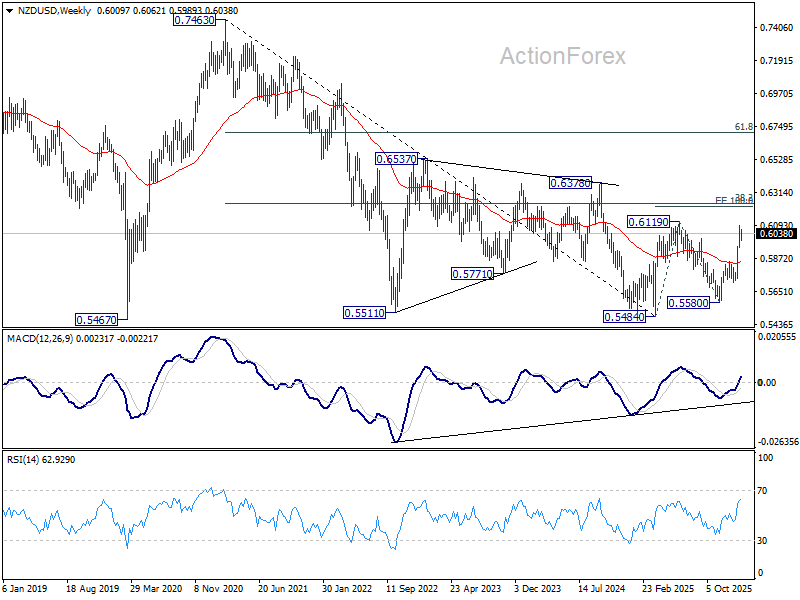
Technically, NZD/USD continues to consolidate below the 0.6092 short-term top. While a deeper pullback cannot be ruled out, downside should be contained well above 0.5852 resistance turned support. Current rise from 0.5580 is seen as the third leg of the pattern from 0.5484 (2025 low). Above 0.6092 should send NZD/USD through 0.6119 (2025 high) to 100% projection of 0.5484 to 0.6119 from 0.5580 at 0.6215.
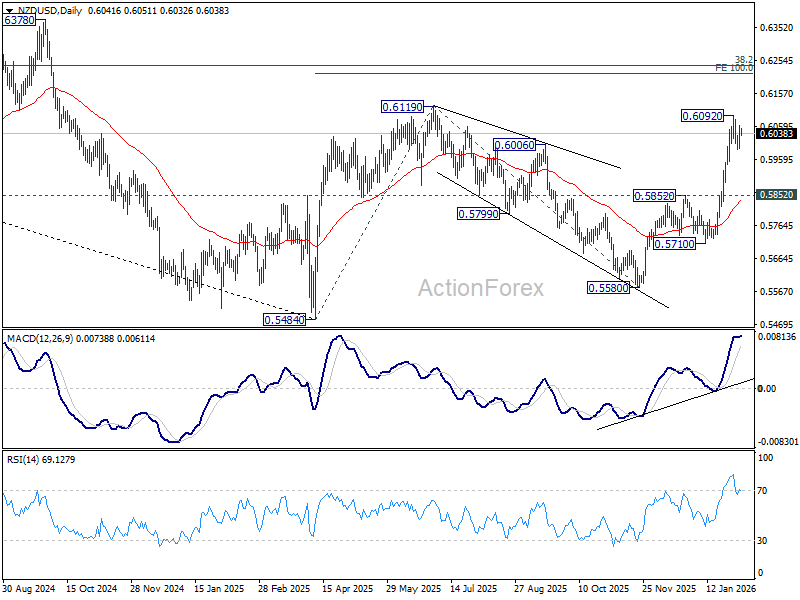
Longer term, the 0.62 resistance area is decisive. Sitting near 38.2% retracement of 0.7463 (2021) to 0.5484 at 0.6240, it will define whether the recovery from 0.5484 evolves into a broader bullish trend reversal or stalls as a corrective rally within a dominant downtrend.
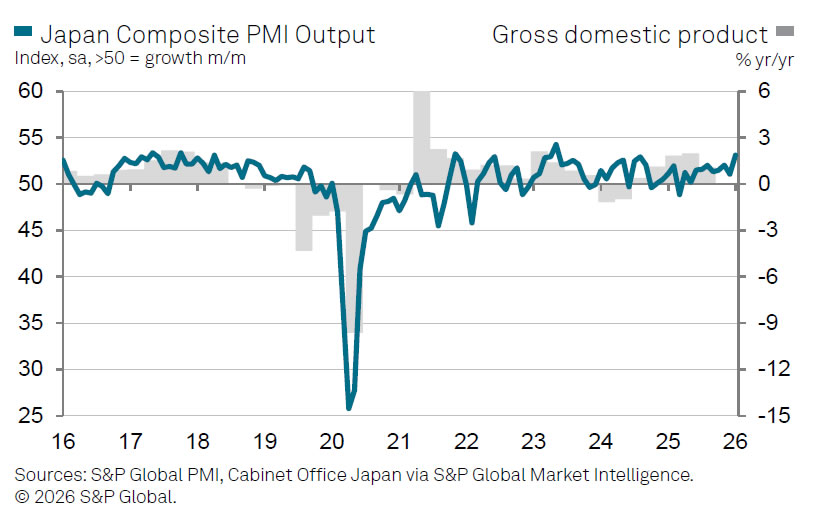
Japan PMI composite finalized at 53.1, broadening growth at start of 2026
Japan’s PMI Services was finalized at 53.7 in January, up from December’s 51.6. PMI Composite rose to 53.1 from 51.1. The data point to a clear acceleration in private-sector activity at the start of 2026, with growth firmly back above expansionary levels.
According to Annabel Fiddes of S&P Global Market Intelligence, business activity rebounded at the fastest pace since May 2023. Services remained the primary growth engine, posting the strongest rise in activity in nearly a year, while manufacturing output also returned to growth for the first time since last June.
The surveys suggest the recovery is becoming more broad-based. Demand improved across both manufacturing and services simultaneously for the first time in more than two-and-a-half years, a notable shift after a prolonged period of uneven momentum. Employment was another bright spot, with firms adding staff across both sectors to expand capacity in response to stronger demand.
Cost pressures eased at the start of the year, with input prices rising at their slowest pace in almost two years. However, companies raised selling prices more aggressively, indicating efforts to rebuild margins.
GBP/JPY Daily Outlook
Daily Pivots: (S1) 211.69; (P) 212.29; (R1) 213.28; More...
Immediate focus is back on 214.83 as GBP/JPY's rebound accelerates higher. Firm break there will resume larger up trend to 220.90 projection level next. Rejection by 214.83 will bring more consolidations first. But in case of another dip, downside should be contained by 55 D EMA (now at 209.70) to bring rally resumption.
In the bigger picture, up trend from 123.94 (2020 low) is in progress. Next target is 61.8% projection of 148.93 (2022 low) to 208.09 (2024 high) from 184.35 at 220.90. On the downside, break of 205.30 resistance turned support is needed to indicate medium term topping. Otherwise, outlook will stay bullish even in case of deep pullback.
GBP/USD Clings To Support, Downside Risks Still In Play
Key Highlights
- GBP/USD started a downside correction from 1.3870.
- A declining channel or a possible bullish flag is forming with support at 1.3600 on the 4-hour chart.
- EUR/USD trimmed some gains and traded below 1.1880.
- The UK Services PMI could remain stable at 54.3 in Jan 2026.
GBP/USD Technical Analysis
The British Pound rallied above 1.3650 and 1.3750 against the US Dollar. GBP/USD even climbed above 1.3850 before the bears appeared.
Looking at the 4-hour chart, the pair traded as high as 1.3869 and recently saw a downside correction. There was a drop below the 1.3800 and 1.3750 levels. The pair declined below the 38.2% Fib retracement level of the upward move from the 1.3342 swing low to the 1.3869 high.
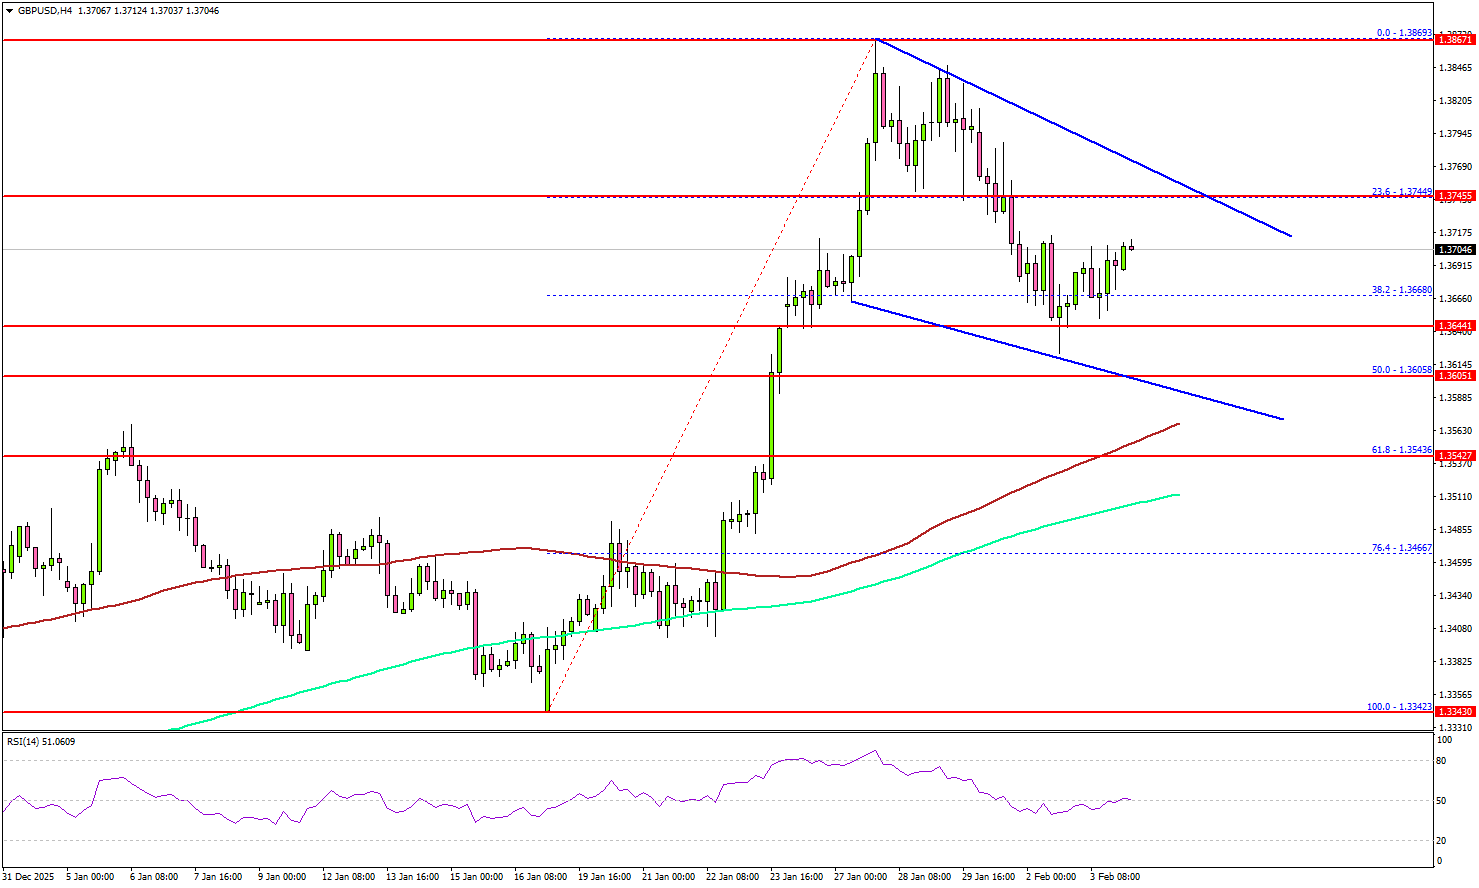
It found bids near the 1.3640 zone. Immediate support could be 1.3645. The first major area for the bulls might be near 1.3600 or the 50% Fib retracement level of the upward move from the 1.3342 swing low to the 1.3869 high.
There is also a declining channel or a possible bullish flag forming with support at 1.3600. The main support sits at 1.3550 and the 100 simple moving average (red, 4-hour), below which the pair might test the 200 simple moving average (green, 4-hour).
If there is a fresh increase, the pair could face resistance near 1.3750. The first key hurdle could be 1.3800. The next stop for the bulls might be 1.3860, where they could face hurdles. A close above 1.3860 could open the doors for more gains. In the stated case, the bulls could aim for a move toward 1.4000.
Looking at EUR/USD, the pair corrected some gains and tested the 1.1780 support. It is now stuck in a range and facing hurdles near 1.1850.
Upcoming Key Economic Events:
- UK Services PMI for Jan 2026 – Forecast 54.3, versus 54.3 previous.
- US S&P Global Services PMI for Jan 2026 – Forecast 52.5, versus 52.5 previous.
- US ISM Services PMI for Jan 2026 – Forecast 53.5, versus 54.4 previous.
Japan PMI composite finalized at 53.1, broadening growth at start of 2026
Japan’s PMI Services was finalized at 53.7 in January, up from December’s 51.6. PMI Composite rose to 53.1 from 51.1. The data point to a clear acceleration in private-sector activity at the start of 2026, with growth firmly back above expansionary levels.
According to Annabel Fiddes of S&P Global Market Intelligence, business activity rebounded at the fastest pace since May 2023. Services remained the primary growth engine, posting the strongest rise in activity in nearly a year, while manufacturing output also returned to growth for the first time since last June.
The surveys suggest the recovery is becoming more broad-based. Demand improved across both manufacturing and services simultaneously for the first time in more than two-and-a-half years, a notable shift after a prolonged period of uneven momentum. Employment was another bright spot, with firms adding staff across both sectors to expand capacity in response to stronger demand.
Cost pressures eased at the start of the year, with input prices rising at their slowest pace in almost two years. However, companies raised selling prices more aggressively, indicating efforts to rebuild margins.