Sample Category Title
Positive Risk Sentiment and Metals Rebounding Currently Caps Further USD Gains
Markets
The (USD) debasement trade last week was mainly driven by longer-term structural and (geo)political considerations. However, yesterday, for once, (US) eco data also again had a role to play. The US January manufacturing ISM delivered an upward surprise that was too big to ignore. The headline index jumped from 47.9 to 52.6 (48.5 expected). It was the first 50+ reading since January last year and the best level since August 2022. Almost all subindices supported the improvement (production 55.9 from 50.7; orders 57.1 from 47.4; backlog of orders 51.6 from 45.8). The employment series also improved but at 48.1 stayed below the 50-mark. The prices paid stayed at a high 59. The figure needs confirmation from tomorrow’s services ISM, but it provides additional evidence that the US economy for now doesn’t need ‘emergency monetary support’, leaving the Fed in a good place to wait and see. US yields already were upwardly oriented (Warsh-driven?) going into the release and extended gains afterward. Yields closed the session 4-5 bps higher across the curve. The Treasury’s estimated borrowing needs were published later in the session but didn’t yield any major surprise ($574 bln borrowing this quarter from an estimated $578 set in November, including a higher $850 bln cash pile at the start; and $109 bln borrowing in Q2). The Q4 cash flow performance was $42 bln better than expected. German Bund yields followed the US move at a distance with yields rising 2-3 bps across the curve. The data also rubberstamped the intraday comeback of the USD dollar. EUR/USD closed the session at 1.179 (from 1.1856). DXY rebound further to 97.63. Both US and European equities apparently enjoyed renewed dip buying (S&P 500 +0.54%, less than 0.5% from all-time record; Eurostoxx 50 +1%). Metals including Gold, Silver and Copper were/are looking for a bottom.
This morning, (Asian) equity markets show an outright risk-on sentiment (Nikkei +3.92%; Kospi +6.84%, Nifty 50 + 2.97%). A positive risk sentiment and metals rebounding currently caps further USD gains (EUR/USD 1.181, USD/JPY 155.4). Risk sentiment probably will continue to set the tone for lobal trading today. The eco calendar is almost empty. The release of the US JOLTS Labour market data is delayed by the (partial) US government shutdown. We keep a close eye at the ‘balance’ between commodities/metals and the Dollar. Maybe the latter is a bit better protected against a (potential) new upleg in metals as US eco data improve further.
News and views
There it is; the first rate hike by a central bank in an advanced economy. The Reserve Bank of Australia (RBA) hiked the policy rate by 25 bps to 3.85% this morning. Motivation was straightforward: “A wide range of data over recent months have confirmed that inflationary pressures picked up materially in the second half of 2025. While part of the pick-up in inflation is assessed to reflect temporary [e.g. the expiry of state electricity rebate schemes] factors, it is evident that private demand is growing more quickly than expected, capacity pressures are greater than previously assessed and labour market conditions are a little tight.” Headline inflation increased to 3.6% y/y in 2025Q4 while underlying gauges accelerated to 3.4%. Both were (substantially) higher than the RBA expected. Strong upward revisions result in CPI not returning to the 2-3% target before mid-2027. GDP grew at around potential in 2025Q3 (2.1%) and probably quickened in the final quarter thanks to strong private demand. Consumption growth picked up by “much more” than expected in the November statement. The Aussie dollar jumped back above AUD/USD 0.70 after losing that handle in the recent US dollar recovery. The combo is trading around the strongest levels since early 2023. Australian swap yields rise 2.4-7 bps in a bear flattening move though gains (at the front) had been higher earlier (>10 bps). Money markets assume another rate hike at the June meeting (90%).
The US will cut tariffs on Indian imports to 18% from 50%, President Trump announced yesterday. Indian exports suffered from the punitive rate of which 25 ppts was introduced in response to India buying Russian crude. The US president said India would no longer buy Russian oil and instead agreed to potentially buy more oil from Venezuela. PM Modi confirmed the trade deal but stayed silent on the oil topic. Trump claimed India would buy over $500bn in American goods (over 5 years). Annual amounts last year only totaled $40bn+ while total bilateral trade only amounted to $212bn in 2024. Either way, the trade détente supports the Indian rupee which had been hitting record lows the last couple of weeks. USD/INR gaps lower to 90.43 from 92 just a couple of days ago. Indian stock markets rise more than 3%.
Government Shutdown Postpones US Jobs Data
In focus today
The US Bureau of Labor Statistics (BLS) announced yesterday that the ongoing partial government shutdown will cause a delay to Friday's January Jobs Report release. This also affects the annual NFP benchmark revisions that were due for release on Friday, as well as the December JOLTs data, that was supposed to be released today. The delay will likely end up being short, only a few days, as the House of Representatives is expected to pass the shutdown-ending funding package today. The BLS will inform markets about the new release dates after the funding has been approved.
The January flash inflation data from France is released today and expected to decline to 0.6% y/y from 0.7% y/y. Both Spain and Germany recorded upward surprises last week, so there is an upside risk to the consensus expectations.
Economic and market news
What happened overnight
In Australia, the Reserve Bank of Australia's policy rate decision resulted in a hike by 25bp to 3.85% in line with our expectations. The hike is the first since November 2023 and a response to increased inflation in the second half of 2025 due to a tight labour market and increased service costs.
What happened yesterday
In the US, there was a big surprise in the ISM manufacturing figures reaching 57.1 in January (December: 47.4), primarily driven by new orders. In general, there seems to be a clear improvement in final demand with increased orders, both domestic and export, growing production, rising imports and higher employment.
Yesterday, President Trump also announced that effective immediately the US cuts India's reciprocal tariff rate from 25% to 18%, resulting in a tariff rate largely in line with neighbouring countries' rates. In addition, there were talks to remove the additional 25% secondary tariff that India has been subject to, due to India's purchases of Russian oil. In return, Trump expects India to reduce trade barriers and purchase oil from the US rather than Russia.
In France, Prime minister Lecornu survived a no-confidence vote on Monday, resulting in the adaptation of the delayed deficit-cutting 2026 budget. The budget aims to reduce the deficit to around 5% of GDP in 2026, as well as boosting military spending. The pension reform raising retirement age has been postponed for now.
In the euro area, the final manufacturing PMI data for January was released at 49.5 (December: 48.8), broadly in line with the flash estimate of 49.4. Among others, the improvement is a result of output returning to growth after declining in December. The data points to a broadly stable euro area manufacturing sector at the beginning of 2026.
In Sweden, the manufacturing PMI increased to 56 in January (December: 55.3), driven by an increase in new orders and employment. The index for input prices has risen for eight consecutive months, reaching 58.4 in January (December: 57.4). PMI prices are not a very good indicator of inflation, but it is the first time in over three years that the index is above its historical average (57.6).
In the UK, the final manufacturing PMI increased to 51.8 in January (December: 50.6), up from the flash estimate of 51.6. The release indicates the quickest pace of expansion since August 2024.
Equities: Global equities were overall on a stronger footing yesterday rising 0.2%. European equities started the day lower, but after the initial setback it was essentially a one-way streak higher through the day to end the day 1% higher. US equities ended its increase around European close, leaving the S&P500 0.5% higher, Nasdaq 0.6% and Russell 2000 1% higher, thus with a small cap outperformance. Overnight, Asian equities are higher as well as US futures this morning.
FI and FX: Despite a substantial selloff in precious metals over the last week, the global bond markets have been relatively stable. However, Treasury yields edged higher yesterday after solid US data with UST1y trading at 4.28%. The USD continued to strengthen yesterday and after a brief visit below 1,18 EUR/USD starts this morning just above. USD/JPY mostly sideways around 155.50. A notable rise in AUD/USD to above 0.70 after RBA raised rates to 3.85%, a hawkish hike. EUR/SEK sits at 10.56 and EUR/NOK at 11.43.
Metals Rebound, Risk Appetite Improves
Monday ended up being a better session for US and European markets than for Asian ones. By the time Europeans came to their desks, the slump in gold and silver prices was largely over. Precious metals were already licking their wounds and starting to feel better, as buyers stepped in to rebuild exposure on a dip — a dip close to the 50-DMA for both metals.
For gold, the 50-DMA stands more than 20% below last Thursday’s peak, and for silver it is nearly 40% below last week’s peak.
In both cases, it was the 50-DMA that revived the urge to buy. So we have an early answer to a complex question: we still don’t know whether this marks the end of the metals debacle, but dip-buyers clearly re-emerge when gold and silver move below their 50-DMA levels.
The gold volatility index, meanwhile, is cooling — a sign that support near these 50-DMAs could hold. Metals are up again this morning in Asia. Gold trades above $4’800 at the time of writing, while silver consolidates near $83 per ounce, above the critical 38.2% Fibonacci retracement that separates the past years’ bullish trend from a bearish consolidation zone.
We can say it: all’s well that ends well — for now.
Ironically, risk appetite appears to be recovering as investors return to gold and silver. The Kospi rebounded more than 5%, the Nikkei hit a fresh record, and US and European futures are higher.
But gold’s latest behaviour is a concern. Traditionally, gold acts as protection against market risk. But it is now behaving like a risky asset — worse, at times like a meme stock — and its negative correlation with risk assets has faded. Highly speculative, leveraged positioning is largely responsible for this unusual behaviour.
The problem is that most diversified portfolios have exposure to gold, meaning this volatility affects all risk profiles. That is disquieting. It will be interesting to see whether the latest slump helps temper gold’s meme-like symptoms and restores its reputation as a boring, low-risk safe-haven asset. Because today, that description no longer fits.
Still, yesterday’s rebound in gold and silver gave investors a sense of relief.
The FTSE 100, for example, shone in London trading, even though mining stocks — a major driver of the recent rally — opened weaker. Early losses were quickly retraced.
As a result, both the FTSE 100 and the Stoxx hit fresh record highs yesterday — who would have thought — as major US indices flirted with all-time highs.
It looks like the worst could be behind us. With leveraged speculative positions flushed out, investors may feel they are returning to a freshly cleaned playground, albeit cautiously.
The long-term outlook for gold remains bullish. The factors supporting gold prices since last year remain firmly in place: trade and geopolitical uncertainty persists; G7 debt dynamics look increasingly unsustainable and are likely to worsen — not only in the US with the “Big, Beautiful Bill”, but also in Japan and in Europe amid rising defence spending.
Appetite for the US dollar, other major currencies, and sovereign bonds remains fragile, and that should continue to underpin the bullish case for hard commodities.
One factor to watch is the US 10-year yield, which could come under persistent upward pressure if expectations grow that new Fed leadership will seek to shrink the Fed’s balance sheet — pushing yields higher and increasing the opportunity cost of holding non-interest-bearing gold. Whether that would be enough to halt or reverse the metals rally will depend on how quickly trust in the US erodes.
Assuming the worst of the metals stress is behind us for now, attention can turn back to earnings.
Palantir, jumped 5% in after-hours trading after reporting 70% year-on-year revenue growth in Q4, with US revenue up 93%, a sign that AI hype is now turning into hard budgets — exactly what investors have been waiting to see.
Today, AMD is due to report earnings, with the spotlight firmly on AI-related growth. Expectations are high, driven by bets that AI-driven data-centre demand will strengthen further. Last week’s earnings from ASML and TSMC reinforced the view that AI-related compute demand remains strong and is still rising.
How strong? Speaking at CES in early January, AMD CEO Lisa Su pointed to a potentially astronomical increase in future AI compute demand, suggesting the world could require more than 10 yottaflops within five years. A yottaflop represents 10²⁴ calculations per second, meaning 10 yottaflops would be 10²⁵. For comparison, global AI compute today is still measured in zettaflops (10²¹). Lisa Su’s estimate implies a need for thousands of times more computing power worldwide over the next five years.
That sounds dramatic, but computing has experienced leaps of this magnitude before as technologies moved from niche to mass adoption. Lisa Su’s message was simple: AI will require vastly more computing power, and that means more data centres and more chips.
AMD’s earnings and guidance are expected to be strong, judging by Lisa Su’s tone at CES. But any hint of slowing demand — particularly from hyperscale data-centre customers — delays in AI investment returns, or rising debt burdens could quickly rattle sentiment. Last week’s post-earnings slump in Microsoft served as a reminder of that risk.
RBA Raises Cash Rate to 3.85%, Warning Inflation Will Remain Above Target for Some Time
RBA lifts cash rate 0.25ppt to 3.85% as expected, citing higher inflation and stronger growth in private sector demand.
- RBA Monetary Policy Board (MPB) raised the cash rate by 0.25ppts to 3.85% as forecast, citing renewed inflationary pressures coming from a faster recovery in private sector demand than expected. It assesses that the labour market remains a little tight, even though several standard indicators are moving in the easing direction.
- The RBA also published revised forecasts in its Statement on Monetary Policy (SMP). Growth is forecast to be stronger in the near term, and so is inflation. The upgrade to the inflation forecasts were large, and imply quarterly outcomes for trimmed mean inflation of around 0.9%qtr for the next two quarters before reverting to a more moderate 0.7%qtr track. At 3.2%, annual trimmed mean inflation is still forecast to be above target at end-2026.
- Beyond the middle of this year, the temporary elements in inflation are expected to unwind, and restrictive monetary policy to take hold. This will dampen inflation and allow it to return close to the mid-point of the 2–3% target range by the end of the forecast horizon in mid 2028. Also weighing on the inflation forecast would be the significant exchange rate appreciation since the last forecast round, though the RBA downplayed this.
- The Governor expressed some discomfort with the inflation profile still being above the 2.5% at the end of the forecast horizon. The July 2025 Statement on the Conduct of Monetary Policy states that when inflation is expected to be significantly away from the midpoint of the 2–3% target the Board will communicate how long it expects it will be before it again meets its objectives and why.
- The post-meeting statement was non-committal on whether further increases in the cash rate are needed, but the shape of the revised forecasts suggests that staff believe it is likely they will be. Given the feedback loop between inflation surprises and RBA assessments of supply, however, we believe it will pay to be more circumspect and do not expect a follow-up hike in March. But the MPB has set a low bar for further hikes and, should the RBA’s inflation forecast for March quarter be validated (which is highly plausible given our own view is only a little below this), it is likely to hike again in May.
As was widely expected, the RBA MPB raised the cash rate 0.25ppts to 3.85% at its February meeting. The recent run of underlying inflation data had been too strong for the MPB to look past, especially given that growth in private sector demand was stronger than expected, and the prior gradual easing in the labour market seemed to have paused or even ceased coming into year-end.
The RBA’s near-term forecasts for inflation have been upgraded noticeably, reflecting this assessment. While the RBA assesses that the bulk of the recent lift in inflation has reflected temporary factors (including some premature margin rebuilding on the back of stronger consumer spending that might not be sustained), some of it is seen as reflecting capacity pressures being tighter in late 2025 than previously assumed.
Over time, the RBA forecasts imply that the temporary component to the recent lift in inflation will unwind. In addition, tight policy will eventually take hold and bring inflation back down towards the midpoint of the 2–3% target range. The end-point of the forecasts at June 2028 show trimmed mean inflation at 2.6%. This implies that the RBA believes that the path for interest rates assumed in the forecasts delivers tight policy.
Since the previous forecast round in November, the exchange rate has also lifted noticeably. All else equal, this should dampen inflation further out, along with the tighter stance of policy. As an aside, we note that in the post-meeting media conference the Governor attributed most of this to a reaction to the shifting outlook for domestic interest rates. The SMP’s coverage of the sell-off in the USD was brief and did not discuss how this feeds through into the trade-weighted index also through its large weight on the Chinese currency. We think this underweights the disinflationary role the exchange rate could play in coming quarters.
In delivering tight policy, though, the RBA is forecasting a sustained period of soggy growth beyond the near term. GDP growth is expected to be below even the RBA’s pessimistic view of trend growth in supply capacity of around 2%. The unemployment rate is rising at the end-point of the forecast horizon, leading us to wonder if an extension of the forecast period would show inflation falling below the mid-point. This supports our view that, while the cash rate might be rising now, reductions can be expected in late 2027 or early 2028.
The RBA believes that the labour market is still on the tight side of full employment and did not ease further in recent months. While this is similar to our own assessment, we think the RBA is putting a lot of weight on the representativeness of some business surveys. Of the 15 indicators in the RBA’s standard suite for assessing labour market tightness, 11 eased and only 4 tightened, including two from business surveys.
The RBA assesses that supply capacity constraints are contributing to higher inflation, and that supply capacity was probably lower than previously believed. We have previously noted our scepticism about this assessment, given that the RBA’s assessments of trend productivity growth, population growth and (to an extent) trends in the participation rate are all systematically too pessimistic. We note that the discussion in the SMP attempts to show that productivity growth is low (and unit labour cost growth high) by comparing with a long-term trend that includes the late 1990s tech boom, a time when productivity growth ran at more than 2%yr and outstripped the rate in the United States. Excluding the mining sector, productivity growth is running at around 1%yr. The comparison in the SMP of the RBA’s assessment of the output gap with that of the OECD highlights just how consequential the judgement between cyclical and trend productivity growth can be.
The emphasis on supply capacity and the way assessments of it get revised in response to inflation surprises raise a deeper issue: every time the RBA is surprised by high inflation outcomes, it concludes that supply capacity must have been lower in the moment than it previously thought. While the RBA claims that it does not knee-jerk react to past inflation, this approach to analysis of supply capacity induces an indirect feedback loop from recent inflation surprises to its forecasts. By way of example, the recent data surprises have induced the RBA’s models to point to a lift in the NAIRU, the unemployment rate consistent with stable inflation. This then induces more assumed inflationary pressure from any given forecast profile for growth and employment.
In the post-meeting media conference, the Governor again highlighted the role of the Productivity Commission as the centre of excellence in identifying ways to lift productivity. While there are clearly policy levers that can be pulled, this puts all the onus on a policy-oriented view of how productivity growth occurs. Not enough attention is given to the role of capital accumulation or private-sector innovation more generally. The weak outlook for both dwelling and business investment in the RBA’s refreshed SMP forecasts provide no grounds for optimism on this front.
As is usual, Governor Bullock declined to provide any forward guidance on the future path of interest rates from here. Given that the forecasts imply higher inflation than the RBA is comfortable with even after raising rates, further rate hikes are clearly a possibility. However, we think the MPB will wait for another quarter inflation print to assess if things are playing out as expected. The low bar for further hikes means that, absent a downside surprise in the March quarter inflation outcome, the MPB is likely to hike again in May.
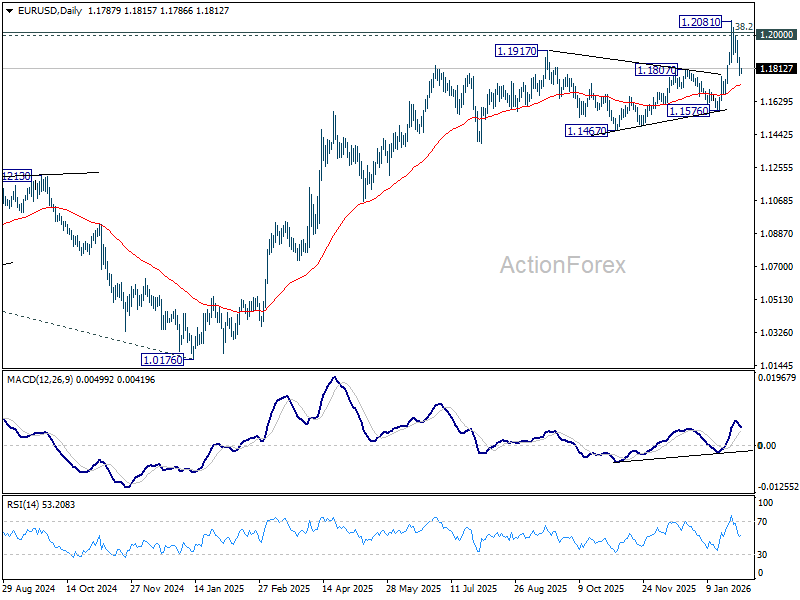
EUR/USD Daily Outlook
Daily Pivots: (S1) 1.1752; (P) 1.1814; (R1) 1.1851; More….
Intraday bias in EUR/USD remains mildly on the downside at this point. Fall from 1.2081 short term top would target 55 D EMA (now at 1.1721). Firm break there will raise the chance of reversal on rejection by 1.2 psychological level, and target 1.1576 support. On the upside, above 1.1893 minor resistance will turn bias neutral. Decisive break above 1.2 will carry larger bullish implications.
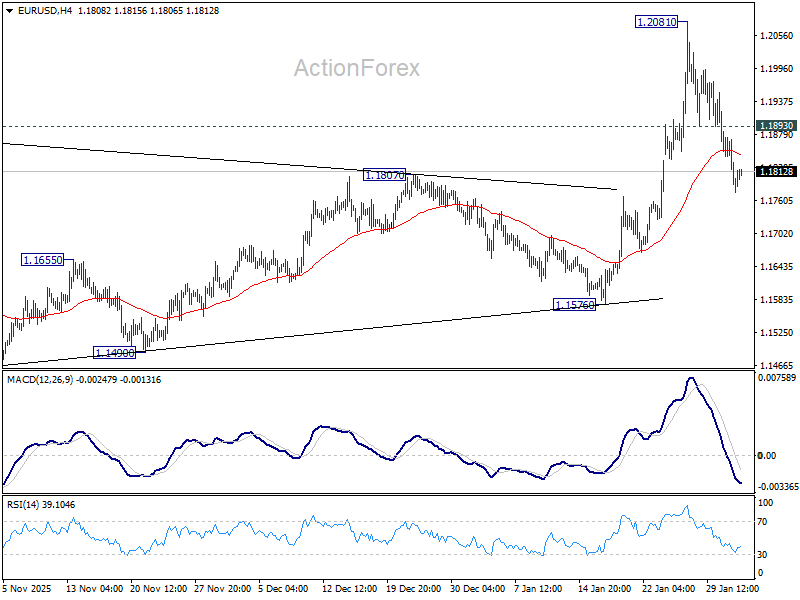
In the bigger picture, as long as 55 W EMA (now at 1.1458) holds, up trend from 0.9534 (2022 low) is still in favor to continue. Decisive break of 1.2 key psychological level will add to the case of long term bullish trend reversal. Next medium term target will be 138.2% projection of 0.9534 to 1.1274 from 1.0176 at 1.2581. However, sustained trading below 55 W EMA will argue that rise from 0.9534 has completed as a three wave corrective bounce, and keep long term outlook bearish.
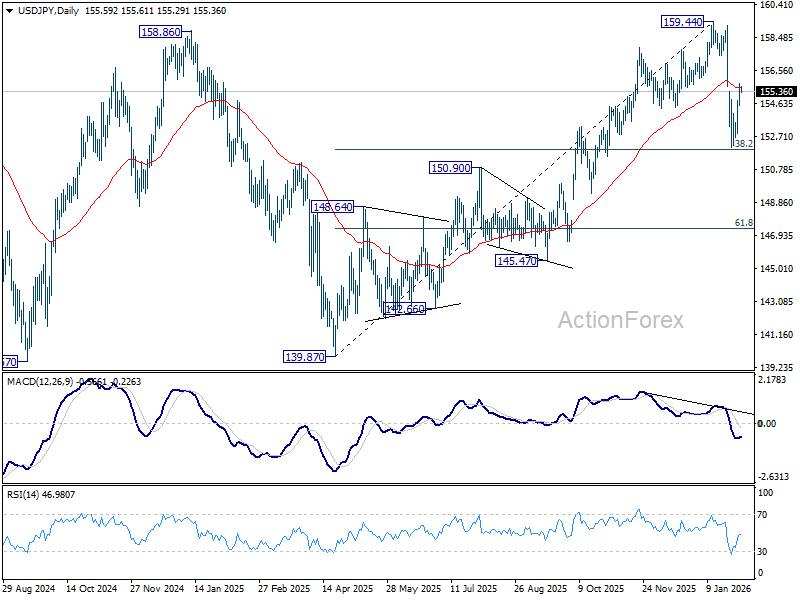
USD/JPY Daily Outlook
Daily Pivots: (S1) 154.84; (P) 155.32; (R1) 156.08; More...
Intraday bias in USD/JPY remains mildly on the upside at this point. Rise from 152.07 is seen as the second leg of the corrective pattern from 159.44. Further rebound should be seen to retest 159.44 next. On the downside, below 154.53 minor support will turn intraday bias neutral first. Sustained break of 38.2% retracement of 139.87 to 159.44 at 151.96 will argue that it is reversing whole rise from 139.87.
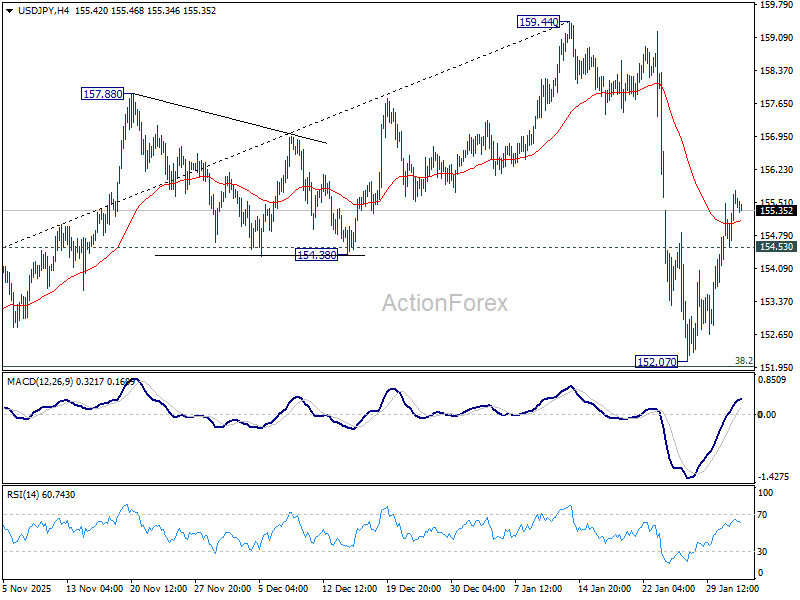
In the bigger picture, outlook is unchanged that corrective pattern from 161.94 (2024 high) should have completed with three waves at 139.87. Larger up trend from 102.58 (2021 low) could be ready to resume through 161.94. This will remain the favored case as long as 55 W EMA (now at 151.59) holds. However, sustained break of 55 W EMA will argue that the pattern from 161.94 is extending with another falling leg.
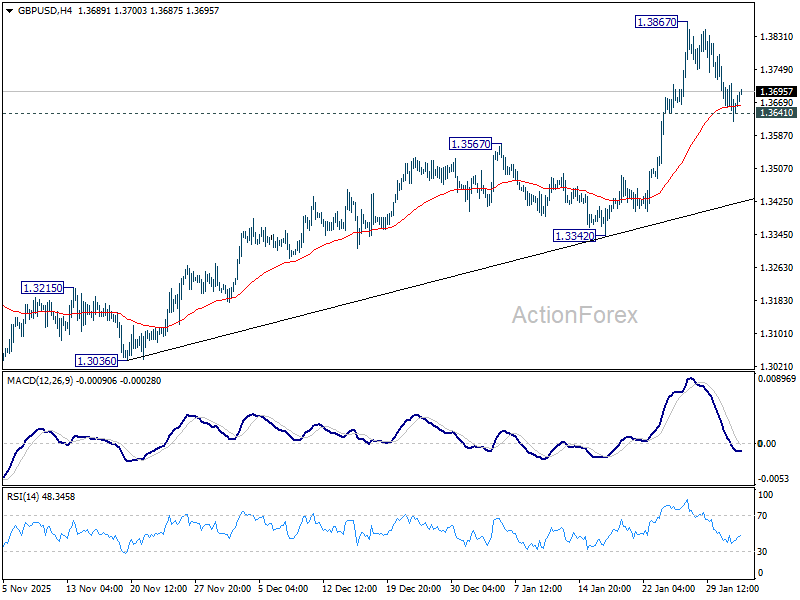
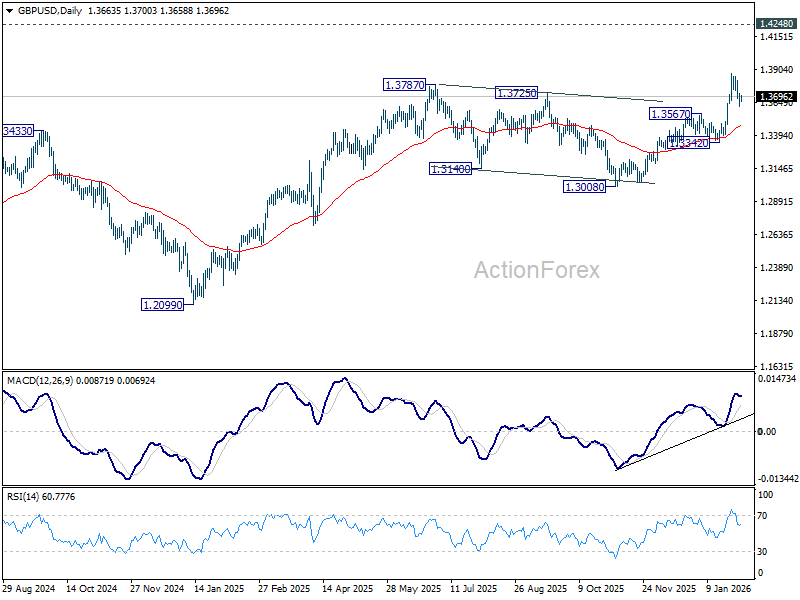
GBP/USD Daily Outlook
Daily Pivots: (S1) 1.3622; (P) 1.3668; (R1) 1.3714; More...
Breach of 1.3641 minor support suggests short term topping at 1.3867. Intraday bias is mildly on the downside for deeper pullback to 55 D EMA (now at 1.3471). On the upside, firm break of 1.3867 will resume larger up trend towards 1.4284 key resistance.
In the bigger picture, rise from 1.0351 (2022 low) is resuming by breaking through 1.3787 high. Further rally should be seen to 1.4284 key resistance (2021 high). Decisive break there will add to the case of long term bullish trend reversal. For now, outlook will stay bullish as long as 1.3008 support holds, even in case of deep pullback.
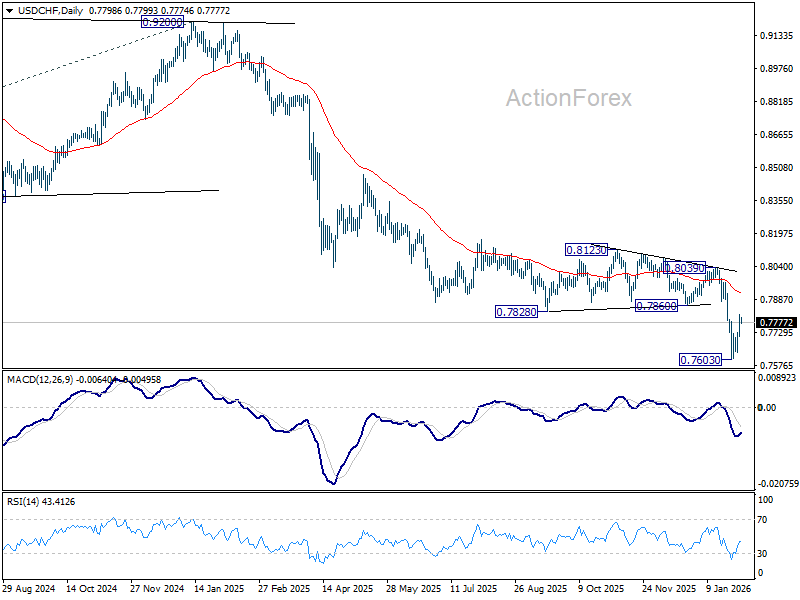
USD/CHF Daily Outlook
Daily Pivots: (S1) 0.7736; (P) 0.7777; (R1) 0.7839; More….
Breach of 0.7792 resistance suggests short term bottoming at 0.7603 in USD/CHF. Intraday bias is mildly on the upside for stronger rebound to 55 D EMA (now at 0.7912). On the downside, below 0.7713 minor support will bring retest of 0.7603. Firm break there will resume larger down trend to 0.7382 projection level next.
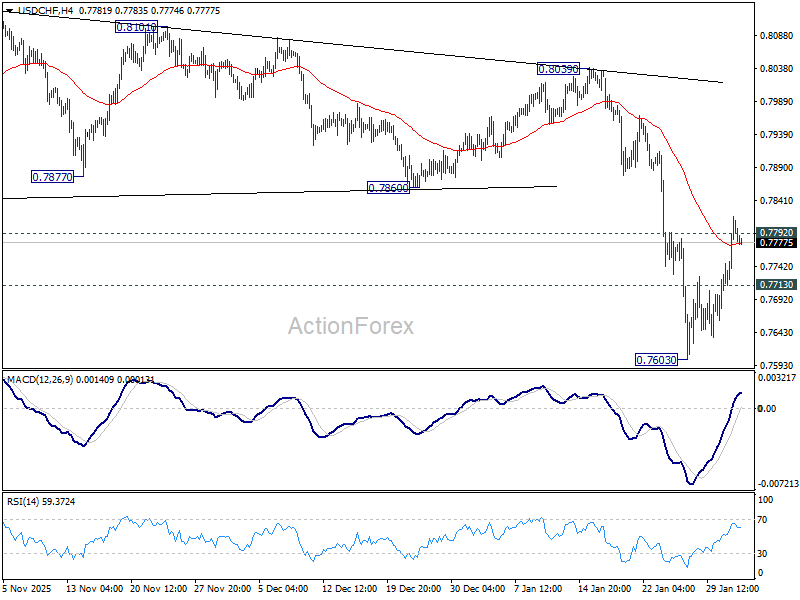
In the bigger picture, larger down trend from 1.0342 (2017 high) is still in progress and resuming. Next target is 100% projection of 1.0146 (2022 high) to 0.8332 from 0.9200 at 0.7382. In any case, outlook will stay bearish as long as 55 W EMA (now at 0.8166) holds.
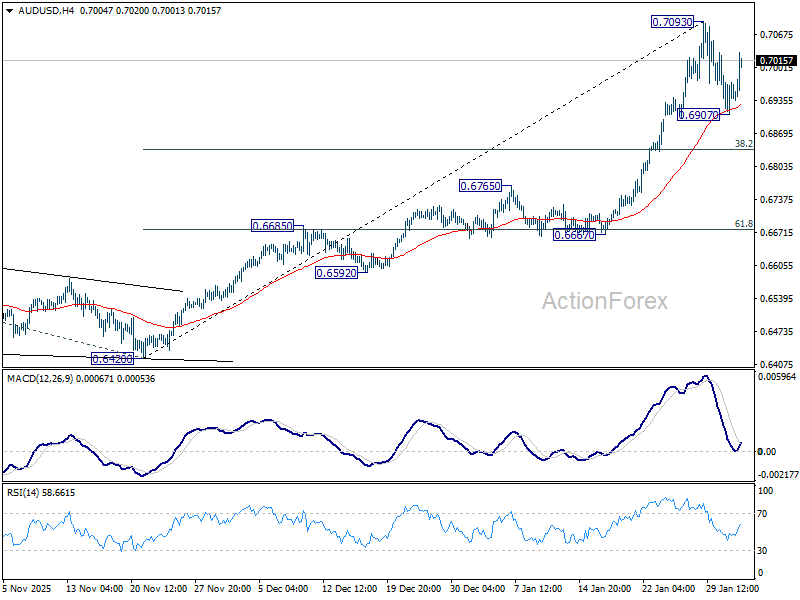
AUD/USD Daily Report
Daily Pivots: (S1) 0.6914; (P) 0.6942; (R1) 0.6976; More...
AUD/USD recovered after drawing support from 55 4H EMA, but stays below 0.7093 temporary top. Intraday bias remains neutral and further rise is expected. Above 0.7093 will extend larger up trend to 100% projection of 0.5913 to 0.6706 from 0.6420 at 0.7213 next. However, break of 0.6907 will bring lengthier consolidations before rally resumption. Deeper pullback would then be seen to 38.2% retracement of 0.6420 to 0.7093 at 0.6836.
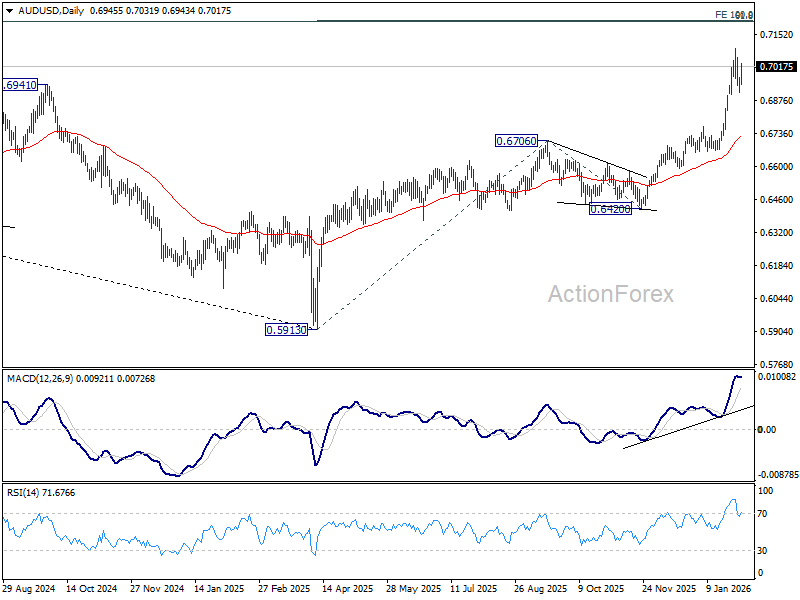
In the bigger picture, current development argues that rise from 0.5913 (2024 low) is reversing whole down trend from 0.8006 (2021 high). Further rally should be seen to 61.8% retracement of 0.8006 to 0.5913 at 0.7206. This will remain the favored case as long as 0.6706 resistance turned support holds, even in case of deep pullback.
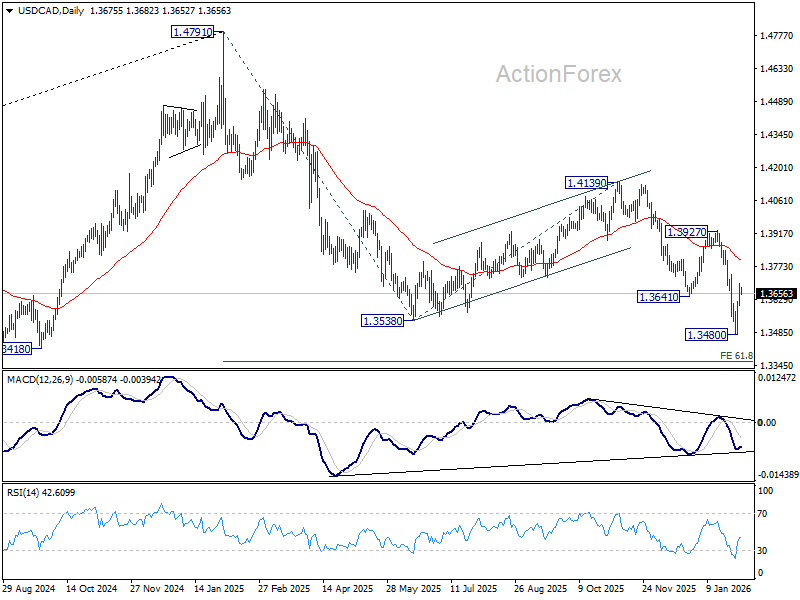
USD/CAD Daily Outlook
Daily Pivots: (S1) 1.3623; (P) 1.3663; (R1) 1.3721; More...
Breach of 55 4H EMA (now at 1.3663) suggests short term bottoming at 1.3480. Intraday bias is mildly on the upside for stronger rebound to 55 D EMA (now at 1.3800). On the downside, below 1.3623 minor support will bring retest of 1.3480 low. Firm break there will resume larger fall to 61.8% projection of 1.4791 to 1.3538 from 1.4139 at 1.3365.
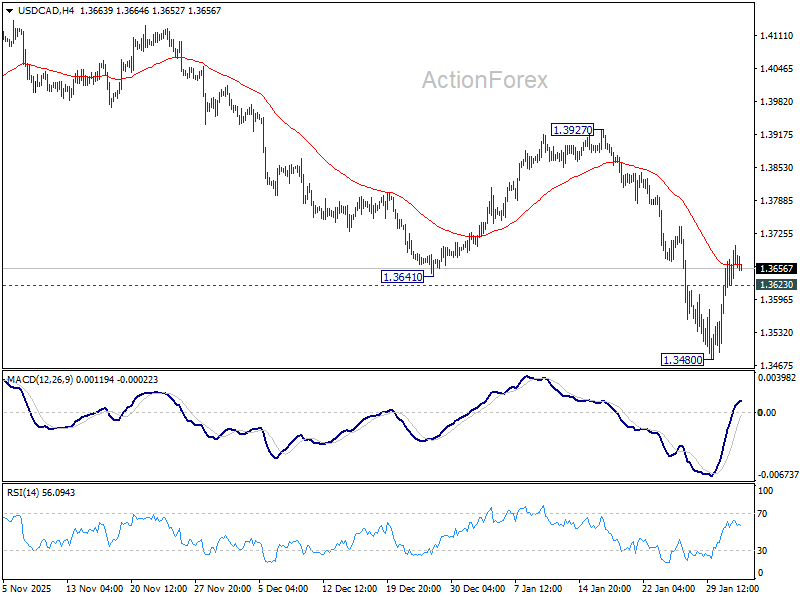
In the bigger picture, price actions from 1.4791 are seen as a corrective pattern to the whole up trend from 1.2005 (2021 low). Deeper fall could be seen as the pattern extends, and break of 1.3538 will target 61.8% retracement of 1.2005 to 1.4791 at 1.3069. For now, medium term outlook will be neutral at best, until there are signs that the correction has completed, or that a bearish trend reversal is confirmed.