Sample Category Title
Will Nonfarm Payrolls Make Investors Reconsider Their Fed Pivot Bets?
With the banking crisis reviving fears that the Fed may need to start cutting rates later this year, market participants may look for their next clue on whether this could be true or not in the US employment report for March, scheduled to be released on Friday at 12:30 GMT. Such expectations have weighed on the US dollar recently, but will a positive surprise in the jobs report be enough to bring the currency back to life?
Investors maintain Fed cut bets
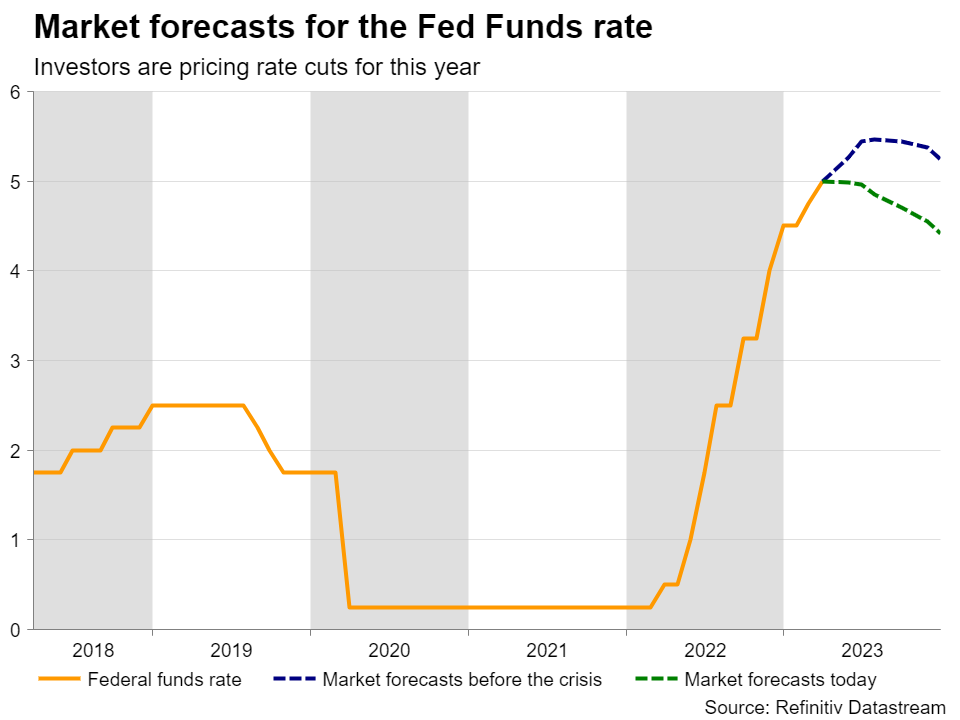
Despite Chair Powell pushing against rate cut expectations at the press conference following the last FOMC meeting, investors put no faith in his words. They kept selling the US dollar, spellbound by the change in the Committee’s forward guidance. Instead of repeating that more rate increases are needed, Fed officials noted that “some additional policy firming may be appropriate”. The word ‘may’ was interpreted as opening the door to a pause as soon as at the May gathering, although the updated dot plot continued pointing to another quarter-point hike and essentially no rate cuts in 2023.
In the aftermath of the meeting, several policymakers kept the door open to more rate increments, with Boston and Minneapolis Fed Presidents Susan Collins and Neel Kashkari saying that there is more work to be done to bring inflation down to the 2% target. However, Kashkari is a well-known advocate of higher rates and thus, his comments came to no one’s surprise. Collins added that despite remaining strong and resilient, banks are likely to pull back on offering credit following the latest turmoil, which may partially offset the need for additional rate increases. The same view was shared by Richmond Fed President Thomas Barkin.
Combined with the further slowdown in the core PCE index for February, the Fed’s favorite inflation metric, these remarks allowed market participants to maintain their rate cut bets, while being evenly split on whether the Fed should hike by another 25bps in May or not. Headlines over the weekend that Saudi Arabia and other OPEC+ oil producers agreed to output cuts, tipped the scale towards hitting the hike button one last time, with the probability rising to 65%, but 50bps worth of rate cuts by the end of the year remained firmly on the table.
US labor market remains tight
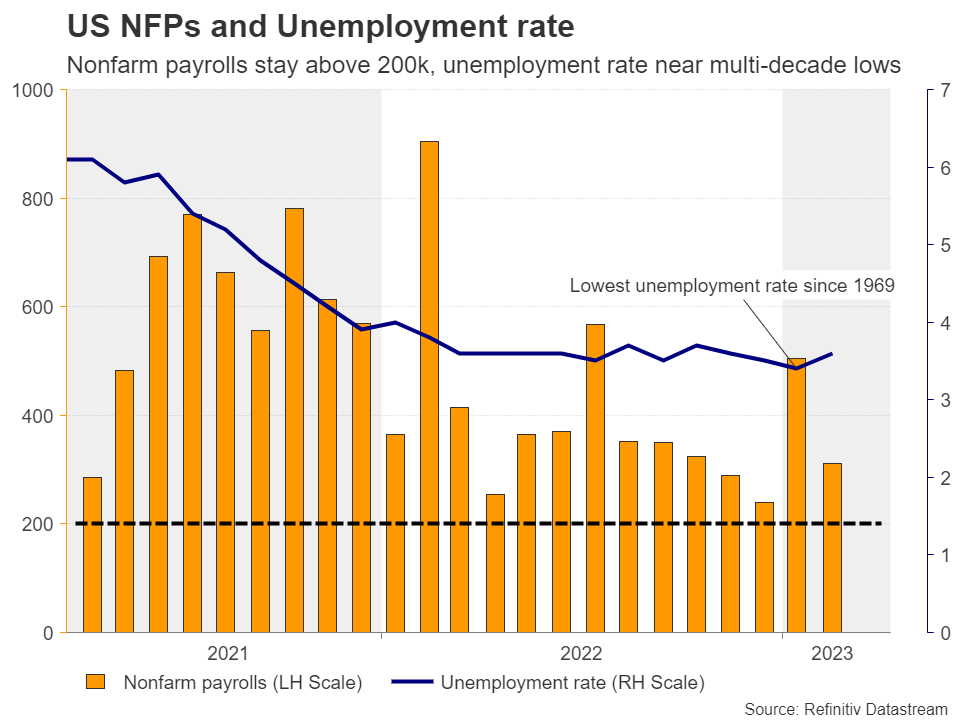
On Friday, nonfarm payrolls are expected to have slowed to 238k in March from 311k, but combined with an unemployment rate of 3.6%, that number seems consistent with a still-tight labor market. What’s more, the S&P Global composite PMI survey said that the rate of total job creation was the fastest in six months in March and thus, the risks surrounding the NFP print may be tilted to the upside.
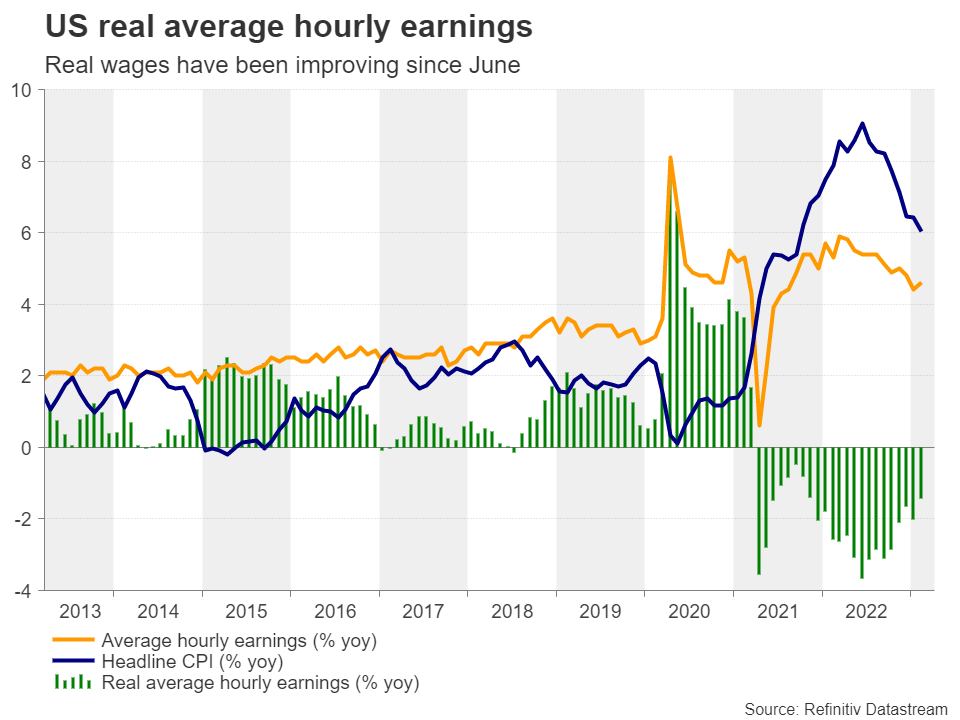
Average hourly earnings are expected to have slowed to 4.3% y/y from 4.6%, but the S&P survey pointed to greater wage bills during the month, so, there may be upside risks. With inflationary pressures in the US easing notably since peaking during the summer, this could mean further improvement in real wage growth. That said, improving wages could also translate into improving consumer confidence and demand in the coming months, which could refuel inflation.
Therefore, a report pointing to further tightening of the labor market could increase the probability for another 25bps hike at the upcoming Fed meeting, with market participants perhaps scaling back some of the rate cut basis points they are anticipating.
Dollar could strengthen, but too early for a bullish reversal
This could prove supportive for the US dollar, but calling for a bullish reversal would still seem unwise. Ahead of the May FOMC meeting, market participants will still have to digest the CPI numbers for March, as well as the first GDP estimate for Q1. Downside surprises in these releases and/or new headlines spreading fresh fears about the stability of the banking sector could very well prompt market participants to start pricing in a May pause again and more rate cuts towards the end of the year.
For now, any dollar strength resulting from Friday’s employment data could be seen as a corrective recovery. Euro/dollar could slide back below 1.0800, but with the ECB expected to continue hiking more aggressively than the Fed, the bulls could recharge from near the crossroads of the 1.0710 barrier and the uptrend line drawn from the low of September 28. They could aim for another test at around 1.1035, marked by the peak of February 2, or even at the 1.1175 zone, which offered strong support between November 24, 2021, and February 25, 2022, and acted as resistance on March 31, 2022. If the pair emerges above that zone, the uptrend may then extend towards the 1.1480 area, which stopped the bulls between January 14 and February 11, 2022.
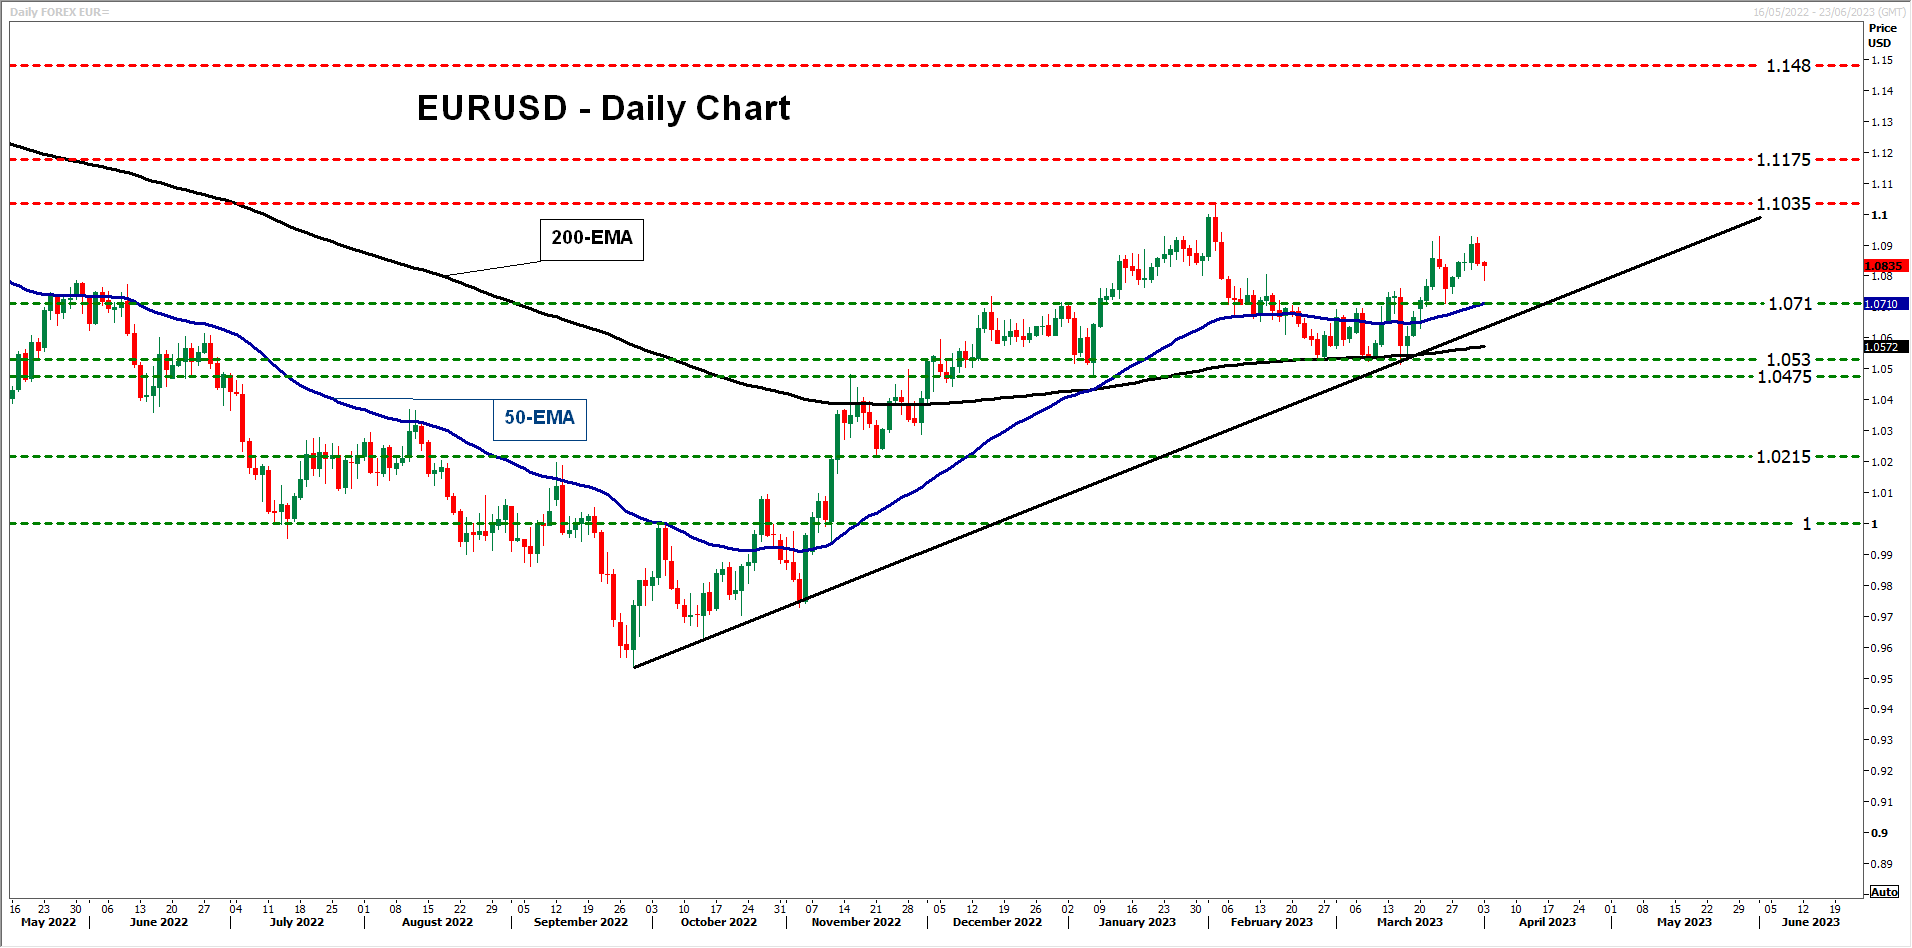
For the near-term outlook to turn bearish, a decisive break below 1.0475 may be needed. Euro/dollar will be already below the pre-discussed uptrend line, while the break below 1.0475 will confirm a lower low on both the daily and weekly charts. The sellers could then get encouraged to dive towards the low of November 21 at 1.0215, the break of which may allow them to put parity back on their radars.
Decision Time for RBNZ; Potentially the Last Rate Hike?
With the market gradually preparing for a much-needed break due to the Easter festivities, the RBNZ will meet this week. The market is looking for another rate increase, but there is a widespread feeling that we are close to the peak of this hiking cycle. Inflation is still elevated, but the aftermath of Cyclone Gabrielle might have affected the RBNZ’s hawkish appetite. Could the kiwi be assisted by the RBNZ and continue its recovery against the US dollar?
RBNZ in the spotlight
At its first meeting for 2023 on February 22, the RBNZ announced a rate hike of 50 bps. The Official Cash Rate (OCR) stands at 4.75%, 450 bps higher than June 2021, when the first rate move was announced. Almost 40 days after the February meeting, the RBNZ is facing a different world. The banking sector woes appear to have somewhat affected the desire of central banks for further aggressive rate moves, despite elevated inflation. Luckily for them, we continue to see signs of headline inflation cooling off globally. But this is only half of the story as core inflation remains abnormally high and thus is the main concern among central bankers.
The domestic situation is also a difficult puzzle for Governor Orr et al to solve. The scarce indicators available to us, to monitor underlying price pressures in various sectors, continue to highlight that the RBNZ’s inflation problem remains at large. The downside surprise in the fourth quarter GDP most likely produced some smiles at the Monetary Policy Committee, but the strong retail sales and the record low unemployment rate are still troubling them. The RBNZ, at some stage, will really start to be concerned about second-round effects due to strong wages that would complicate even further the monetary policy outlook options.
The market is pretty confident about another rate hike
The market is assigning a 90% probability for a 25 bps rate move at Wednesday’s meeting and a total of 49 bps rate hikes until July 2023. This is 25 bps lower than the February unchanged projected rate path by the RBNZ showing a peak of 5.5% in the second quarter of 2023. Considering the recent events, it seems unlikely that the RBNZ will make dramatic changes to its forecasts. A hawkish surprise could clearly inspire the kiwi bulls. In addition, during April we will get the RBNZ’s advice on amending its remit. Although it sounds like moving the goalposts amidst a game, the RBNZ has a history of remit revisions in its attempt to keep ahead of developments. Chances are that the current dual mandate of promoting price stability and supporting maximum sustainable employment will be maintained. However, we might see a more explicit comment about climate change that appears to disproportionately affect this island country.
What is next for the kiwi?
The kiwi managed to stay on the sidelines during the banking sector shenanigans and recorded a mixed monthly performance. However, it managed to outperform both its aussie neighbour and, more importantly, the US dollar. With New Zealand facing high imported inflation, some degree of the domestic currency appreciation might be desirable by the RBNZ.
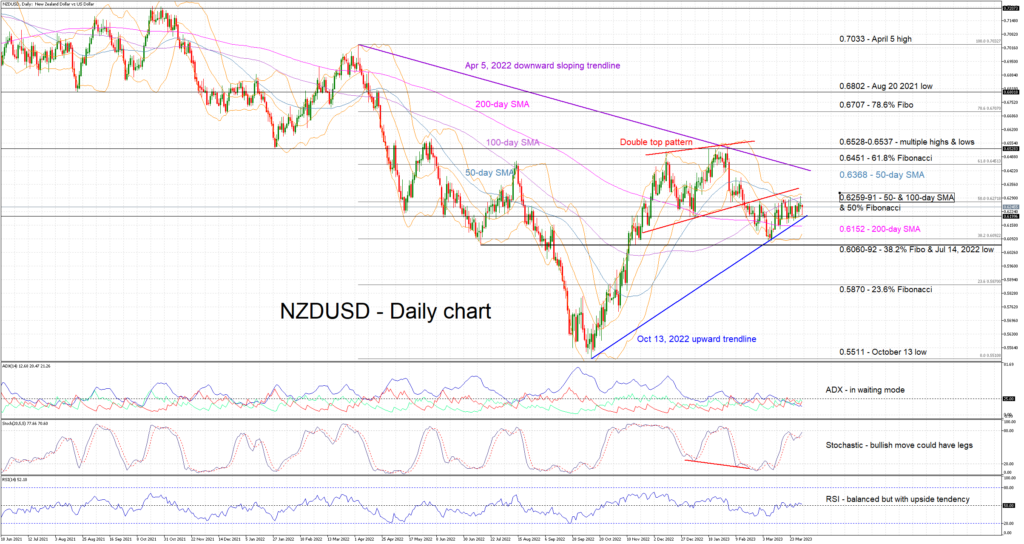
The kiwi/dollar pair has been on an upwards path since the 2.5-year low of 0.5511 on October 13, 2022. It survived the February attack by the dollar bulls, and since the middle of March it has resumed its gentle upward move. The overall technical picture appears to favour the kiwi at this juncture, but the pair is hovering at a rather busy area. The relative tightening of the Bollinger bands and the convergence of the simple moving averages (SMAs) are signs that the biggest battle is yet to occur. Kiwi bulls would love a break higher towards the 0.6591 level and the RBNZ decision could offer significant assistance. On the other hand, a bearish show on Wednesday morning could prompt a retest of the 200-day SMA and the October 13, 2022 upward trendline.
Fed Bullard: Lasting impact of OPEC production cut a question
St. Louis Fed President James Bullard told Bloomberg TV that OPEC's production cut was "a surprise." But he added, "whether it will have a lasting impact I think is an open question."
He noted the challenges in tracking oil prices, admitting that fluctuations "might feed into inflation and make our job a little bit more difficult."
Regarding the current state of the global economy, Bullard pointed out that he had already expected higher oil prices given China's faster-than-anticipated recovery and Europe narrowly avoiding a recession. He also cited strong US data as a bullish factor for the oil market.
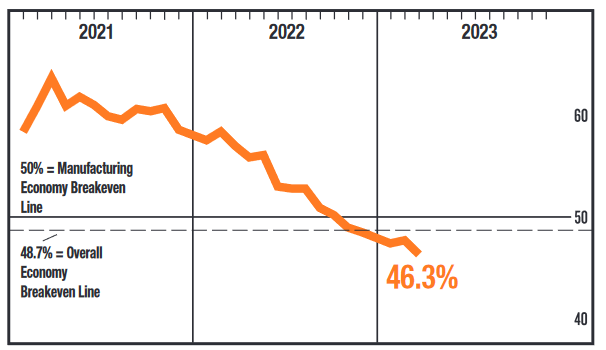
US ISM manufacturing dropped to 46.3, fifth month of contraction
ISM Manufacturing PMI dropped from 47.7 to 46.3 in March, below expectation of 47.5. This is the fifth month of contraction and continuation of a downward trend that began in June 2022. The Manufacturing PMI is at its lowest level since May 2020, when it registered 43.5 percent.
Looking at some details, new orders dropped from 47.0 to 44.3. Production rose from 47.3 to 47.8. Prices dropped from 51.3 to 49.2. Employment dropped notably from 49.1 to 46.9.
The past relationship between the Manufacturing PMI and the overall economy indicates that the March reading (46.3 percent) corresponds to a change of minus-0.9 percent in real gross domestic product (GDP) on an annualized basis.
Sunset Market Commentary
Markets
At the start of trading this morning, key question was whether the calm that gradually returned to markets last week, would again be overthrown by a new ‘event risk’ as OPEC+ this weekend surprised with an additional 1.1 mln bpd oil production cut. After an initial jump to $86 b/p, Brent oil during the European session tentatively found a new equilibrium near $84/85 p/b. As was the case in Asia, the reaction on European equity markets was modest. The EuroStoxx 50 currently trades little changed, holding within reach of the early March top north of 4300. So, the OPEC decision didn’t trigger a hard, outright risk-off repositioning. US indices also maintained most of Friday’s solid gains. To put things in perspective, at $84 p/b, Brent trades well off the levels near $70 from two weeks ago. However, it is still perfectly in the sideways trading range that dominated trading between mid-November and early March. Still, interest rate markets apparently give some more weight to the impact on inflation rather than on potential negative consequences for growth. US and German yields this morning rose up to 7/8 bps. Especially the rise in European yields lost some momentum intraday. German yields are gaining between 5 bps (2-y) and little changed bps (30-y). The German 10-y yield stays below the 2.40% resistance. The 2-y came within reach of the 2.77/83 recent peak levels, but no new test occurred. European money markets almost fully discount an additional 25 bps ECB hike in May and see the peak rate (slightly) above 3.5% in summer. US Treasuries slightly underperform Bunds with US yields rising between 7 bps (2-y) and 2.5 bps (30-y). After finishing this report, the US manufacturing ISM will still be published. (Some) activity indices might be negatively affect by the financial turmoil. However, as this is gradually moving to the back ground, we are cautious to draw any firm conclusions anyway.
In Asia this morning it looked that dollar could become a beneficiary of the OPEC story. DXY briefly surpassed the 103 level at the start of European dealings. However, as the broader market reaction stay modest and orderly, new USD selling kicked in. The index already more than reversed initially gains (currently 102.4 area). Similar story for EUR/USD. The pair briefly tested bids below 1.08 this morning, but is again changing hands near 1.088. The yen underperformance in Asia is also largely undone with USD/JPY (133.0) trading little changed compared to Friday’s close. Oil and commodity related currencies including the Canadian dollar (USD/CAD 1.345) and the Norwegian krone (EUR/NOK 11.25 from 11.356 close on Friday), the Aussie dollar (AUD/USD 0.677 from 0.6685) and to a lesser extent the kiwi dollar (0.628) are today’s outperformers. CE currencies again show remarkable strength (EUR/PLN 4.669, EUR/HUF 379.0). At EUR/CZK 23.45, the Czech krona even nears the early March multi-year peak.
News Headlines
Swiss inflation rose by 0.2% m/m in March, bringing the yearly figure down from 3.4% to 2.9%, Federal Statistical Office data showed today. The data surprised to the downside (3.2% y/y expected). Core inflation eased from 2.4% to 2.2%, defying a 2.5% consensus estimate. The biggest contributors to the monthly advance were, amongst others, international package holidays, air transport and fruiting vegetables. The biggest monthly drops were seen in supplementary accommodation, heating oil and berries. While inflation is still above the Swiss National Bank’s 2% inflation target, the downward surprise and especially the unexpected deceleration in core inflation does trigger a kneejerk downleg in Swiss swap yields today. The front end of the curve drops up to 4 bps and more. The long end adds more than 3 bps. The Swiss franc loses some territory with EUR/CHF advancing from 0.992 to 0.995.
Inflation in Turkey fell more than expected, but that’s about it. At 50.51% (vs 51.25% anticipated) from 55.18%, prices still rise at a stupendously fast pace and at tenfold the central bank’s target. Monthly readings are still well above 2%. Core inflation decelerated from 50.58% to 47.36%, in line with the analyst estimate. The slowdown is largely an energy story and risks are that it may stop soon anyway. Fiscal spending in the aftermath of the earthquake is unlikely to end before the presidential elections on May 14. Meanwhile, monetary policy is extremely easy. With rates at 8.5%, real rates are well below zero. And as the Turkish lira continues to depreciate to ever new lows, imported inflation will continue to rise. The lira loses again today. EUR/TRY left intraday lows at around 20.69 to trade at 20.89 currently. USD/TRY is on track for a new record high close (19.20).
XAU/USD: Gold Keeps Firm Tone But Still Holding in a Range and Looking for Fresh Signals
Gold bounces back after short-lived negative reaction on OPEC’s surprise decision which temporarily inflated dollar.
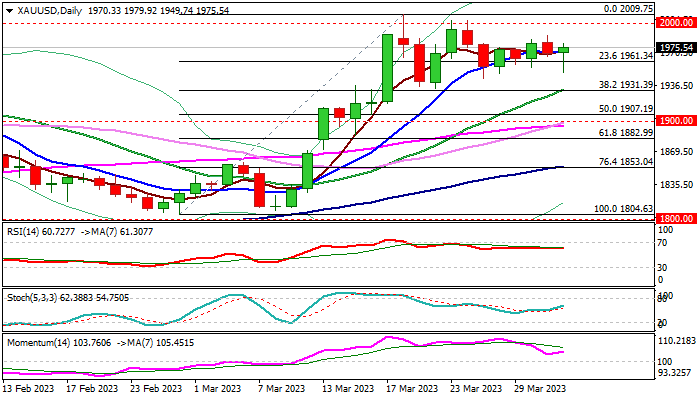
Renewed strength pushes the price back to the middle of the near-term range ($2009/$1944) established after multiple rejections above $2000, but strong bids were found at $1945/50 zone, limiting pullback and keeping larger bulls intact.
Extended consolidation with prevailing bullish bias, look as likely near-term scenario, as the metal looks for fresh direction signals.
The price remains resilient despite renewed risk appetite on fading banking fears, but may face headwinds on growing expectations for the Fed’s 0.25% rate hike in May which would hurt demand for interest-free metal.
Positive factors for gold are bullish technical studies on daily chart and a large March’s monthly candle which formed bullish engulfing pattern, as well as solid safe-haven demand on fragile global economic and geopolitical situation.
On the other hand, stubbornly high inflation increases possibilities of further rate hikes and higher terminal rate that would make dollar more attractive and add pressure on the yellow metal.
Initial supports lay at $1961/45 zone (Fibo 23.6% retracement of $1804/$2009 rally/recent range floor) followed by $1932/32 (20DMA/Fibo 38.2%) and pivotal $1907/00 zone (50% retracement/psychological) loss of which would confirm top ($2009) and signal reversal.
Conversely, firm break above $2000 barrier would generate initial signal of bullish continuation and open way for test of record highs at $2070/74).
Res: 1987; 2000; 2009; 2037.
Sup: 1961; 1944; 1931; 1918.
US 500 Index Ticks Up Above 4,000 and Medium-Term Uptrend Lines
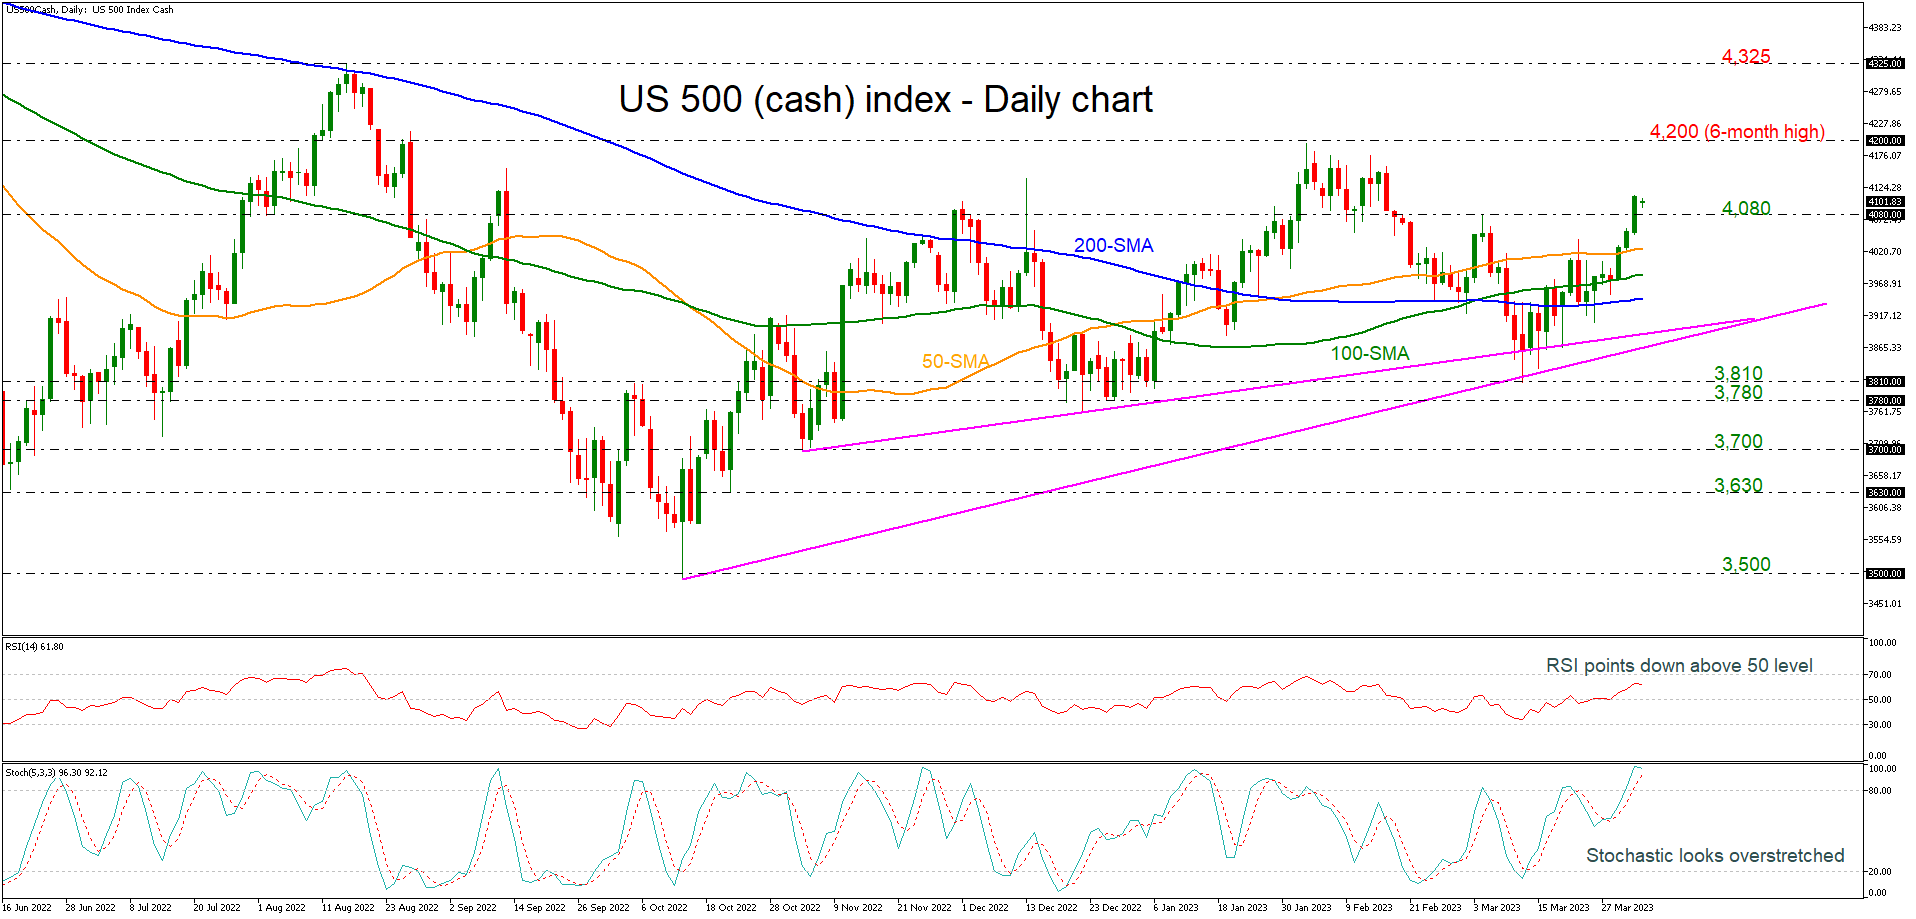
The US 500 cash index has surged more than 3.5% over the last three days, overcoming the 4,100 level. However, the technical oscillators appear overbought. The RSI is pointing down in the positive territory, while the stochastic is turning lower above the 80 level, suggesting that the bullish move in the market may come to an end soon. Also, the index is still standing above the simple moving averages (SMAs) and the medium-term uptrend lines.
Should the index manage to strengthen its positive momentum, the next resistance could come around 4,200, which is a six-month peak. A break above it would shift the bias to a more bullish one and open the way towards the 4,325 barrier.
However, if prices are unable to remain above 4,080, the risk would shift back to the downside, with the 50- the 100, and the 200-day SMAs at 4,027, 3,980 and 3,940 respectively, once again coming into focus, as well as the ascending trend lines around 3,900.
To conclude, the outlook remains positive since prices hold above all the moving average lines and the recent upside rally stays in place.
EUR/USD Daily Outlook
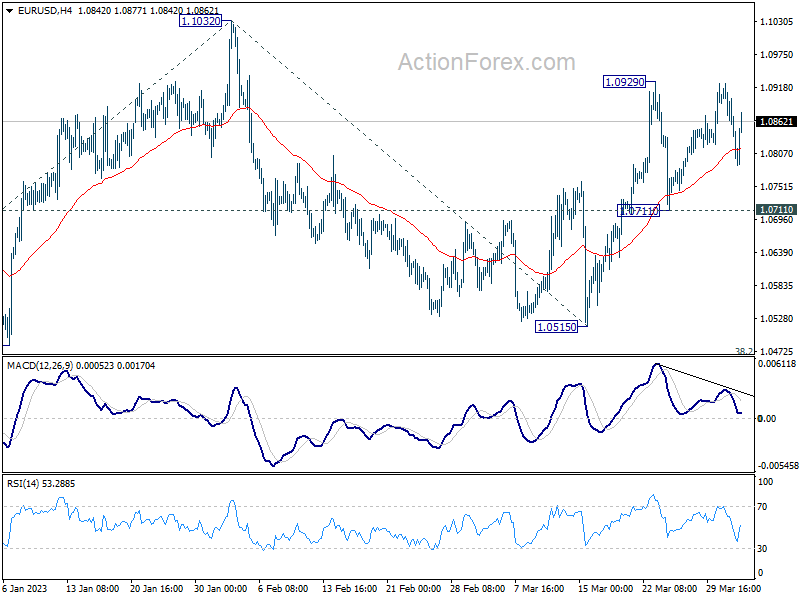
Daily Pivots: (S1) 1.0811; (P) 1.0869; (R1) 1.0900; More...
EUR/USD is staying in consolidation from 1.0929 and intraday bias remains neutral first. Further rally is in favor with 1.0711 support intact. On the upside, break of 1.0929 will resume the rally from 1.0515 to retest 1.1032 high. Decisive break there will resume larger up trend from 0.9534 to 1.1273 fibonacci level next. On the downside, though, break of 1.0711 will turn bias to the downside to extend the corrective pattern from 1.1032 with another decline.
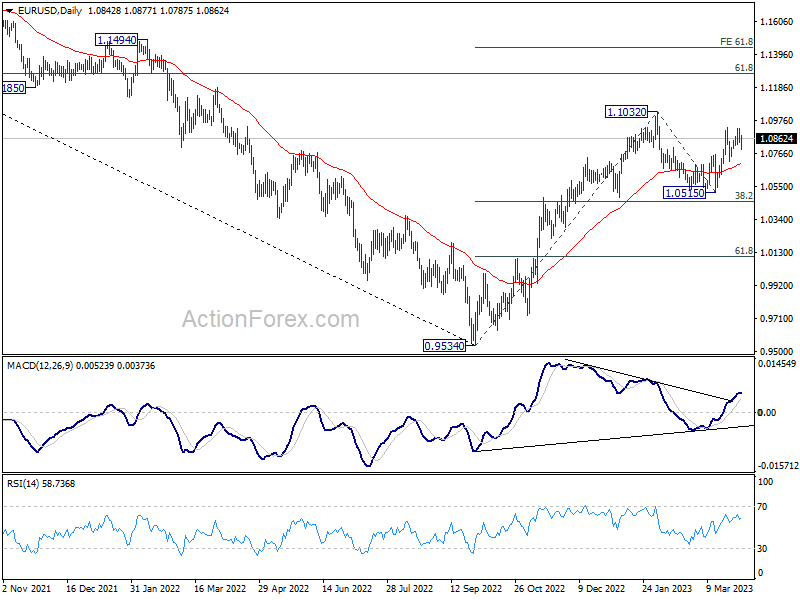
In the bigger picture, rise from 0.9534 (2022 low) is in progress with 38.2% retracement of 0.9534 to 1.1032 at 1.0460 intact. The strong support from 55 week EMA (now at 1.0625) was also a medium term bullish sign. Next target is 61.8% retracement of 1.2348 (2021 high) to 0.9534 at 1.1273. Sustained break there will solidify the case of bullish trend reversal and target 1.2348 resistance next (2021 high).
GBP/USD Mid-Day Outlook
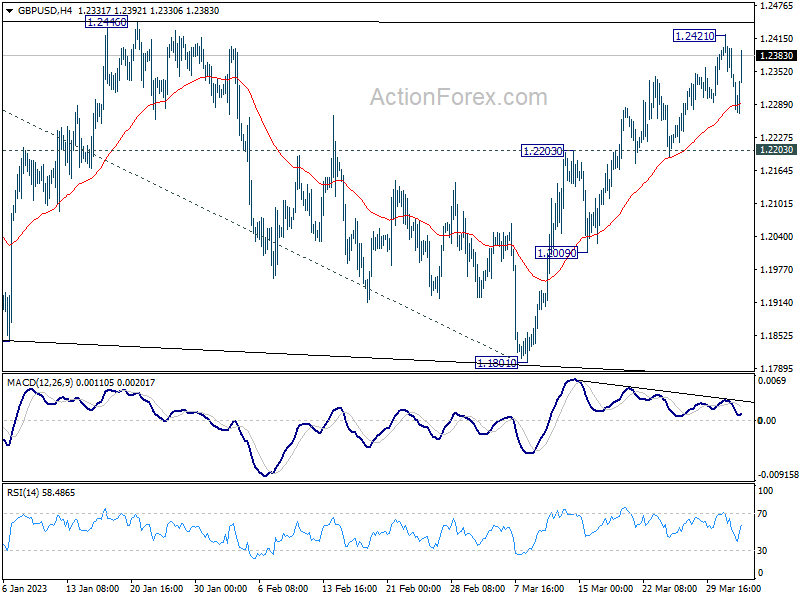
Daily Pivots: (S1) 1.2296; (P) 1.2360; (R1) 1.2394; More...
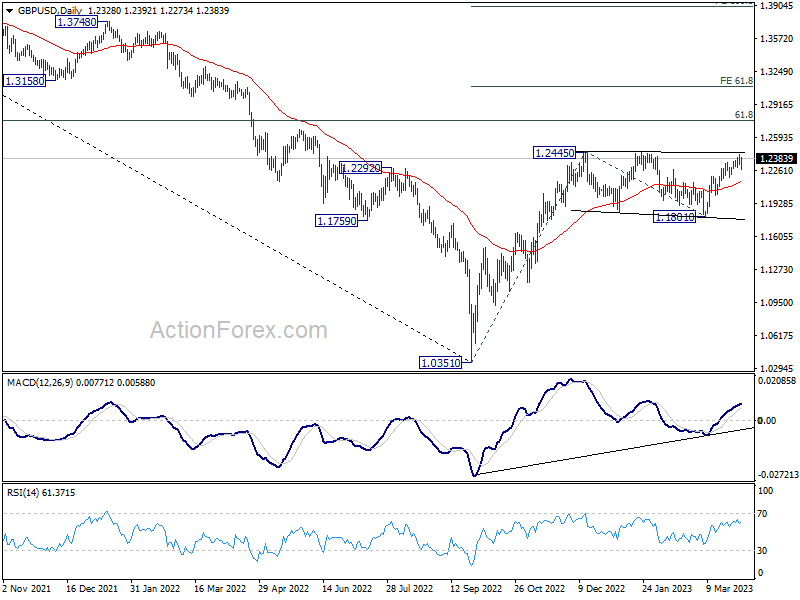
Intraday bias in GBP/USD remains neutral and further rise is in favor with 1.2203 resistance turned support intact. On the upside, decisive break of 1.2445/6 resistance zone will resume larger rally from 1.0351, and target 1.2759 fibonacci level. However, break of 1.2203 resistance turned support will extend the corrective pattern from 1.2445 with another falling leg, and turn bias back to the downside.
In the bigger picture, the rise from 1.0351 medium term term bottom (2022 low) is in progress for 61.8% retracement of 1.4248 (2021 high) to 1.0351 at 1.2759. Sustained break there will add to the case of long term bullish trend reversal. Further break of 61.8% projection of 1.0351 to 1.2445 from 1.1801 at 1.3095 could prompt upside acceleration to 100% projection at 1.3895. For now, this will remain the favored case as long as 1.1801 support holds, even in case of deep pull back.
USD/CHF Mid-Day Outlook
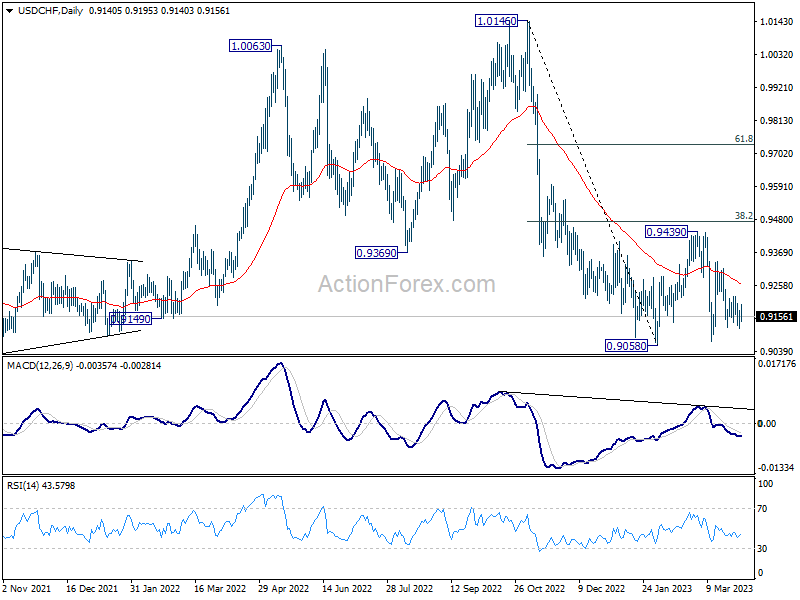
Daily Pivots: (S1) 0.9119; (P) 0.9149; (R1) 0.9181; More...
USD/CHF is still extending the corrective pattern from 0.9058 low. Intraday bias remains neutral for the moment. Another rise cannot be ruled out. But upside should be limited by 0.9474 fibonacci level. On the downside, firm break of 0.9058 will resume larger down trend from 1.1046.
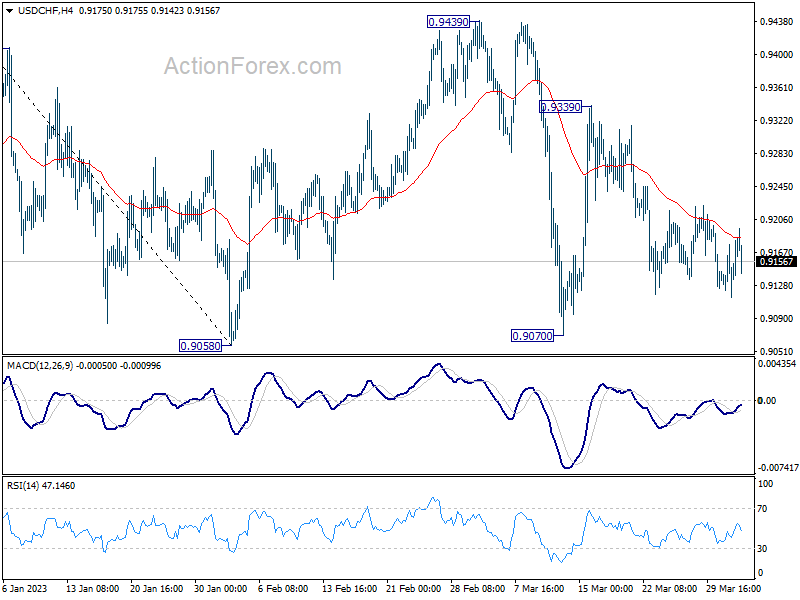
In the bigger picture, fall from 1.1046 (2022 high) should still be in progress with 38.2% retracement of 1.0146 to 0.9058 at 0.9474 intact. Prior rejection by 55 week EMA was a medium term bearish sign. Break of 0.9058 will resume such decline towards 0.8756 support (2021 low). But overall, this fall is still as a leg in the long term range pattern from 1.0342 (2016 high). So, downside should be contained by 0.8756 to bring reversal.