Sample Category Title
BoC Gravelle emphasizes agility amid uncertain times; monitors global banking stress
BoC Deputy Governor Toni Gravelle, in a speech yesterday, stressed the need for flexibility in response to the uncertain economic environment. He pointed out that, within the past month, headline inflation has dropped, and global markets have seen reduced risk appetite, partially due to the increased stress in global banking systems.
Gravelle noted that, despite these challenges, Canada's labor market remains tight, which is pushing many services prices upward. He said, "We continue to expect consumer price index (CPI) inflation to come down in the months ahead, but we will need to see further slowing in core inflation to get CPI inflation back to the 2% target."
As the BoC prepares for the April Monetary Policy Report, Gravelle explained that the central bank is closely monitoring global banking stresses, and will assess the macroeconomic impacts of this evolving situation. He emphasized that the bank will be "looking specifically at potential spillovers into the real economy to the extent that financial conditions tighten and there are broader confidence effects."
Crude Oil Price Regains Traction, US GDP Next
Key Highlights
- Crude oil price is moving higher above the $70 resistance.
- It broke a key bearish trend line with resistance near $69.80 on the 4-hours chart.
- Gold price is stable above the $1,940 support zone.
- Ripple price rallied above $0.55 and outperforming Bitcoin.
Crude Oil Price Technical Analysis
Crude oil price found support near the $64.30 zone against the US Dollar. The price remained stable and started a decent increase above the $68.00 resistance zone.
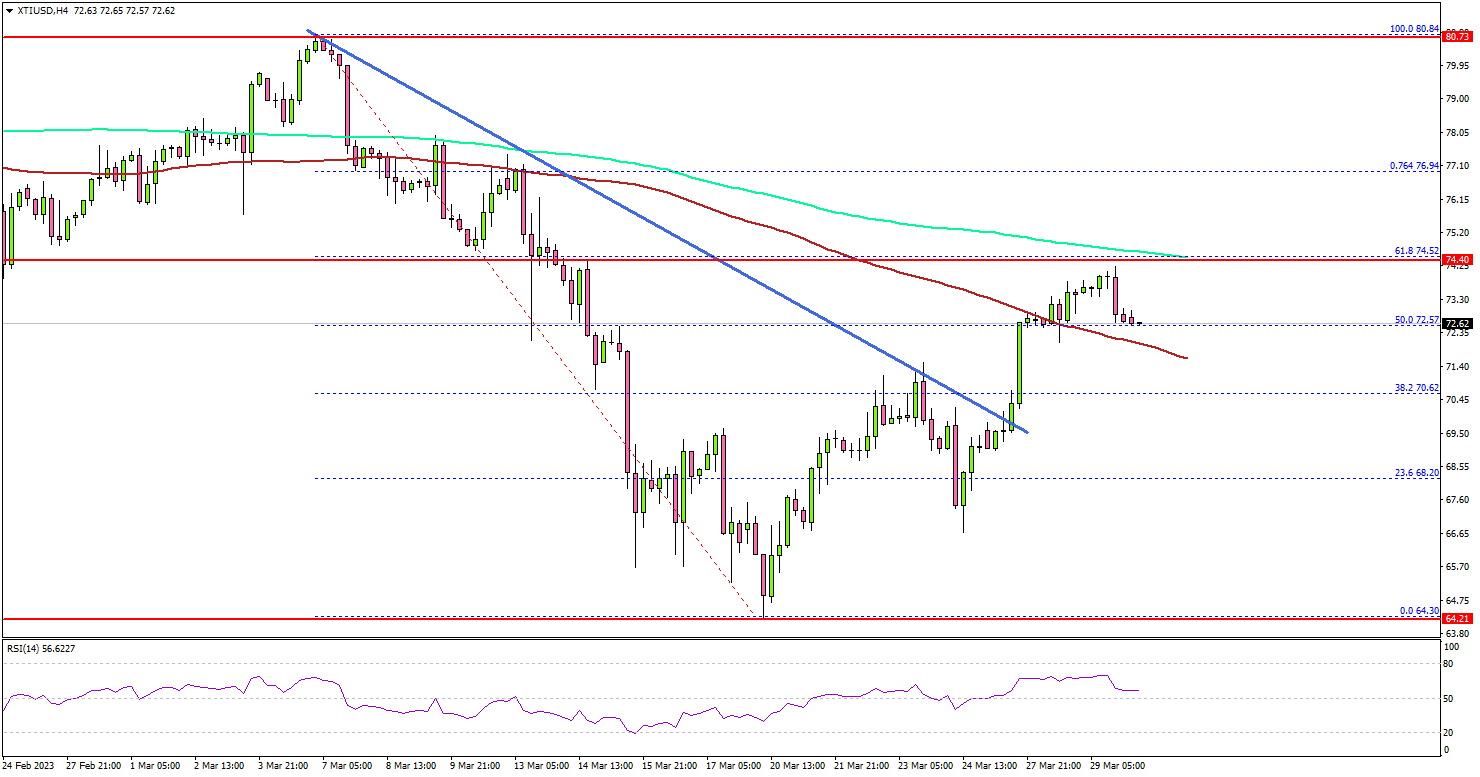
Looking at the 4-hours chart of XTI/USD, the price was able to clear the $70.00 resistance zone. Besides, the price broke a key bearish trend line with resistance near $69.80.
It opened the doors for more gains above the $72.50 resistance and the 100 simple moving average (red, 4-hours). Finally, the price climbed above the 50% Fib retracement level of the downward move from the $80.84 swing high to $64.0 low.
On the upside, the price is facing resistance near the $74.50 zone. It is near the 61.8% Fib retracement level of the downward move from the $80.84 swing high to $64.0 low.
The next major resistance is near the $76.50 zone. A clear move above the $76.50 resistance could open the doors for another steady increase towards $78.80 or even $80.00.
An immediate support is now forming near the $72.20 zone. The next major support sits near the $70.00 level. Any more losses might call for a test of the $64.30 support zone in the coming days.
Looking at gold price, the bulls were active above the $1,940 support. However, the price is still facing a strong resistance above the $2,000 zone.
Economic Releases to Watch Today
- US Gross Domestic Product for Q4 2022 – Forecast 2.7% versus previous 2.7%.
- US Initial Jobless Claims - Forecast 196K, versus 191K previous.
CADJPY Wave Analysis
- CADJPY broke key resistance 97.20
- Likely to rise to resistance level 98.60
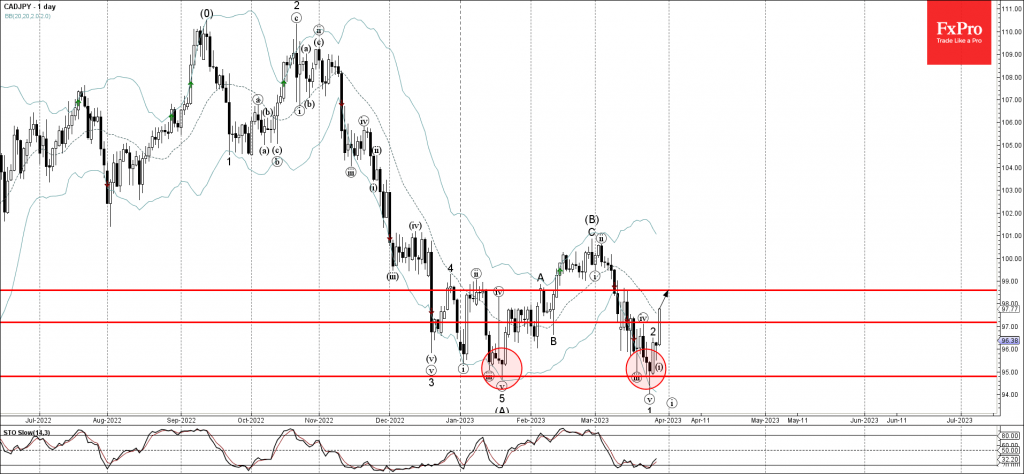
CADJPY continues to rise sharply after the earlier breakout of the key resistance 97.20 (which stopped the previous minor correction (iv) in March).
The breakout of the key resistance 97.20 accelerated the active short-term upward correction 2, which belongs to the higher order impulse wave (C) from the end of February.
CADJPY can be expected to rise further toward the next resistance level 98.60 (which reversed the price earlier this month).
New Zealand Dollar Runs Out of Steam, Business Confidence Next
The New Zealand dollar is lower on Wednesday. NZD/USD is trading at 0.6236 in the North American session, down 0.28%. In the US, Pending Home Sales slowed but were better than expected. Later in the day, New Zealand releases ANZ Business Confidence.
New Zealand business confidence expected to improve
New Zealand’s business sector has been pessimistic about the economy and that is expected to continue. The ANZ Business Confidence Index has been mired in negative territory, and no relief is expected from the March release on Thursday (New Zealand time). The estimate stands at -47.5, versus -43.3 prior. The silver lining is that things have improved since a multi-year low reading of -70.2 in December.
The New Zealand economy slowed in Q4, with a gain of 2.2% y/y, down sharply from 6.4% in Q3 and below the estimate of 3.3%. The continuing rise in interest rates has dampened economic activity, with RBNZ Chief Economist Conway describing the slowdown as “welcome”. Conway acknowledged that even with the central bank’s aggressive tightening cycle, it was uncertain if inflation expectations had been contained.
The RBNZ has projected inflation expectations for Q1 at around 5.5%, and inflation is running at a 7.2% clip, despite the central bank’s tightening. The RBNZ meets next on April 5th and the markets have priced in a 25-bp hike at 90%. That could be the end of the current tightening cycle, with a 50/50 chance of another rate hike in May and rising speculation of a rate cut before the end of the year.
US Pending Home Sales outperform
In the US, Pending Home Sales beat expectations, as the February reading came in at 0.8%, versus 8.9% prior and an estimate of -2.9%. The Case-Shiller Housing Index declined for a ninth straight month, falling to 2.5% in January, shy of the forecast of 2.6% and the prior reading of 4.6%. The housing sector is in a slump, with mortgage payments almost doubling from a year ago.
NZD/USD Technical
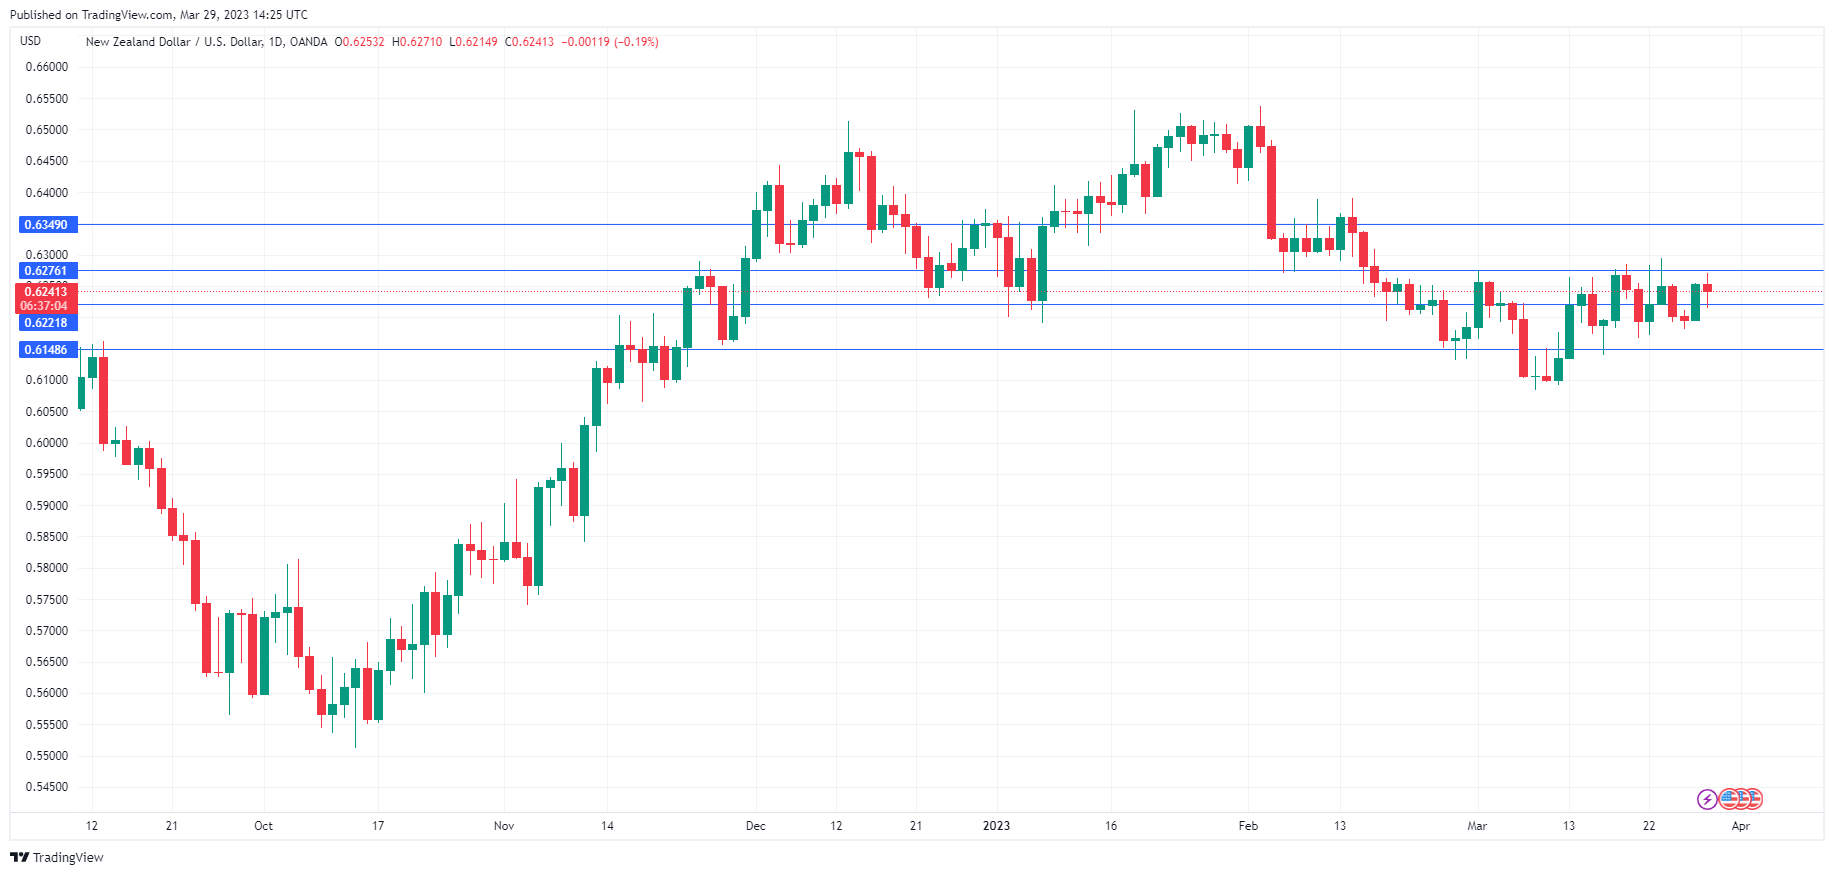
- NZD/USD put pressure on resistance at 0.6276 earlier in the day. Above, there is resistance at 0.6349
- There is support at 0.6221 and 0.6148
Sunset Market Commentary
Markets
The core bond yield rally dwindled in European morning trading. Yields were even down a few bps before finding a bottom already around noon. Rates were more or less flat when European investors met their first US colleagues. After that, the intraday upleg gathered a bit more steam. Current changes in the US vary between 1.6-2.8 bps with the wings slightly underperforming the belly of the curve. German yields rise 2.7-4.4 bps with the front underperforming. Markets now gradually turn to the national and European inflation figures tomorrow and Friday to support the next move higher in yields. Headline inflation is expected to ease materially on the account of energy prices (from 8.5% to 7.1%). Monthly dynamics are still expected at a very strong 1.1% m/m, suggesting ongoing broad and strong price pressures. In addition, ECB’s Kazimir today said that core inflation is key in taking rate decisions, and that gauge is still seen accelerating to a new record high (5.7%). He sees a real risk banks will curb lending but added that this shouldn’t refrain the central bank from lifting rates further, be it perhaps at a slower pace. Chief economist Lane in a speech later said more hikes are needed under the baseline scenario. An all in all, the orderly yield rise doesn’t hamper stocks today. The Euro Stoxx 50 bounces 1.4% higher, extrapolating upbeat Asian/Chinese (tech) sentiment into Europe. The index is on track for a close beyond the recent highs just north of 4200. US stocks open with gains between 0.7-1.3%. Other risky assets including commodities join the risk on. Brent oil adds >1% to $79.53 – the highest in two weeks.
Japan’s yen is being targeted on the currency markets today. Risk on and rising core bond yields weigh on the yen, lifting USD/JPY from 130.89 to 132.49 currently. EUR/JPY surges almost two big figures from 141.94 to 143.82. The euro forfeited a slight advantage it had over the dollar. EUR/USD is currently changing at a slightly lower rate of 1.084 today. On a trade-weighted basis, the greenback isn’t going anywhere (DXY unchanged at 102.54). Sterling continues its counterintuitive trading pattern. Risk-on and gilt underperformance do not suffice for the pound. EUR/GBP trades back above 0.88. trading in the pair is extremely muted though. The low-to-high over the past 14 days spanned less than 1.5 big figures.
News & Views
The Flemish community raised €1.25bn via a new 10y benchmark (Apr2033). Earlier this year, Flanders started a short term Belgian Commercial Paper programme, issuing a €1.5bn 3-month bill mid-January which we expect to be roll-overed. Today’s bond was priced to yield MS + 41 bps over the Belgian OLO-curve, compared to initial price takings at MS +45 bps area and revised guidance at MS +43 bps. Total books went above €3.5bn. Flanders Department of Finance estimates total new funding needs for 2023 at roughly €6bn. Debt redemptions for 2023 are projected at a mere €0.07bn. The deficit is expected around €2bn this year, before declining to around €1bn in 2024 & 2025. Other (recurring) funding needs come from the Flemish Social Housing Company (VMSW €0.58bn), the Flemish Housing Fund (VWF €1.14bn) and costs related to the Oosterweel link (LANTIS; €0.4bn). The multiyear €4.3bn recovery plan (Flemish Resilience) accounts for €0.77bn in 2023. Total net funding needs are forecasted to decline from €3.86bn in 2024 to €2.3bn.
The Bank of England published the summary and record of its quarterly Financial Policy Committee meeting (March). The FPC closely monitored the problems facing SVB, Credit Suisse and judges that the UK banking system remains resilient (well-capitalized, large liquid asset buffers). Tighter financial conditions continue to weigh on the ability of households, businesses and governments globally to service their debts, with the full impact taking time to feed through for many borrowers. Riskier corporate borrowing in financial markets is likely to be particularly vulnerable to tighter financial conditions. In aggregate, the global high-yield bond, leveraged loan and private credit markets have almost doubled in size over the past decade.
Silver Returns to the December-February Rectangle
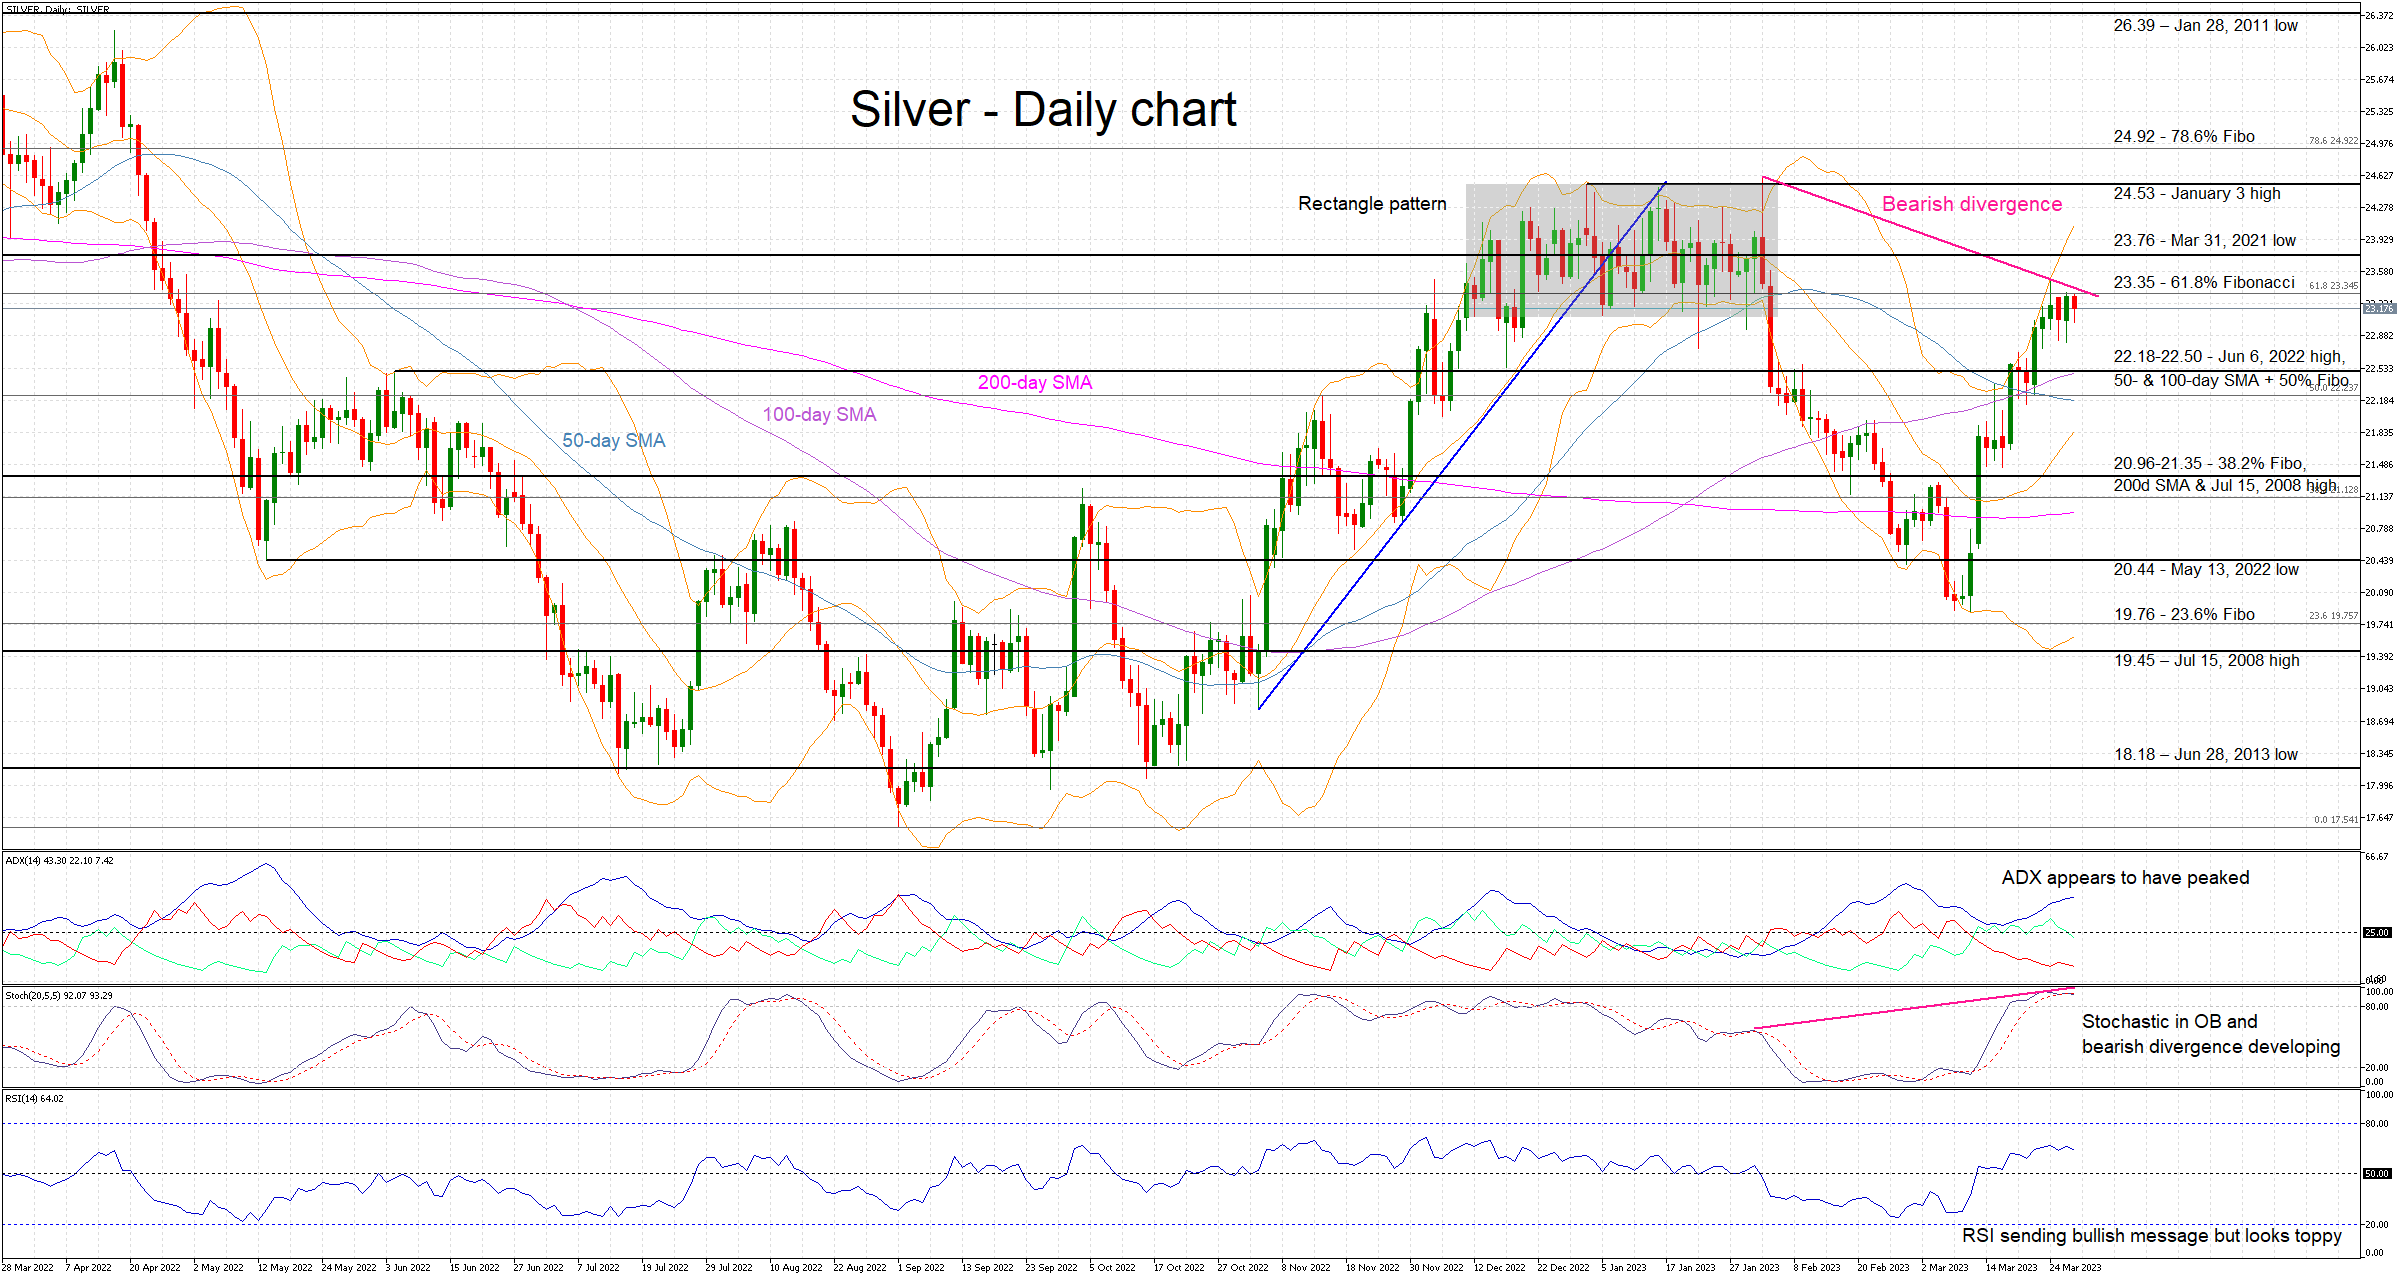
Silver has completed a 2-month round trip. The bears managed to take over the market and push it down to 19.88, only for the bulls to react forcefully during March. And we are back at the lower boundary of the rectangle that defined market action during the December 2022 - February 2023 period. Silver broke with relative ease several resistance points on its way higher, but it is now hovering just below the 23.35 area.
Silver bulls remain hungry, but the technical picture is slightly more complicated at this juncture. The RSI appears to be toppy, and the stochastic oscillator is showing early signs of rally exhaustion. In addition, a bearish divergence has developed as the higher high in the stochastic has been met with a lower high in Silver. If we also add the fact that the Average Directional Movement Index (ADX) appears to be turning lower, then the bears could be prepping to regain control of the market.
Should the bulls remain confident, their initial target could come at the 61.8% Fibonacci retracement of March 8, 2022 – September 1, 2022 downtrend of 23.35, a tad below the March 31, 2021 low of 23.76. Even higher, the January 3 high and upper boundary of the recent rectangle at 24.53 would potentially pose significant resistance.
On the other hand, the bears appear to have a clear path until the 22.18-22.50 range. This area could prove very tricky for the bears as it is defined by the June 6, 2022 high, the 50- and 100-day simple moving averages (SMA) and the 50% Fibonacci retracement respectively. Upon successfully clearing this area, another busy range at 20.96-21.35 is expected to test the bears' appetite.
To conclude, silver bulls have staged an impressive run since mid-March, but there are increasing signs not favouring them at this juncture.
GBPCAD Finds Strong Resistance at 1.6870
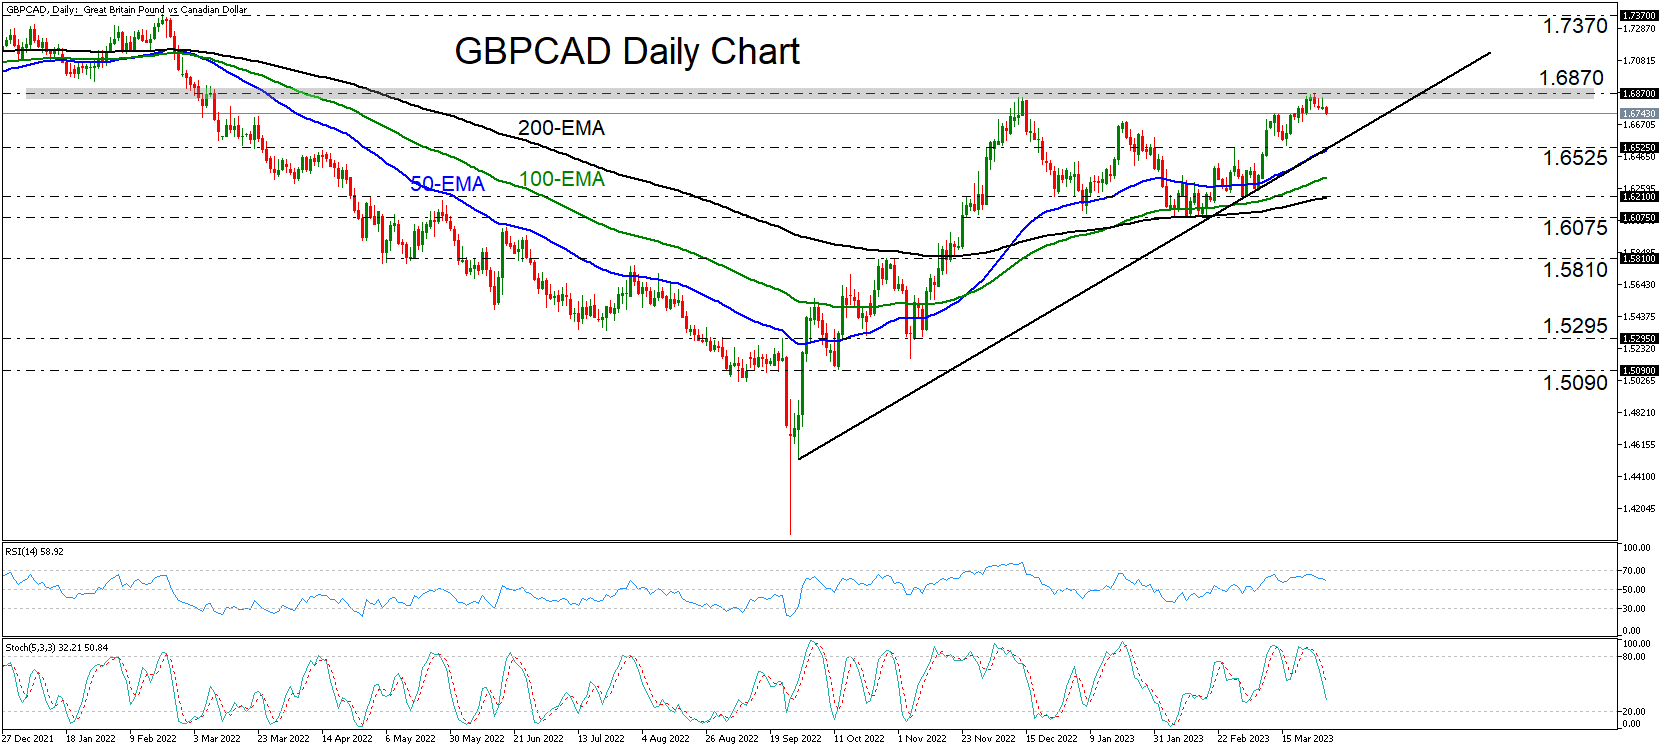
GBPCAD traded slightly lower this week, after hitting resistance at 1.6870 on March 23. Overall, though, the pair is still trading above the uptrend line drawn from the low of September 28, as well as above all the plotted moving averages. Therefore, even if the retreat continues for a while longer, the bulls could still take the reins from near the uptrend line or the low of March 16 at 1.6525.
Both the short-term oscillators suggest that, indeed, the setback could extend a bit more. The RSI topped slightly below its 70 line and is now pointing down, while in the stochastic, the %K line is lying below the %D and is heading towards the 20 level.
If the bulls are willing to take charge from near the 1.6525 area, they may need to push the action above 1.6870 for the prevailing uptrend to resume. Such a rebound would confirm a higher high and may see scope for advances towards the 1.7370 area, marked by the high of February 21. If that zone doesn’t hold either, the next stop may be at 1.7600, which acted as a ceiling between April and September 2021.
The move that might turn the outlook to flat may be a dip below 1.6525, while the bears could claim full control if the pair drops below 1.6075. Should this happen, a lower low will be confirmed and the slide may stretch towards the 1.5810 hurdle, the break of which could carry larger bearish implications, perhaps setting the stage for declines towards the 1.5295 area, marked by the low of November 9.
Summing up, GBPCAD remains above the uptrend line drawn from the low of September 28, but a break above 1.6870 may be needed to signal the resumption of the prevailing uptrend.
EUR/USD Mid-Day Outlook
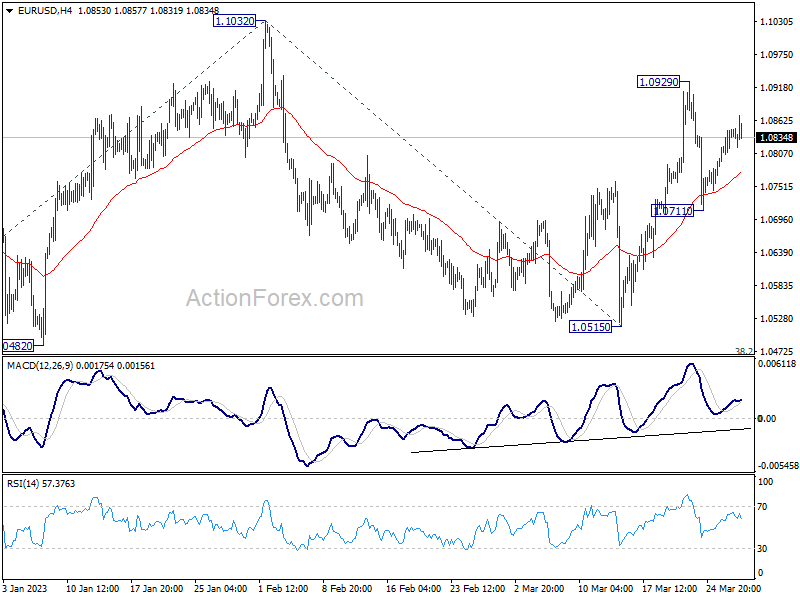
Daily Pivots: (S1) 1.0811; (P) 1.0830; (R1) 1.0865; More...
EUR/USD is still bounded in range below 1.0929 and intraday bias remains neutral. Further rally is in favor after receiving support from 4 hour 55 EMA (now at 1.1774). Break of 1.0929 will extend the rise from 1.0515 to retest 1.1032 high. Firm break there will resume larger up trend from 0.9534 to 1.1273 fibonacci level next. However, break of 1.0711 will turn bias to the downside to extend the corrective pattern from 1.1032 with another decline.
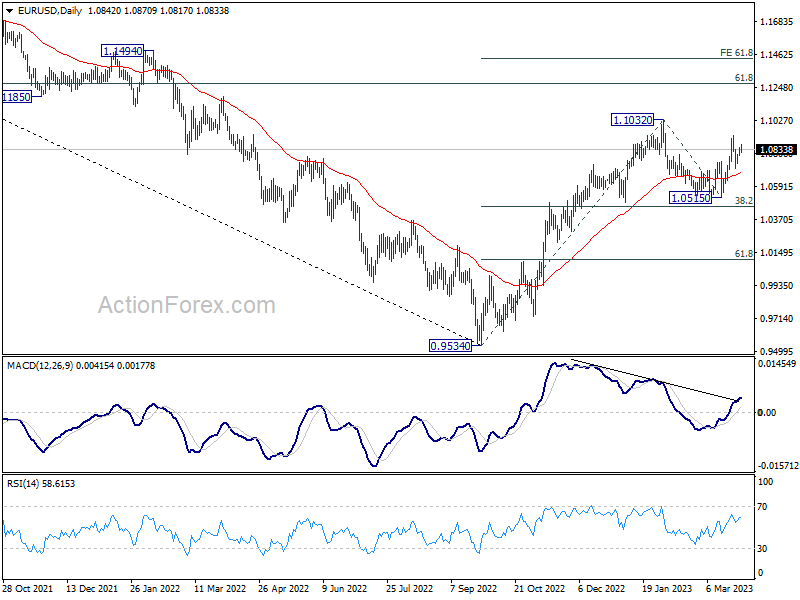
In the bigger picture, rise from 0.9534 (2022 low) is in progress with 38.2% retracement of 0.9534 to 1.1032 at 1.0460 intact. The strong support from 55 week EMA (now at 1.0623) was also a medium term bullish sign. Next target is 61.8% retracement of 1.2348 (2021 high) to 0.9534 at 1.1273. Sustained break there will solidity the case of bullish trend reversal and target 1.2348 resistance next (2021 high).
GBP/USD Mid-Day Outlook
Daily Pivots: (S1) 1.2298; (P) 1.2324; (R1) 1.2366; More...
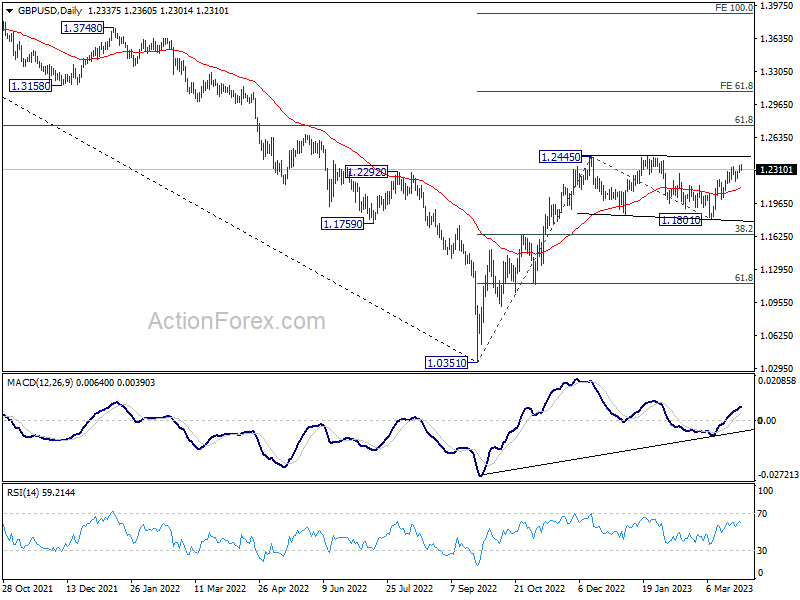
Intraday bias in GBP/USD remains on the upside as rise from 1.1801 is in progress for 1.2445/6 resistance zone. Firm break there will resume larger rally from 1.0351, and target 1.2759 fibonacci level. For now, near term outlook will remain bullish as long as 1.2177 support holds, even in case of another retreat.
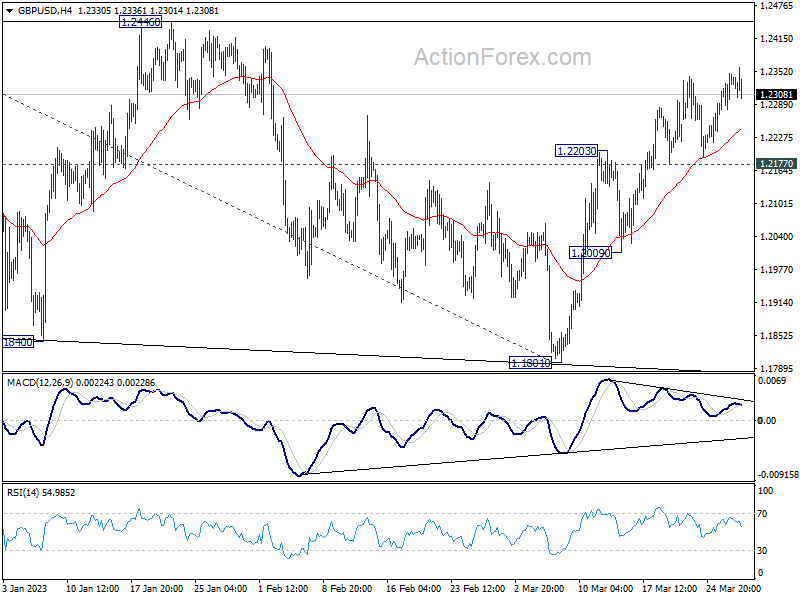
In the bigger picture, price action from 1.2445 are seen as a corrective pattern to rise from 1.0351 medium term bottom (2022 low). Resumption of the rally from 1.0351 is expected and break of 1.2446 will target 61.8% retracement of 1.4248 (2021 high) to 1.0351 at 1.2759. This will remain the favored case as long as 38.2% retracement of 1.0351 to 1.2445 at 1.1645 holds.