Sample Category Title
Dollar Index: Dollar Starts to Gain Traction But Remains Overall Bearish
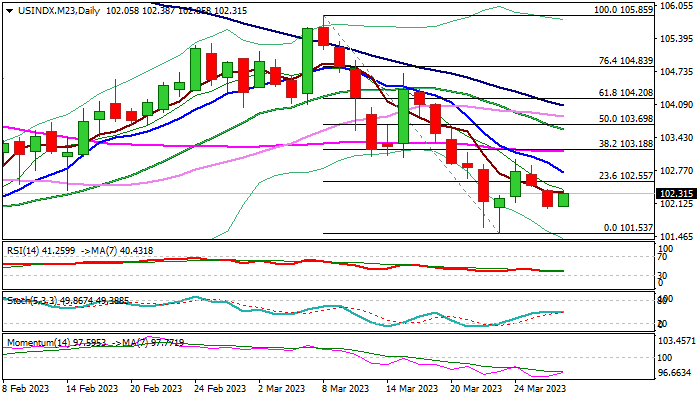
The dollar index regained some ground on Wednesday following strong drop in past two days, on calmer tones over recent turbulence in banking sector and growing hopes that deeper crisis can be averted.
However, investors remain cautious, as recent issues in US banks are expected to continue to strongly influence the dollar, with any signals of further calming of the situation or new cracks in the banking system, to spark stronger movements of the US currency.
Technical picture on daily chart is still bearish, suggesting that limited recovery is likely to precede fresh push lower.
Initial resistance lays at 102.73 (falling 10DMA) guarding upper pivots at 103.15/18 (55DMA/Fibo 38.2% of 105.85/101.53), which should cap upticks to keep bears in play.
Res: 102.55; 102.73; 103.18; 103.70.
Sup: 102.02; 101.88; 101.53; 101.00.
USD/CHF – Swiss Franc Steady after Economic Expectations Slide
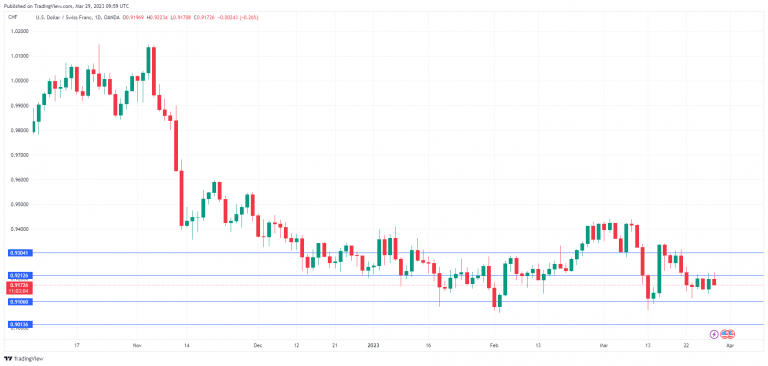
The Swiss franc has edged higher on Wednesday. USD/CHF is trading at 0.9176 in the European session, down 0.23%. The ZEW Economic Expectations index fell sharply to -43.3 points. In the US, CB Consumer Confidence improved to 1o4.2 points.
Banking crisis sends Swiss economic expectations crashing lower
The banking crisis has eased after causing market turmoil across the globe. Switzerland’s banking sector has taken a hit, as Credit Suisse, the country’s second-largest bank, collapsed and had to be rescued by rival UBS, with the Swiss government injecting some $108 billion to ensure that the takeover is completed. The reputation of the Swiss banking system has been badly tarnished and the fallout will likely have a negative impact on the Swiss economy.
Even before the banking crisis, the Swiss economy was sputtering. GDP was flat in Q4 of 2022, as a weak global economy meant less demand for Swiss exports. The economy was expected to grow by 1.1% in 2023, lower than average growth, and that figure could well be revised lower due to the banking crisis. Inflation hit 3.5% in 2022, much lower than in other major economies but high for Switzerland. The Swiss National Bank has tried to curb inflation with higher interest rates and delivered a 50-basis point hike earlier this month.
ZEW Economic Expectations has been mired deep in negative territory for over a year, but showed a significant improvement in January, rising from -40.0 to -12.3 points. The February reading, released today, came in at -41.3, as the January improvement was short-lived. We’ll get another snapshot of the strength of the Swiss economy on Friday, with the release of retail sales and the KOF Economic Barometer.
In the US, consumers have been concerned about their bank deposits and the stability of the banking system. Despite these worries, the Conference Board Consumer Confidence index improved to 104.2 in March, up from an upwardly revised 103.4 prior. Consumer expectations also rose, from 73.0 to 74.0 points. If the banking crisis does not worsen, the strong consumer expectation numbers should translate into increased consumer spending.
USD/CHF Technical
- USD/CHF tested resistance at 0.9212 earlier in the day. The next resistance line is 0.9304
- 0.9106 and 0.9014 are providing support
ECB Lane indicates more hikes needed to tame inflation
ECB Chief Economist Philip Lane, in an interview with German newspaper Die Zeit, emphasized the necessity for further interest rate hikes to ensure that inflation returns to the 2% target. Lane stated, "Under our baseline scenario, in order to make sure inflation comes down to 2%, more hikes will be needed."
He also suggested that even in cases of limited financial stress, interest rates would still need to rise. "If the financial stress we see is non-zero, but turns out to be still fairly limited, interest rates will still need to go up," he said.
Meanwhjile, Lane expressed optimism about moderating price pressures at earlier stages of production, which are expected to eventually impact consumer prices. "If you look at the earlier stages of production, at the farm gate prices, at the prices of the food ingredients, you will recognize: all of these have turned around," he said.
The chief economist also dismissed the notion that a recession is required to bring inflation down, asserting that a soft landing for the economy is possible. Lane believes that the pandemic recovery can continue alongside decreasing inflation, as he noted, "We've lost so much growth momentum in the pandemic that it's possible for the pandemic recovery to continue and for inflation to come down simultaneously."
AUD/USD – Aussie Falls as Inflation Dips
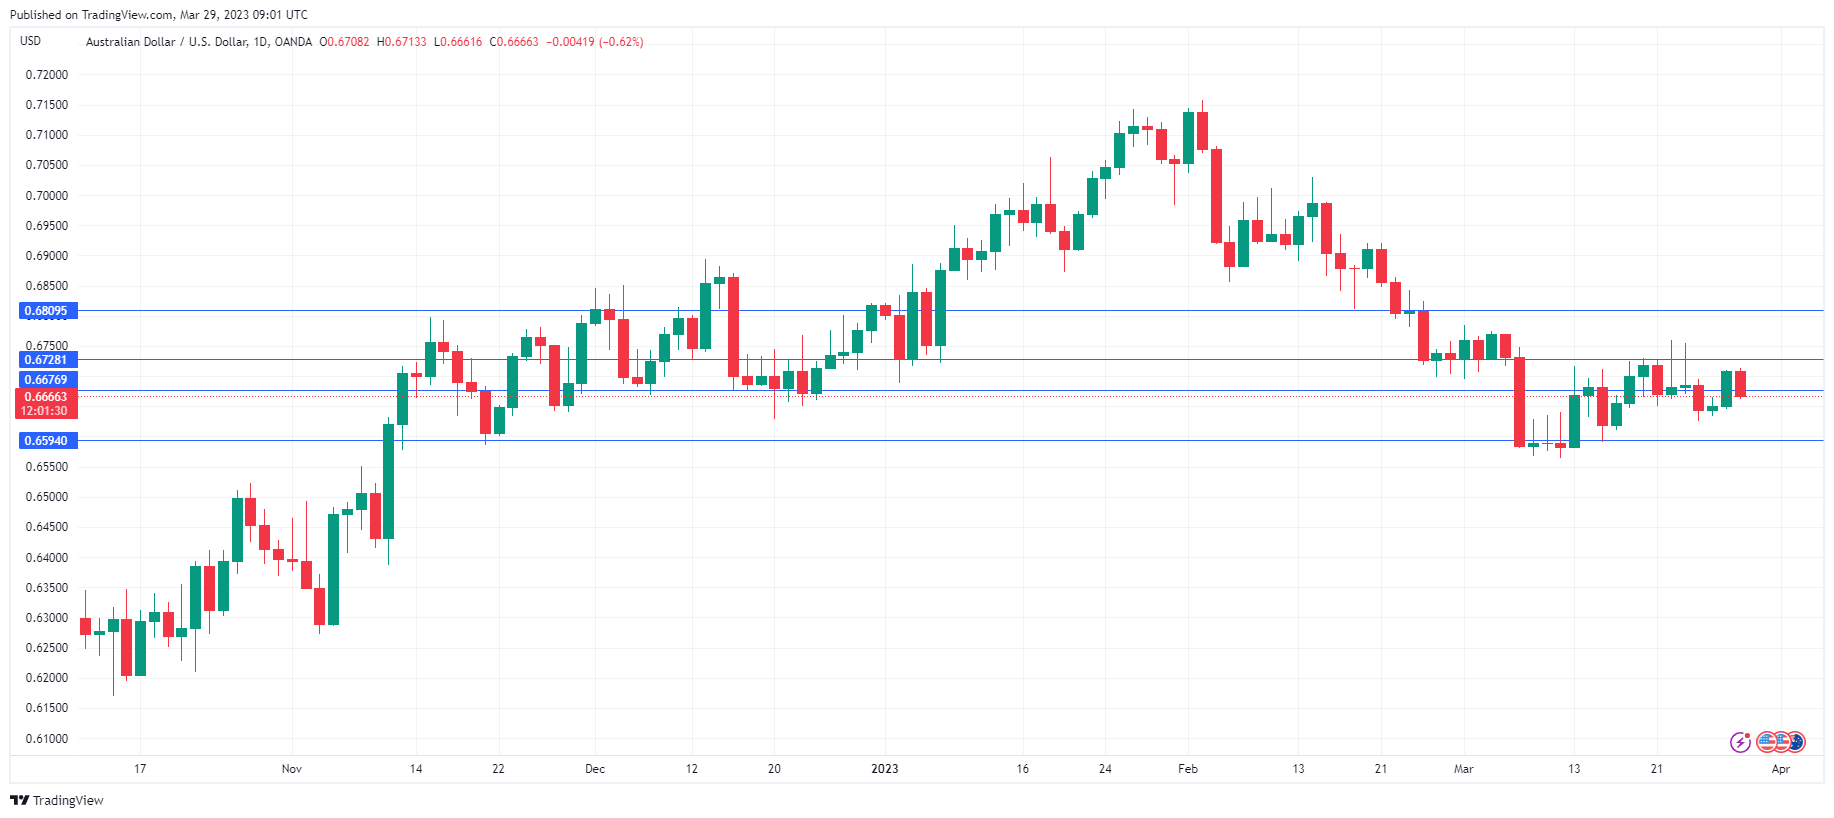
The Australian dollar is trading at 0.6670 in Europe, down 0.57%. Australian inflation was lower than expected, raising speculation that the Reserve Bank of Australia might pause at its April meeting.
RBA keeping eye on retail sales and inflation ahead of rate meeting
Australia’s inflation rate for February eased to 6.7% y/y, down from 7.4% prior and the 7.2% estimate. It may be too early to declare that inflation has peaked, but there’s no question that inflation is heading in the right direction. That is good news for businesses and households, which have been hurt by the double-punch of high inflation and rising interest rates.
The unexpected sharp drop in inflation likely has cemented the RBA pausing at the April 4th meeting, and that is weighing on the Australian dollar today. RBA Governor Lowe had said that this week’s retail sales and inflation releases would be key factors in the rate decision. Retail sales slowed to just 0.2% m/m in February, down from 1.2% prior and shy of the estimate of 0.4%. Weak consumer spending and falling inflation point to the economy slowing, and the RBA will likely respond with a pause, which would be the first since the rate-tightening cycle began in May 2022. The markets have fully priced in a pause at next week’s meeting, with a likelihood of around 90%.
In the US, higher rates have taken a toll on the housing sector. Pending Home Sales has recorded mostly declines over the past year, as potential home buyers are finding it more difficult to afford a new home. The indicator is expected to come in at -2.9% in February, after an unexpected jump of 8.1% in January.
AUD/USD Technical
- AUD/USD is testing resistance at 0.6676. Above, there is resistance at 0.6728.
- There is support at 0.6565 and 0.6402
Gold Battles With 50-SMA as Latest Rebound Falters
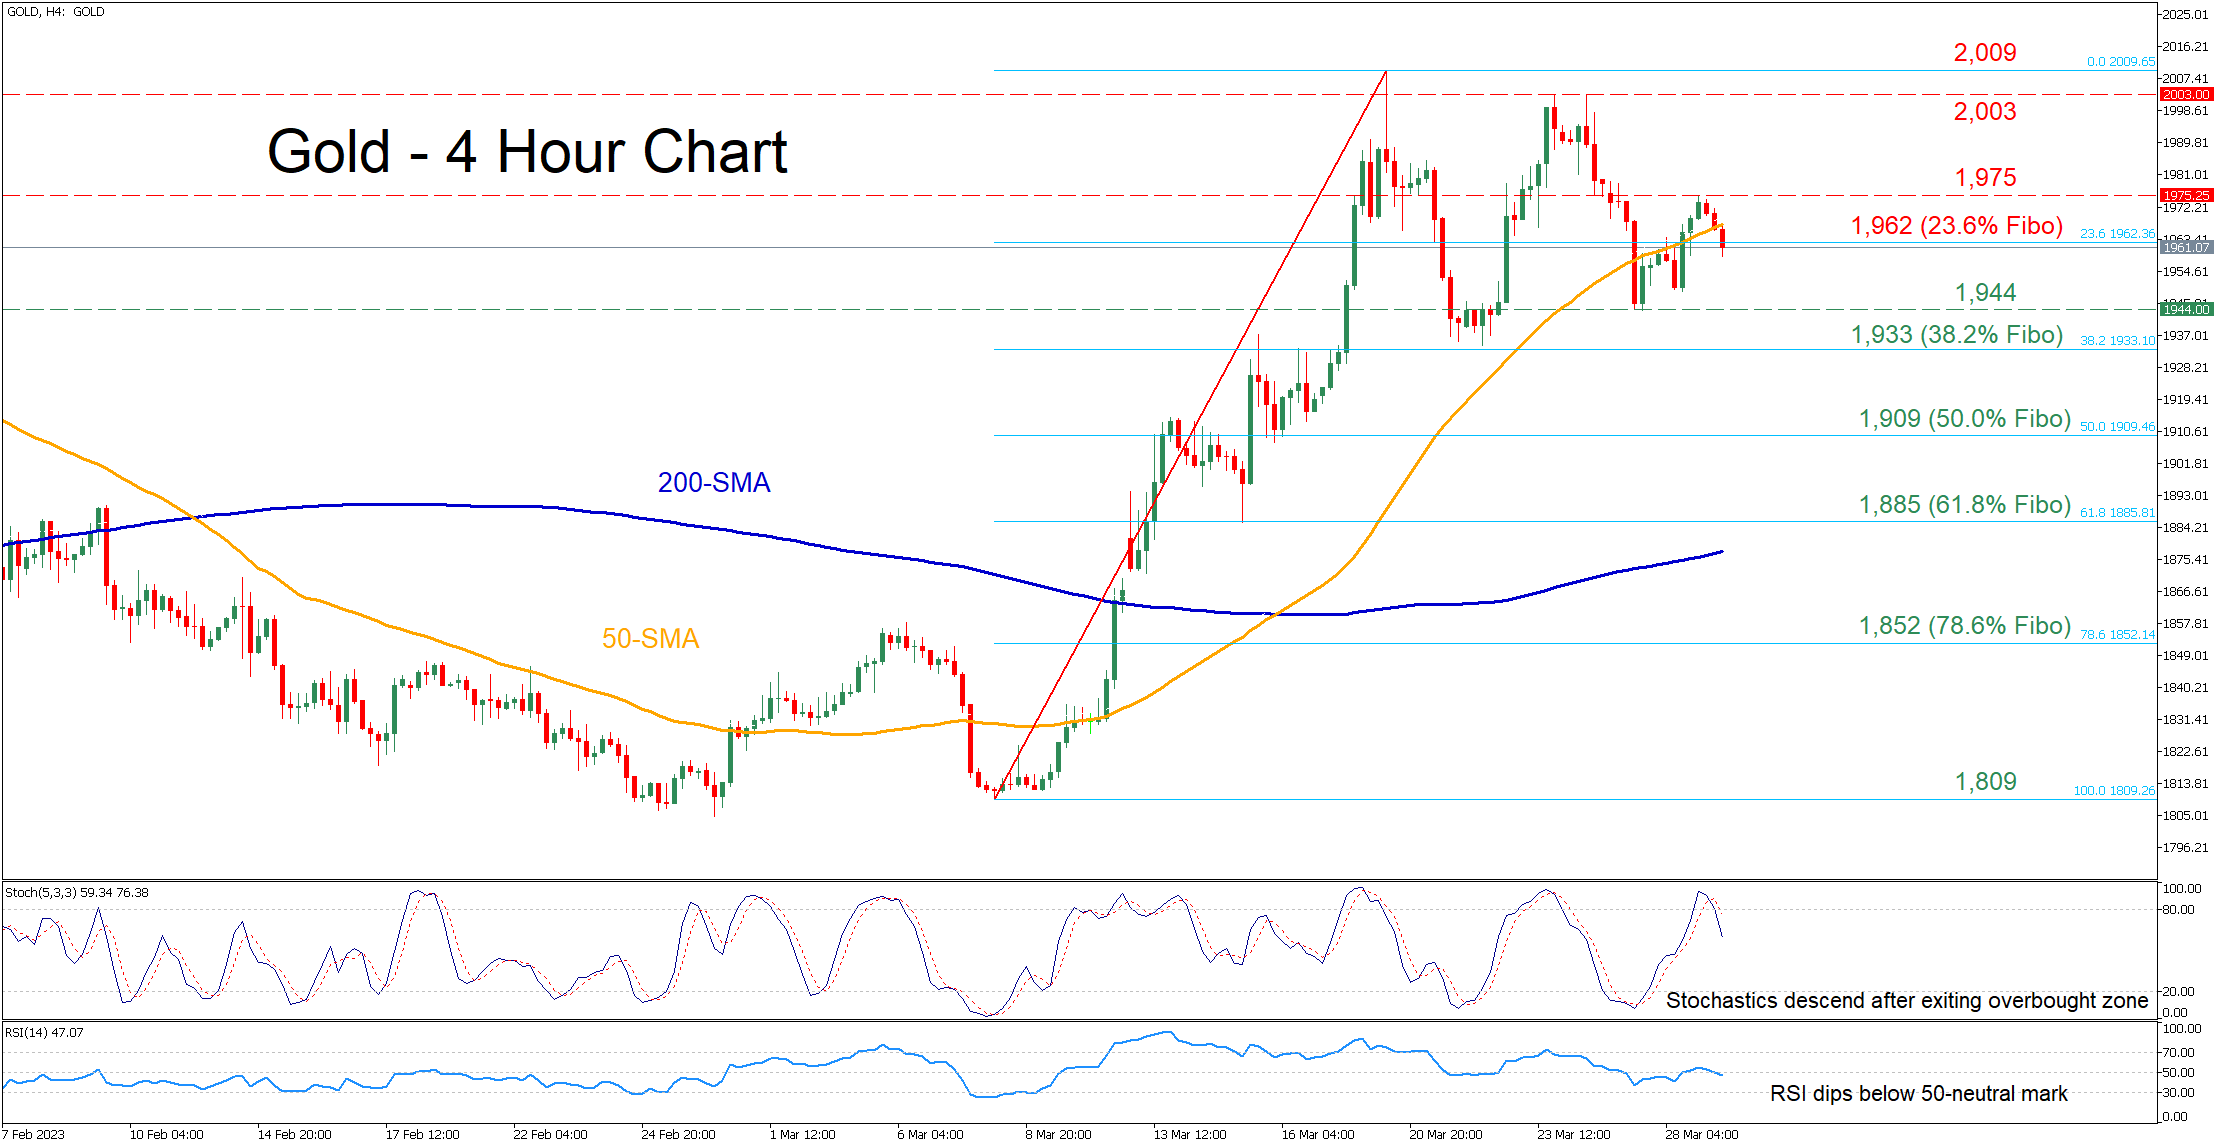
Gold had been edging higher in the four-hour chart, peaking at a fresh one-year high of 2,009 on March 20 before entering a sideways move. In the near term, bullion dropped below its 50-period simple moving average (SMA) after its latest rebound got rejected.
The momentum indicators currently suggest that bearish forces are in control. Specifically, the stochastic oscillator is descending after posting a bearish cross in the overbought zone, while the RSI has crossed below its 50-neutral mark.
Gold has been fluctuating above and below the 1,962 mark in today’s session, which is the 23.6% Fibonacci retracement of the 1,809-2,009 upleg. If the price clearly slides beneath that zone, the recent support of 1,944 could act as the first line of defense. Should that floor collapse, the commodity could then test the 38.2% Fibo of 1,933. Further declines could cease at the 50.0% Fibo of 1,909.
Alternatively, should buyers regain the upper hand, the price might encounter resistance at the recent rejection region of 1,975. Conquering this barricade, the bulls may aim for the 2,003 hurdle, which held strong twice in March. A break above that zone could pave the way for the one-year high of 2,009.
Overall, gold seems to be entering another round of weakness after its latest rebound came to a halt. Therefore, a fresh lower low is needed to signal the extension of the price’s recent downside correction.
GBP/USD Pair is Now Consolidating Gains from 1.2349
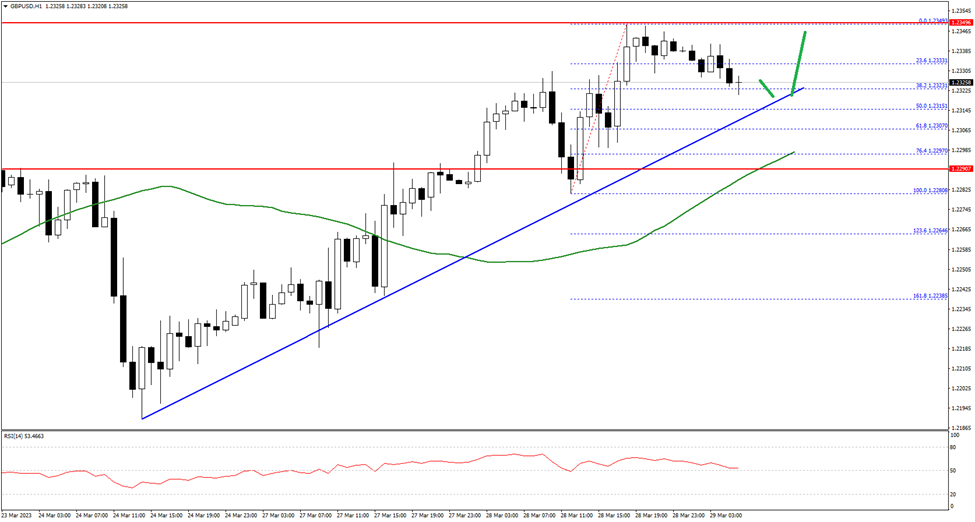
The British Pound started a fresh increase from the 1.2200 zone against the US Dollar. The GBP/USD pair gained pace for a move above the 1.2250 level.
The pair even 1.2300 resistance zone and settled above the 50 hourly simple moving average. A high is formed near 1.2349 and the pair is now consolidating gains. An immediate resistance is near the 1.2340 level.
The first major resistance is near the 1.2350 level. If there is a clear upside break above the 1.2350 resistance, the pair could rise steadily towards the 1.2400 level in the near term. The next major resistance sits near the 1.2450 level.
On the downside, the first major support is near the 1.2320 level. The main support is forming near 1.2295 on FXOpen. A break below the 1.2295 support could push the pair towards the 1.2250 support.
USDJPY Stays Above 130.00; Outlook Still Grim
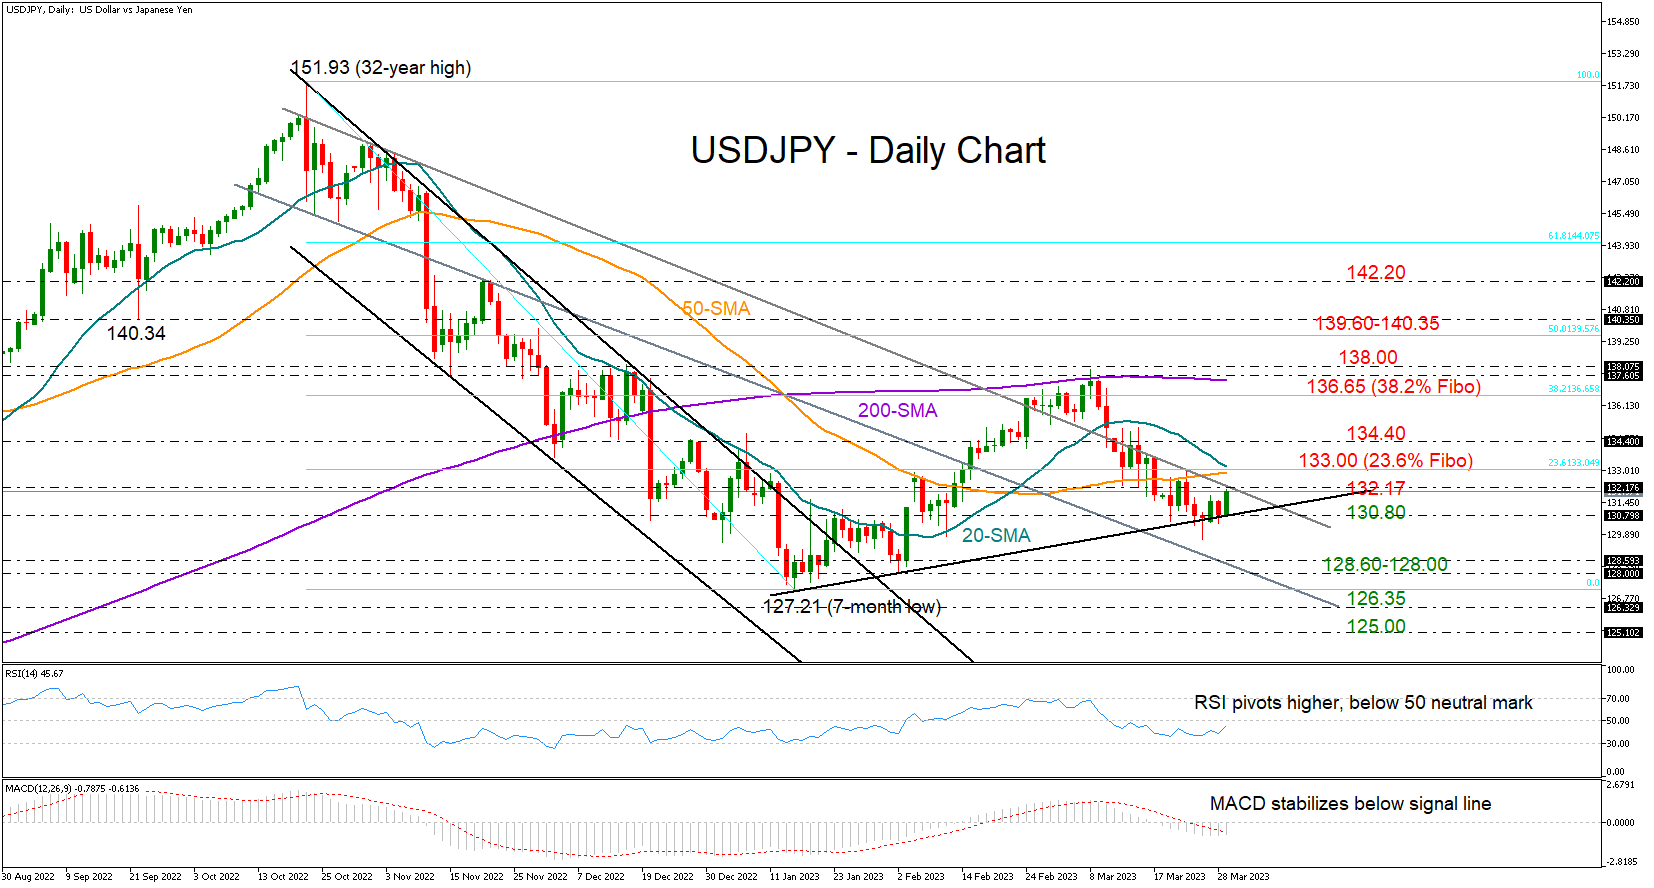
USDJPY resumed its bullish momentum early on Thursday, sustaining a strong foothold within the 130.00 area and around the short-term ascending trendline that has been navigating the market since the start of the year.
The RSI is following the price higher at the moment, though it has not exited the bearish territory yet. Likewise, the MACD has not crawled above its red signal line, both suggesting that the latest rebound is unconvincing.
For the recovery to continue, buyers would need to pierce through the wall of 132.35-133.00. The 20- and 50-day simple moving averages, the 23.6% Fibonacci retracement of the 151.93-127.21 downtrend, and the extension of October’s resistance line are all placed here. Therefore, a clear close higher is required to ease negative risks and lift the price up to 134.40. Should the bulls breach the latter, the price could advance up to the 38.2% Fibonacci level of 136.65 and the flattening 200-day SMA at 137.60. Then, an extension above 138.00 could clear the way towards the 50% Fibonacci mark of 139.60.
In the event the floor around 130.80 collapses, the pair may dive to meet the lower support line within the 128.60-128.00 area. If the October-January downtrend comes back into play below 127.20, the 126.35 region could immediately pause additional declines to 125.00.
Summing up, USDJPY is not out of the woods yet, despite stabilizing its bearish wave around a key support area. A close above 134.40 could boost buying interest, though only a bounce above the 200-day SMA would strengthen the 2023 upleg.
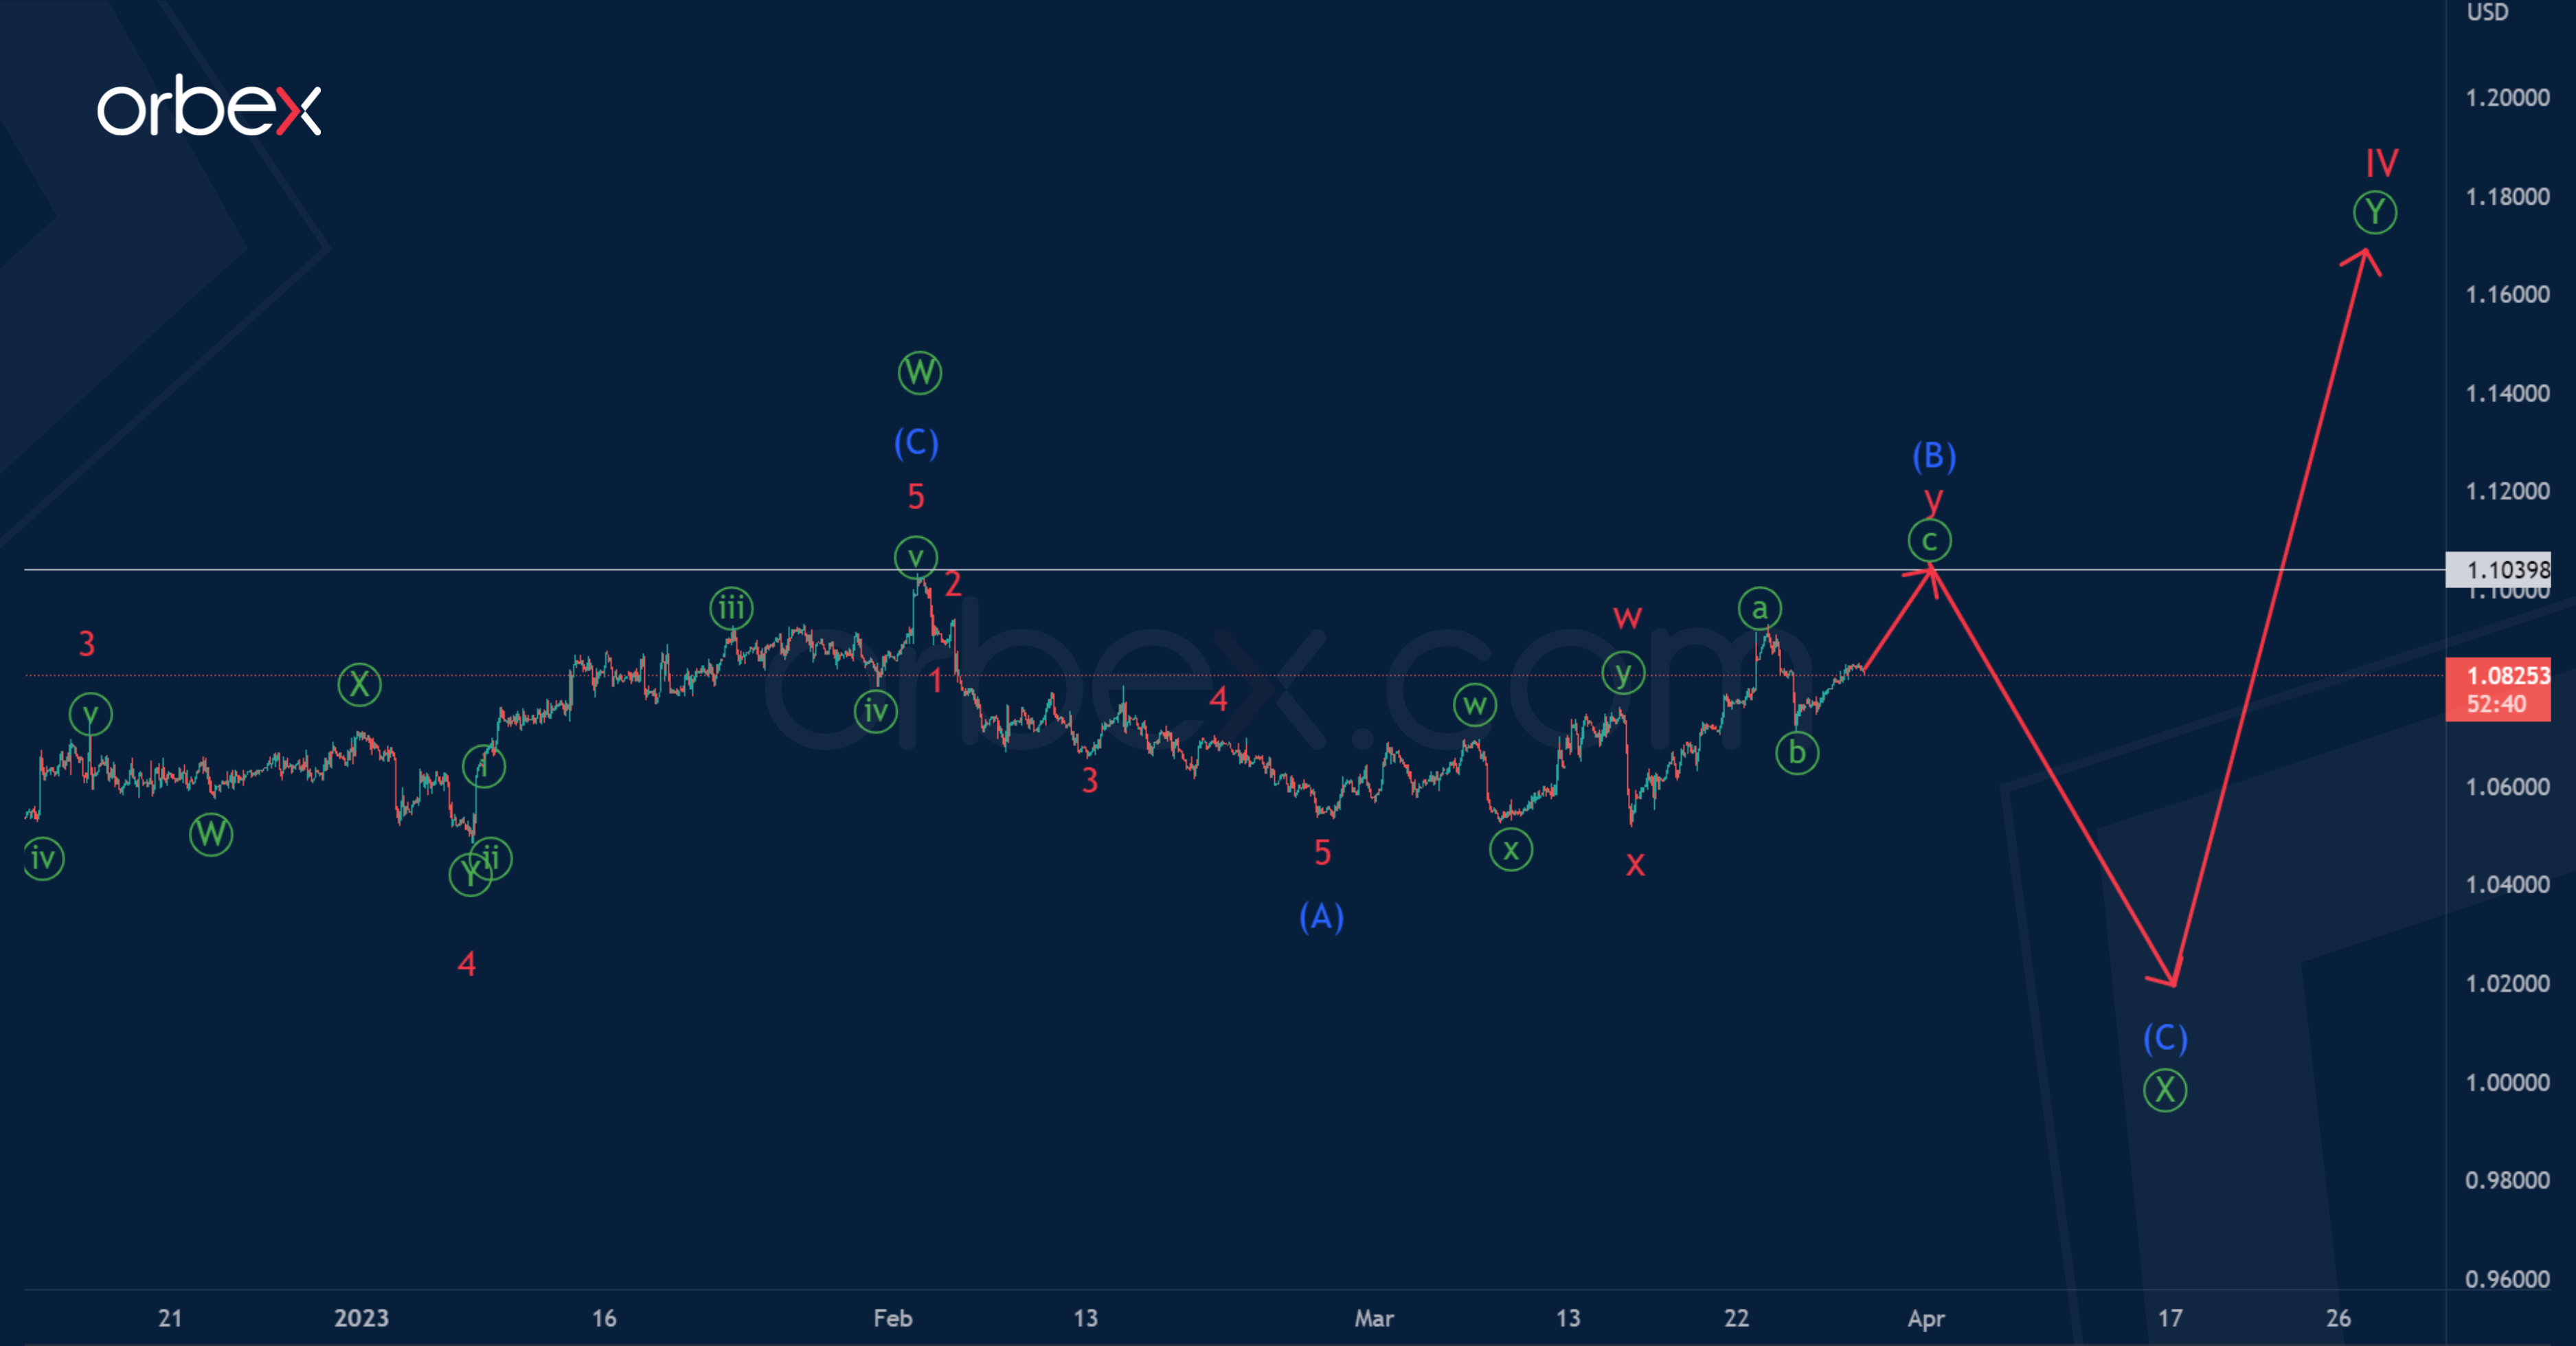
EUR/USD: Triangle is Completed, We are Waiting for a Drop in Impulse
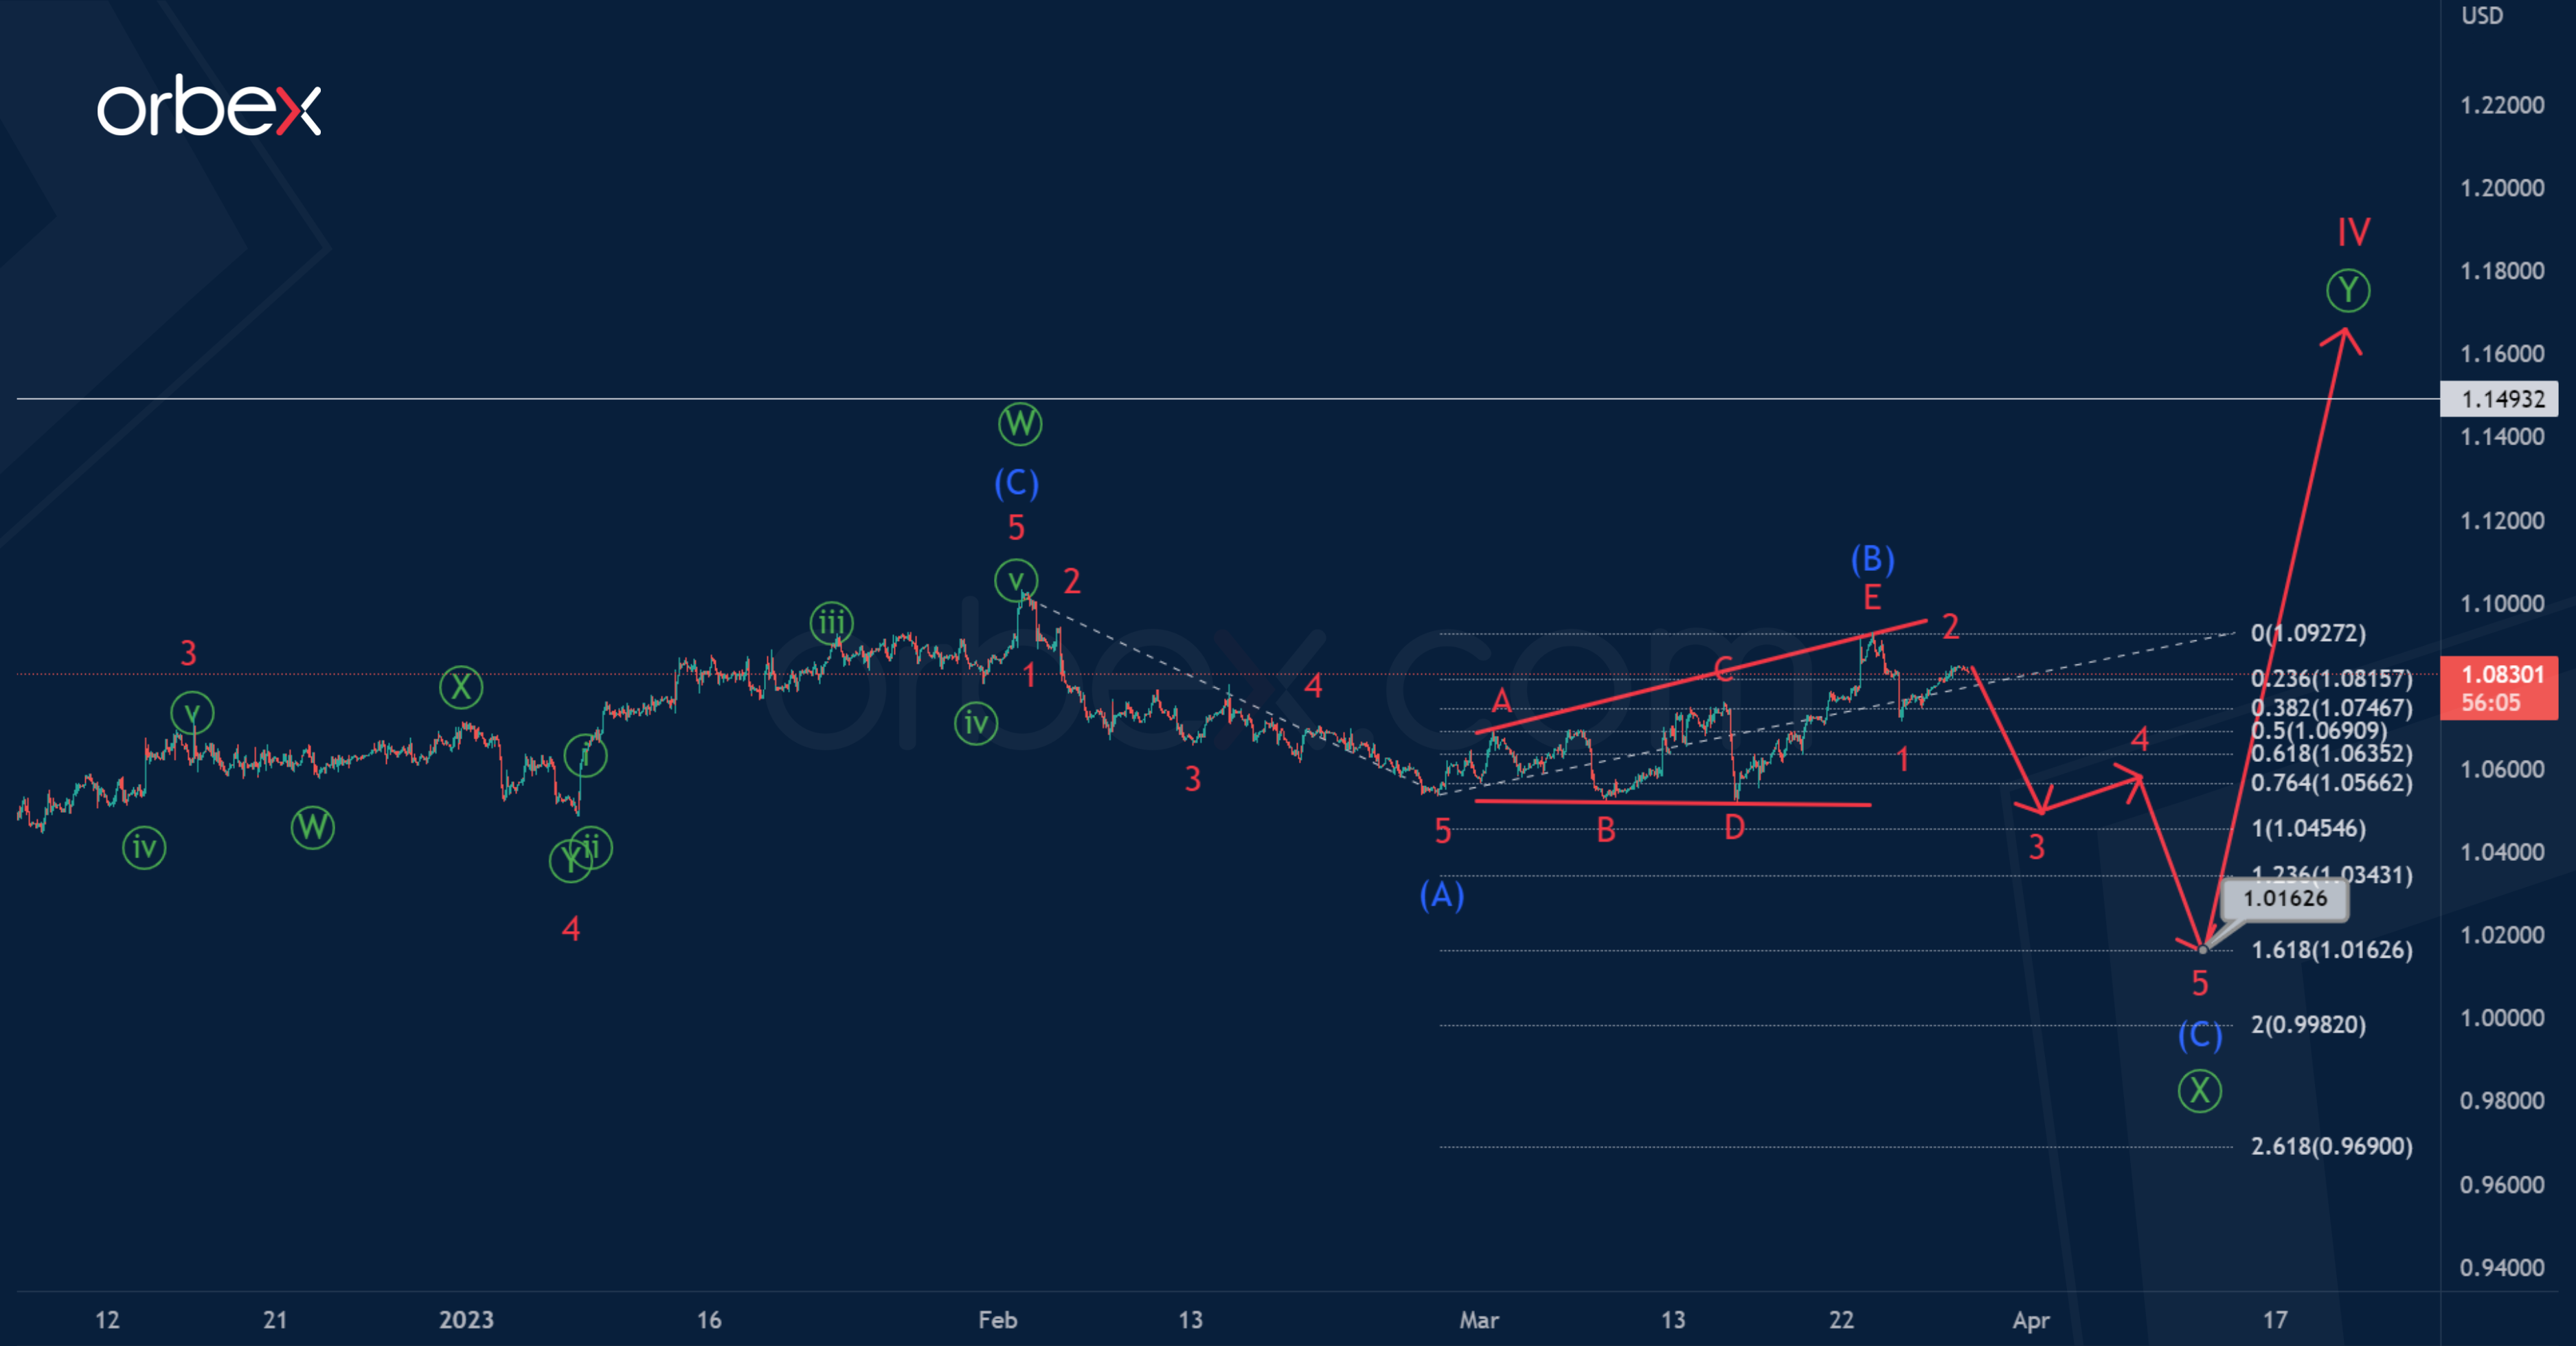
EURUSD continues to form the correction wave IV inside the large-scale impulse. Cycle correction IV, most likely, takes the form of a primary double zigzag.
The actionary leg is completed. A bearish corrective intervening wave, may be in the development stage now. It is also similar to the standard zigzag (A)-(B)-(C). The triangular intermediate correction (B) has recently come to an end, and now the price may be in the last impulse wave (C).
It is assumed that the price may fall to 1.016. At that level, impulse (C) will be at 161.8% of first impulse (A).
An alternative scenario suggests that the intermediate correction (B) not a triangle, but a double zigzag. Its end is possible at the previous maximum of 1.103, at which we saw the end of the first actionary wave.
Only after reaching the maximum, the market will turn and decline. Alternatively, it is also assumed that the primary intervening wave can take a horizontal structure, and then it will not be a zigzag, but, let's say, a double three.
While we are watching which of the scenarios the currency will move.
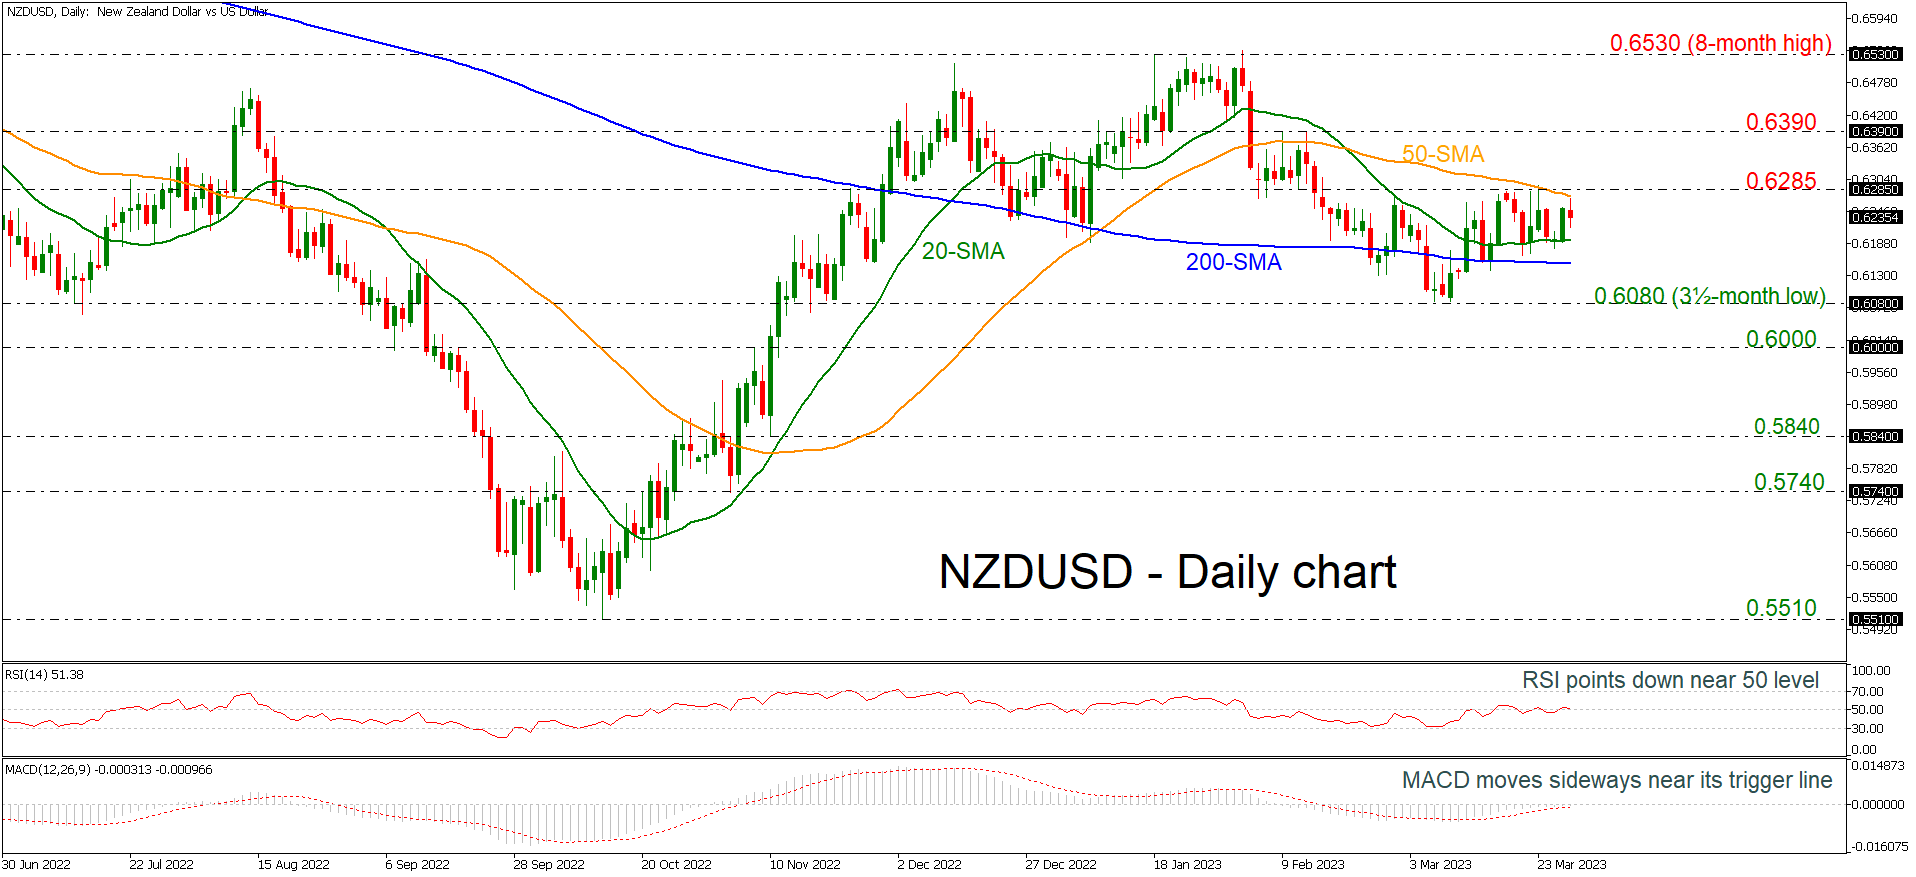
NZDUSD Hovers Within a Tight Range of SMAs
NZDUSD is hovering within a tight range with boundaries of the 20- and the 50-day simple moving averages (SMAs) at 0.6190 and 0.6280 respectively.
From the technical perspective, the RSI is standing near the neutral threshold of 50 and is pointing south, while the MACD is moving sideways below the zero level and near its trigger line.
In the event of an upside reversal, the immediate 0.6285 resistance could act as a significant barrier before being able to re-challenge the 0.6390 obstacle. A break above this level and the eight-month peak of 0.6530 would shift the medium-term outlook to a more positive one.
Further losses should see the 20-day SMA at 0.6190 ahead of the flat 200-day SMA at 0.6150 acting as a major support. A drop lower would meet the three-and-a-half-month low of 0.6080 and the 0.6000 psychological mark, endorsing the short-term bearish structure.
Summarizing, NZDUSD fails to have a clear picture in the very short-term and only a move above or below the SMAs may clear the current view.
Gold keeps high ground
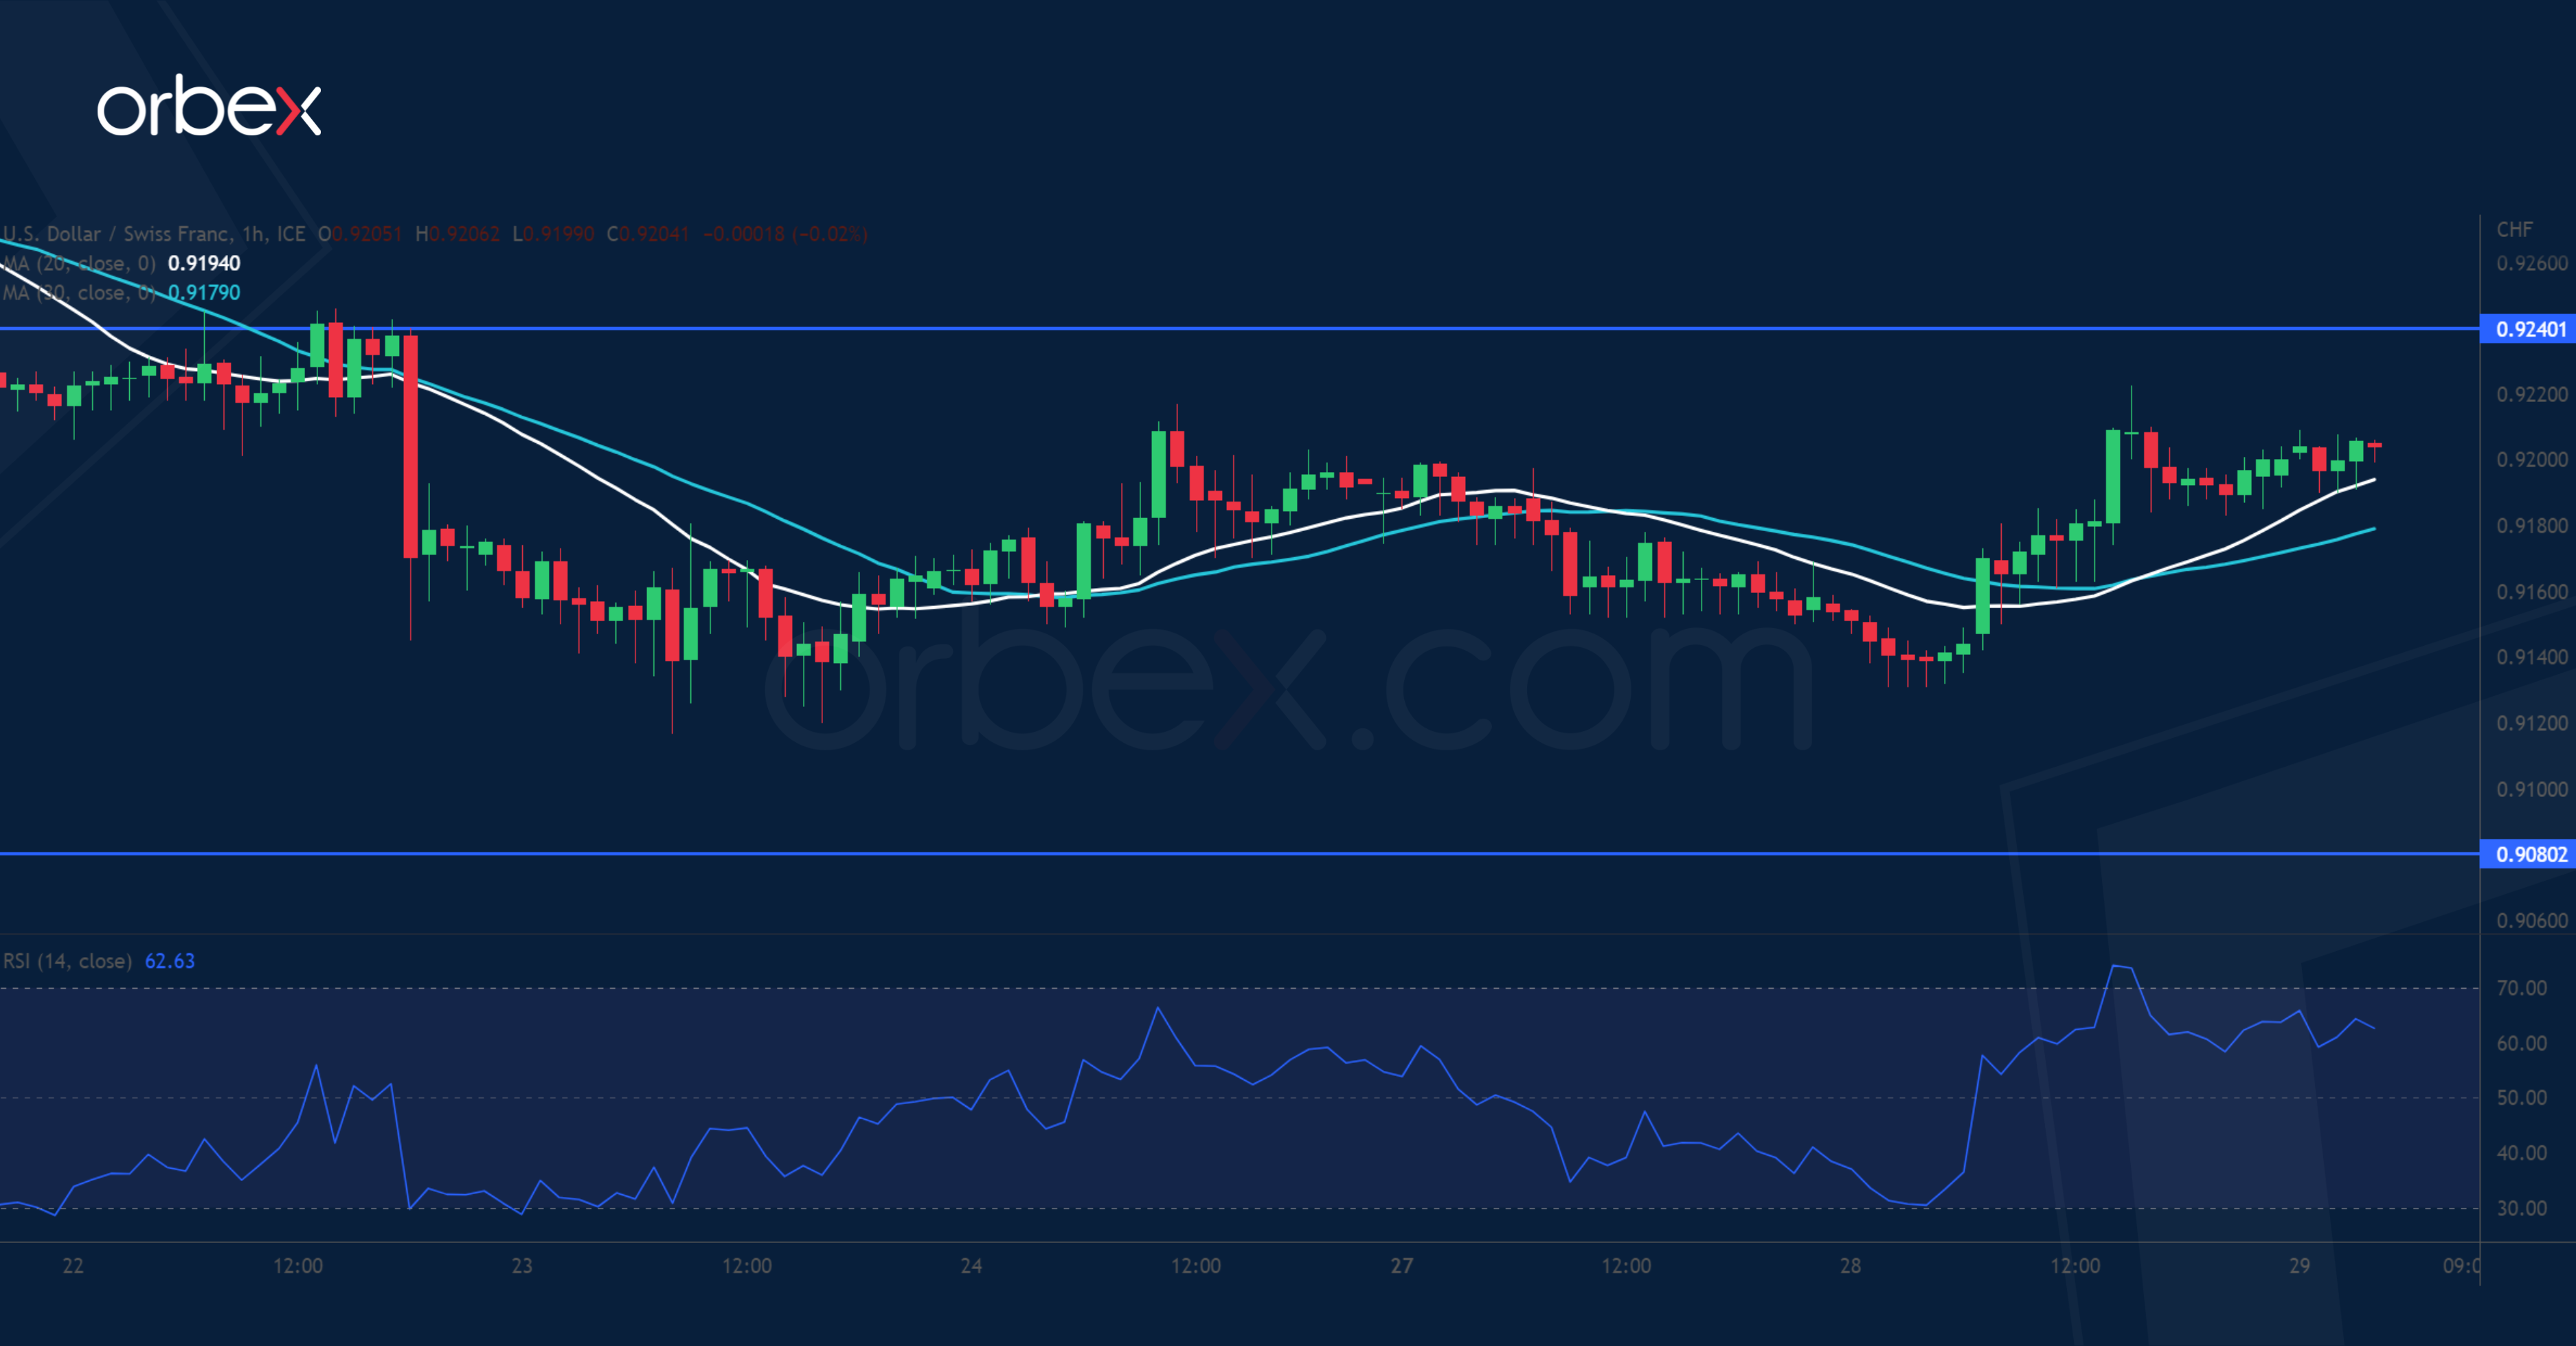
USD/CHF sees little bounce
The US dollar struggles as risk appetite returns amid banking optimism. On the daily chart, a drop below 0.9170 and a bearish MA cross suggest that the bias is still downbeat after a four-month long sell-off. The pair has remained under pressure in the short-term after the previous rebound came to a halt around 0.9340. February’s low of 0.9080 is buyers’ last stronghold and its breach would extend losses towards 0.89s. On the upside, 0.9240 is the first hurdle and only a break above 0.9340 would turn things around.
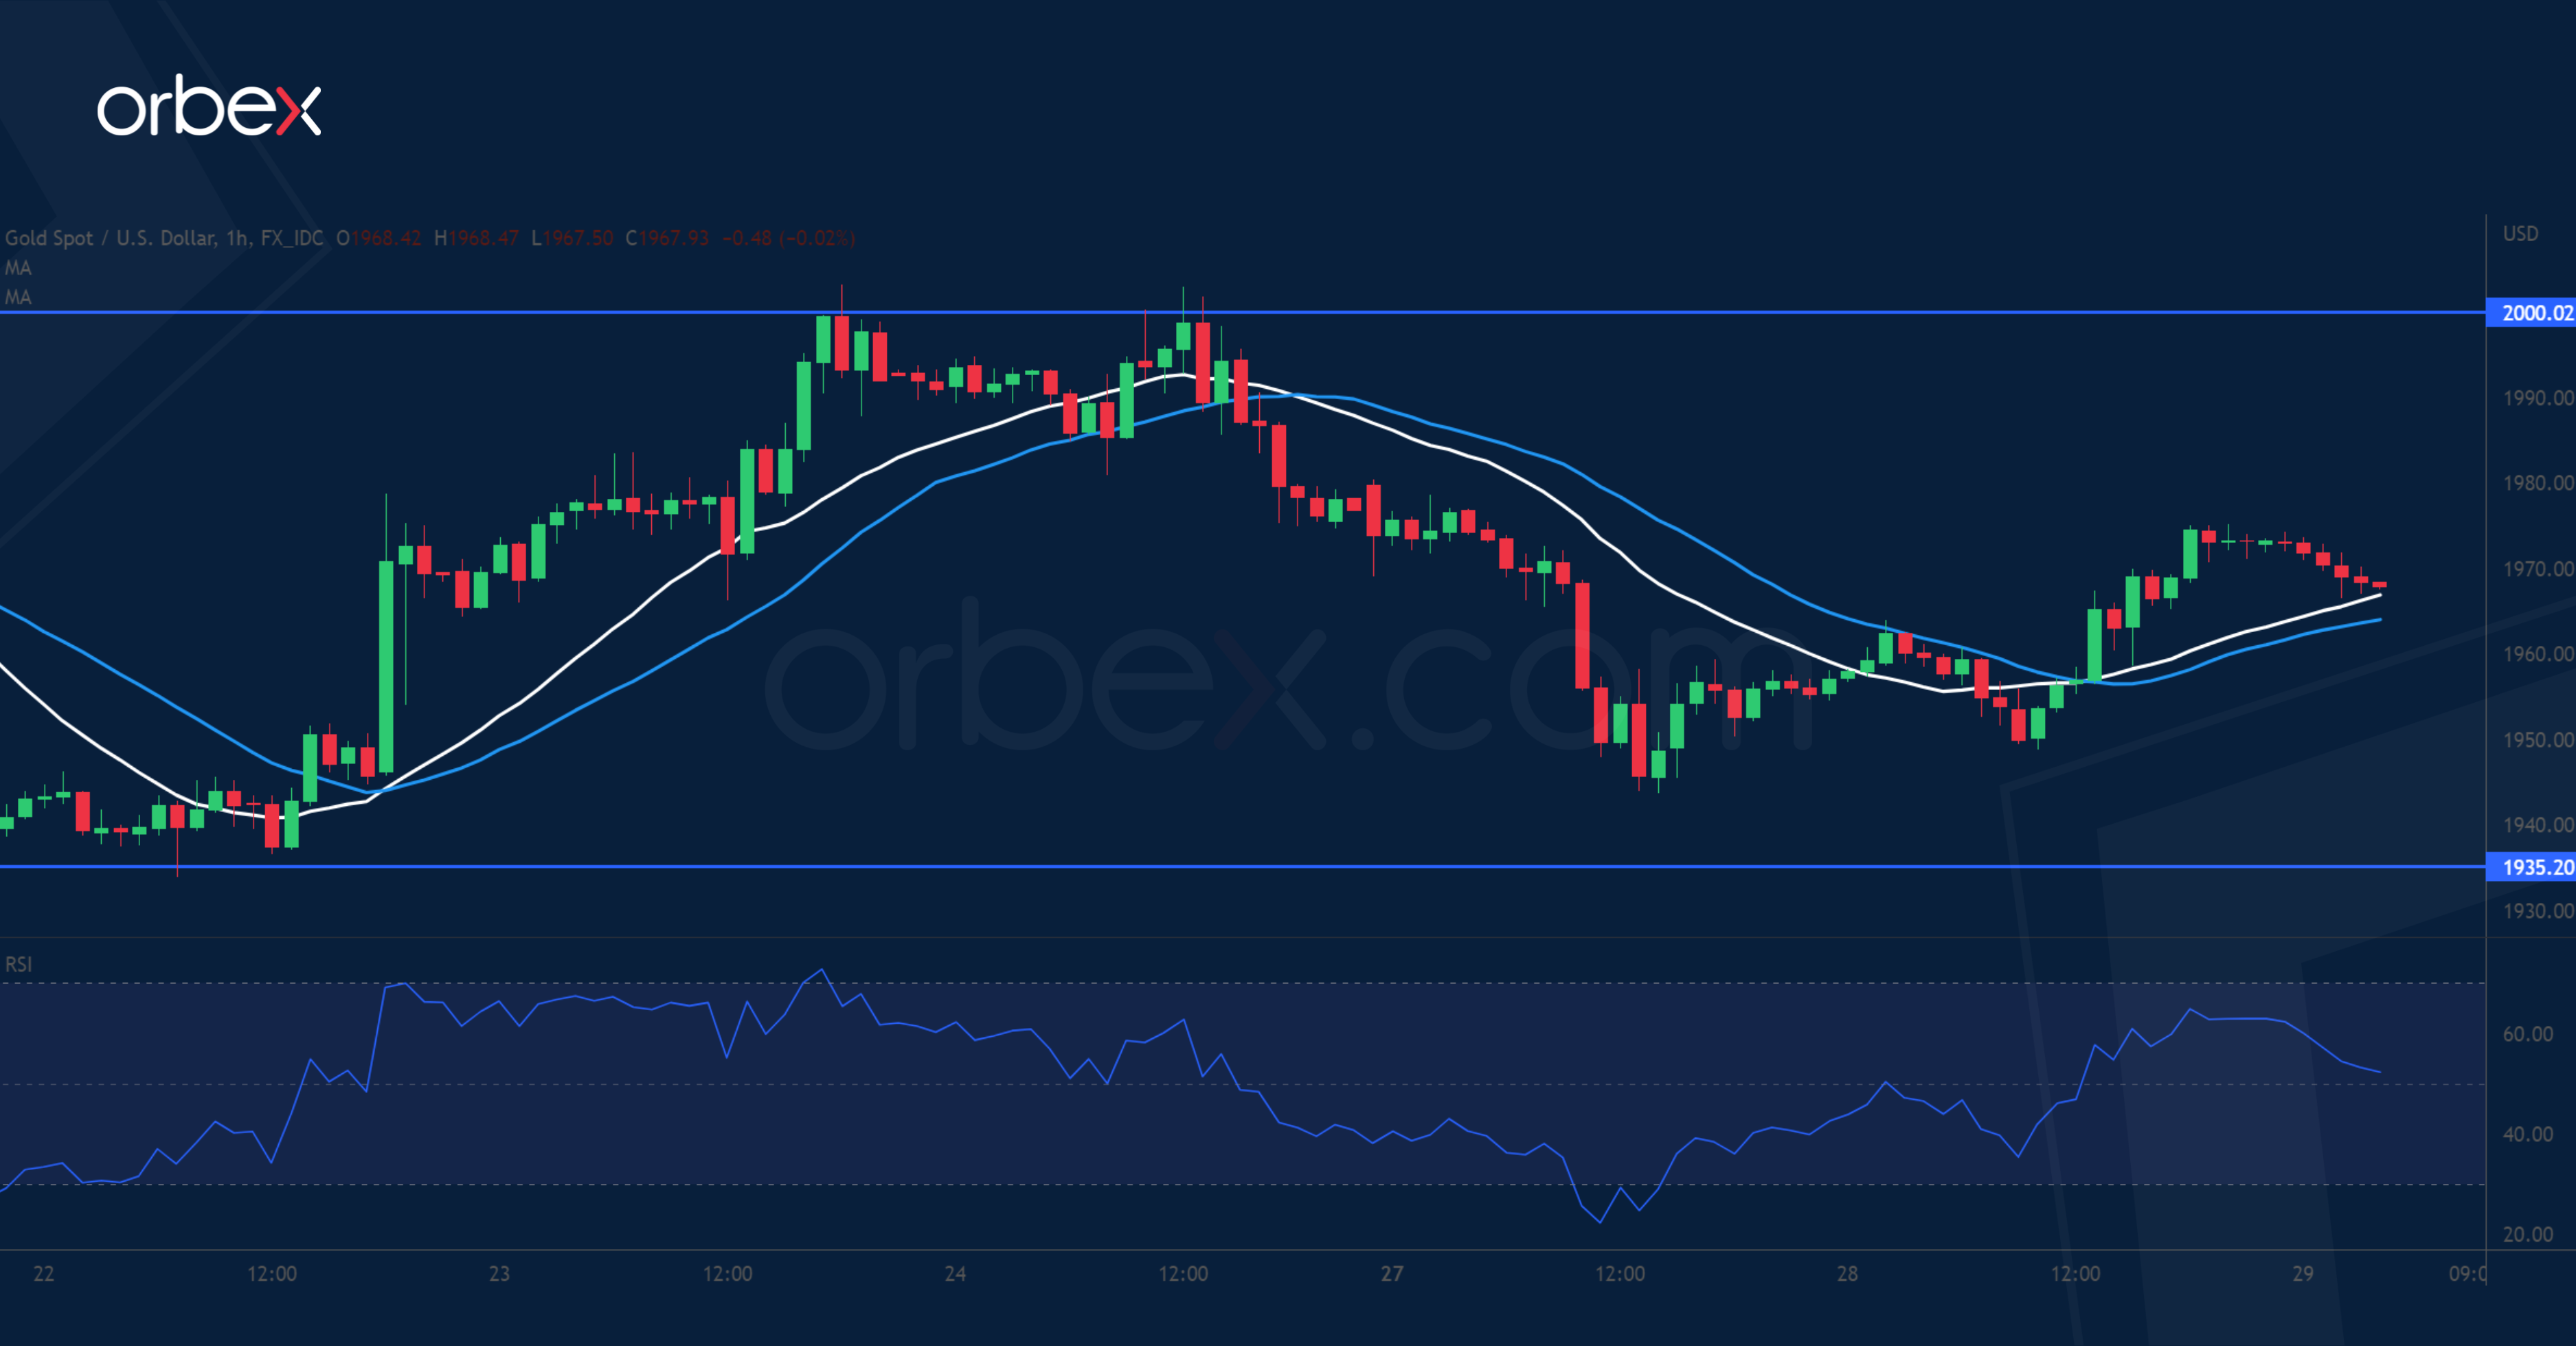
XAU/USD holds on to gains
Gold inched higher supported by a retreat of the US dollar index. The price is striving to hold onto its 11- month high at 2000 with the daily RSI showing an overbought situation. The double top at this major psychological level is another sigh of exhaustion after a parabolic rise. The bullish mood is still intact though a pullback might be due to let the bulls catch their breath. The previous swing low at 1935 is the first level to see if bids would re-emerge. Otherwise, 1886 over the 20-day SMA would be a second support.
UK 100 awaits breakout
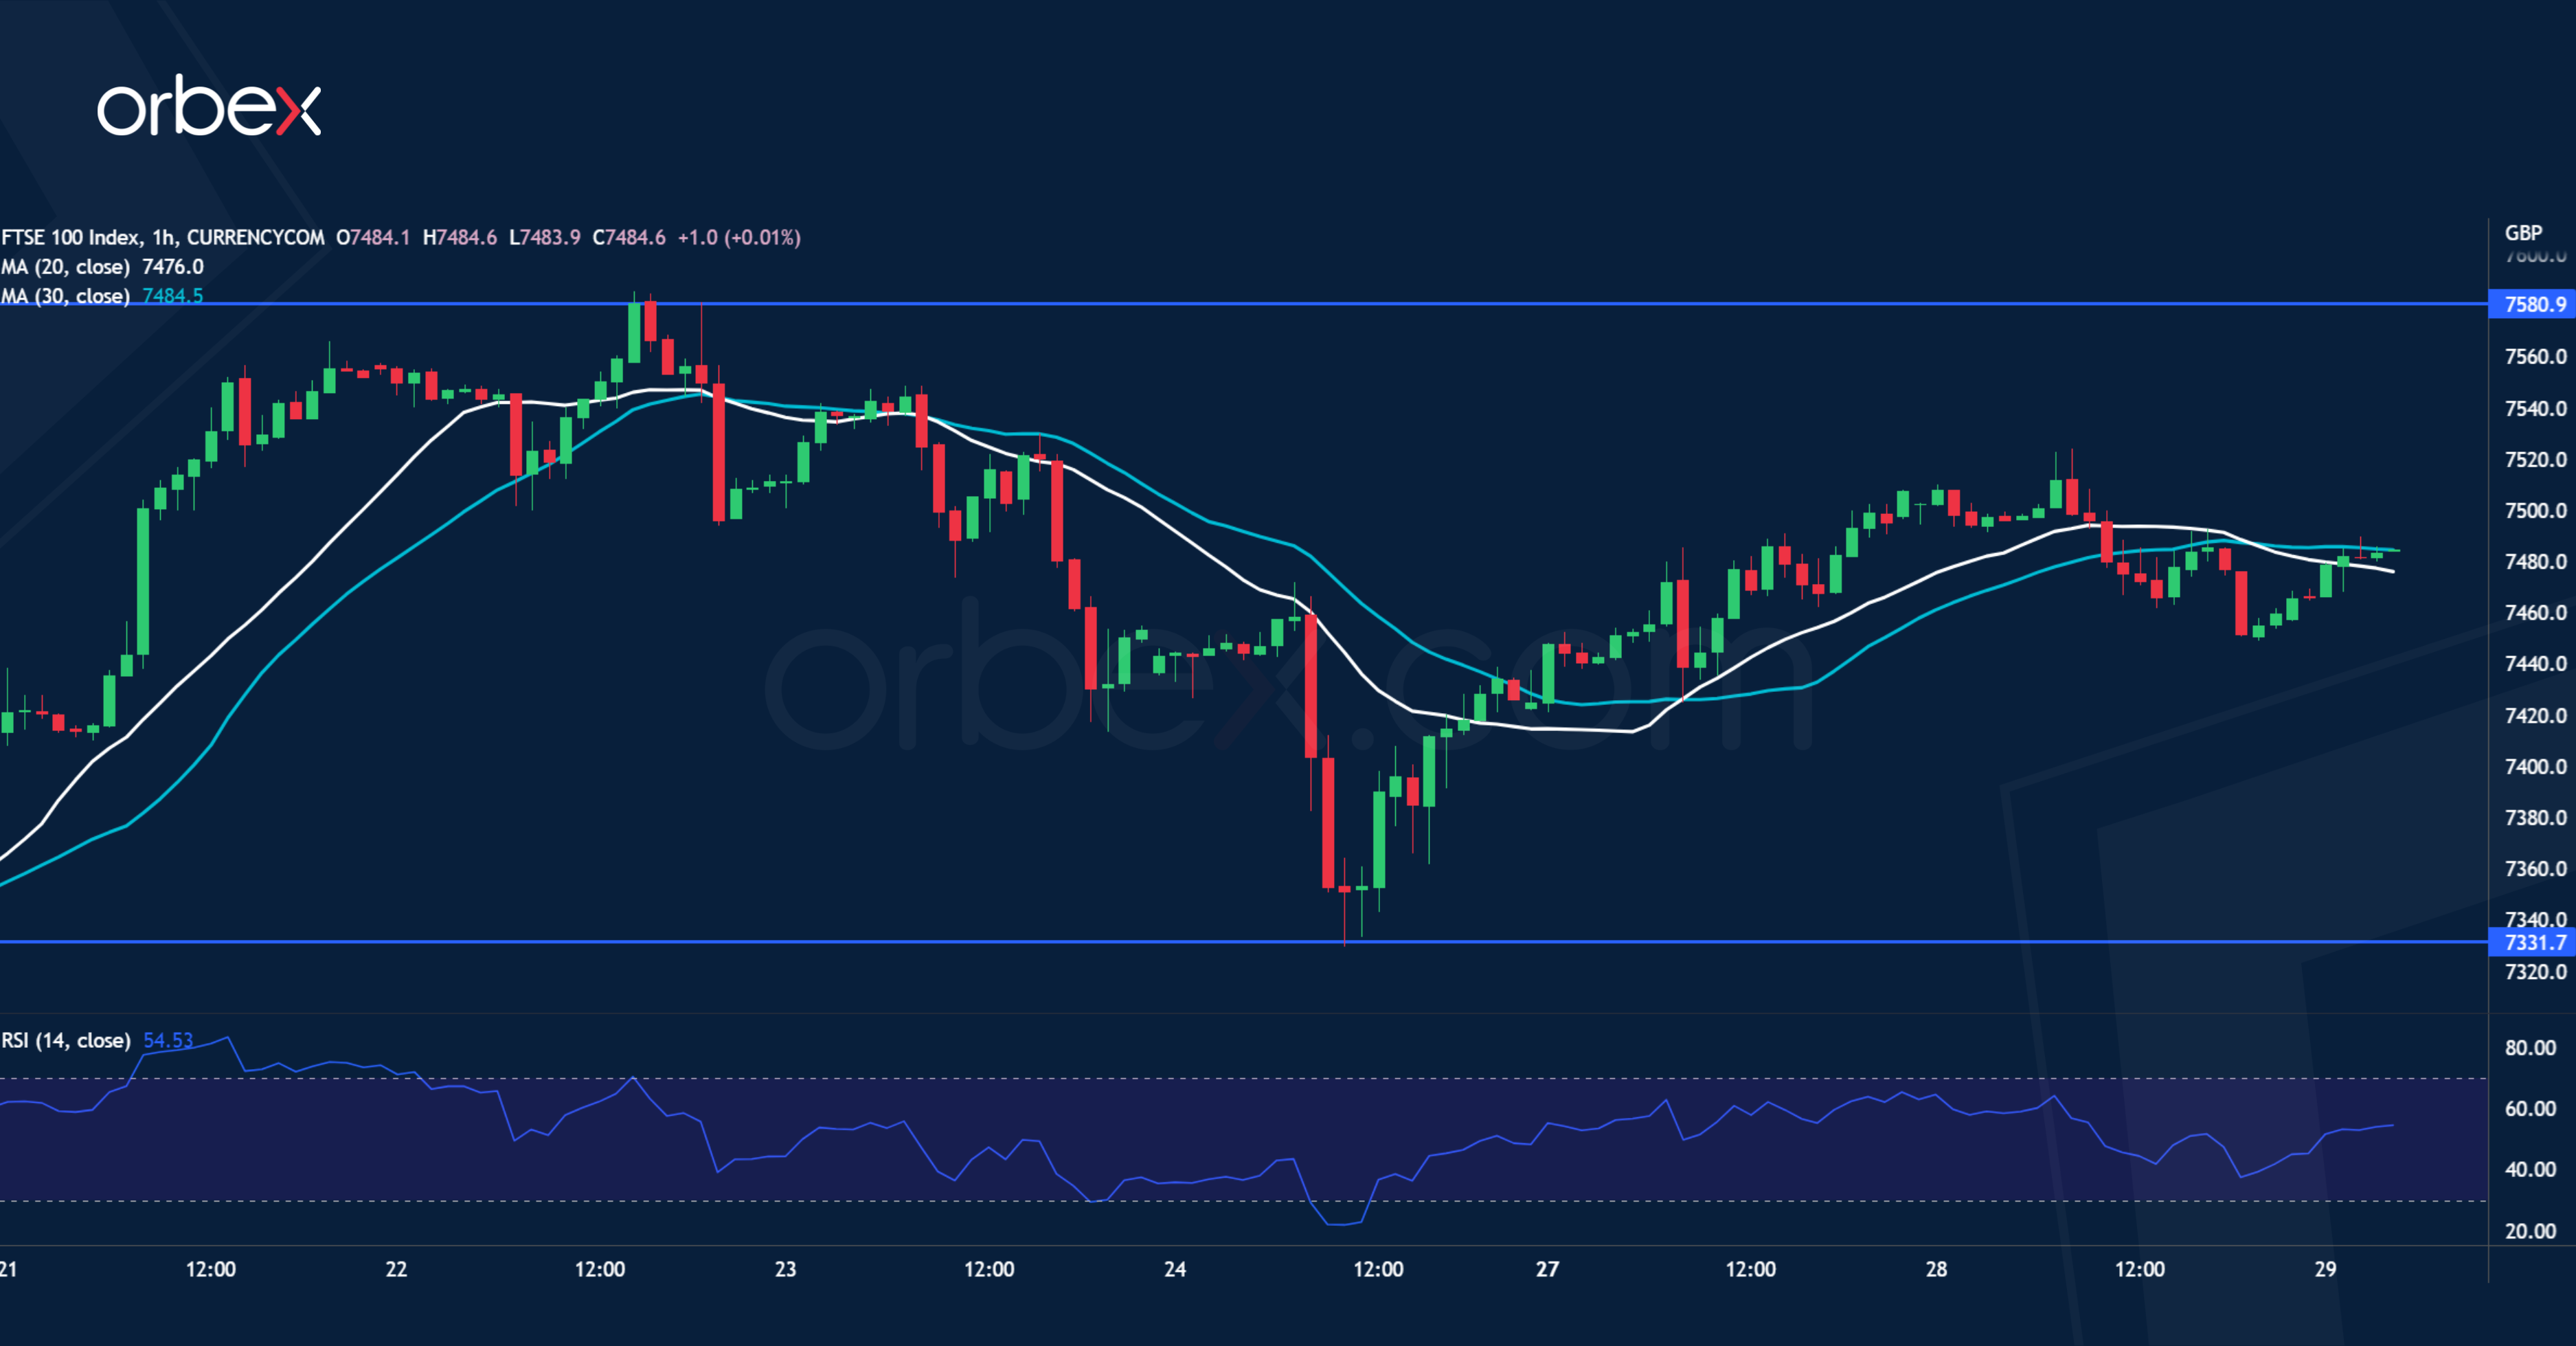
The FTSE 100 grinds higher thanks to gains in the energy sector. The index is still trying to secure a foothold after the sharp liquidation earlier this month. A bounce above the first resistance at 7500 has prompted sellers to trim their positions, easing the downward pressure. The bulls need to consolidate their gains above the demand zone 7200-7330 then lift the recent high of 7580 to trigger a broader recovery. Failing that, this would turn out to be a dead cat bounce and the index might head below 7100.