Sample Category Title
USD/CHF Daily Outlook
Daily Pivots: (S1) 0.9148; (P) 0.9185; (R1) 0.9234; More...
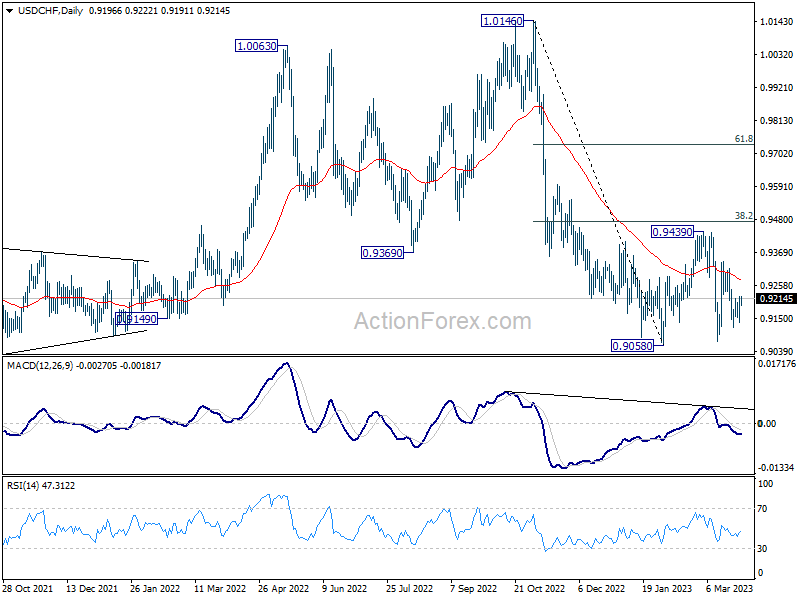
Range trading continues in USD/CHF and intraday bias remains neutral. Corrective pattern from 0.9058 low is extending. Another rise cannot be ruled out, but upside should be limited by 0.9474 fibonacci level. On the downside, firm break of 0.9058 will resume larger down trend from 1.1046.
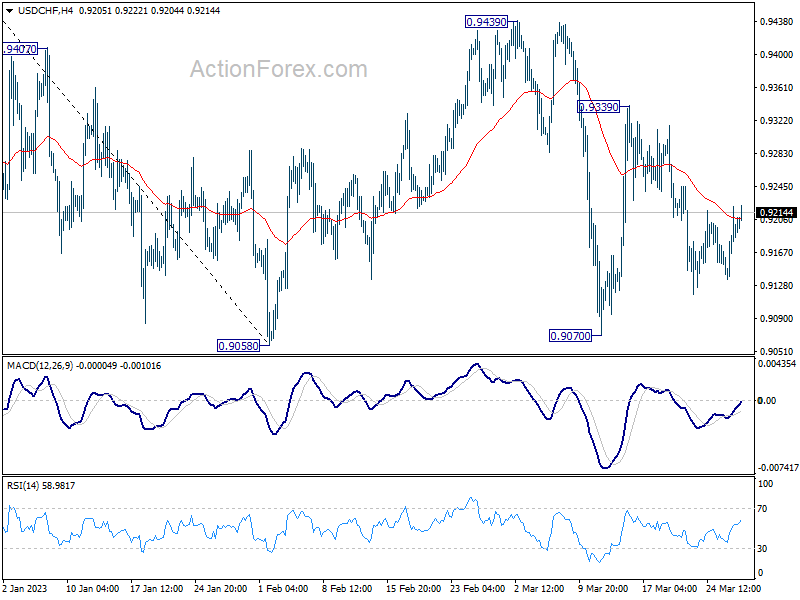
In the bigger picture, fall from 1.1046 (2022 high) should still be in progress with 38.2% retracement of 1.0146 to 0.9058 at 0.9474 intact. Prior rejection by 55 week EMA was a medium term bearish sign. Break of 0.9058 will resume such decline towards 0.8756 support (2021 low). But overall, this fall is still as a leg in the long term range pattern from 1.0342 (2016 high). So, downside should be contained by 0.8756 to bring reversal.
USD/JPY Daily Outlook
Daily Pivots: (S1) 130.34; (P) 130.97; (R1) 131.54; More...
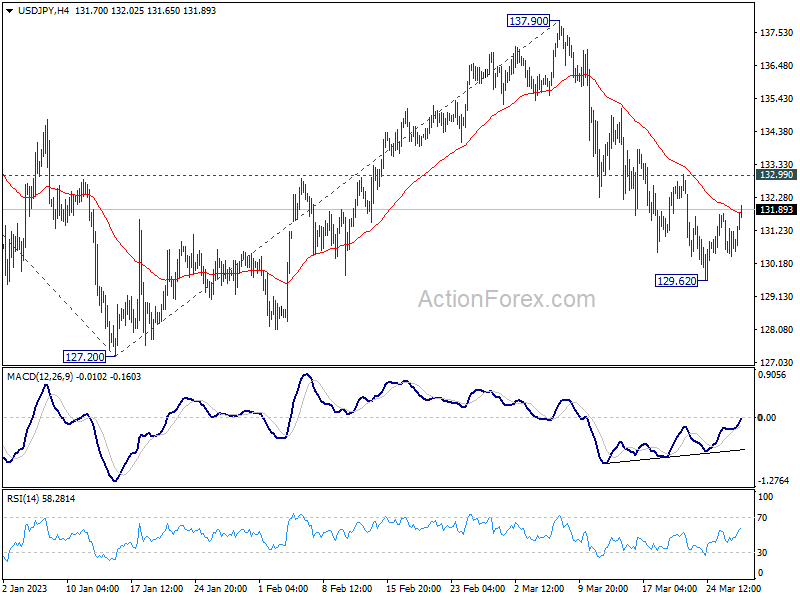
Intraday bias in USD/JPY remains neutral as corrective pattern from 129.62 is in progress. With 132.99 resistance intact, outlook stays bearish. On the downside, break of 129.62 will target a test on 127.20 low. Decisive break there will resume larger decline from 151.93 to 61.8% projection of 151.93 to 127.20 from 137.90 at 122.61.
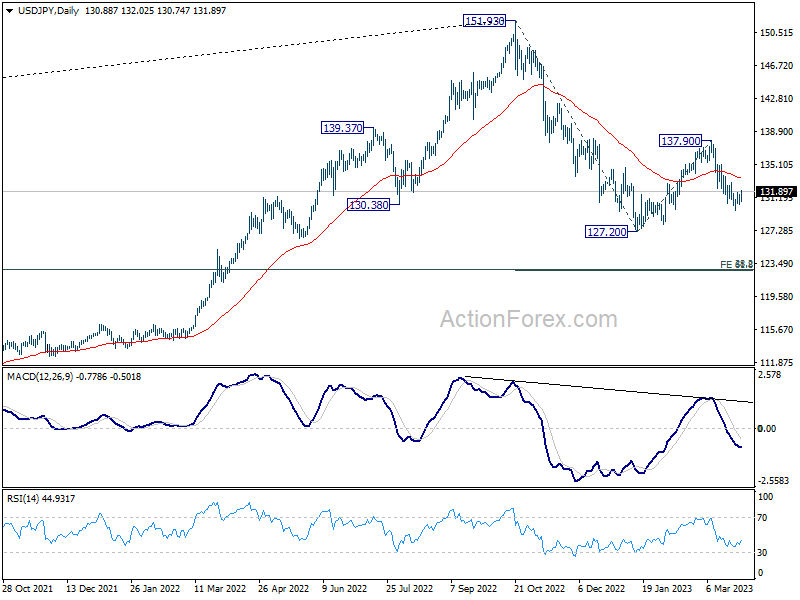
In the bigger picture, rebound from 127.20 should have completed at 137.90 as a corrective move. The down trend from 151.93 (2022 high) is still in progress. Break of 127.20 will resume this down trend and target 61.8% projection of 151.93 to 127.20 from 137.90 at 122.61. This will now be the favored case as long as 137.90 resistance holds.
AUD/USD Daily Report
Daily Pivots: (S1) 0.6665; (P) 0.6688; (R1) 0.6730; More...
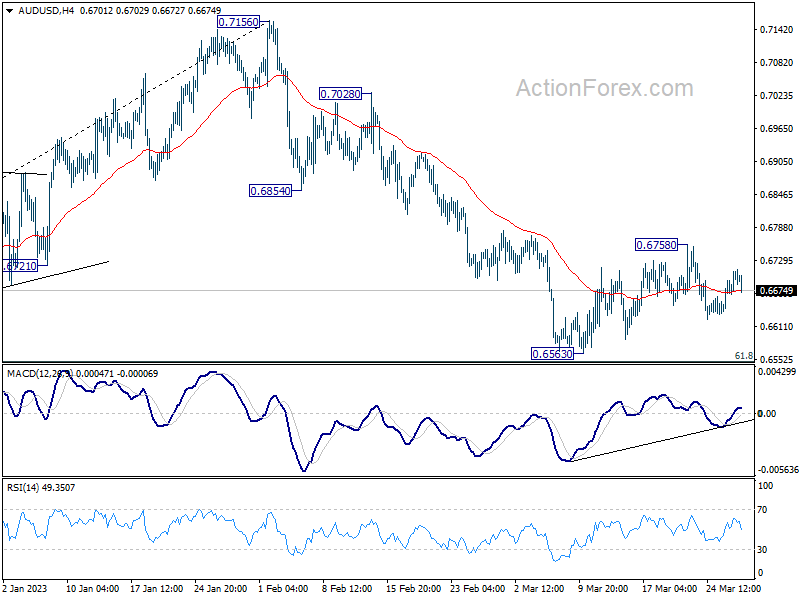
AUD/USD is staying in consolidation from 0.6563 and intraday bias remains neutral first. Deeper decline is in favor as long as 0.6758 resistance holds. On the downside, decisive break of 0.6546 fibonacci level will carry larger bearish implication. On the upside, however, break of 0.6758 resistance will now be a strong signal of bullish reversal and turn bias back to the upside.
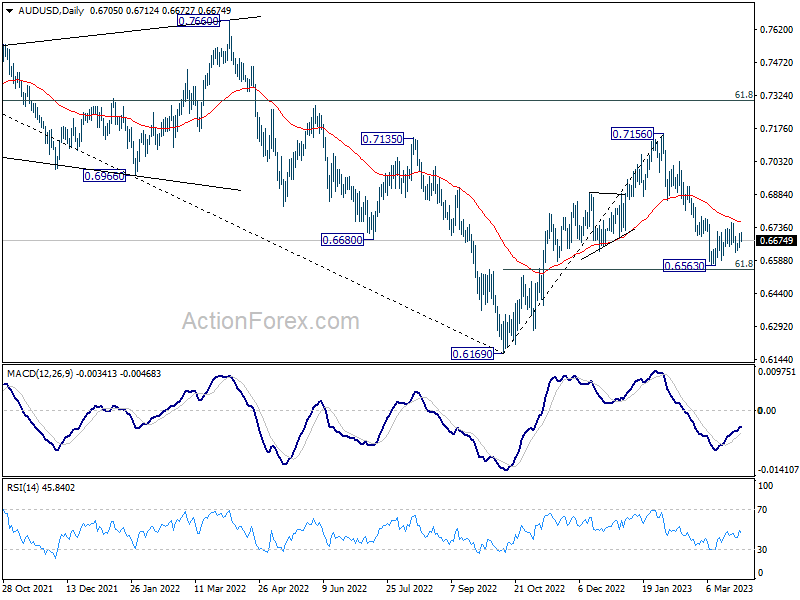
In the bigger picture, as long as 61.8% retracement of 0.6169 to 0.7156 at 0.6546 holds, the decline from 0.7156 is seen as a correction to rally from 0.6169 (2022 low) only. Another rise should still be seen through 0.7156 at a later stage. However, sustained break of 0.6546 will raise the chance of long term down trend resumption through 0.6169 low.
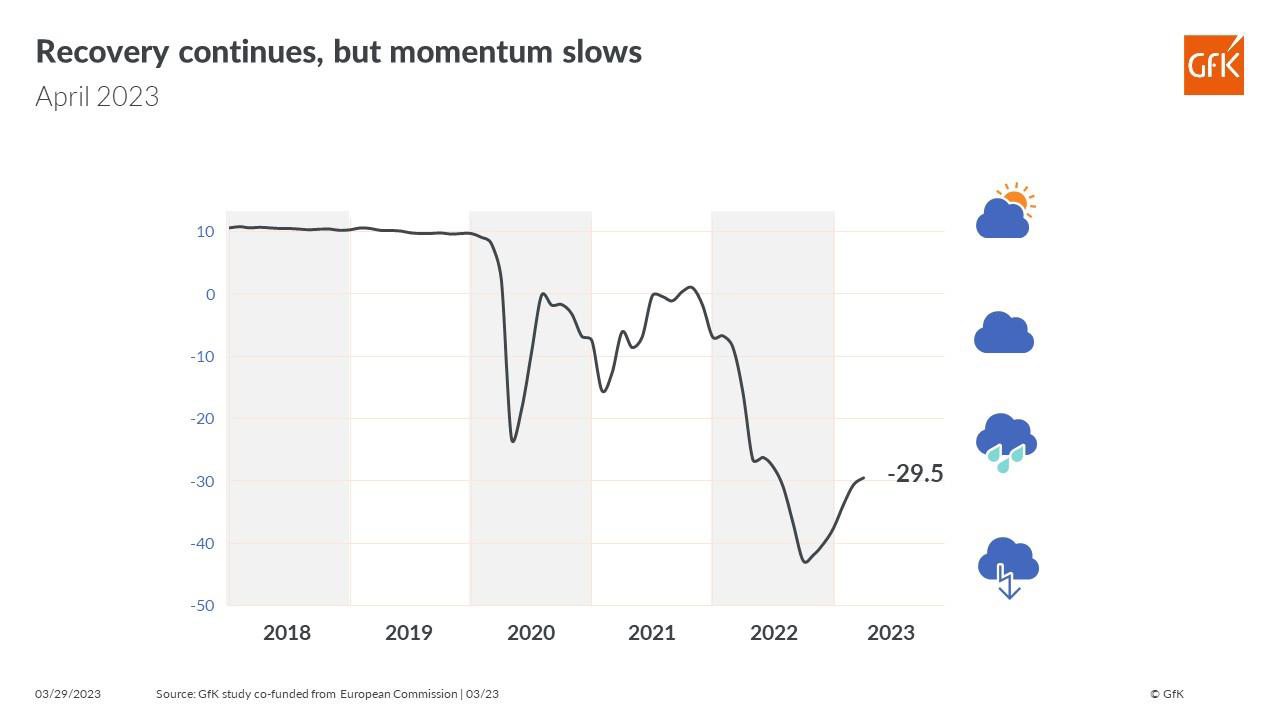
Germany Gfk consumer sentiment ticked up to -29.5, hindered by purchasing power concerns
Germany's GfK consumer sentiment index for April posted a modest improvement for the sixth consecutive month, rising from -30.6 to -29.5, although it fell short of the expected -29.0. In March, economic expectations for dipped from 6.0 to 3.7, while income expectations increased from -27.3 to -24.3. Propensity to buy also saw a slight uptick from -17.3 to -17.0.
GfK consumer expert Rolf Bürkl attributes the improved income expectations to the recent decline in energy prices, particularly for gas and heating oil. However, Bürkl cautions that inflation will remain elevated this year, albeit lower than the 6.9% recorded in 2022.
He explains, "The expected loss of purchasing power is preventing a sustained recovery in domestic demand. Accordingly, private consumption is unlikely to make a positive contribution to economic growth in Germany this year." This outlook is reinforced by the persistently low level of consumer sentiment.
Inflation in Australia Slows More than Expected
Investor sentiment improves as price action in bank stocks point at waning stress.
Treasuries give back gains on the back of weaker risk aversion. The German 2-year yield is back to around 2.60% - after falling to around 2% during the worse of the latest banking stress, while the US 2-year yield settles above the 4% mark.
The S&P500 and Nasdaq come under the pressure of rising yields, which means – if banking stress wanes, the US will go back to fighting inflation, and that could mean another 25bp hike from the Federal Reserve (Fed) in May.
For now, activity on Fed funds futures still point at ‘no hike’ as base-case scenario, with around 60% chance for status quo. But we know that, the pricing could change rapidly in case of a strong US GDP update on Thursday, and a disappointing PCE read on Friday.
End of the beans?
The S&P500 – which benefited from falling yields due to the Silicon Valley Bank (SVB) collapse - is now sitting above the 200-DMA. But a move above the 4000-4200 range will likely be challenging unless the next earnings season comes with a positive surprise. Therefore, we could see gains in the S&P500 rapidly fade if the US yields trend higher with the waning bank stress.
But maybe not today!
Investor mood in Asia was not bad this Wednesday. Alibaba – which jumped more than 14% in New York yesterday, boosted sentiment in Hong Kong. Investors loved the idea that the $220 billion worth Alibaba would be split into 6 little AliBabas which could then be individual units with capacity to raise funds and explore IPOs.
In FX
It could be time for the US dollar to halt selloff and consider a potential rebound, if the US yields recover a part of losses related to bank stress.
The latter could slow the EURUSD’s positive momentum, but the euro is still expected to benefit from the European Central Bank’s (ECB) strong determination to abate inflation despite the bank worries.
From tomorrow, the most recent eurozone inflation figures for March will start coming in. On Friday, the Eurozone’s March preliminary CPI will tell whether the base-effect magic will finally operate. The Eurozone inflation is expected to fall from 8.5% to 7.1% from last March - the first full war month of last year. And soft inflation, if soft enough, could soften the ECB expectations and get some bears to sell the euro. But the medium-term outlook for the EURUSD remains positive.
Elsewhere, inflation in Australia fell more than expected in February, from 7.4% to 6.8%, versus 7.1% expected by analysts. The AUDUSD fell on the back of a broadly stronger US dollar and a softer-than-expected CPI read that fueled dovish Reserve Bank of Australia (RBA) expectations.
In the UK, however, shop prices rose 8.9% this month, a record high going back to 2005 when the data was first collected, and grocery inflation hit a fresh high of 17.5%. Rising UK inflation fuels the Bank of England (BoE) hawks. Sterling bulls have their eyes set on the $1.25 target. But a potential recovery in the US dollar posterior to the bank stress could build a solid wall of resistance at this level.
US Consumer Confidence Surprising Positively
Market movers today
Another day with a thin data calendar. February Retail Sales will be released for Sweden and Norway this morning.
Norwegian retail sales bounced back a bit in January after the sharp fall in December, but the underlying trend is still down, thanks to a combination of reduced purchasing power and the shift towards services after the economy reopened in spring 2022. Figures from BankAxept for card purchases in February suggest that spending dropped back again slightly, so we expect retail sales to fall 0.8% m/m, continuing the underlying downward trend.
In Sweden retail sales figures as well as NIER business and household survey to be published in Sweden. The latest NIER survey from February showed a slight improvement for corporates, with better order inflow and slightly higher hiring plans than during January. Retail sales figures on the other hand reflected a direr picture last month. We expect today's number to confirm the image of increasingly pressed Swedish households and a corporate sector that holds up surprisingly well.
The Czech National Bank is expected to leave rates unchanged in its meeting today.
ECB's Schnabel will be on the wires late in the evening, while the Fed's Barr testifies to the US House financial services committee on bank oversight.
The 60 second overview
Market recap: It has been fairly quiet overnight with most notably Chinese equities performing well following news of a revamp of Alibaba Group Holdings. AUD rates are a little lower as Australian CPI released overnight fell short of market expectations with headline inflation falling from 7.4% Y/Y in January to 6.8% in February. Equity futures are generally trading modestly in green while yields are a little higher. Commodities are little changed.
US economic data surprising positively. Yesterday's release of the Conference Board's consumer confidence index revealed a surprise rise in the main index from 103.4 to 104.2. Following recent market jitters and renewed focus on the risk of a US recession consumer confidence was widely expected to drop considerably. Hence the release was a clear positive surprise likely reflecting how US consumers still enjoy a strong job market situation even if a slightly smaller share of respondents now find "jobs plentiful" compared to one month ago.
CDS trade. Last Friday's trading session was dominated by surging European bank concerns amid a sudden focus on Deutsche Bank. Since Friday market commentators have been looking for reasons why Deutsche Bank suddenly took centre stage without any obvious triggers or headlines hitting markets. Now market consensus seems to settle on a large single trade in the fairly illiquid Deutsche Bank 5Y credit default swap - a derivative offering protection against default - which seemingly sent the price soaring and drove widespread panic and concern in banking stocks, rates and equity markets in general.
Since Friday German and European regulators have underlined an increased focus on risks but also that they believe the banking sector is in a solid shape and much better capitalised than in 2007 and 2008.
Hungary central bank. Yesterday the Hungarian central bank (MNB) kept policy rates unchanged - i.e. benchmark rate of 13.0% and one-day deposit rate of 18.0%. While this was largely expected the HUF still gained strongly as the MNB argued against Primer Minister Orban's urge for rate cuts. The MNB argued that a "trend-like improvement" to the risk assessment is necessary before considering making changes to the current policy setting which at this stage is "not on the agenda" according to Deputy Governor Virag.
Equities: Global equities slightly higher yesterday despite US markets dragging the overall performance lower. Once again it was value driven outperformance and partly defensive as the energy sector was outperforming. Higher yields the natural candidate for growth stocks to struggle. Worth noting, VIX lower again yesterday and now below 20. Implied equity vol is now back around the level before the SVB driven vol spike. The same cannot yet be said about bond vol though it is moving lower as well. In US Dow -0.1%, S&P 500 -0.2%, Nasdaq -0.5% and Russell 2000 -0.1%. Asian markets mostly higher this morning driven by the Chinese stock trade in Hong Kong. US and core European futures in green as well this morning. Credit: Sentiment remains fragile in credit markets and yesterday iTraxx Xover tightened 3.2bp, closing at 486.6bp, while iTraxx Main tightened insignificantly 0.6bp to close at 95.5bp. The primary market continues to be active with several mandates announced throughout the day.
FI: The normalisation in both rates and equities continues with rates rising as the focus returns to the high inflation numbers and the sentiment shift from "risk-off" to "risk-on". 10Y Treasury yields rose 4bp, while 2Y Treasuries rose 13bp.
FX: In a session characterised by further banking-fear relief cyclically sensitive and commodity currencies were generally the big outperformers. HUF was the biggest winner following the MNB rate decision and higher European bank stocks. EUR/USD is back around the 1.0850-levels which is where the cross traded prior to Friday's Deutsche Bank fears.
USD/CAD Daily Outlook
Daily Pivots: (S1) 1.3562; (P) 1.3628; (R1) 1.3665; More....
USD/CAD's break of 1.3629 support indicates that deeper pull back in underway. Intraday bias is back and break of 55 day EMA (now at 1.3586) will target 61.8% retracement of 1.3261 to 1.3860 at 1.3490. On the upside, above 1.3694 minor resistance will turn intraday bias neutral first. Overall, the corrective pattern from 1.3976 could be extending with another falling leg from 1.3860.
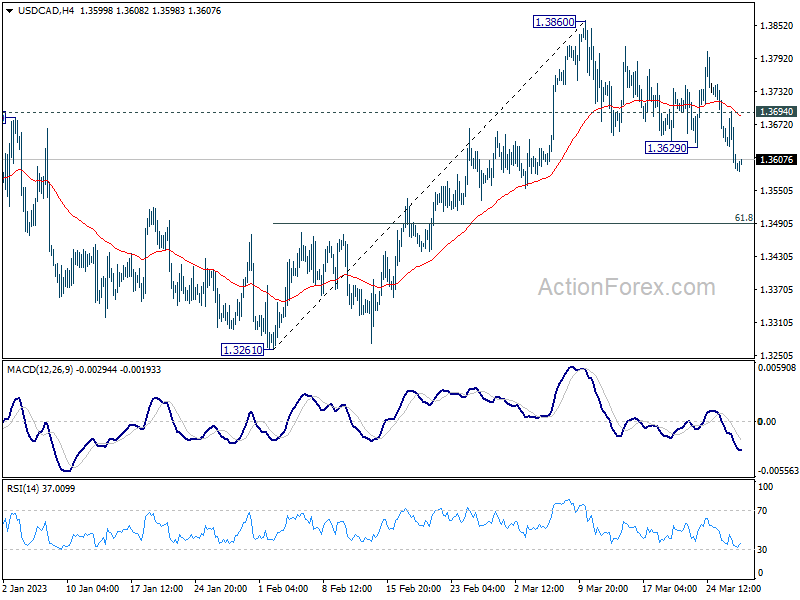
In the bigger picture, the up trend from 1.2005 (2021 low) is still in progress. Break of 1.3976 will confirm resumption and target 61.8% projection of 1.2401 to 1.3976 from 1.3261 at 1.4234. Firm break there will pave the way to long term resistance zone at 1.4667/89 (2016, 2020 highs). On the downside, break of 1.3261 support is needed to confirm medium term topping. Otherwise, outlook will remain bullish even in case of deep pull back.
Oil Prices Rebound Boosts Canadian Dollar; Risk Sentiment Improve
Dollar, Japanese Yen, and Swiss Franc are under selling pressure this week amid improving risk sentiment. Yen is particularly weighed down by the extended rebound in treasury yields, while Swiss Franc is pressured by sell-offs against Euro and Sterling. Currently, the Canadian Dollar leads the pack for the week, aided by recovering oil prices. Australian Dollar, however, lags behind as CPI data supports the possibility of an RBA pause next week.
With a light economic calendar and second-tier releases featured, the main focus remains on the overall development in risk markets. Concerns over the banking crisis could subside if no additional banks are reported to be in trouble. Attention will shift back to inflation data from the Eurozone and the US later in the week.
Oil prices experienced a surge earlier this week due to supply worries after Turkey halted crude pumping from Iraq's Kurdistan region via a pipeline. The decision followed an arbitration ruling confirming Baghdad's consent was necessary to ship the oil. These exports represent approximately 0.5% of global oil supply.
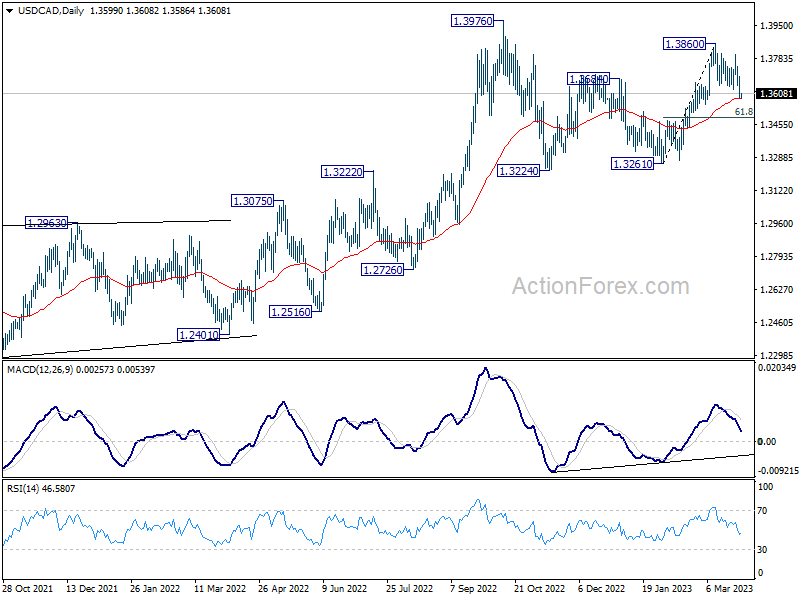
Technically, WTI's break of the 72.16 support-turned-resistance should confirm short-term bottoming at 64.19, supported by medium-term channel support. Immediate focus is on the 55day EMA (currently at 75.19). A firm break there would trigger a more robust rebound to 80.82 resistance, potentially aiding Canadian Dollar's recovery.
In Asia, at the time of writing, Nikkei is up 1.00%. Hong Kong HSI is up 2.12%. China Shanghai SSE is down -0.06%. Singapore Strait Times is up 0.18%. Japan 10-year JGB yield is down -0.0184 at 0.296. Overnight, DOW dropped -0.12%. S&P 500 dropped -0.16%. NASDAQ dropped -0.45%. 10-year yield rose 0.036 to 3.564.
Australia CPI slowed to 6.8% yoy, supports RBA pause next week
Australia's monthly CPI in February eased from 7.4% yoy to 6.8% yoy, below expectation of 7.2% yoy. CPI excluding volatile items such as fruit, vegetables, and automotive fuel also slowed from 7.5% yoy to 6.9% yoy.
Michelle Marquardt, Head of Prices Statistics at the Australian Bureau of Statistics (ABS), noted that "this marks the second consecutive month of lower annual inflation, also known as 'disinflation', from the peak of 8.4% in December 2022."
Although inflation remains well above RBA's target band of 2-3%, the start of disinflation process could increase the likelihood of a pause in the RBA's tightening cycle during their next meeting. The continued easing of inflationary pressures may prompt the central bank to take a more cautious approach in the near term.
AUD/NZD ready for downside breakout after AU CPI
AUD/NZD is trading slightly lower following the release of Australia's lower-than-expected monthly CPI data, which bolsters the case for a pause in RBA's tightening cycle next week. While there are talks of another 25bps RBA rate hike in May, taking rate to 3.85%, it would still be 90bps below RBNZ's current rate of 4.75%. Furthermore, RBNZ is expected to increase rates by an additional 25bps to 5.00% in April, further widening the gap between the two central banks.
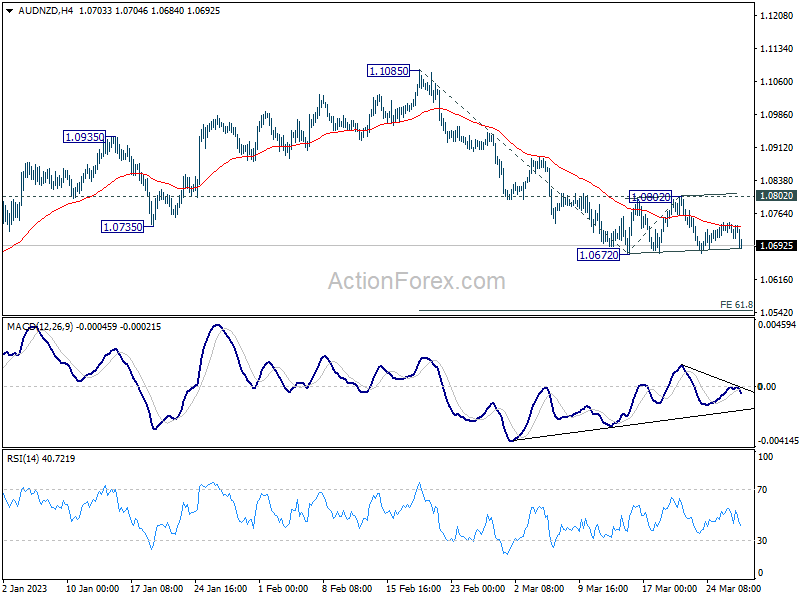
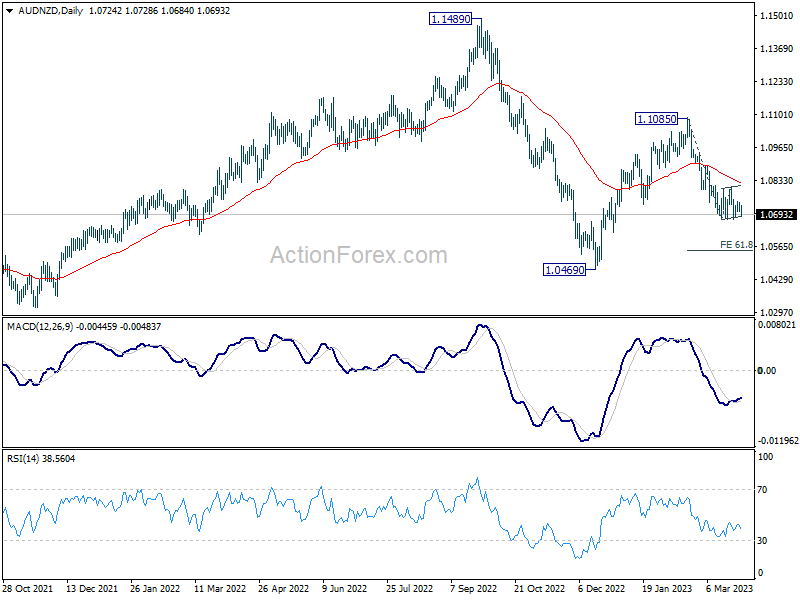
Technically speaking, AUD/NZD's price movements from 1.0672 appear to be corrective in nature. Rejection by 4 hour 55 EMA suggests that the decline from 1.1085 could resume soon. A break below 1.0672 would confirm the resumption of the fall and target 61.8% projection of 1.1085 to 1.0672 from 1.0802 at 1.0547. In any case, outlook will remain bearish as long as 1.0802 resistance level holds.
Incoming BoJ Deputy Governor Uchida Stresses Importance of Trend Inflation in Monetary Policy
Incoming BoJ Deputy Governor Shinichi Uchida emphasized the significance of trend inflation in a parliamentary session today, stating that the central bank will conduct a comprehensive assessment of various data, including trend inflation developments, to guide monetary policy.
Uchida said that "trend inflation is an extremely important factor for us in judging on achievement of 2% inflation target in a stable manner." He also mentioned that the BoJ will "make comprehensive judgment by looking at various price indicators."
In addition, Uchida highlighted the importance of communication between the central bank and the markets, saying, "We will strive to communicate firmly with markets to gain understanding" regarding the BoJ's policy approach. This statement underscores the commitment of the BoJ to transparency and open dialogue in shaping its monetary policy.
Looking ahead
Germany Gfk consumer sentiment, Swiss Credit Suisse economic expectations, UK mortgage approvals and M4 money supply will be released in European session. Later in the day, US will publish pending home sales.
USD/CAD Daily Outlook
Daily Pivots: (S1) 1.3562; (P) 1.3628; (R1) 1.3665; More....
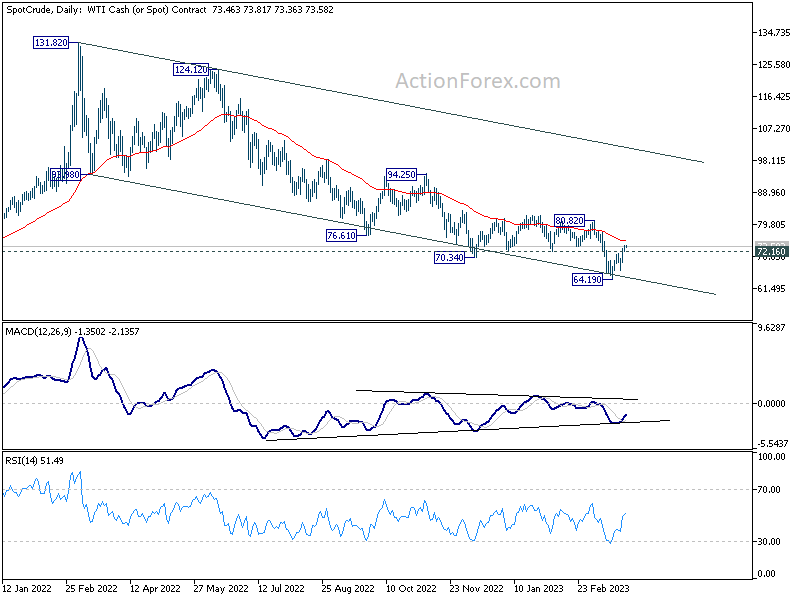
USD/CAD's break of 1.3629 support indicates that deeper pull back in underway. Intraday bias is back and break of 55 day EMA (now at 1.3586) will target 61.8% retracement of 1.3261 to 1.3860 at 1.3490. On the upside, above 1.3694 minor resistance will turn intraday bias neutral first. Overall, the corrective pattern from 1.3976 could be extending with another falling leg from 1.3860.
In the bigger picture, the up trend from 1.2005 (2021 low) is still in progress. Break of 1.3976 will confirm resumption and target 61.8% projection of 1.2401 to 1.3976 from 1.3261 at 1.4234. Firm break there will pave the way to long term resistance zone at 1.4667/89 (2016, 2020 highs). On the downside, break of 1.3261 support is needed to confirm medium term topping. Otherwise, outlook will remain bullish even in case of deep pull back.
Economic Indicators Update
| GMT | Ccy | Events | Actual | Forecast | Previous | Revised |
|---|---|---|---|---|---|---|
| 00:30 | AUD | Monthly CPI Y/Y Feb | 6.80% | 7.20% | 7.40% | |
| 06:00 | EUR | Germany Gfk Consumer Confidence Apr | -29 | -30.5 | ||
| 08:00 | CHF | Credit Suisse Economic Expectations Mar | -12.3 | |||
| 08:30 | GBP | Mortgage Approvals Feb | 42K | 40K | ||
| 08:30 | GBP | M4 Money Supply M/M Feb | 0.90% | 1.30% | ||
| 13:00 | CHF | SNB Quarterly Bulletin | ||||
| 14:00 | USD | Pending Home Sales M/M Feb | -2.20% | 8.10% | ||
| 14:30 | USD | Crude Oil Inventories | 1.8M | 1.1M |
Technical Outlook and Review
DXY:
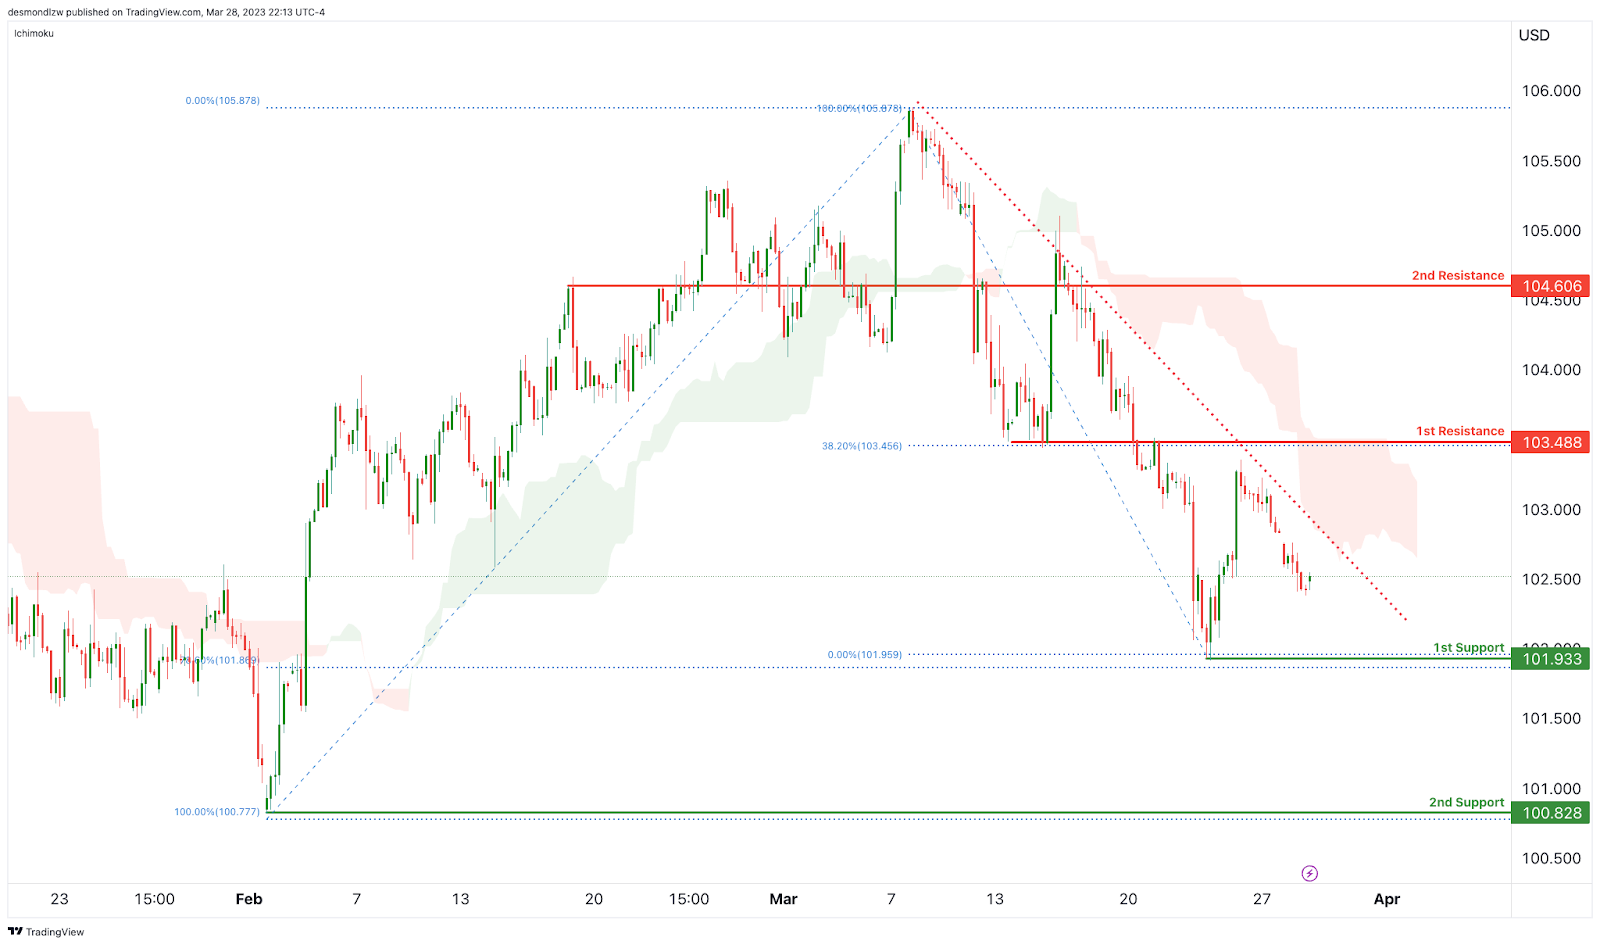
The overall momentum of the DXY chart is currently weakly bearish with low confidence, as price is trading below a major descending trend line and the bearish Ichimoku cloud. This suggests that bearish momentum is potentially on the cards.
There is a potential for a bearish continuation towards the first support level, which is at 101.93. This level is a swing low support and also has the 78.60% Fibonacci retracement lining up with it, making it a strong level to keep an eye on. If price were to break below this level, it could potentially drop down to the second support level at 100.82, which is also a swing low support.
On the upside, the first resistance level is at 103.48. This level is a pullback resistance and also coincides with a 38.20% Fibonacci retracement, making it a strong level of resistance. If price is able to break above this level, it could potentially trigger a bullish acceleration towards the second resistance level at 104.60, which is an overlap resistance.
It’s worth noting that while the current momentum of the DXY chart is weakly bearish with low confidence, it’s always important to keep an eye on the support and resistance levels. A break below the first support level at 101.93 could trigger a move down to the second support level at 100.82, while a break above the first resistance level at 103.48 could trigger a move up to the second resistance level at 104.60.
EUR/USD:
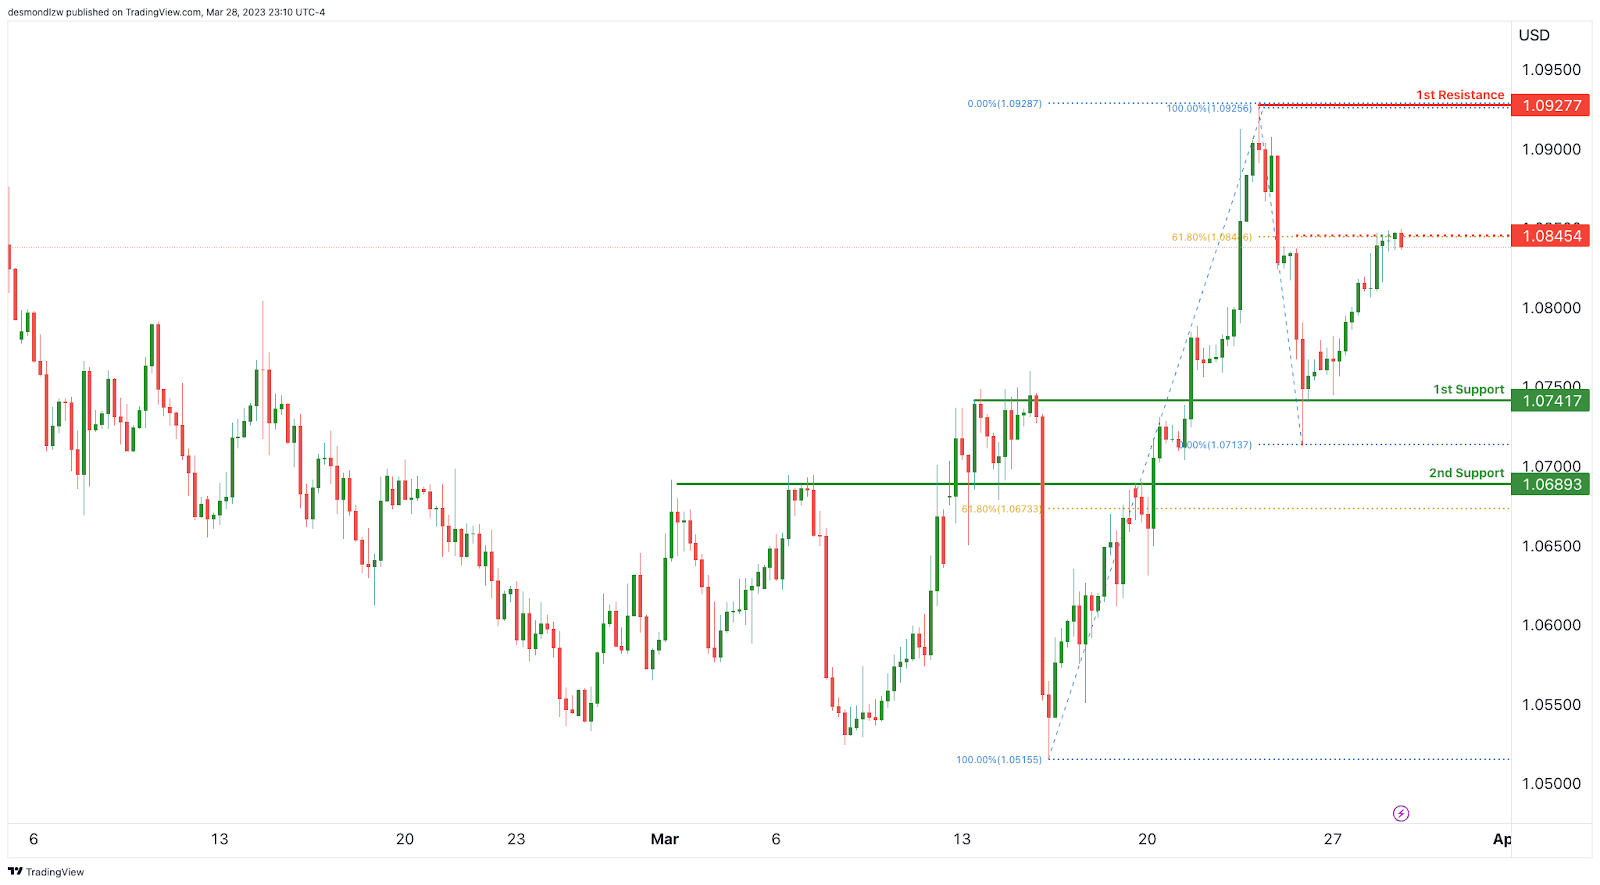
Looking at the EUR/USD chart, the overall momentum of the chart is weakly bearish with low confidence, as price is currently below a major descending trend line, which suggests the potential for further bearish momentum.
If the bearish momentum continues, price could potentially drop towards the 1st support level at 1.07417, which is an overlap support. If price were to break below this level, the next support level to watch out for would be the 2nd support at 1.06893, which is also an overlap support.
On the other hand, if price were to reverse, it could potentially rise towards the 1st resistance level at 1.09277, which is a swing high resistance. Traders should keep an eye on this level, as a break above it could signal a potential bullish reversal.
It’s worth noting that the current momentum of the EUR/USD chart is weakly bearish, and traders should remain cautious and keep an eye on support and resistance levels. A break below the 1st support level could trigger a move down to the 2nd support level, while a break above the 1st resistance level could trigger a move up to higher resistance levels.
GBP/USD:
The GBPUSD chart is showing weak bearish momentum with low confidence. This is due to the fact that the price is currently below a major descending trend line, suggesting a potential for further bearish momentum.
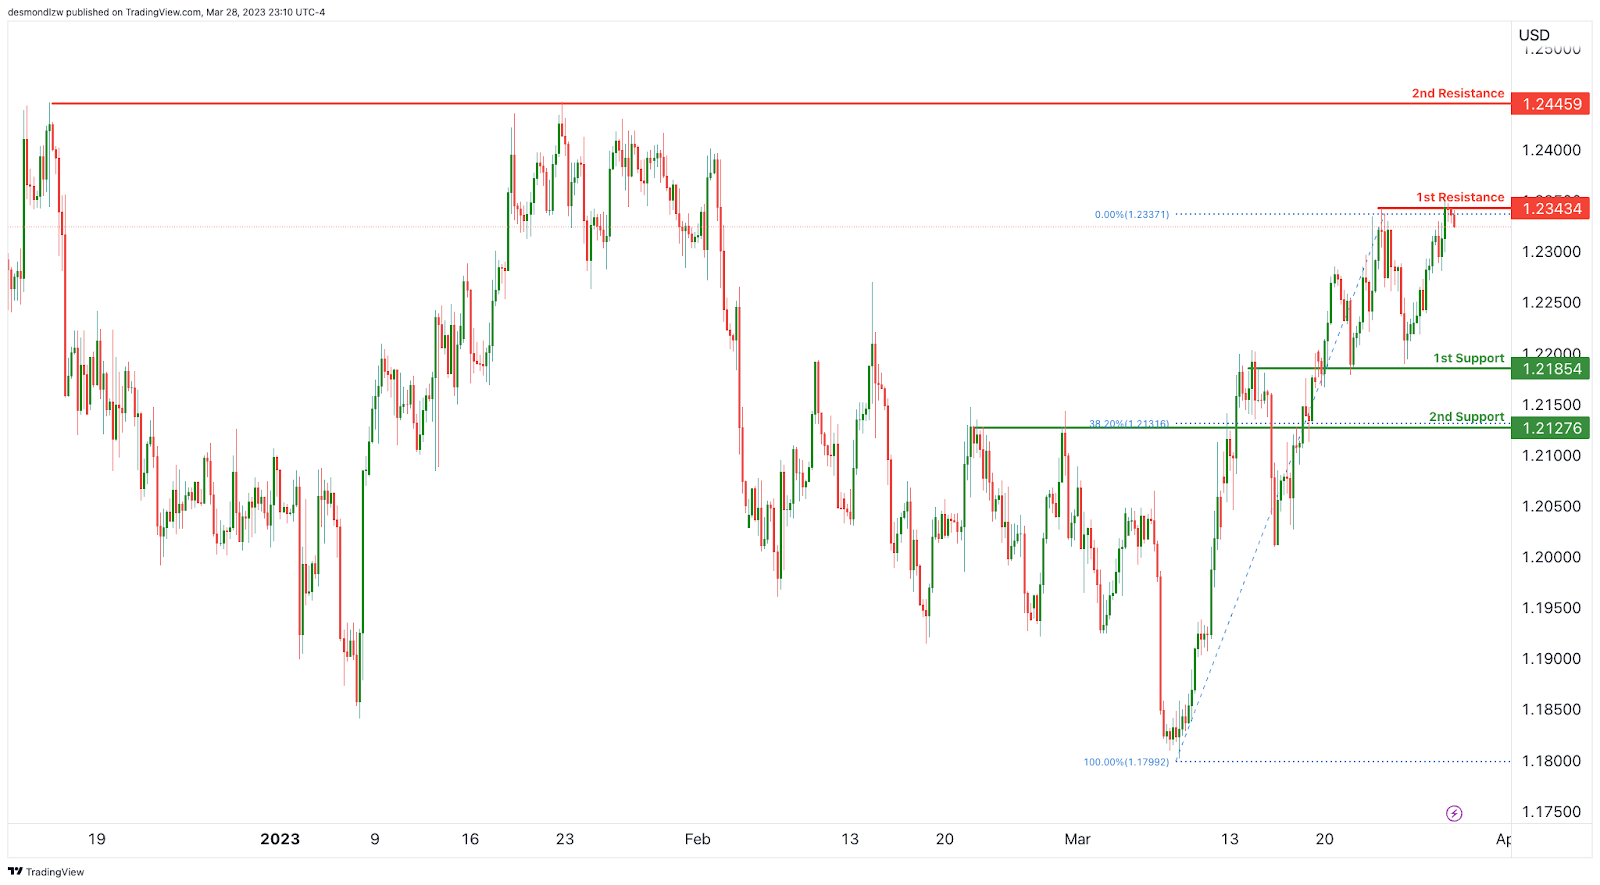
Price could potentially continue its bearish trend towards the 1st support level at 1.21854, which is a good level to watch as it is an overlap support. Another potential support level to keep an eye on is the 2nd support at 1.21276, which is also an overlap support and aligns with the 38.20% Fibonacci retracement.
On the other hand, the 1st resistance level is at 1.23434, which is a swing high resistance level and a strong level to watch. If price were to break above this level, the next resistance level to look out for would be the 2nd resistance at 1.24459, which is another overlap resistance level.
It’s worth noting that while the overall momentum of the chart is weak bearish, traders should keep an eye on the support and resistance levels. A break below the 1st support level at 1.21854 could trigger a move down to the 2nd support level at 1.21276, while a break above the 1st resistance level at 1.23434 could trigger a move up to the 2nd resistance level at 1.24459.
USD/CHF:
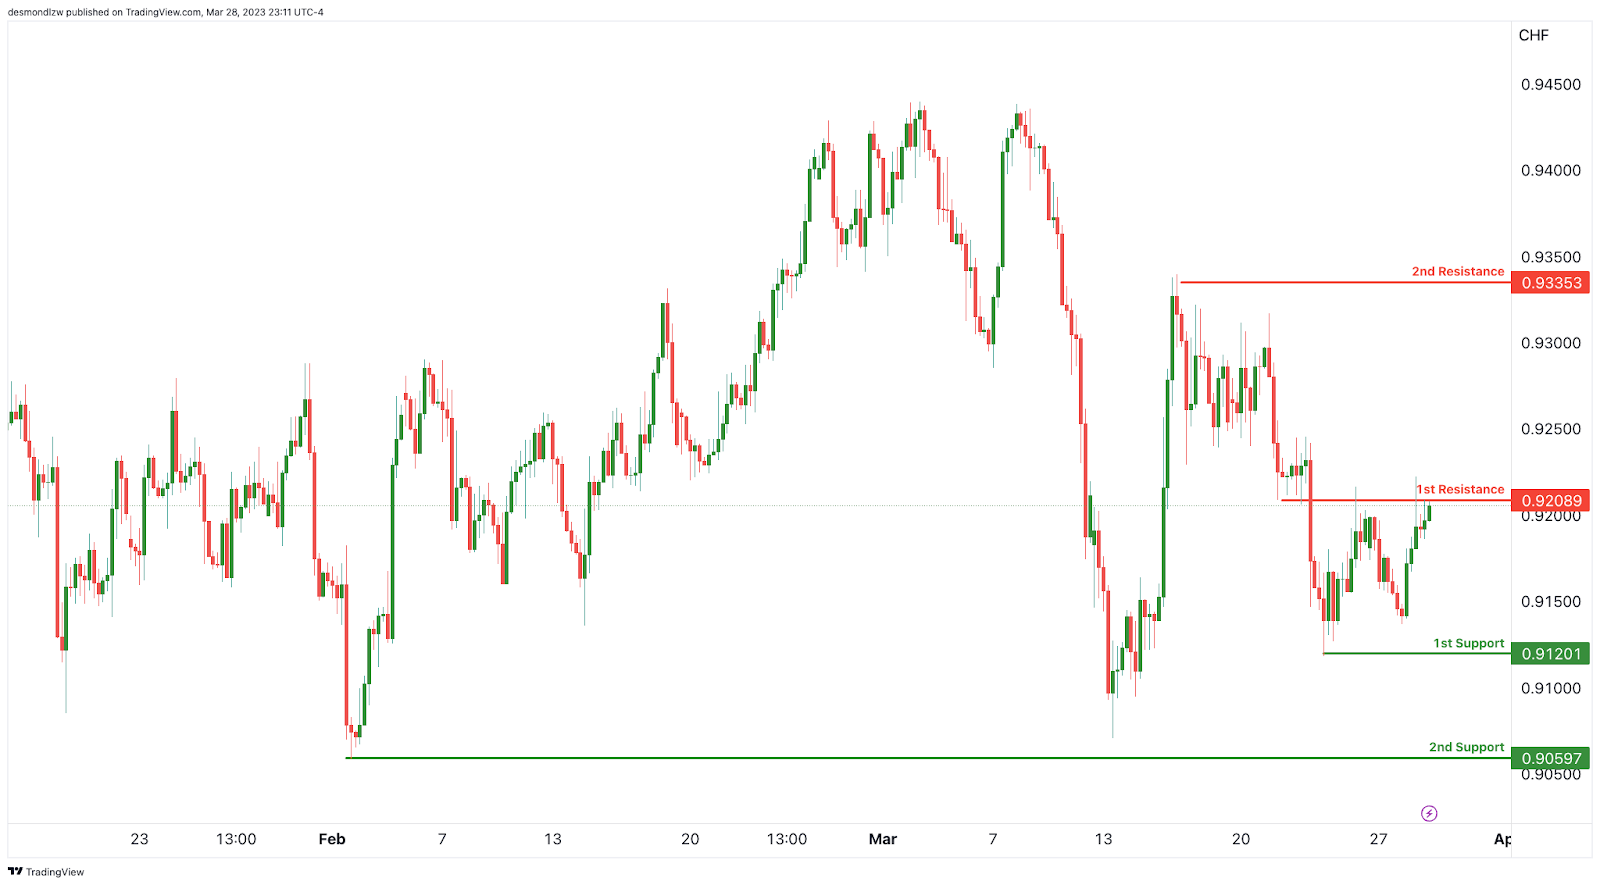
The USD/CHF chart is currently showing weak bearish momentum, with low confidence. This is due to the fact that price is below a major descending trend line, which suggests that bearish momentum is likely to continue.
Looking at potential price movements, there is a possibility of a bearish reaction off the first resistance level at 0.92089, which is an overlap resistance. This could cause prices to drop down towards the first support level at 0.91201, which is a swing low support. If prices were to break through this level, they could potentially drop further towards the second support level at 0.90597, which is also a swing low support.
On the other hand, if prices were to break above the first resistance level, they could potentially rise towards the second resistance level at 0.93353, which is a swing high resistance.
Traders should take note of the key support and resistance levels when making their trading decisions. The first support level at 0.91201 is a strong candidate for a potential bounce, as it is a swing low support. The second support level at 0.90597 is also a swing low support and could provide further support if prices were to drop further.
The first resistance level at 0.92089 is an overlap resistance level, while the second resistance level at 0.93353 is a swing high resistance level. If prices were to break above these levels, they could potentially rise further.
Overall, while the momentum of the chart is weakly bearish, traders should keep an eye on potential market movements and breakouts that could cause prices to rise towards the resistance levels or drop towards the support levels.
USD/JPY:
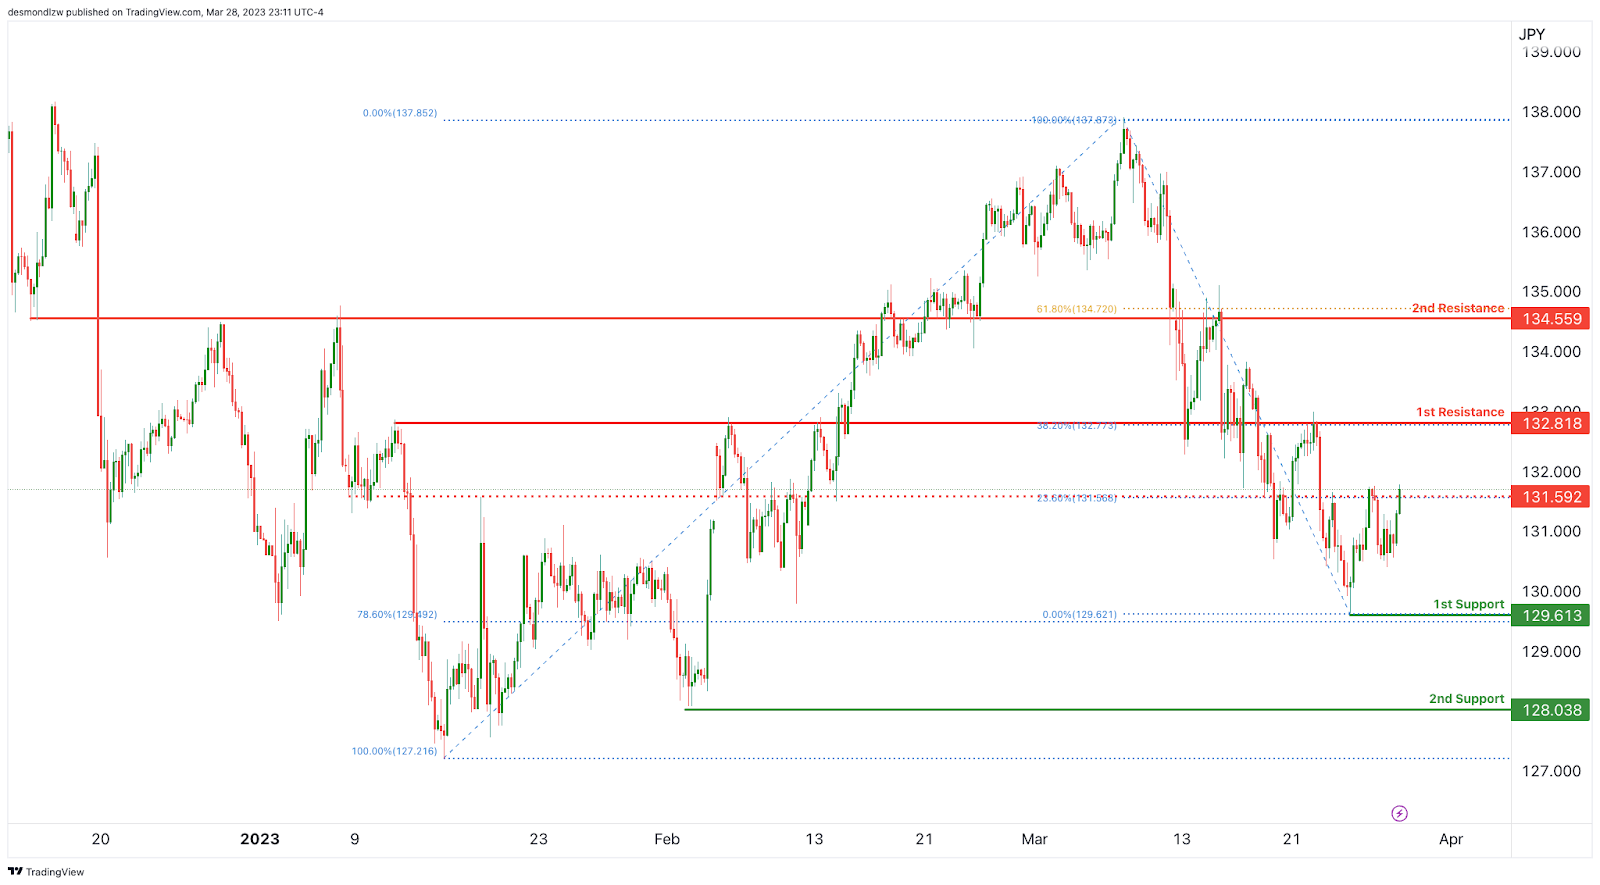
Based on the analysis of the USDJPY chart, the overall momentum of the chart is weak bearish with low confidence. This is due to the fact that the price is currently below a major descending trend line, indicating the potential for further bearish momentum.
However, in the short term, the price could potentially rise towards the 1st resistance at 132.818 before reversing off it and dropping towards the 1st support at 129.613. It’s worth noting that the 1st support level is a swing low support, while the 2nd support level at 128.038 is also a swing low support and could provide further support if prices were to drop further.
On the other hand, the 1st resistance level at 132.818 is an overlap resistance, and the 2nd resistance level at 134.559 is also an overlap resistance. These levels could potentially provide resistance to further price increases.
Traders should keep an eye on the chart for any potential breakouts or market movements that could cause prices to rise towards the resistance levels or drop towards the support levels.
AUD/USD:
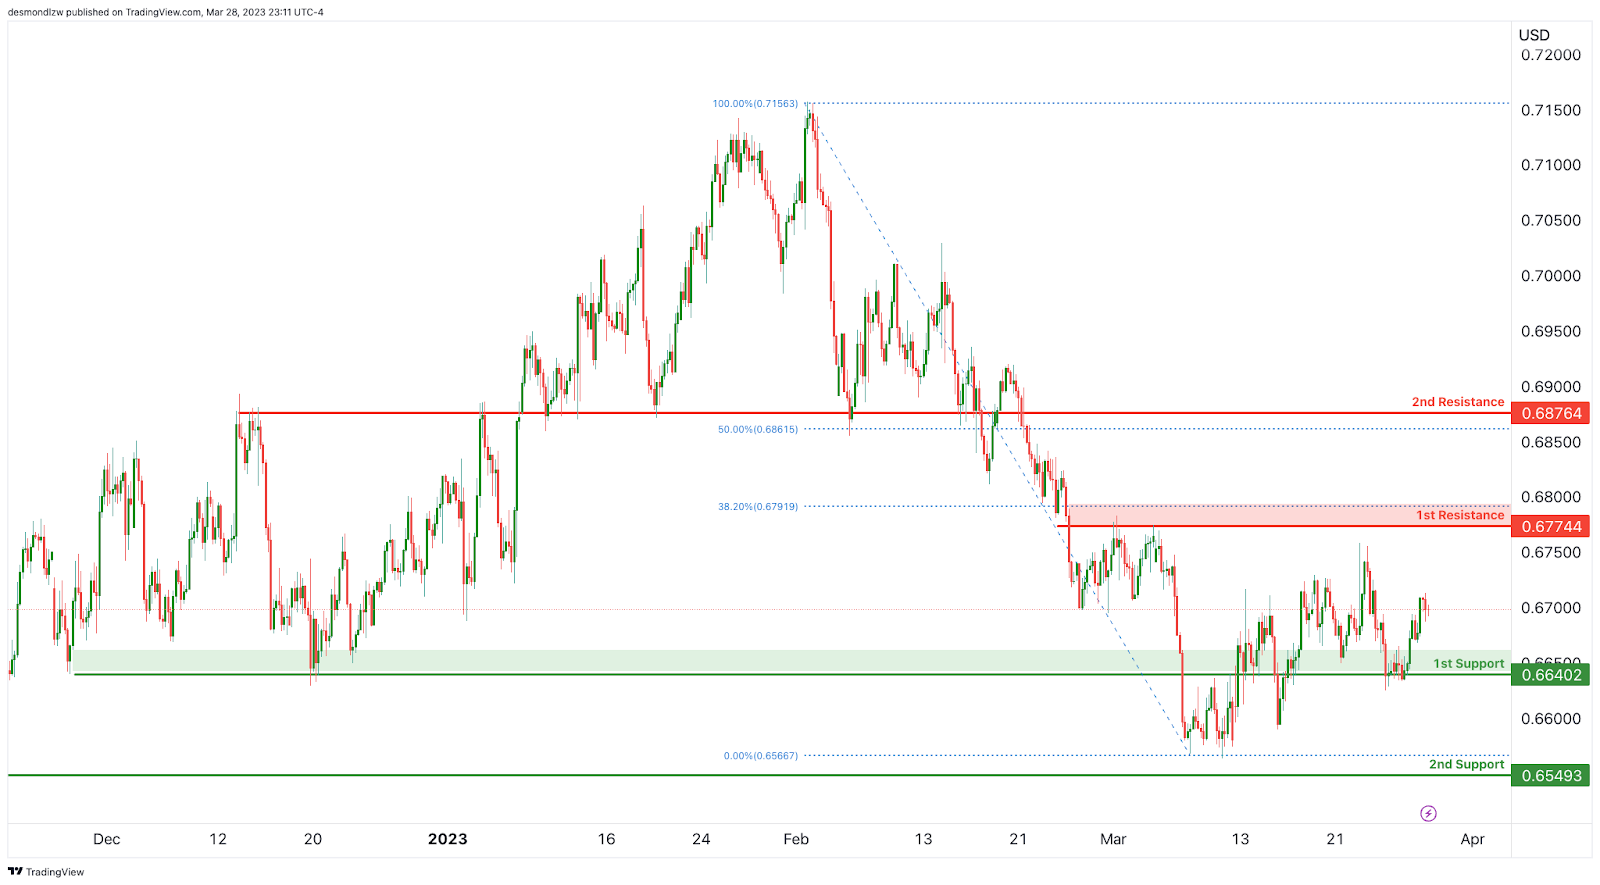
The AUDUSD chart is currently displaying a bullish momentum. This is because price is within the bullish Ichimoku cloud, which usually indicates a good support in place.
In the short term, price could potentially continue its bullish trend towards the 1st resistance level.
The 1st support is at 0.66402 and is a good level due to being an overlap support. The 2nd support is at 0.65493 and is also an overlap support.
On the other hand, the 1st resistance is at 0.67744 and is a good level due to being an overlap resistance and coinciding with the 38.20% Fibonacci retracement. The 2nd resistance is at 0.68764, which is an overlap resistance and coincides with the 50% Fibonacci retracement.
Overall, the bullish momentum in the AUD/USD chart suggests that price may continue to rise towards the 1st resistance level at 0.6774. However, it’s important to monitor the support levels at 0.6640 and 0.6549 in case of a price drop.
NZD/USD:
The NZDUSD chart is showing strong bullish momentum with price currently above the bullish Ichimoku cloud. This suggests that there is good support in place and the potential for a bullish continuation towards the first resistance level.
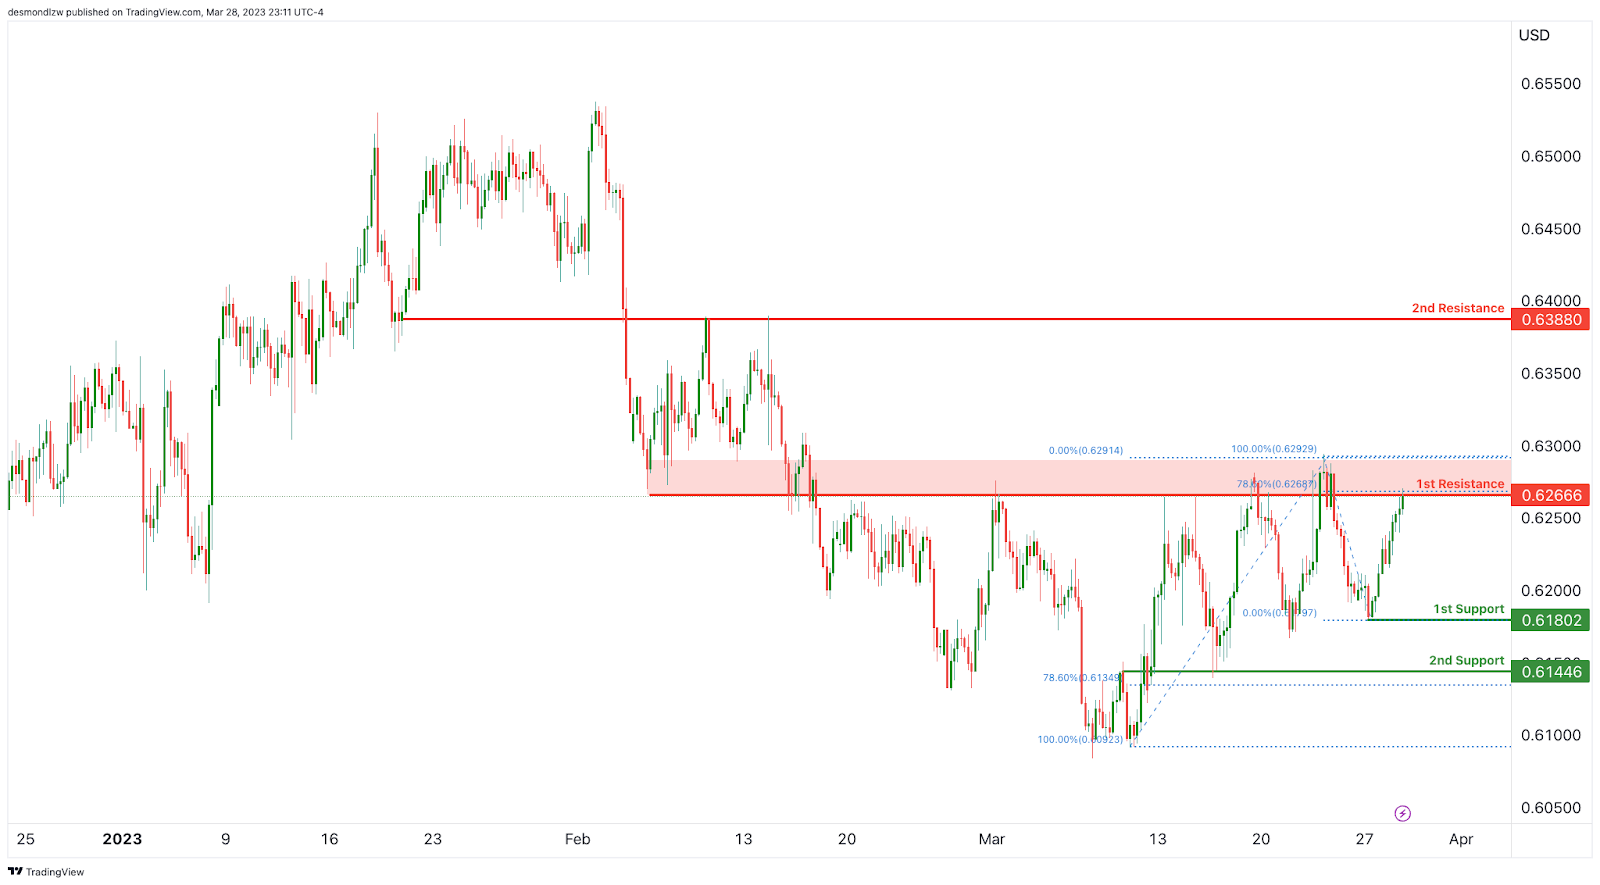
The first support level is located at 0.61802 and is a good level due to it being an overlap support. Additionally, there is a second support level at 0.61446 which is also an overlap support.
On the resistance side, the first resistance level is at 0.62666 and is also an overlap resistance. The second resistance level is located at 0.63880 which is another overlap resistance level.
If the bullish momentum continues, price could potentially reach the first resistance level. It’s important to keep an eye on these support and resistance levels as they can provide valuable insights into potential price movements.
Overall, the chart for NZDUSD is showing bullish momentum and traders should be aware of these support and resistance levels as they plan their trades.
USD/CAD:
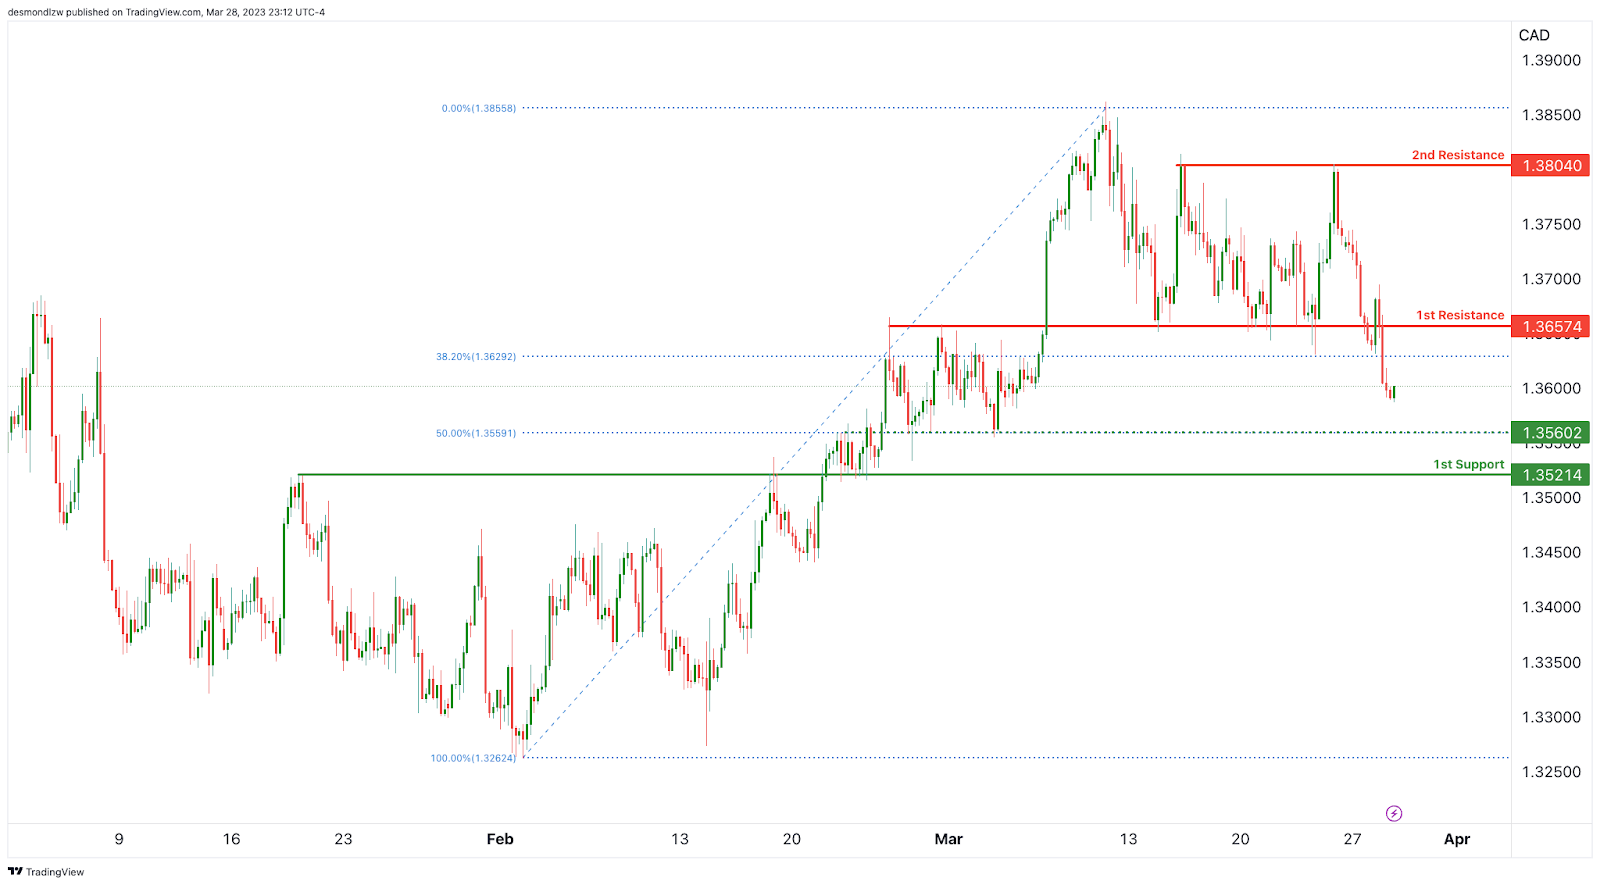
The USDCAD currency pair has been in a bearish momentum, with low confidence, as price is currently trading below the bearish Ichimoku cloud and a major descending trend line. This suggests that the bearish momentum could continue in the near term.
In terms of potential price action, there could be a bearish continuation towards the first support level at 1.35602. This support level is significant as it has acted as an overlap support in the past, and it coincides with the 50% Fibonacci retracement level. If the bearish momentum persists, the pair could potentially drop further towards the second support level at 1.35214, which is also an overlap support.
On the other hand, if the bears take a breather, the price may see some bullish retracements towards the first resistance level at 1.36574, which is another significant overlap resistance. If the bulls take control, the price could potentially rise further towards the second resistance level at 1.38040, which is also an overlap resistance.
In conclusion, the USDCAD currency pair has a bearish bias and could potentially continue its bearish momentum towards the first support level at 1.5602. However, if the price sees a bullish retracement, it may face resistance at the first resistance level at 1.36574. Traders should keep an eye on the key levels mentioned above and wait for a clear confirmation of the trend before making any trading decisions.
DJ30:
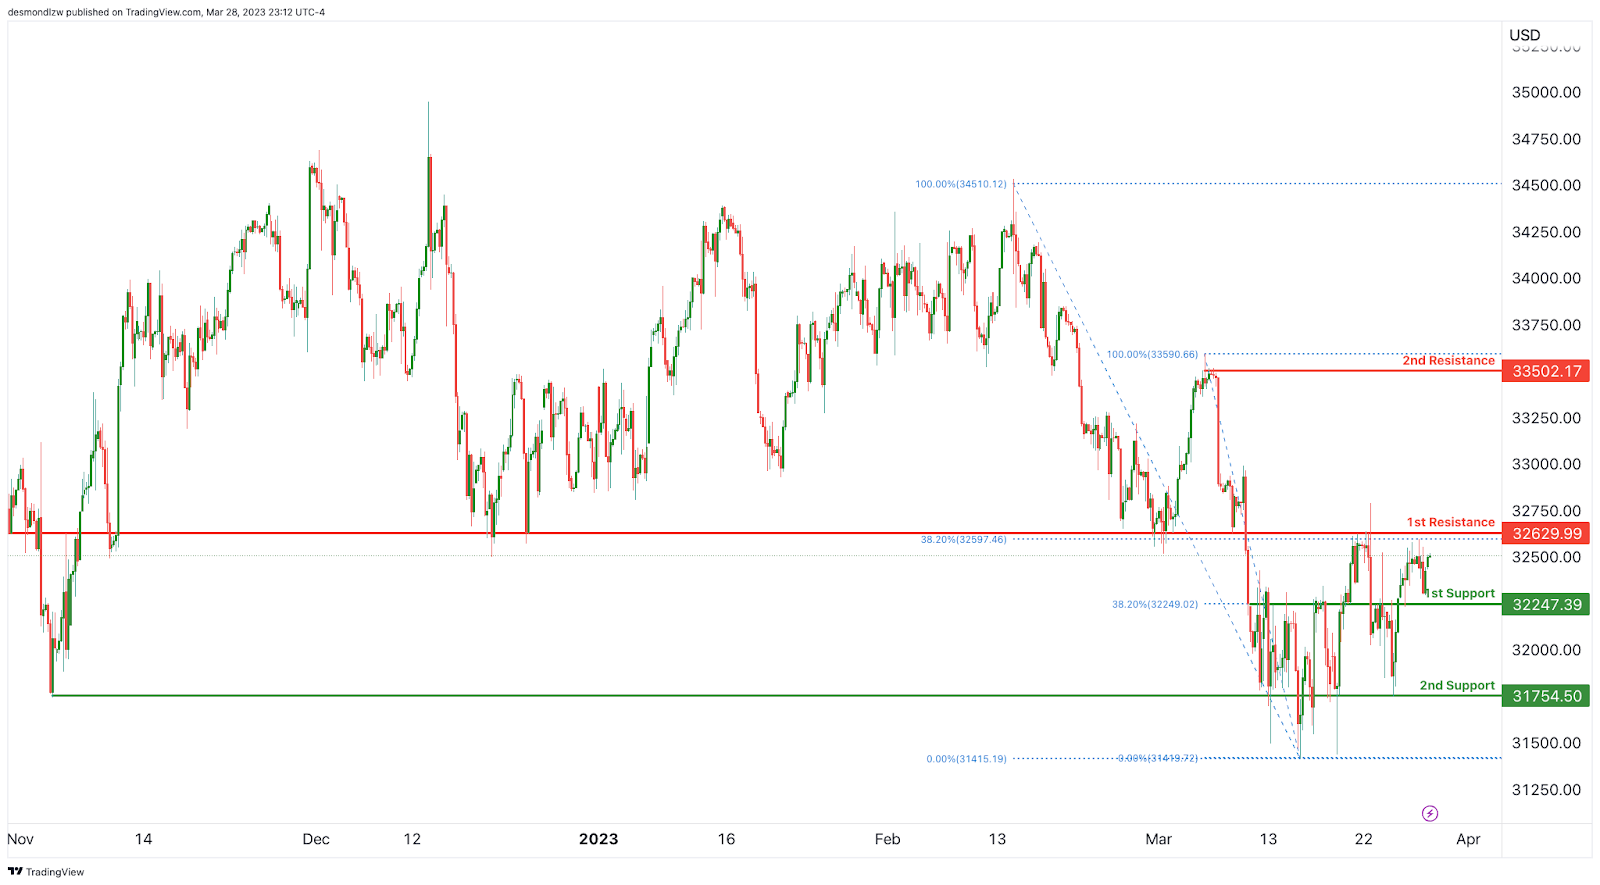
The DJ30 chart currently shows a neutral momentum, indicating that there is no clear direction or trend at present. However, it is likely that the price may fluctuate between the 1st resistance and 1st support levels in the short term.
The 1st support level is located at 32247.39 and is a significant level as it is an overlap support and is also at the 38.20% Fibonacci retracement level. This level has the potential to provide a strong bounce for the price in case of a drop.
The 2nd support level is situated at 31754.50 and is another overlap support level. It could be a significant support level if price continues to drop below the 1st support level.
On the resistance side, the 1st resistance level is located at 32629.99 and is an overlap resistance. Additionally, it is also at the 38.20% Fibonacci retracement level. This level could pose as a significant barrier for the price in case of a bullish move.
The 2nd resistance level is situated at 33502.17 and is also an overlap resistance. It could be a significant resistance level if price continues to rise above the 1st resistance level.
In summary, the DJ30 chart shows a neutral momentum with price currently fluctuating between the 1st support and 1st resistance levels. The 1st support level at 32247.39 and the 1st resistance level at 32629.99 are key levels to watch out for as they are significant and could have a strong impact on price action.
GER30:
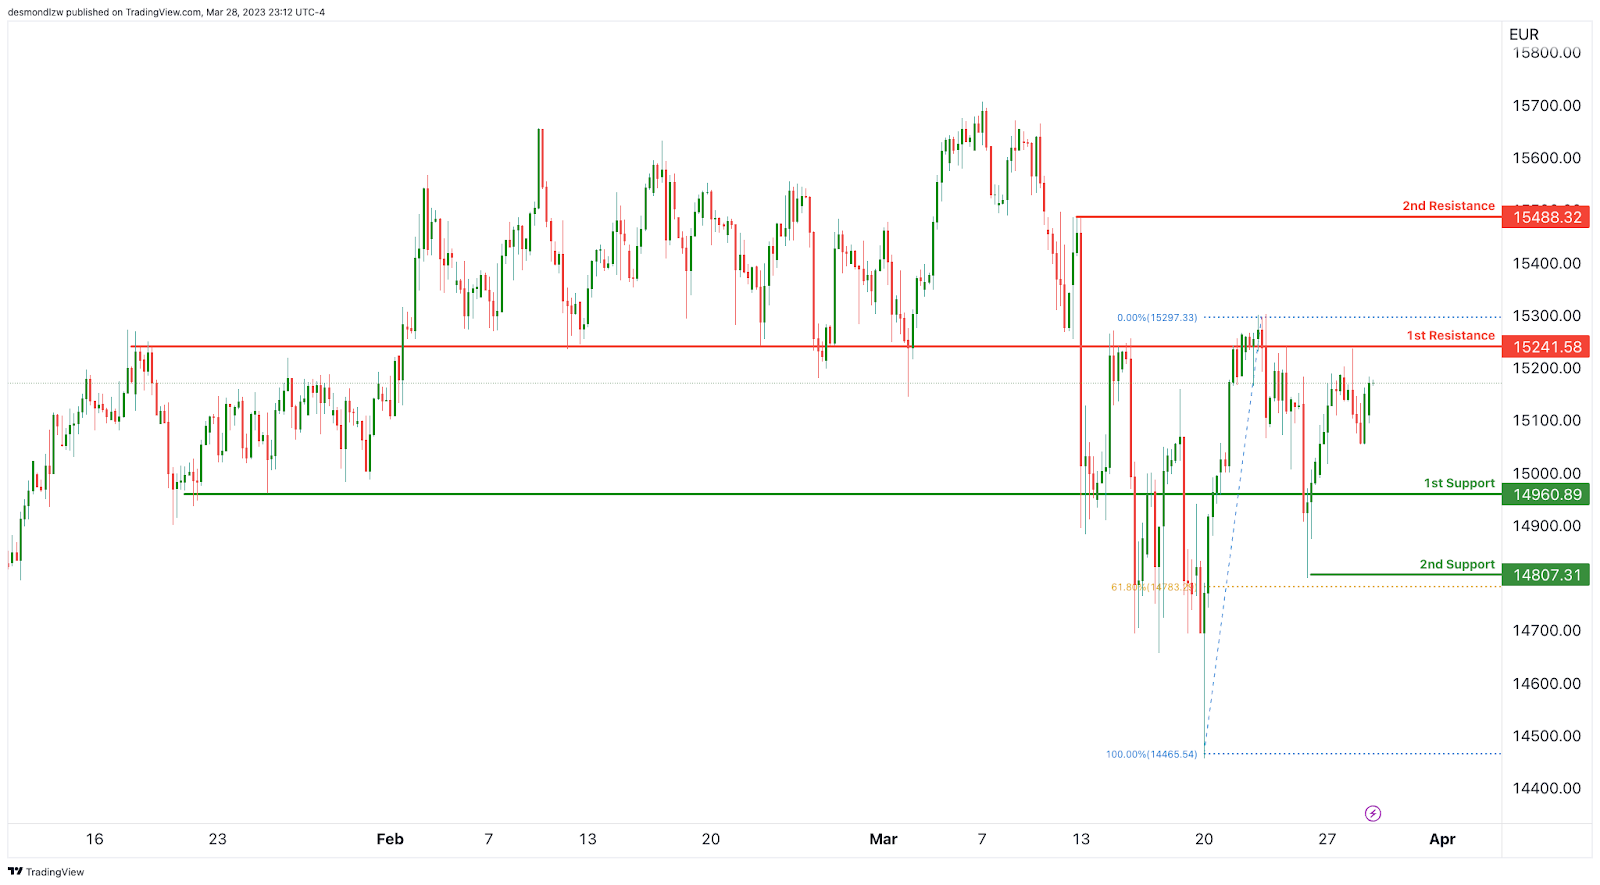
Overall, the momentum of the GER30 chart is bullish, as price is currently above the bullish Ichimoku cloud. This suggests that there is good support in place, contributing to the bullish momentum.
Price could potentially make a bullish continuation towards the first resistance level. However, it’s important to note that the overall momentum of the chart is always subject to change.
The first support level is located at 14960.89, which is an overlap support level. If the price falls towards this level, it is likely to find support and bounce back up. The second support level is at 14807.31, which is another overlap support level and coincides with the 61.80% Fibonacci retracement level. This support level may also provide a good buying opportunity.
On the other hand, the first resistance level is at 15241.58, which is an overlap resistance level. If the price rises towards this level, it is likely to face some selling pressure. The second resistance level is at 15488.32, which is also an overlap resistance level. If the price manages to break above this level, it could signal a strong bullish momentum and potential buying opportunity.
In summary, the overall momentum of the GER30 chart is bullish, and the price could potentially make a bullish continuation towards the first resistance level. The first and second support levels are at 14960.89 and 14807.31, respectively, while the first and second resistance levels are at 15241.58 and 15488.32, respectively. These levels are important to keep an eye on for potential buying or selling opportunities.
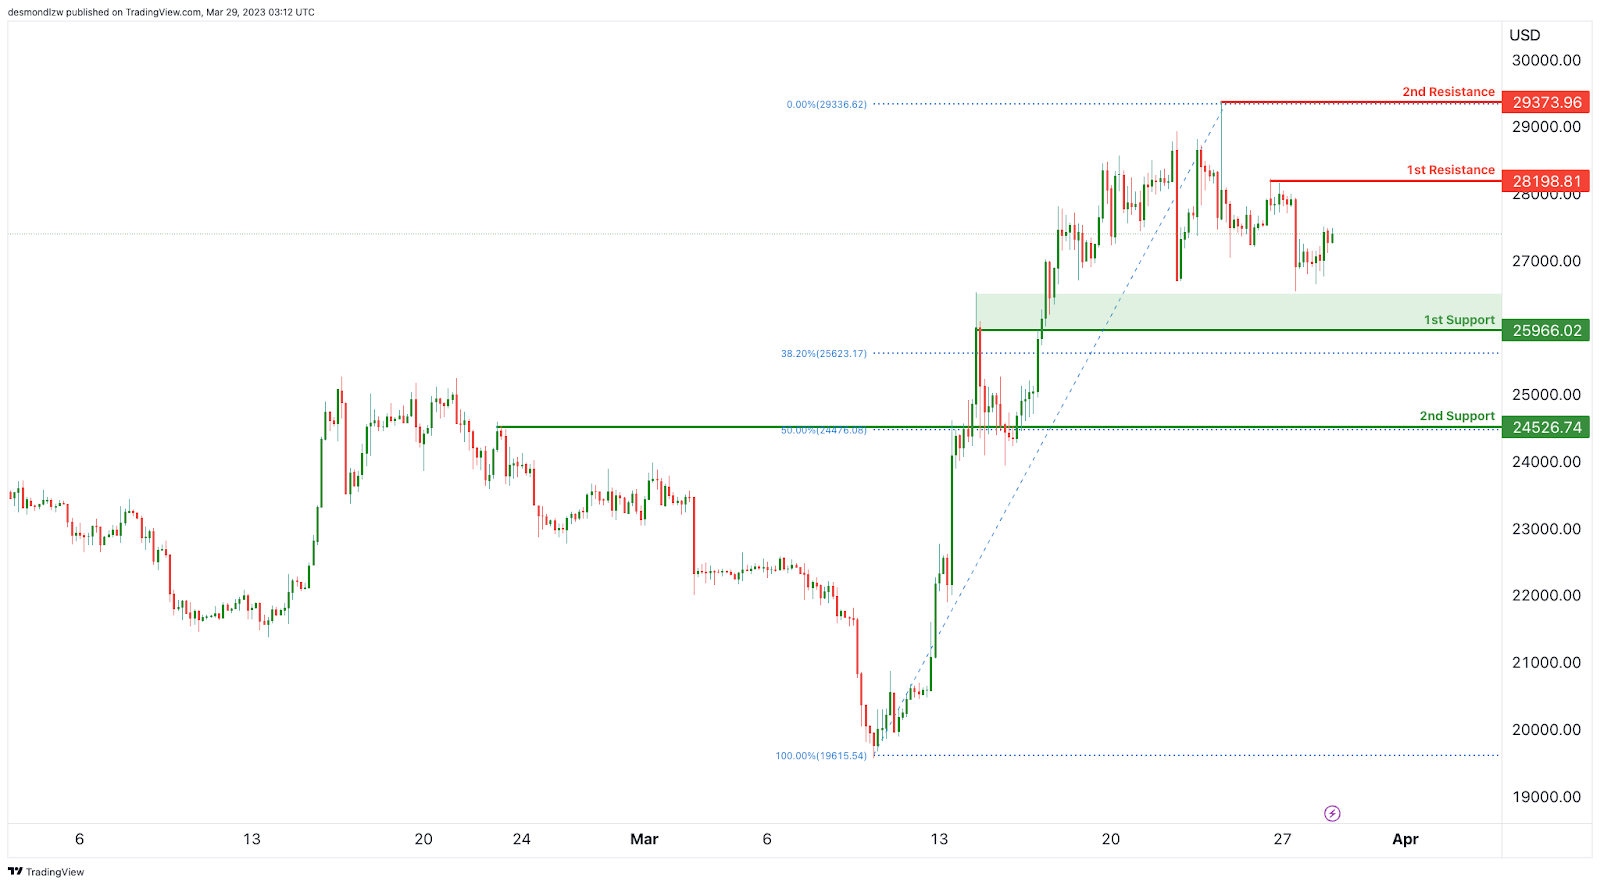
BTC/USD:
According to our analysis, BTCUSD could potentially make a bearish continuation towards the first support level at 25966.02. This support level is a significant area of interest as it coincides with the 38.20% Fibonacci retracement level, making it a strong support level. The second support level is at 24526.74 and is also an overlap support level and coincides with the 50% Fibonacci retracement level.
On the resistance side, the first resistance level is at 28198.81, which is also an overlap resistance level. The second resistance level is at 29373.96, which is a swing high resistance level.
It is worth noting that due to the high volatility in the cryptocurrency market, these support and resistance levels can quickly become invalid. Traders and investors should always use appropriate risk management strategies, such as stop-loss orders, when trading or investing in cryptocurrencies.
In conclusion, the BTCUSD chart’s overall momentum is bearish, and prices could potentially drop towards the first support level at 25966.02 or the second support level at 24526.74. Traders and investors should keep a close eye on price action and adjust their positions accordingly.
US500
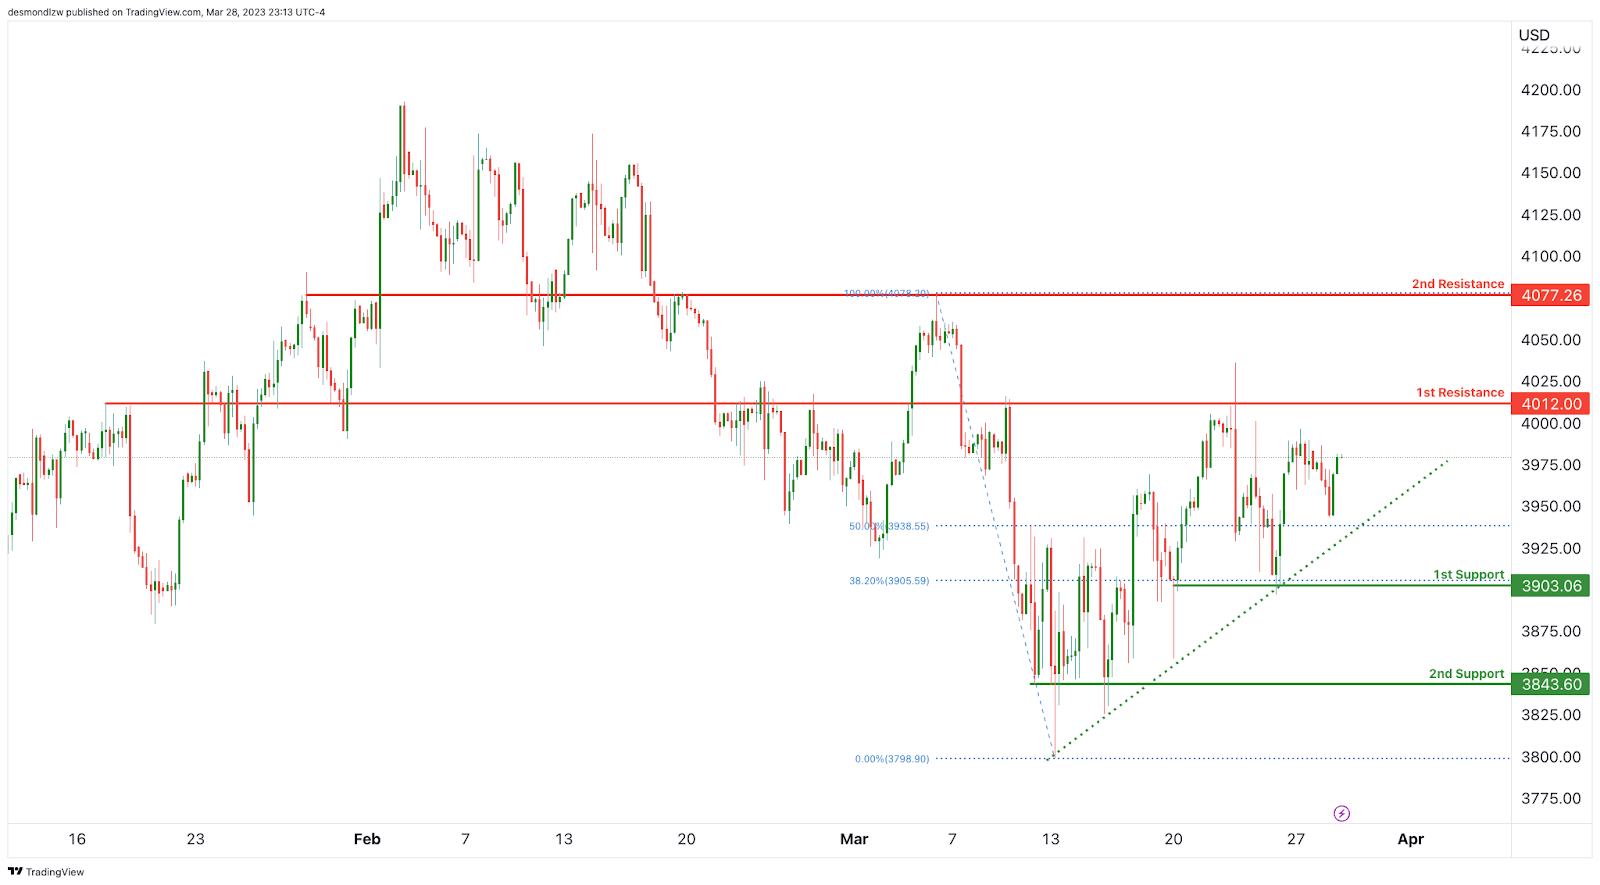
The US500 index is showing bullish momentum overall, with price currently trading above the bullish Ichimoku cloud. This suggests that there is good support in place. In the short-term, price could potentially continue its bullish momentum towards the first resistance level.
The first support level is at 3903.06 and is a good level of support due to it being an overlap support and a 38.20% Fibonacci retracement. A break below this level could signal a shift in momentum to bearish.
The second support level is at 3843.60 and is also a good level of support due to it being an overlap support. If price were to drop to this level, it could potentially be a good buying opportunity for traders.
The first resistance level is at 4012.00 and is a good level of resistance due to it being an overlap resistance. A break above this level could signal further bullish momentum.
The second resistance level is at 4077.26 and is also a good level of resistance due to it being an overlap resistance. This level could potentially act as a strong barrier for price to break through.
Overall, traders should keep an eye on the support and resistance levels mentioned above, as they could play important roles in determining the short-term direction of the US500 index.
ETH/USD:
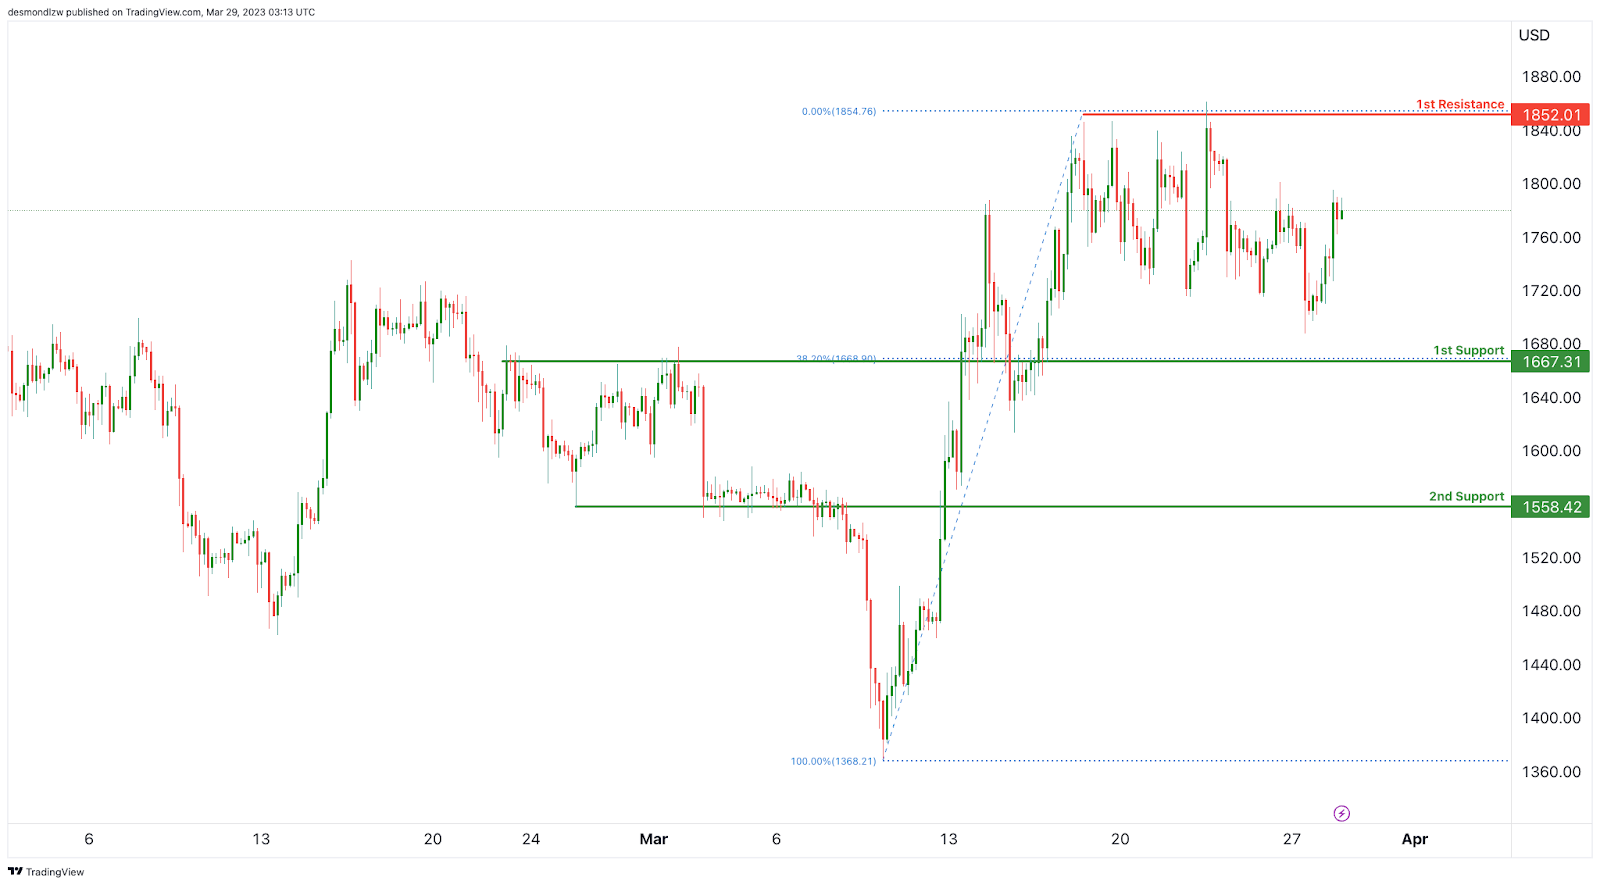
As the overall momentum of the chart for ETHUSD is bullish, with price being above the bullish Ichimoku cloud, we could potentially see a bullish continuation towards the first resistance level.
The first support level is at 1667.31, which is a strong level of support as it coincides with the 38.20% Fibonacci retracement level. The second support level is at 1558.42, which is also an overlap support level.
On the other hand, the first resistance level is at 1852.01, which is a strong level of resistance as it is an overlap resistance level. Therefore, if price manages to break through this resistance level, we may see further bullish momentum towards higher price levels.
WTI/USD:
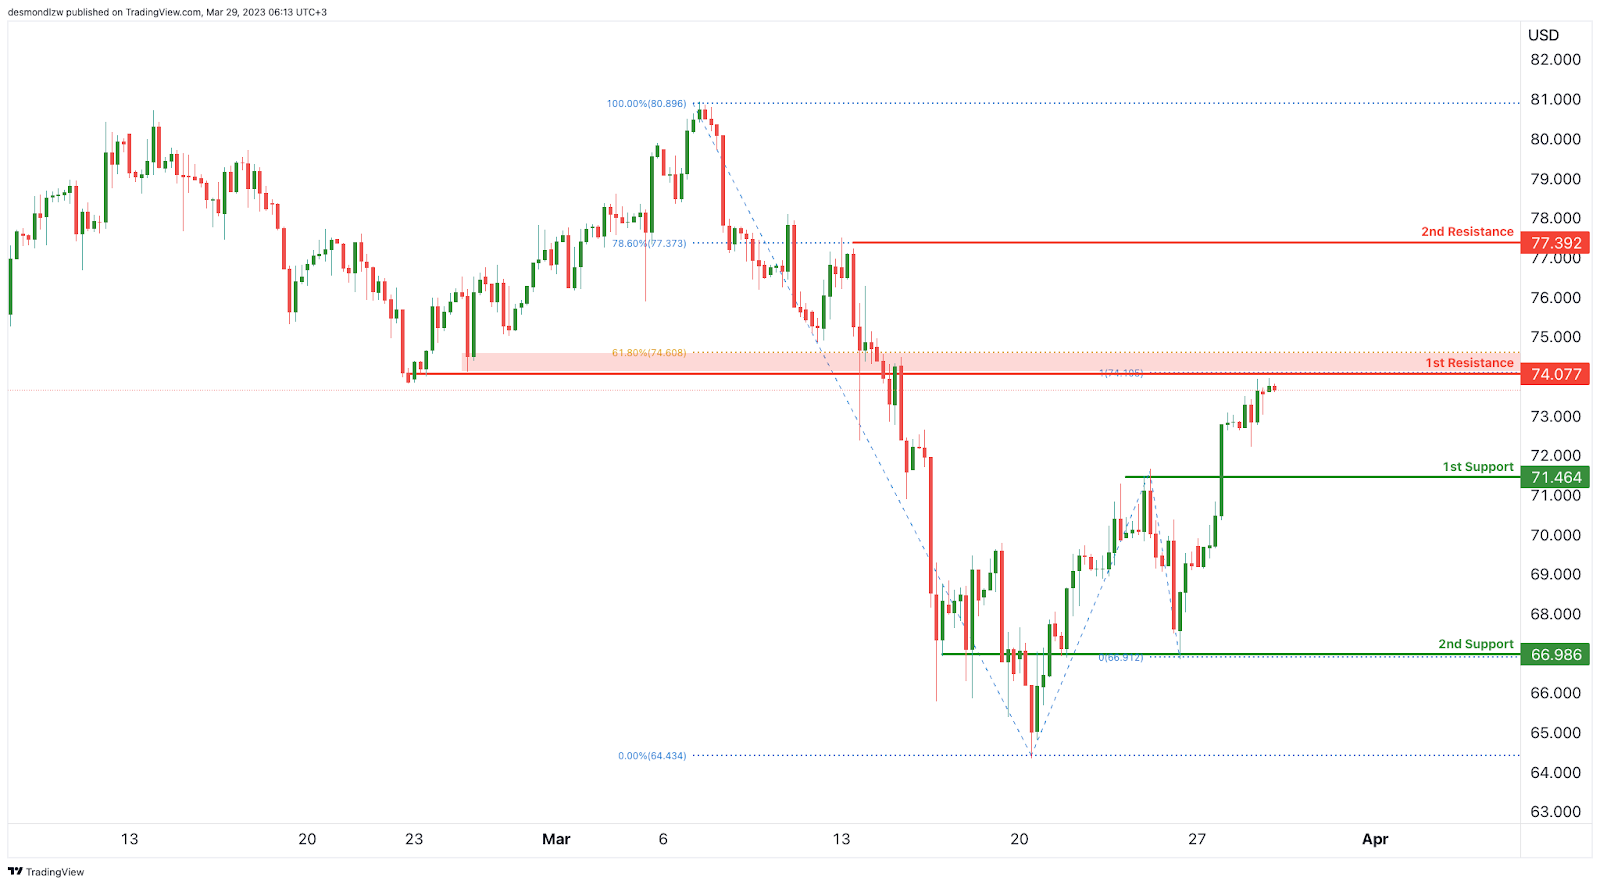
WTI crude oil has been in a weak bullish trend, with low confidence. However, in the short term, price could potentially make a bearish reaction off the first resistance level, dropping towards the first support. The first support is located at 71.464, which is an overlap support.
If the price breaks below this level, it could continue to fall towards the second support level, located at 66.986, which is also an overlap support level.
On the other hand, if price manages to break above the first resistance level, located at 74.077, which is an overlap resistance and the 61.80% Fibonacci retracement level, it could potentially reach the second resistance level at 77.392, which is another overlap resistance level.
Overall, the current market conditions suggest that traders should be cautious and keep an eye on the key support and resistance levels mentioned above. The weak bearish momentum indicates that there may be a potential for a bearish reaction at resistance, but traders should wait for confirmation before entering any trades.
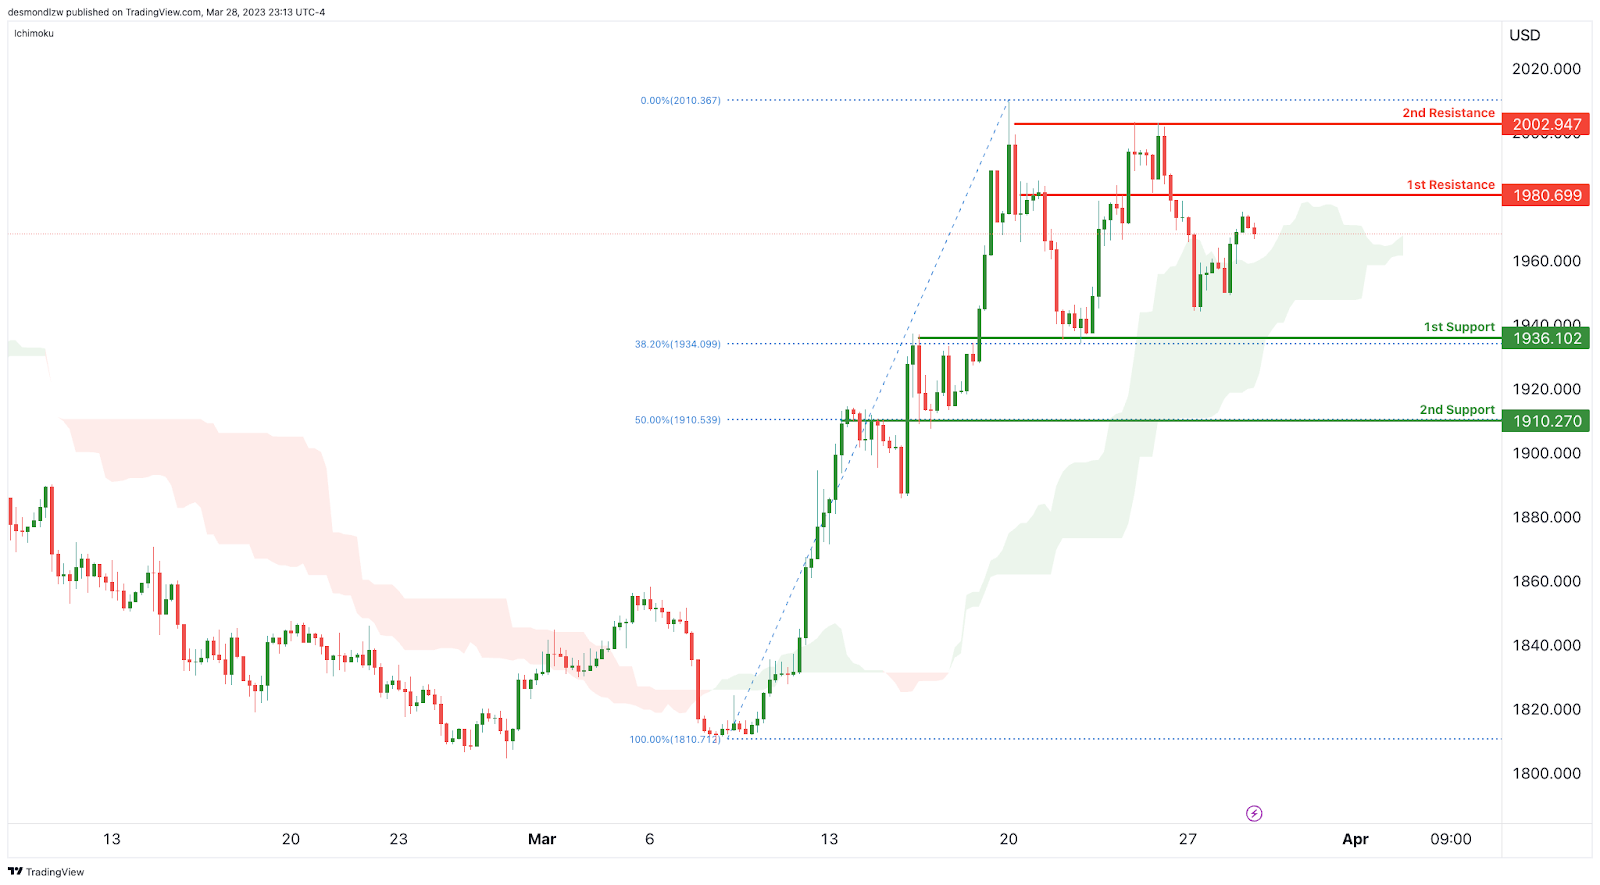
XAU/USD (GOLD):
Gold prices have been exhibiting bullish momentum, supported by the fact that price is currently above the bullish Ichimoku cloud. In the near term, prices could potentially continue to rise towards the first resistance level.
The first support level is at 1936.102, which is an overlap support and a 38.20% Fibonacci retracement level. A breach below this level could lead to a further decline towards the second support level at 1910.270, which is also an overlap support and a 50% Fibonacci retracement level.
On the upside, the first resistance level is at 1980.699, which is an overlap resistance. A break above this level could lead to a further rise towards the second resistance level at 2002.947, which is also an overlap resistance.
Traders should keep an eye on price movements near these key levels to determine potential trading opportunities. A break above the resistance levels could signal a continuation of the bullish trend, while a break below the support levels could signal a reversal towards a bearish trend.
Australia February Monthly CPI Indicator
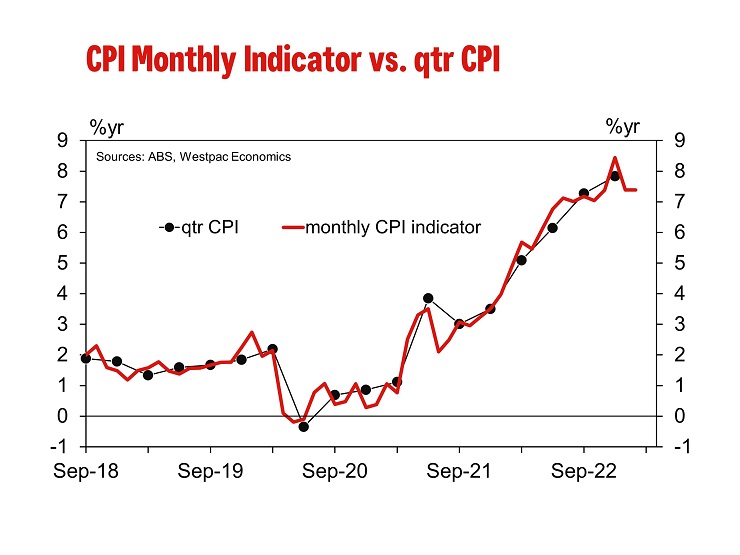
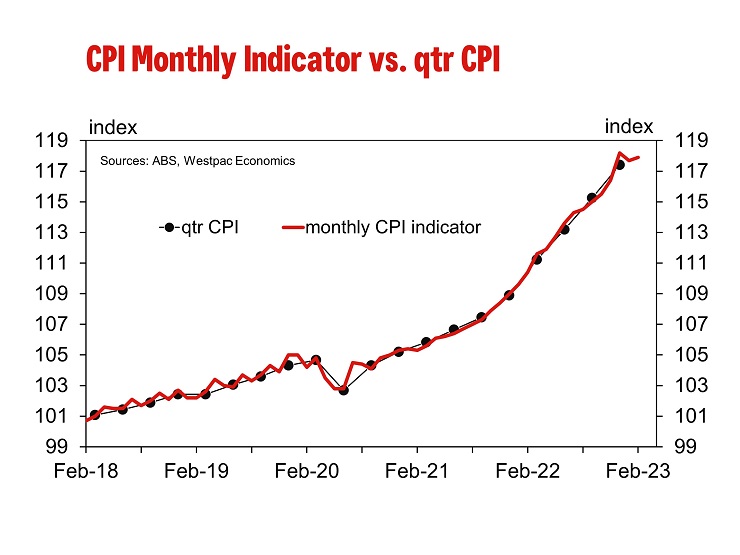
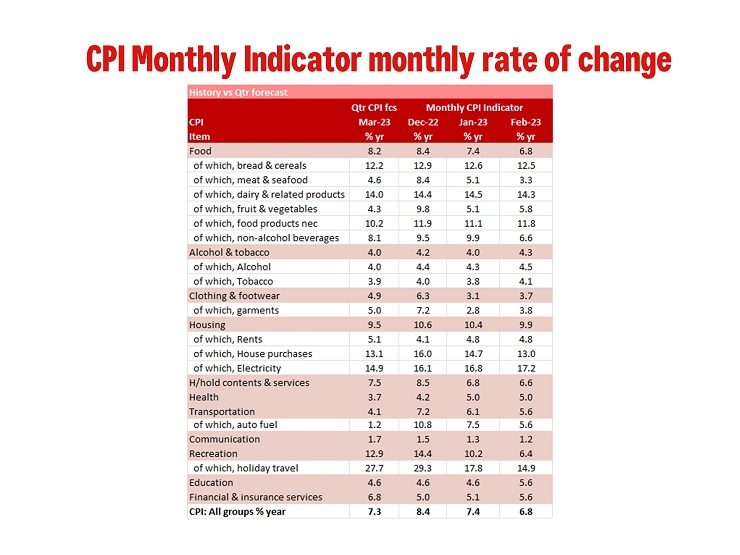
The Monthly CPI Indicator rose 6.8% in the year to February compared to Westpac’s 7.4%yr forecast and the market’s 7.2%yr. This represents a meaningful downside risk to our March CPI forecast of 1.5%qtr.
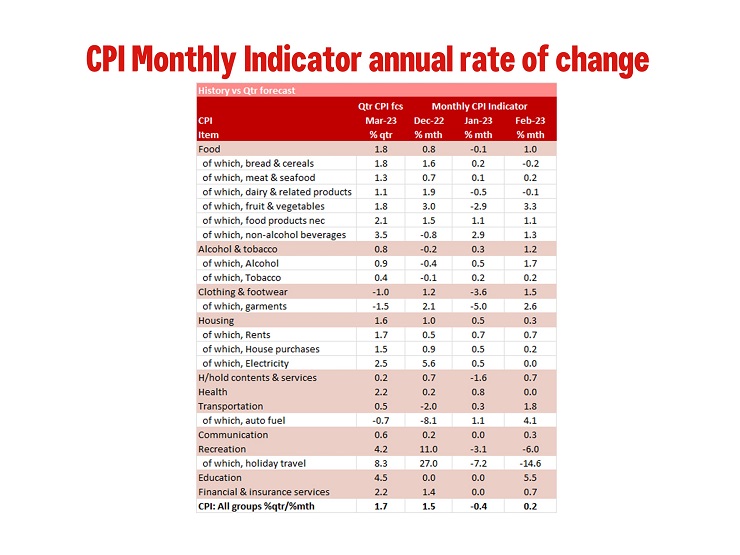
In finer detail the index rose just 0.2% in February compared to our 0.8% forecast; we assume the market median would have been around 0.6% given the 7.2%yr forecast. Compared to the average monthly increase of 0.9%mth through the last three months of 2022 the first two prints of 2023 represent a meaningful moderation in the inflationary pace; -0.4% in January and 0.2% in February.
The Monthly CPI Indicator can be very volatile month to month as it is not a true monthly index but rather the released of data from the quarterly CPI as it becomes available. This volatility is due to the timing of the various price surveys. This may be why the ABS references the annual pace of growth and not the monthly change.
Combined the January and February Monthly Indicators represent a significant downside risk to our current forecast for 1.5%qtr increase in the March quarter CPI. To achieve that forecast the Monthly CPI Indicator would need to increase by around 1.5% to 1.6% in March.
The most significant contributions to the annual rise in February: housing (9.9%yr), food & non-alcoholic beverages (8.0%yr), transport (5.6%yr) and recreation & culture (6.4%yr).
The ABS noted that the annual increase for the housing group in February (+9.9) was lower than January (10.4%). New dwellings grew 13.0%yr to February which is the slowest annual growth since February 2022 as price inflation for building materials continue to ease along with a the moderation in demand. Rents rose again due to the tight rental market, maintaining a 4.8%yr pace.
In the month housing costs lifted 0.3% on the back of a 0.7% gain in rents, 0.2% gain in new dwellings and flat electricity prices. The ABS is continuing to improve the monthly CPI indicator and each month it seems to add a new series. In February it was electricity with this series showing electricity prices up 17.2%yr. The ABS notes that the full impact of annual price reviews in July 2022 took time to flow through to many households as electricity rebates reduced electricity bills in WA, ACT, Qld and Tasmania between July and December last year.
Automotive fuel prices rose 5.6%yr, down from January’s 7.5%yr. While fuel prices drove the increase in transport, annual inflation for fuel is the lowest it has been in two years. In the month transport prices increased 1.8% while fuel prices lifted 4.1%.
The largest downside surprise for us was the 14.6% fall in holiday travel in February. We had been looking for a 6.0% fall in the month. This doubled the size of the fall in recreation & culture from our forecast 3.1%mth decline to -6.0%. While we do expect something of a reversal in March history tells us we should not expect it to make up for the 9% fall in recreation & culture in the first two months of 2023.
We are processing the Monthly CPI Indicator data to incorporate it into a complete Q1 CPI preview. Our current published inflation forecast for Q1 are 1.5%qtr/7.2%yr for the CPI and 1.3%qtr/6.6%yr for the Trimmed Mean. For now, we can state the January and February Monthly CPI Indicator results presents a meaningful downside risk to that forecast.