

Sample Category Title
Dollar Remains in Defensive, Even Against Yen
Markets
Yesterday, financial stress that dominated investor positioning going into the weekend, gradually subsided. Markets apparently err to the view that issues at some US regional banks still should be considered as idiosyncratic and that authorities have enough tools to prevent those individual cases to affect the global system in profound way. Such a scenario allows central bankers to continue to give inflation the focus it needs in their policy mix. Eco data were few, with the German Ifo business confidence the exception to the rule. The headline index improved more than expected (93.3 from 91.1) supported by better than expected readings for both the current assessment and expectations. The direct impact on trading was modest. Even so, it confirmed the message from the PMI’s that the European/German recovery remains on track. In a brother risk-on repositioning, US yields rebounded between 22.9 bps (2-y) and 11.7 bps (10-y). Despite intra-day cheapening, the $42 bln 2-y Treasury auction only received mediocre investor interest. The rise in yields was mainly driven by higher real yields (10-y +11 bps). Markets now again see about a 50/50 chance for one additional Fed rate hike in May and have reduced Fed rate cut expectations by about 25 bps for early next year. German yields showed a similar move, albeit more modest, with yields rising between 12.8 bps (2-y) and 9 bps (30-y). The Euro Stoxx 50 closed 0.82% higher. In the US the Dow gained 0.60% but the Nasdaq ceded 0.47%. Higher real yields apparently complicate the rebound of growth stocks. The dollar also didn’t profit from higher real yields as broader risk sentiment also dominated FX trading. DXY dropped back below the 103 handle. In a protracted intraday uptrend EUR/USD closed near 1.08. The yen underperformed with USD/JPY closing at 131.57. Sterling also held up well, with EUR/GBP still attacking 0.88 big figure (close 0.8788).
This morning, Asian equity markets mostly show modest gains. US yields ease about 1-2 bps. The dollar remains in the defensive, even against the yen (DXY 102.65, USD/JPY 130.7). Later today, the eco calendar contains country confidence data in Europe and consumer confidence (Conf. Board) in the US. A modest decline from 102.9 to 101 is expected. We don’t expect a profound impact on trading. Markets might be slightly more sensitive to a negative than a positive surprise. ECB’s Muller and Vasle are scheduled to speak. In a day-to-day perspective, we expect yesterday’s trends to continue, albeit at a much more modest pace. The US 2-y yield is nearing the 4.0% handle. EUR/USD managed to hold above the 1.0735 support area, suggesting some further gains within the 1.0760/1.0913 short term barriers. Sterling also remains well bid this morning (EUR/GBP 0.878). Overnight, UK BRC shop prices were reported at 8.9%, a record since the start of the series in 2005.
News and views
Hungary ratified Finland’s Nato membership yesterday. The country together with Turkey have long opposed Finland’s bid (and still do in case of Sweden), with some calling it a game of blackmail over the EU blocking funds. But after Turkey dropped resistance about two weeks ago, Hungary followed soon thereafter. PM Orban’s U-turn is seen as a latest sign of pivoting to the west, away from Russia. Economic benefits of that relationship are fading with many companies contemplating an exit out of the country.
The European Commission delayed the payout of €19bn pandemic recovery funds to Italy by at least one month. There is skepticism about Italy reaching preset targets that are required to unlock the aid. The Commission will double-check in particular progress on the licensing of port activities, on district heating and on two urban renewal projects. Of the €192bn Italy is to receive, some €67bn has already been distributed. But red tape is slowing down authorization processes, leaving Italy struggling to allocate and spend the money as quickly as originally planned.
New research by the World Bank showed that the global economy risks suffering a lost decade of growth. The pandemic and the Russian invasion were said to create lasting damage to economic performance and reduce growth rates for the rest of this decade by a third, from 2.6% between 2011 and 2021 to 2.2%. In the first 10 years of this century, growth was 3.5%. The World Bank cited huge uncertainties and reduced investments (about half compared to the previous two decades). The slowdown in global prospects could be much sharper in case another financial crisis would cause a global recession, it added referring to the turmoil in financial markets over the past weeks.
Bank Stocks Rebound, Gold and Bitcoin Fall
Recovery in bank stocks improved market sentiment on Monday.
In Germany, Deutsche Bank shares gained more than 6%.
In the US, First Citizens BancShares jumped more than 50% after agreement to absorb the remains of the Silicon Valley Bank (SVB). Meanwhile, the First Republic Bank recovered nearly 12% yesterday.
Calm, and rally in bank stocks yesterday stabilized the market mood. Gold tipped a toe below $1950 per ounce, while the US 2-year yield flirted with the 4% mark – on bet that if the bank crisis is over, we could go back to our lives and worrying about inflation, again.
The S&P500 closed 0.17% up, while the rate-sensitive Nasdaq fell 0.74%.
Of course, if the banking stress further eases, we should see sovereign yields recover a part of the recent retreat.
Yet, the pricing of recession is now in play, and should keep the upside limited at below the pre-SVB levels, when the Federal Reserve (Fed) was expected to hike the rates all the way up to around 5.5%.
This is no longer the expectation.
That’s why the equity markets, which have been relatively resilient to the bank stress – partly due to higher liquidity injected in the market to deal with it, remain vulnerable as earnings estimates will more likely than not revised lower in the foreseeable future.
Bitcoin narrative shifts from safe-haven on bank stress to shaky on Binance stress
Bitcoin fell sharply to below $27K per coin on news that Binance and its CEO were sued by CFTC for allegedly failing to properly register. The firm is said to have allowed its clients to trade derivates since at least 2021, and these derivatives are not subject to American jurisdiction, and that Binance should’ve registered with the agency years ago, and that they continue to violate CFTC’s rules.
The news doesn’t call for the end of Binance, the world’s biggest crypto exchange, but it could well cool appetite for safe haven flows to Bitcoin – which came along with the bank crisis, reminding crypto investors that cryptocurrency exchanges are not necessarily safer than a bank.
FX and energy
The US dollar index remains under the pressure of softer US yields as mounting recession worries keep the hawkish Fed expectations at bay.
The EURUSD has so far managed to rebound from a critical 50-DMA, near 1.0725, even though Mario Centeno, a member of the European Central Bank’s (ECB) Governing Council said that the bank must consider recent financial-market stress when taking decisions on interest rates - an idea that Lagarde simply rejected at her latest press conference saying that the ECB has other tools in hand to deal with a potential stress concerning the banks and liquidity. The door for a further rise to $1.10 remains open for the euro bulls.
In energy, improved sentiment in banks and a legal dispute that halted around 400,000 barrels a day of oil exports from the Ceyhan port in Turkey pushed the barrel of US crude past the $70pb yesterday. The price of a barrel flirted with the $73 level.
Yet, the mounting recession odds and the resilient Russian supply, which partly absorbs the rising oil demand from China, are expected to keep the topside limited into the $75/77 area, where stand the 50 and the 100-DMA respectively.
Yields Rebound
Market movers today
It is a quiet day on the macro data front although the US Conference Board's Consumer Confidence index will be released for March. Consensus is looking for a modest decline in line with the University of Michigan survey released earlier.
ECB's Lagarde and BoE's Bailey will give speeches today, while the Fed's Barr testifies before the US Senate on bank oversight.
The National Bank of Hungary has a monetary policy meeting, consensus expects unchanged policy rate. In Sweden, FSA publishes its yearly Mortgage report (08:00 CET).
In Sweden, FSA publishes its yearly Mortgage report (08:00 CET).
The 60 second overview
Market recap: The beginning of the week has been characterised by relief in equity markets and a rebound in both nominal and real yields as markets have priced back in a higher likelihood of more global rate hikes to come. "No news is good news" remains the mantra for the European bank sector but general risk appetite was also aided by positive bank news on the other side of the Atlantic. Also the start to the week has been characterised by a weaker USD, a rise oil prices and a setback to indicators on global USD funding pressures.
First Citizens Bank. Yesterday, it was announced that First Citizens BankcShares has agreed to buy the majority of Silicon Valley Bank (SVB) assets which brings the acquirer to the top 15 list of the biggest US banks - up from a 30th spot by the end of 2022. The US Federal Deposit Insurance Corporation will still maintain a portion of SVB-assets. First Citizen stocks rose by more than 50% upon announcement. Adding to positive US banking news, Bloomberg reported over the weekend that the US authorities are contemplating expanding an emergency lending facility to struggling banks.
Central bank pricing. Following the improved risk appetite global yields moved higher yesterday with markets notably pricing in a higher likelihood of additional rate hikes from the Fed and the ECB. Markets are now pricing around 10bp worth of hikes from the Fed at the May meeting - yet the USD rate curve still embeds an accumulative 70bp worth of cuts by year-end. We still expect the Fed to hike policy rates by an additional 25bp in May and thereafter to keep policy rates unchanged until at least early 2024.
In terms of the ECB markets are now pricing around 45bp worth of additional hikes until summer and roughly 7bp worth of cuts by December. This remains more than 50bp worth of hikes short of our house call on the ECB although we humbly acknowledge that much will come down to credit growth indicators in the coming months as these will shed light on the full impact of recent bank jitters.
Israeli demonstrations. Following heavy demonstrations Israeli Prime Minister Benjamin Netanyahu has decided to delay a bill on political dominance in the appointment of judges. The bill has received heavy opposition which has brought Israel to a virtual standstill.
Hungary. Yesterday a majority of the Hungarian Parliament voted in favour of Finland joining NATO. The decision follows Turkey's decision to approve Finland's bid. Among political commentators Hungary's previous opposition to a Finish membership was seen as an attempt to pressure the EU but also that this ratification is yet another sign that Prime Minister Victor Orbán is gradually turning his back to Moscow.
Equities: Global equities rose yesterday as the weekend had passed without any bank closure and just as importantly, it was a very quiet Monday from a bank news perspective. First Citiczens bought part of SVB, but that kind of news is in the positive camp as it strengthens the confidence around SVB being an idiosyncratic event. On top of this we got looser financial conditions, higher short-term yields, lover bond vol and banks together with value outperforming. In other words, Monday looked a bit like how we expect the coming months to be. In US Dow +0.6%, S&P 500 +0.2%, Nasdaq -0.5% and Russell 2000 +1.1%. Asian markets are mixed this morning while US and European futures are higher.
Credit: Yesterday, credit markets were relatively calm and traded slightly tighter with both CDS indices closing lower with iTraxx Main (-1.1bp) at 96.1bp, and iTraxx Crossover (-5.9bp) at 489.8bp. The primary Eurobond market is coming off to a busy start with 4 borrowers raising debt where Engie SA, Renault SA, Wolters Kluwer NV, and Canadian Imperial Bank of Commerce (Covered bond) were among the largest announced deals. Including the primary US market, 14 issuers were active, making the day the busiest since the SVB collapse. Bloomberg reports that borrowers are seeking funding based on declining volatility, lower rates, and are active in advance of first-quarter earnings blackouts.
FI: Global rates sold-off significantly in the absence of market moving news, which in light of the turmoil in recent weeks also means focus is turning back to the macro narrative. The sell-off was yet again driven by the front end, with 2y Germany 13bp higher on the day. German ASW spreads tightening from the start to 74bp, which is in the lower end in recent turmoil.
FX: It has been a fairly quiet start to the week for FX markets. Despite the relief risk-on sentiment in yesterday's session it was still very limited to what extent the traditional risk-on currencies gained - some of which, like NOK, even ended the session among the underperformers. EUR/USD crept slightly higher to the 1.08 level but remains below the spot levels prior to Friday's sell-off. Both EUR/SEK and EUR/GBP edged marginally lower while USD/JPY has moved back above the 131 mark on the rebound in yields.
USD/CAD Daily Outlook
Daily Pivots: (S1) 1.3625; (P) 1.3685; (R1) 1.3720; More....
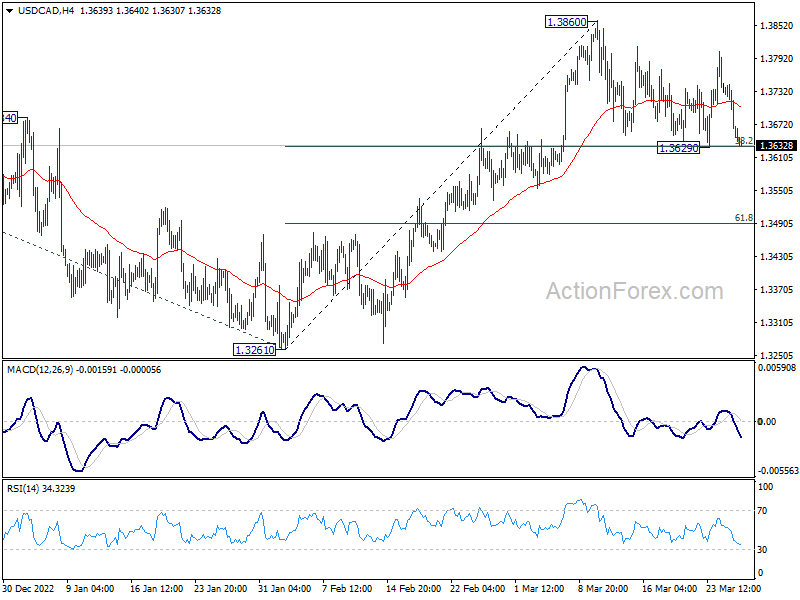
Intraday bias in USD/CAD stays neutral at this point. Further rally is expected as long as 1.3629 support holds. Firm break of 1.3860 will target 1.3976 high. However, break of 1.3629 will mix up the near term outlook. Intraday bias will be back on the downside for 55 day EMA (now at 1.3586), or even further to 61.8% retracement of 1.3261 to 1.3860 at 1.3490.
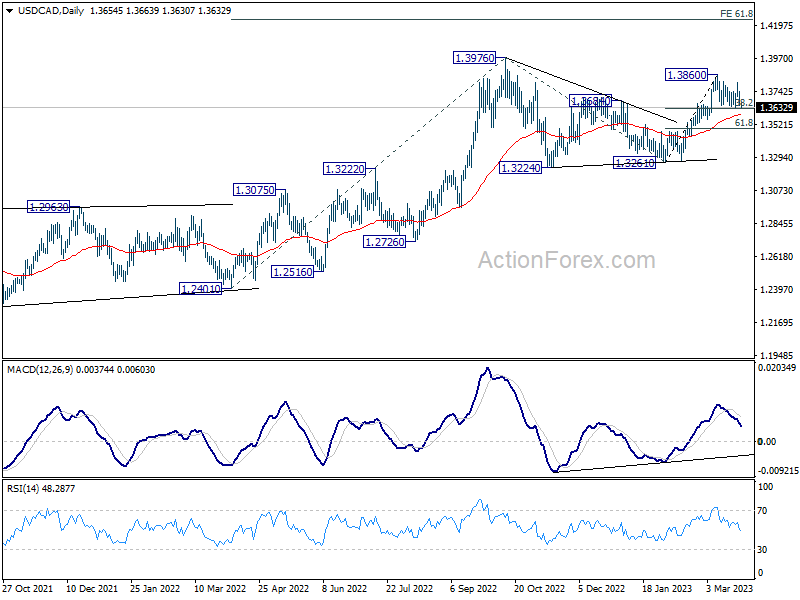
In the bigger picture, the up trend from 1.2005 (2021 low) is still in progress. Break of 1.3976 will confirm resumption and target 61.8% projection of 1.2401 to 1.3976 from 1.3261 at 1.4234. Firm break there will pave the way to long term resistance zone at 1.4667/89 (2016, 2020 highs). On the downside, break of 1.3261 support is needed to confirm medium term topping. Otherwise, outlook will remain bullish even in case of deep pull back.
Forex Markets Grapple with Uncertainty and Ambiguity, Sterling Ready for Breakout?
Forex markets are currently navigating a landscape of uncertainty, as mixed currency performance contributes to a lack of clear direction. Dollar has experienced a decline in Asian session, but still hovers within familiar boundaries against other major currencies. Meanwhile, Euro has managed to strengthen against the greenback but appears less robust in other pairs.
Yen, on the other hand, has emerged as a strong contender for the day, recouping some of its yesterday's pullback. In addition, Sterling has found firmer footing after BoE Governor Andrew Bailey's remarks indicated that the Monetary Policy Committee can concentrate on inflation while the Financial Policy Committee maintains financial stability. Interestingly, Australian Dollar has managed to hold its ground despite disappointing retail sales data.
Looking ahead, the market may experience subdued trading due to a relatively light economic calendar. However, the upcoming release of US consumer confidence data could introduce an element of volatility, as traders and investors alike look for potential opportunities in the midst of uncertainty.
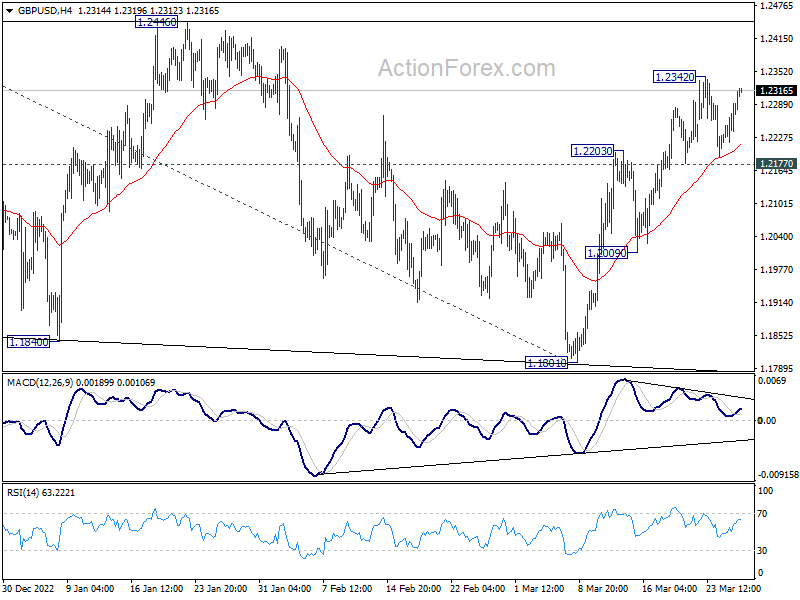
Technically, GBP/USD could now be eyeing 1.2342 temporary top with this week's rebound. Break there will resume the near term rally to 1.2445/6 resistance zone. Decisive break there will resume larger up trend from 1.0351 (2022 low) to 1.2759 fibonacci level. Let's see if the Pound has enough buying to back the breakout.
In Asia, at the time of writing, Nikkei is up 0.15%. Hong Kong HSI is up 1.37%. China Shanghai SSE is up 0.18%. Singapore Strait Times is up 0.73%. Japan 10-year JGB yield is up 0.0220 at 0.317. Overnight DOW rose 0.60%. S&P 500 rose 0.16%. NASDAQ dropped -0.47%. 10-year yield rose 0.148 to 3.528.
Fed Jefferson on balancing inflation and economic stability
Fed Philip Jefferson stated yesterday that the current inflation rate is too high, emphasizing the FOMC's goal to reduce it to 2% as quickly as possible. Speaking at Washington and Lee University in Lexington, Virginia, he acknowledged that the process may take some time due to persistent inflation components such as services excluding housing.
Jefferson said, "I would like to say that inflation will return to 2% soon, but we have to do it in a way that does not damage the economy any more than is necessary. That's what we are trying to do." Fed is grappling with the challenge of ensuring price stability amid high inflation while also maintaining financial stability in the wake of the second-largest bank failure in US history.
In his speech, Jefferson also noted that although inflation has begun to decline, it remains unclear whether this decrease is due to higher interest rates, easing pandemic-induced supply strains, or falling energy prices.
He highlighted the uncertainty surrounding the full impact of the Fed's tightening measures, saying, "Monetary policy affects the economy and inflation with long, variable, and highly uncertain lags, and we are still learning about the full effect of our tightening thus far."
Australia retail sales turnover up 0.2% mom in Feb, appeared to have levelled out
Australia retail sales turnover rose 0.2% mom to AUD 35.14B in February, matched expectations. Through the year, retail sales rose 6.4% yoy.
Ben Dorber, ABS head of retail statistics, said retail sales rose modestly in February and appear to have levelled out after a period of increased volatility over November, December and January.
"On average, retail spending has been flat through the end of 2022 and to begin the new year."
Retail turnover rose modestly across most of the states and territories, with rises at 1.0% or less. Queensland recorded the only fall in turnover, down -0.4%.
Looking ahead
BOE will release quarterly bulletin. Later in the day, US will publish goods trade balance, housing index and consumer confidence.
USD/CAD Daily Outlook
Daily Pivots: (S1) 1.3625; (P) 1.3685; (R1) 1.3720; More....
Intraday bias in USD/CAD stays neutral at this point. Further rally is expected as long as 1.3629 support holds. Firm break of 1.3860 will target 1.3976 high. However, break of 1.3629 will mix up the near term outlook. Intraday bias will be back on the downside for 55 day EMA (now at 1.3586), or even further to 61.8% retracement of 1.3261 to 1.3860 at 1.3490.
In the bigger picture, the up trend from 1.2005 (2021 low) is still in progress. Break of 1.3976 will confirm resumption and target 61.8% projection of 1.2401 to 1.3976 from 1.3261 at 1.4234. Firm break there will pave the way to long term resistance zone at 1.4667/89 (2016, 2020 highs). On the downside, break of 1.3261 support is needed to confirm medium term topping. Otherwise, outlook will remain bullish even in case of deep pull back.
Economic Indicators Update
| GMT | Ccy | Events | Actual | Forecast | Previous | Revised |
|---|---|---|---|---|---|---|
| 00:30 | AUD | Retail Sales M/M Feb | 0.20% | 0.40% | 1.90% | 1.80% |
| 11:00 | GBP | BoE Quarterly Bulletin | ||||
| 12:30 | USD | Goods Trade Balance (USD) Feb P | -89.9B | -91.5B | ||
| 12:30 | USD | Wholesale Inventories Feb P | 0.20% | -0.40% | ||
| 13:00 | USD | Housing Price Index M/M Jan | -0.20% | -0.10% | ||
| 13:00 | USD | S&P/CS Composite-20 HPI Y/Y Jan | 4.50% | 4.60% | ||
| 14:00 | USD | Consumer Confidence Mar | 101.7 | 102.9 |
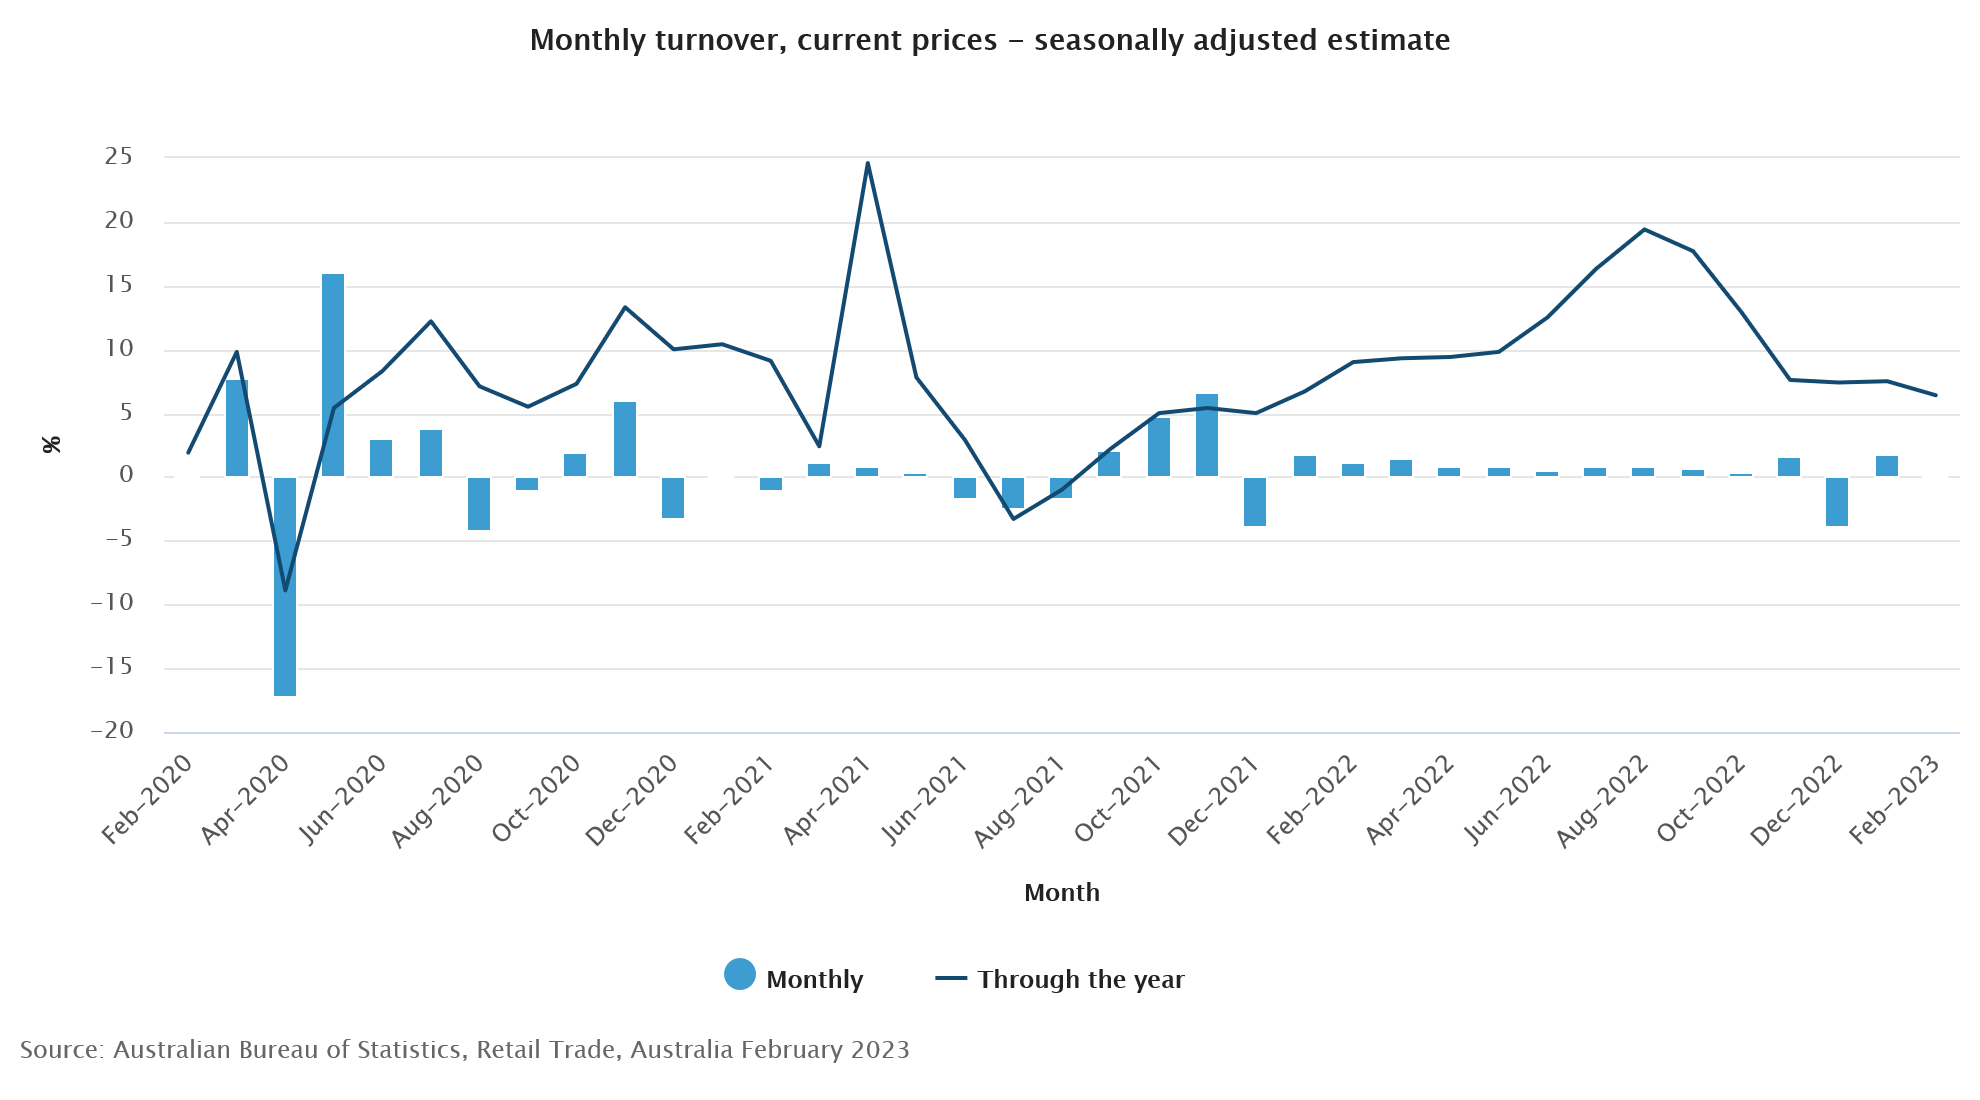
Australia retail sales turnover up 0.2% mom in Feb, appeared to have levelled out
Australia retail sales turnover rose 0.2% mom to AUD 35.14B in February, matched expectations. Through the year, retail sales rose 6.4% yoy.
Ben Dorber, ABS head of retail statistics, said retail sales rose modestly in February and appear to have levelled out after a period of increased volatility over November, December and January.
"On average, retail spending has been flat through the end of 2022 and to begin the new year."
Retail turnover rose modestly across most of the states and territories, with rises at 1.0% or less. Queensland recorded the only fall in turnover, down -0.4%.
Bearish Elliott Wave Sequence in AUDJPY Suggests Further Downside
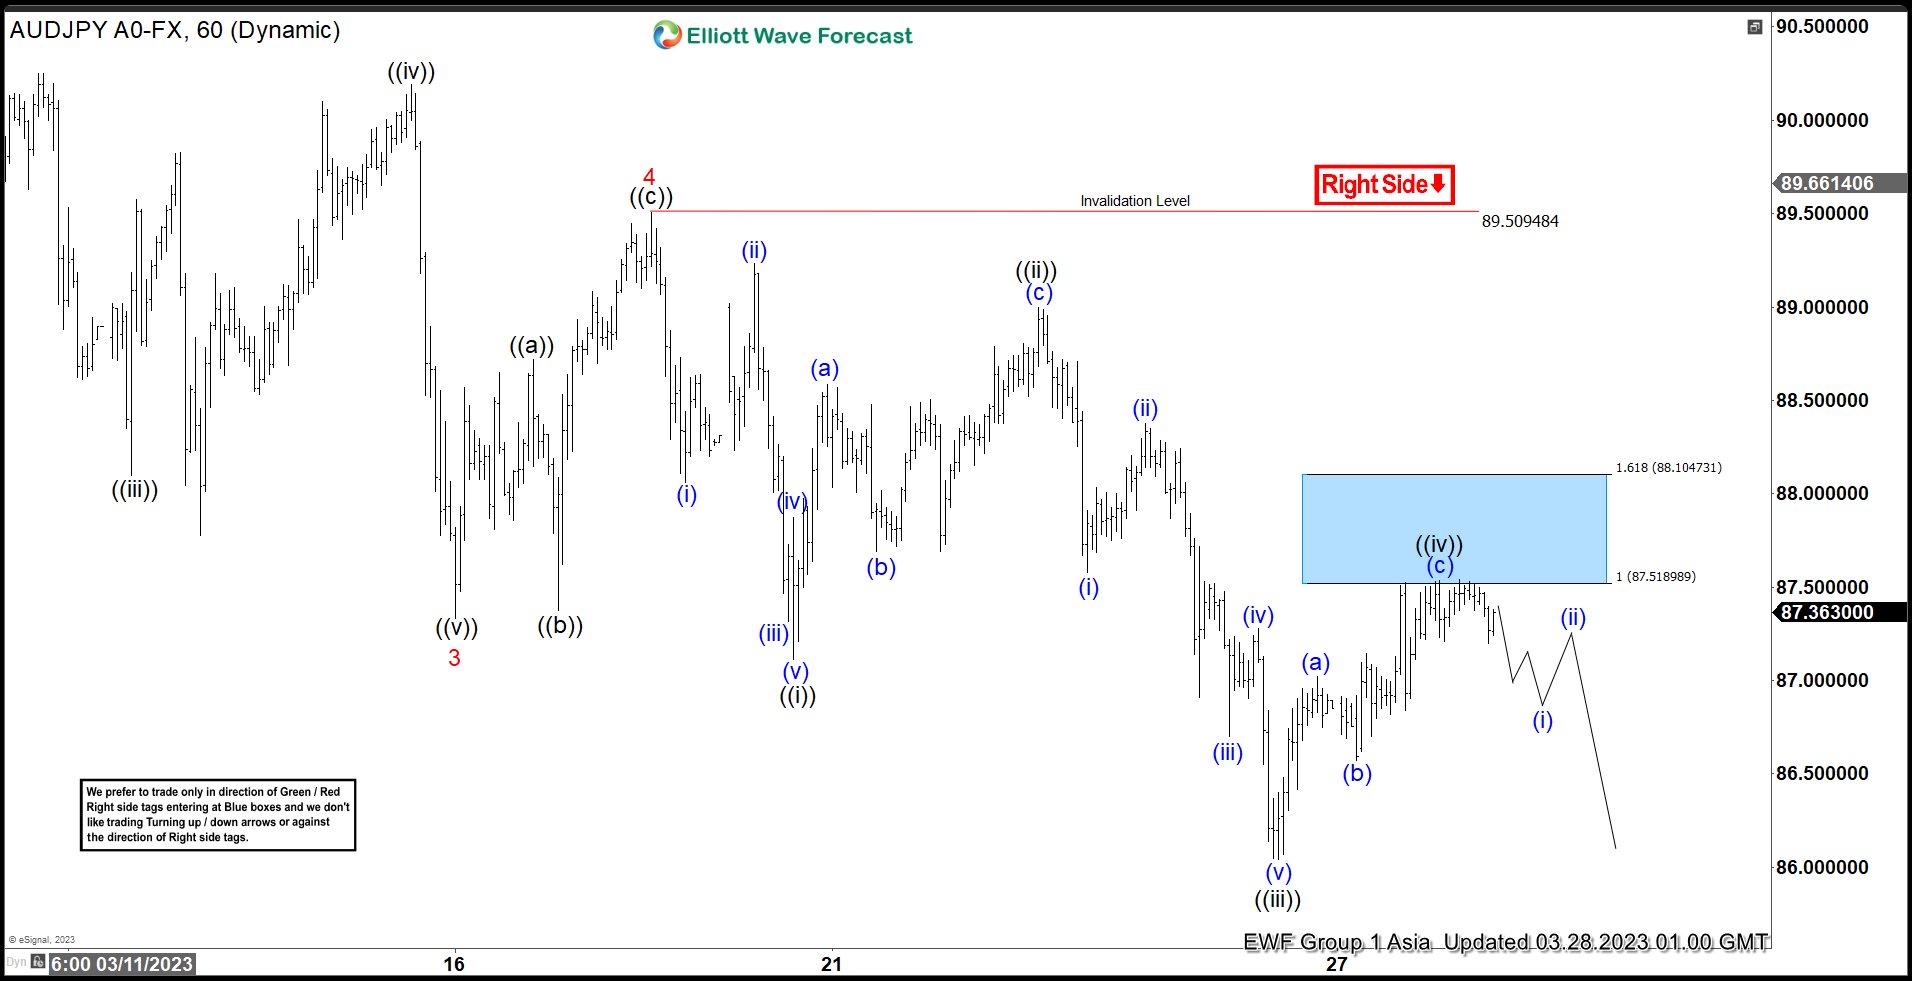
AUDJPY shows a 5 swing bearish sequence from September 2022 peak favoring further downside. Cycle from 2.15.2023 high is currently in progress as a 5 waves impulse Elliott Wave structure. This cycle is mature and expected to end soon. Down from 2.15.2023 high, wave 1 ended at 91.91 and rally in wave 2 ended at 93. Pair then resumes lower again in wave 3 towards 87.33 as the 1 hour chart below shows. Rally in wave 4 ended at 89.509 with internal subdivision as a zigzag structure. Up from wave 3, wave ((a)) ended at 88.719 and wave ((b)) ended at 87.37. Final leg wave ((c)) ended at 89.509 which completed wave 4.
Wave 5 lower is now in progress with subdivision as another 5 waves impulse in lesser degree. Down from wave 4, wave ((i)) ended at 87.115 and rally in wave ((ii)) ended at 89. Pair resumes lower in wave ((iii)) towards 86.04, and wave ((iv)) is proposed complete at 87.53. Near term, as far as pivot at 89.509 high stays intact, pair has scope to extend lower before ending wave ((v)) of 5. This should also complete cycle from 2.15.2023 high and then pair should see larger degree correction higher in 3, 7, 11 swing.
AUDJPY 1 Hour Elliott Wave Chart
AUDJPY Elliott Wave Video
https://www.youtube.com/watch?v=pLhZDAtueyg
Technical Outlook and Review
DXY:
Looking at the DXY chart, we can see that there is a strong bearish momentum. There is potential for a continuation towards the first support level at 101.93, which is a swing low support level and coincides with a 78.60% Fibonacci retracement. If prices were to drop further, they could reach the second support level at 100.82, which is also a swing low support level.
On the other hand, the first resistance level is at 103.48, which is an overlap resistance level and coincides with a 38.20% Fibonacci retracement. Breaking through this resistance could lead to a rise towards the second resistance level at 104.60, which is also an overlap resistance level.
It’s worth noting that there is an intermediate support level at 102.62, which is an overlap support level. Traders should keep an eye on this level as a break of this intermediate support could trigger a strong bearish acceleration towards the first support level.
EUR/USD:
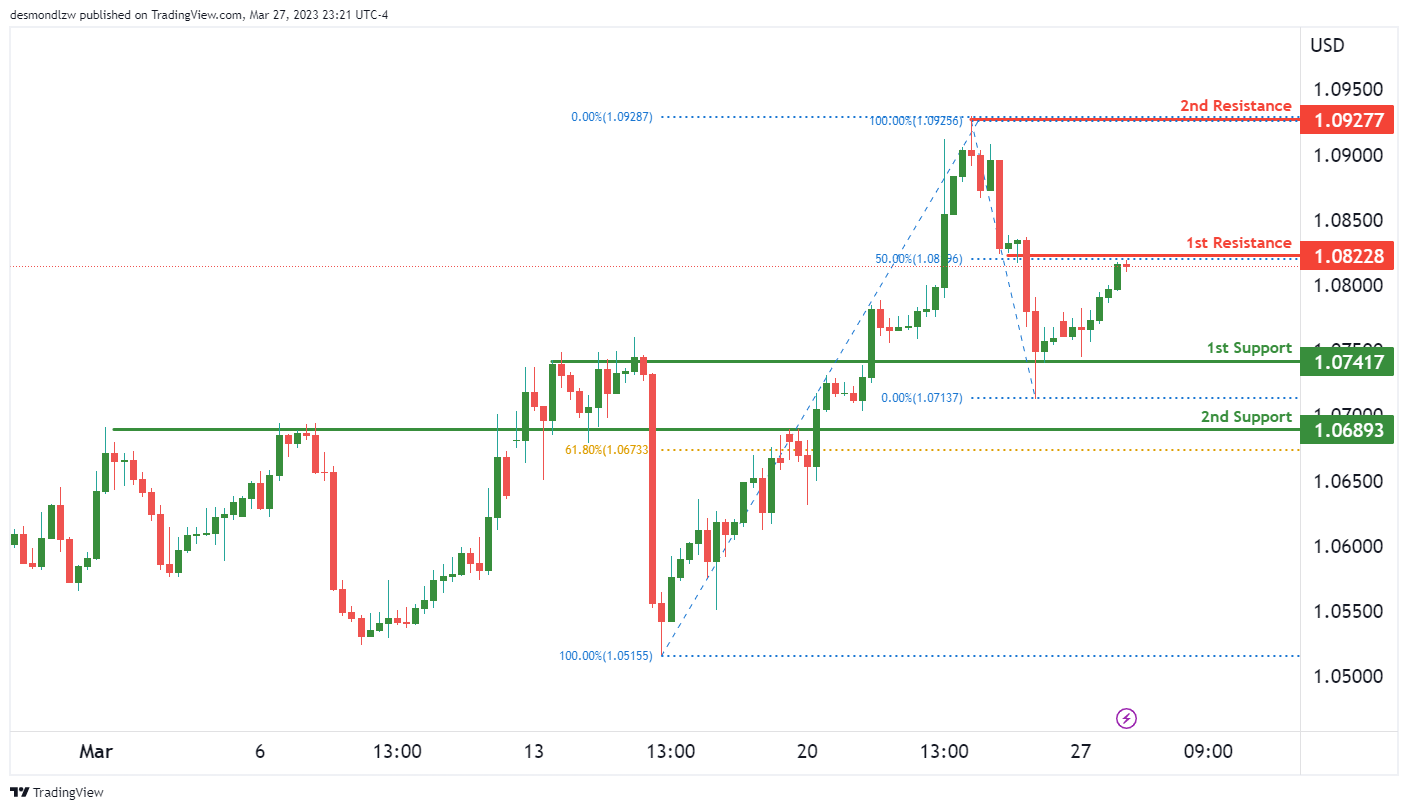
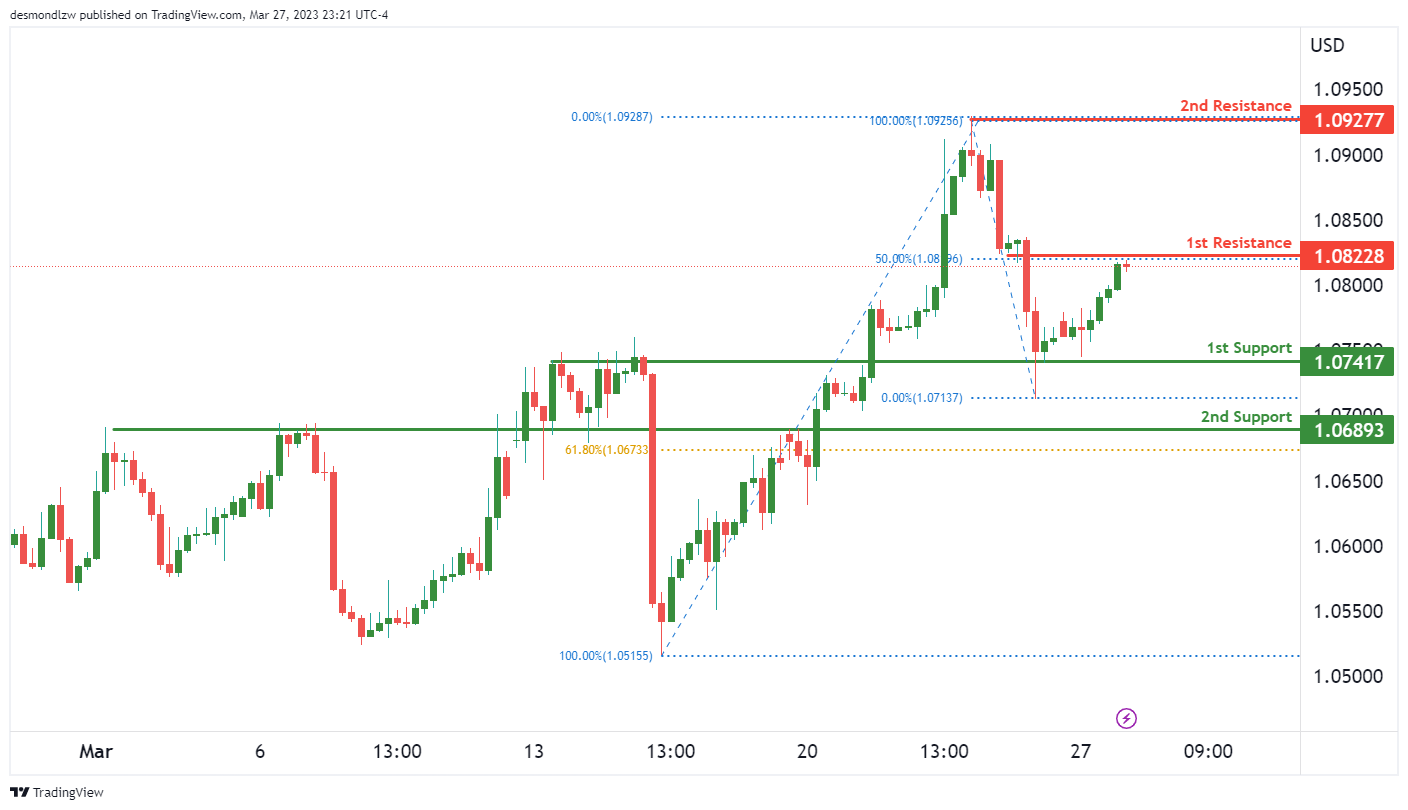
The EUR/USD chart is currently showing bearish momentum, with potential for a bearish reaction off the first resistance level at 1.0822 and a subsequent drop to the first support level at 1.0741. The first support level is an overlap support level, while the second support level at 1.0689 is also an overlap support level and coincides with the 61.80% Fibonacci retracement level.
On the other hand, the first resistance level is a swing high resistance at 1.0822, which also coincides with the 50% Fibonacci retracement level. Breaking through this resistance could lead to a rise towards the second resistance level at 1.0927, which is another swing high resistance level.
GBP/USD:
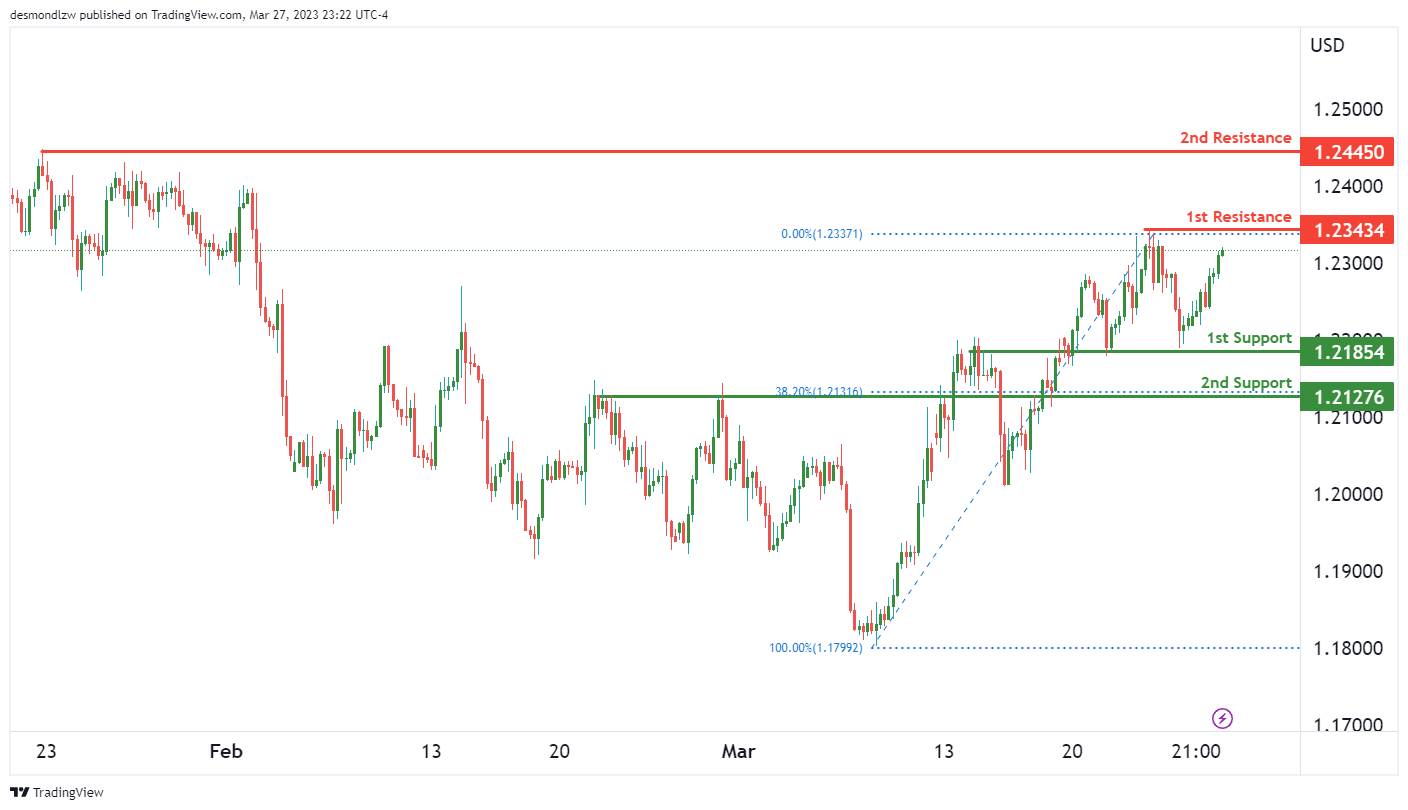
The GBP/USD chart is currently showing a bearish momentum with the potential for a continuation towards the first support level at 1.2185, which is an overlap support level. If the price were to drop further, it could reach the second support level at 1.2127, which is also an overlap support level and coincides with the 38.20% Fibonacci retracement level.
On the other hand, the first resistance level is at 1.2343, which is a multi-swing high resistance level. If the price were to bounce from this level, it could potentially drop towards the first support level. However, if the price were to break through the first resistance level, it could rise towards the second resistance level at 1.2445, which is a swing high resistance level.
USD/CHF:
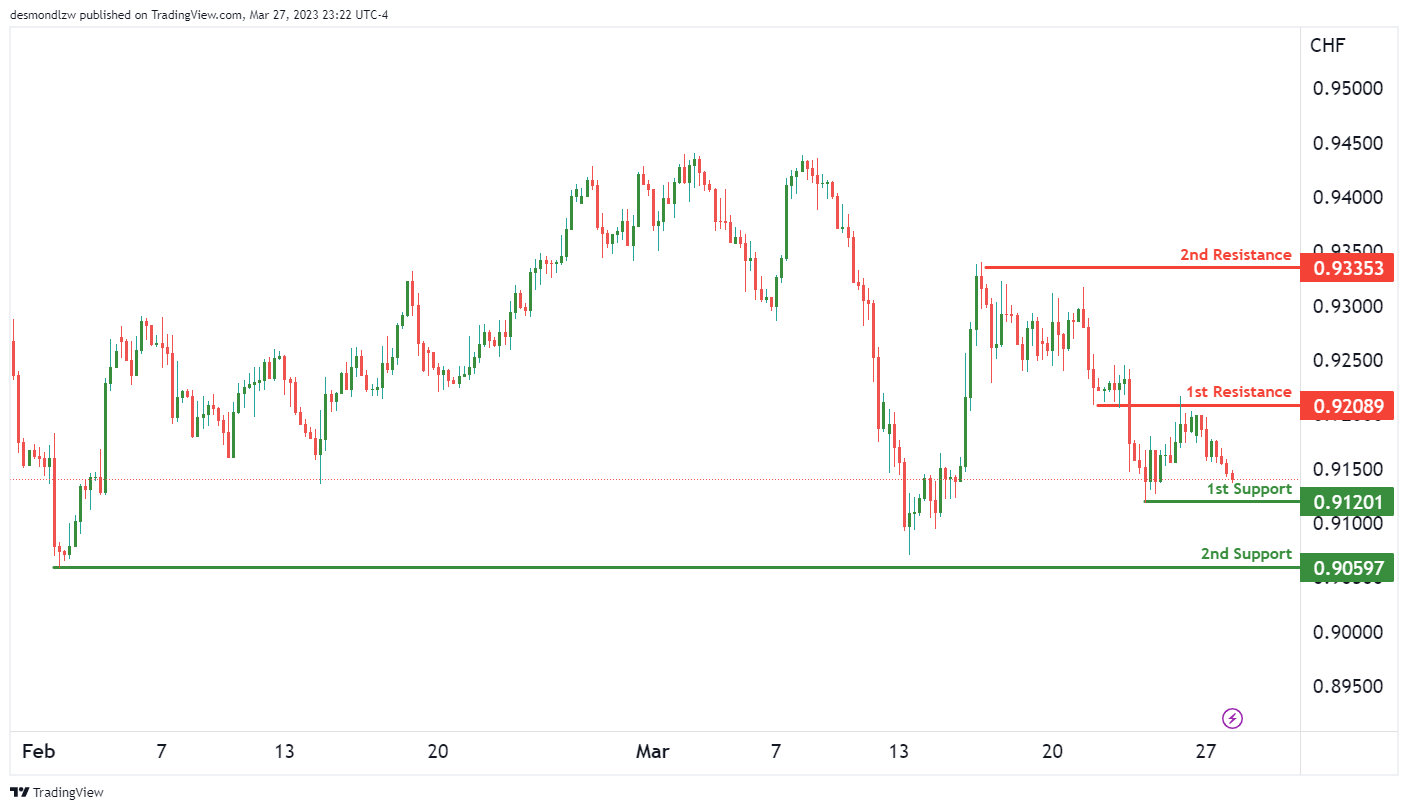
The USD/CHF chart is currently showing bearish momentum, indicating a potential for a continuation towards the first support level at 0.9120. This level is a swing low support, which makes it a strong candidate for a potential bounce. In addition, there is a second support level at 0.9059, which is also a swing low support and could provide further support if prices were to drop further.
On the other hand, the first resistance level is at 0.9208, which is an overlap resistance level that coincides with a potential retracement level. If prices were to rise, they could potentially reach the second resistance level at 0.9335, which is a multi-swing high resistance level.
Overall, the momentum of the chart is bearish, indicating that prices could continue to drop towards the first support level. However, traders should keep an eye on the chart for any potential breakouts or market movements that could cause prices to rise towards the resistance levels.
USD/JPY:
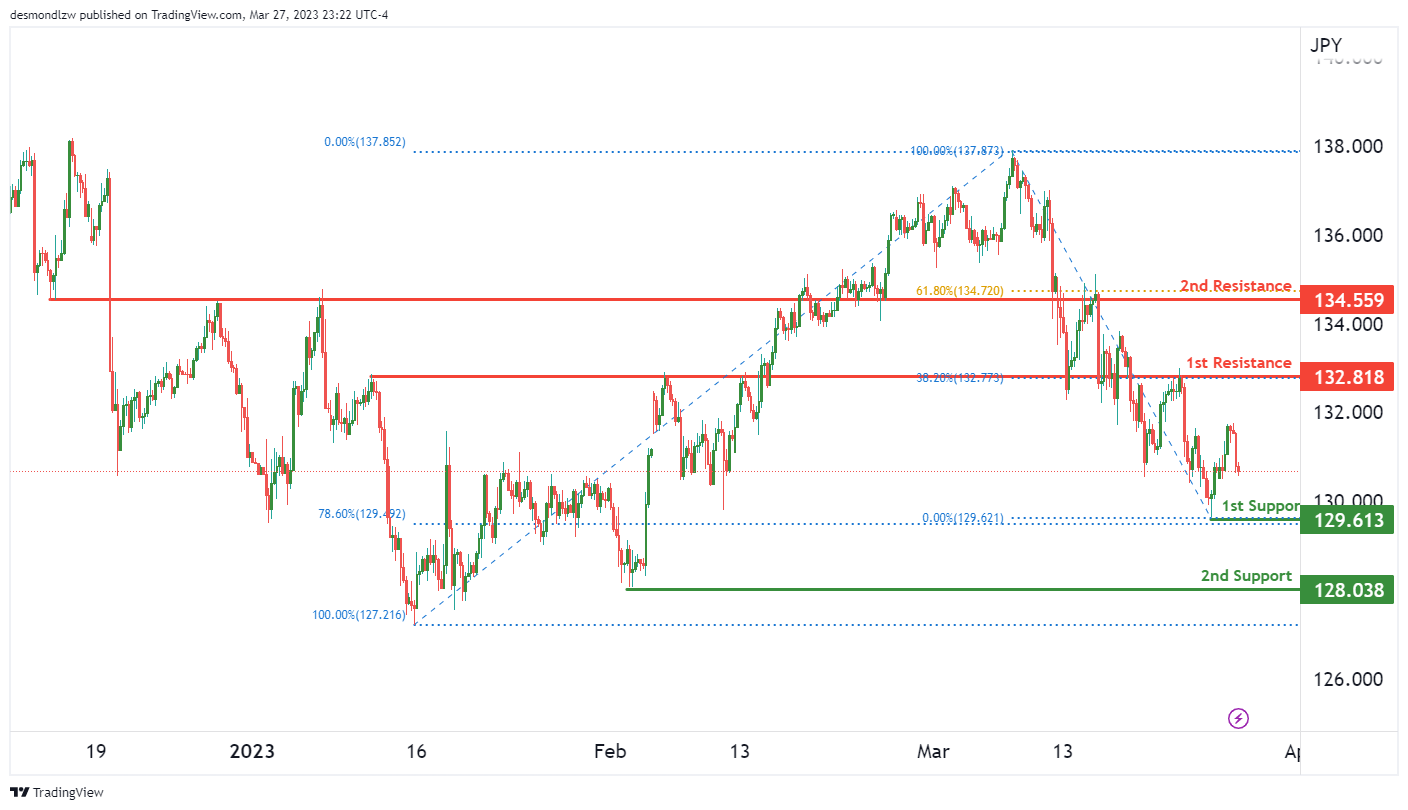
The USD/JPY chart currently shows bearish momentum, indicating that prices could potentially continue to move downwards. The first support level is at 129.61, which is a swing low support and coincides with the 78.60% Fibonacci retracement level. The second support level is at 128.03, which is also a swing low support. On the resistance side, the first level is at 132.81, which is an overlap resistance and lines up with the 38.20% Fibonacci retracement level. The second resistance level is at 134.55, which is also an overlap resistance and coincides with the 61.80% Fibonacci retracement level. If prices break the first support, it could potentially drop down to the second support level. However, if prices break the first resistance, it could potentially move upwards towards the second resistance.
AUD/USD:
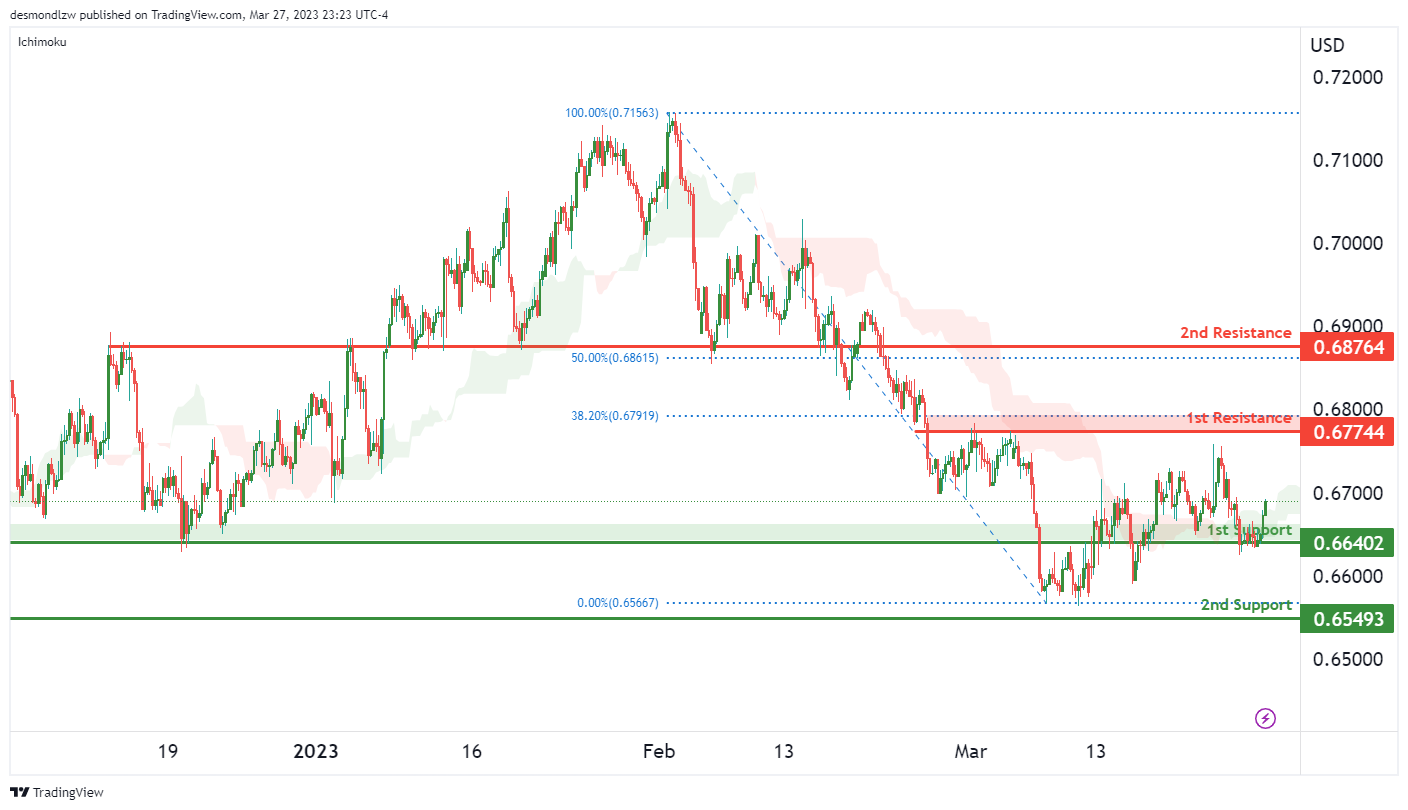
The AUD/USD chart is currently showing a bullish momentum, with price above the Ichimoku cloud. This suggests that the uptrend may continue.
If price were to continue to rise, it could potentially reach our 1st resistance at 0.6774, which is a strong overlap resistance level and coincides with a 38.20% Fibonacci retracement.
In the event of a price drop, the first support level to look out for is at 0.6640, which is a strong overlap support level. If price were to break this support level, it could potentially drop to the 2nd support at 0.6549, which is also a swing low support.
There is a 2nd resistance level at 0.6876 which is a significant overlap resistance level and coincides with a 50% Fibonacci retracement. If price were to break this resistance level, it could potentially rise even further.
Overall, the bullish momentum in the AUD/USD chart suggests that price may continue to rise towards the 1st resistance level at 0.6774. However, it’s important to monitor the support levels at 0.6640 and 0.6549 in case of a price drop.
NZD/USD:
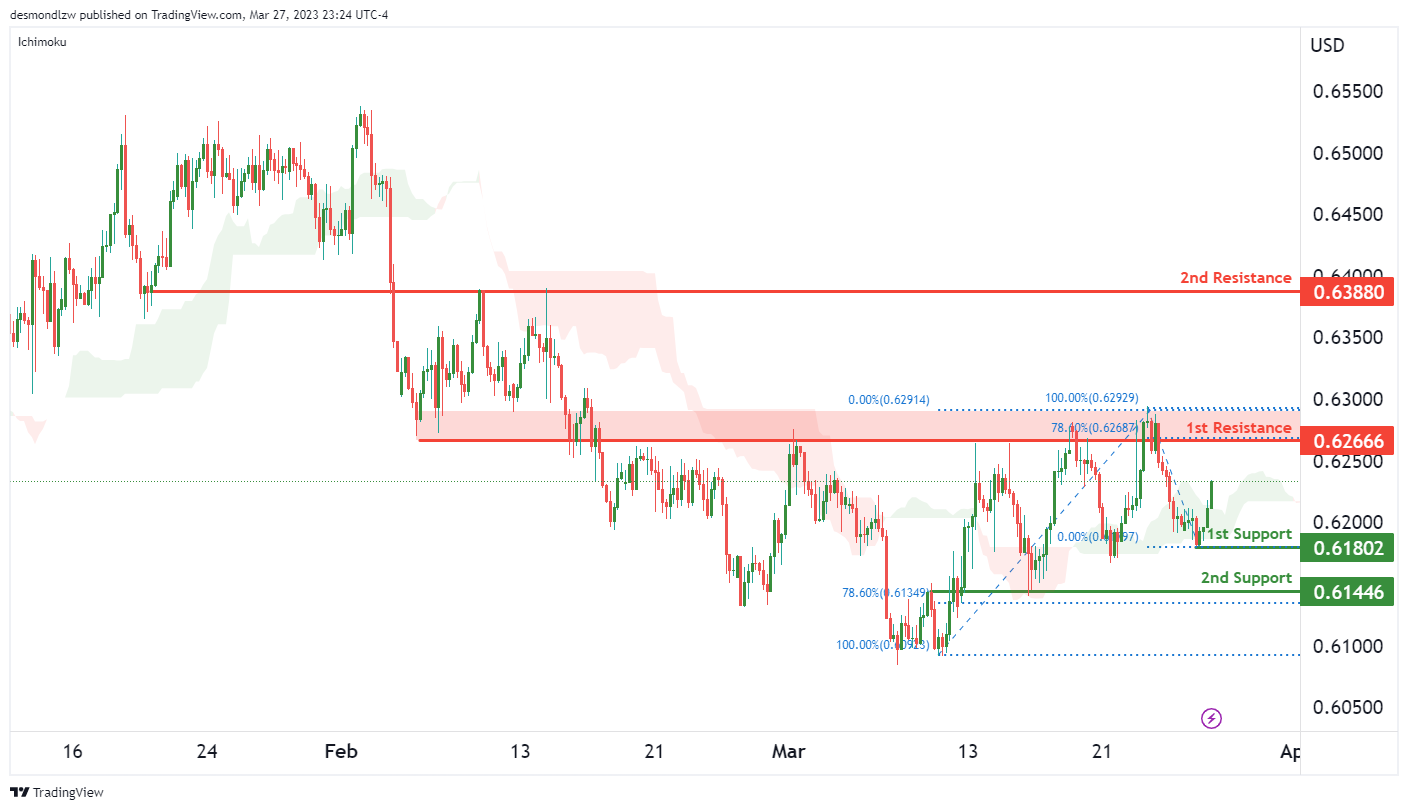
The overall momentum of NZD/USD for this particular instrument has been bullish. One of the key factors contributing to this bullish momentum is the fact that price is currently above the bullish Ichimoku cloud. With that in mind, there is a potential for a bullish continuation towards the 1st resistance level.
The 1st support level is situated at 0.6180 and is a good level to look out for, as it is a swing low support. The 2nd support level at 0.6144 is also significant as it is an overlap support and is aligned with the 78.60% Fibonacci retracement.
On the other hand, the 1st resistance level is at 0.6266, which is another overlap resistance and is aligned with the 78.60% Fibonacci retracement. If price were to break this level, the next resistance level to look out for would be the 2nd resistance at 0.6388, which is also an overlap resistance.
USD/CAD:
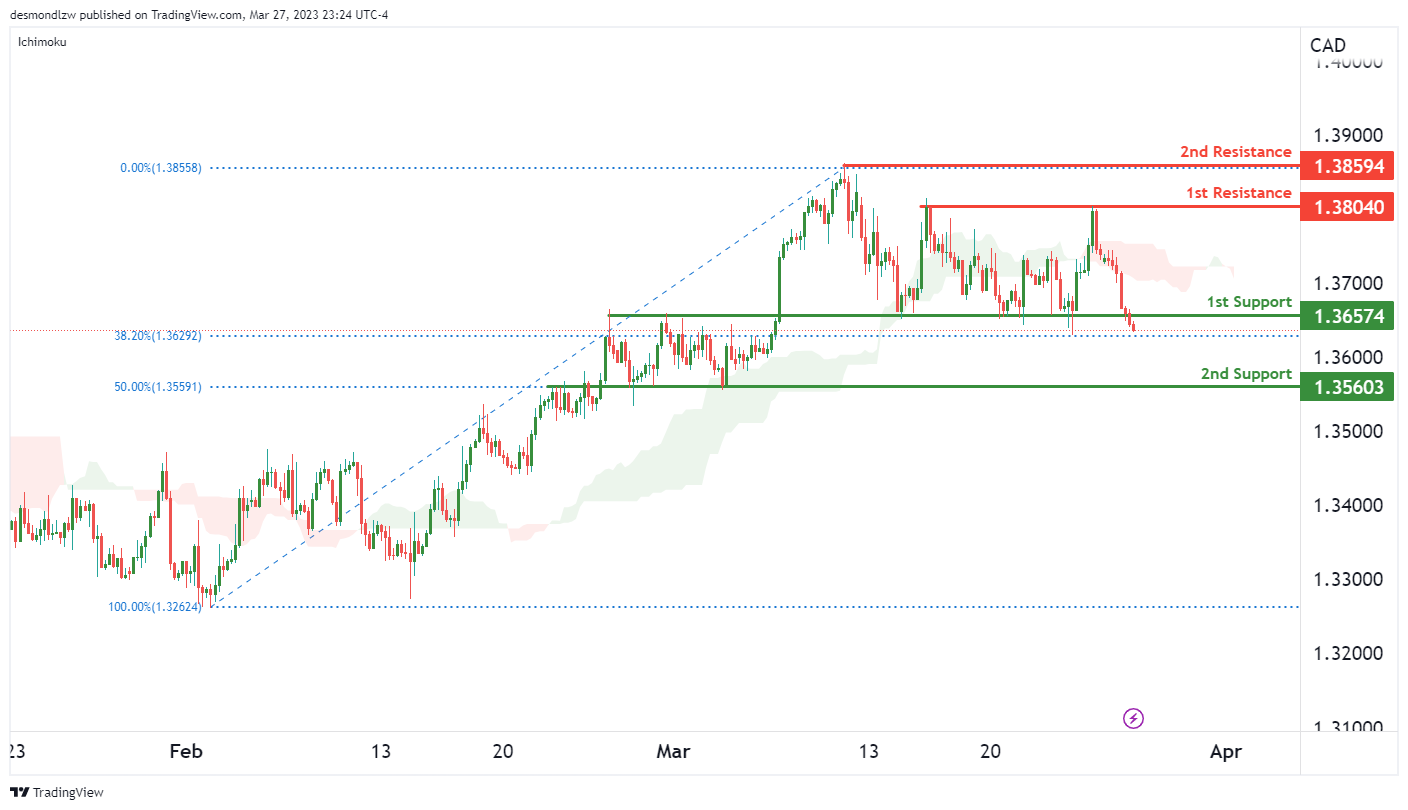
The overall momentum of the USD/CAD chart is bearish, with price currently trading below the bearish Ichimoku cloud. There is a possibility of a bearish break off the 1st support level, which could result in a drop towards the 2nd support level
The 1st support level is at 1.3657, and it is a strong overlap support level, coinciding with a 38.20% Fibonacci retracement. If price were to break below this level, it could potentially drop towards the 2nd support level at 1.3560, which is another overlap support level coinciding with a 50% Fibonacci retracement.
On the other hand, there are two resistance levels to watch out for. The 1st resistance level is at 1.3804, and it is a swing high resistance. The 2nd resistance level is at 1.3859, which is also a swing high resistance.
Given the current bearish momentum of the chart, there is a higher probability of a drop towards the support levels rather than a rise towards the resistance levels. However, it is important to monitor price action closely, as a break above the 1st resistance level could potentially shift the bias towards a more bullish outlook.
DJ30:
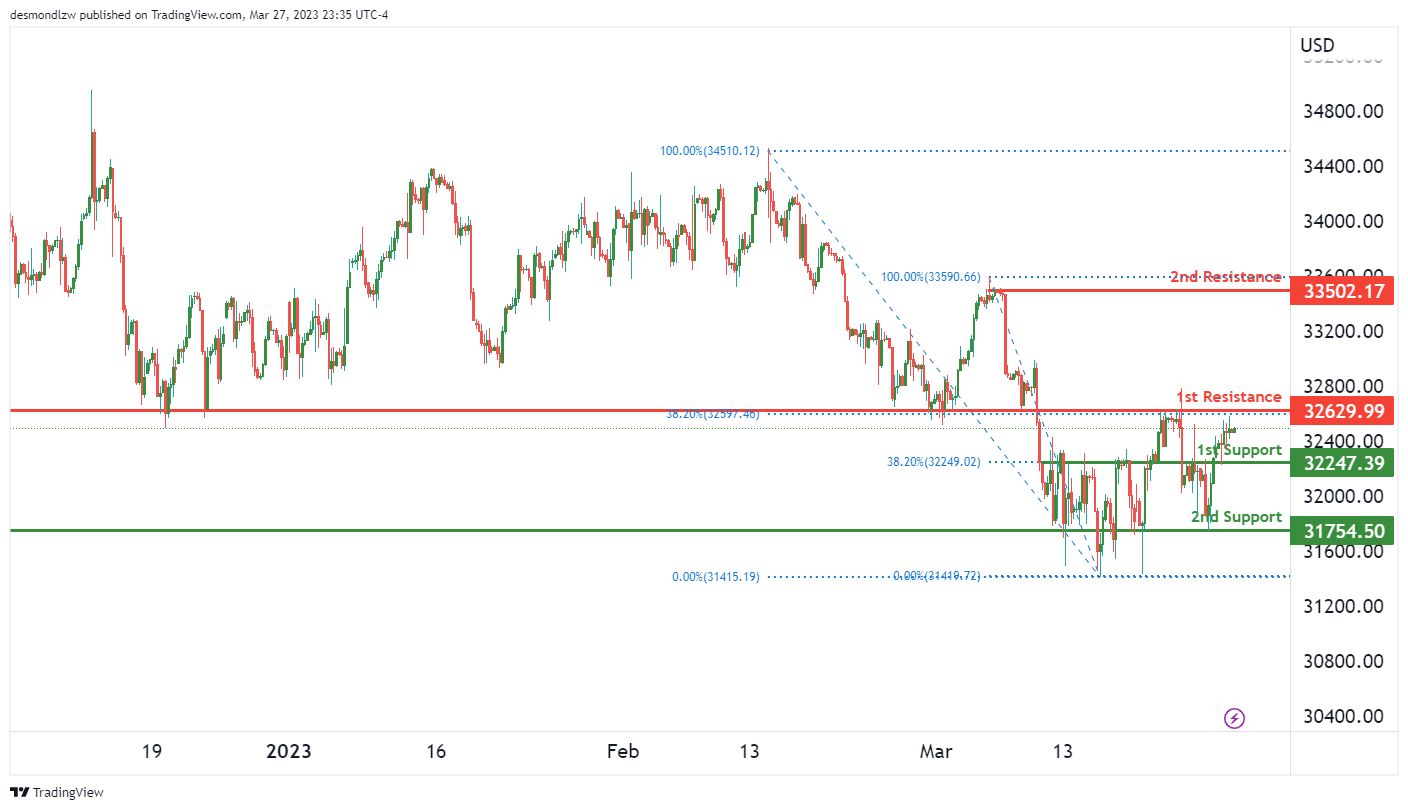
The DJ30 chart is currently showing a neutral momentum, indicating that there is no clear direction or trend at present. The price may fluctuate between the first resistance and support levels in the near future.
The first support level is at 32,247 and is a strong overlap support level that coincides with the 38.20% Fibonacci retracement level. The second support level is at 31,754 and is a swing low support level that has been tested multiple times in the past.
On the other hand, the first resistance level is at 32,629 and is another strong overlap resistance level that coincides with the 38.20% Fibonacci retracement level. The second resistance level is at 33,502 and is a swing high resistance level.
It is important to note that there is no clear momentum driving the price in a certain direction at present.
GER30:
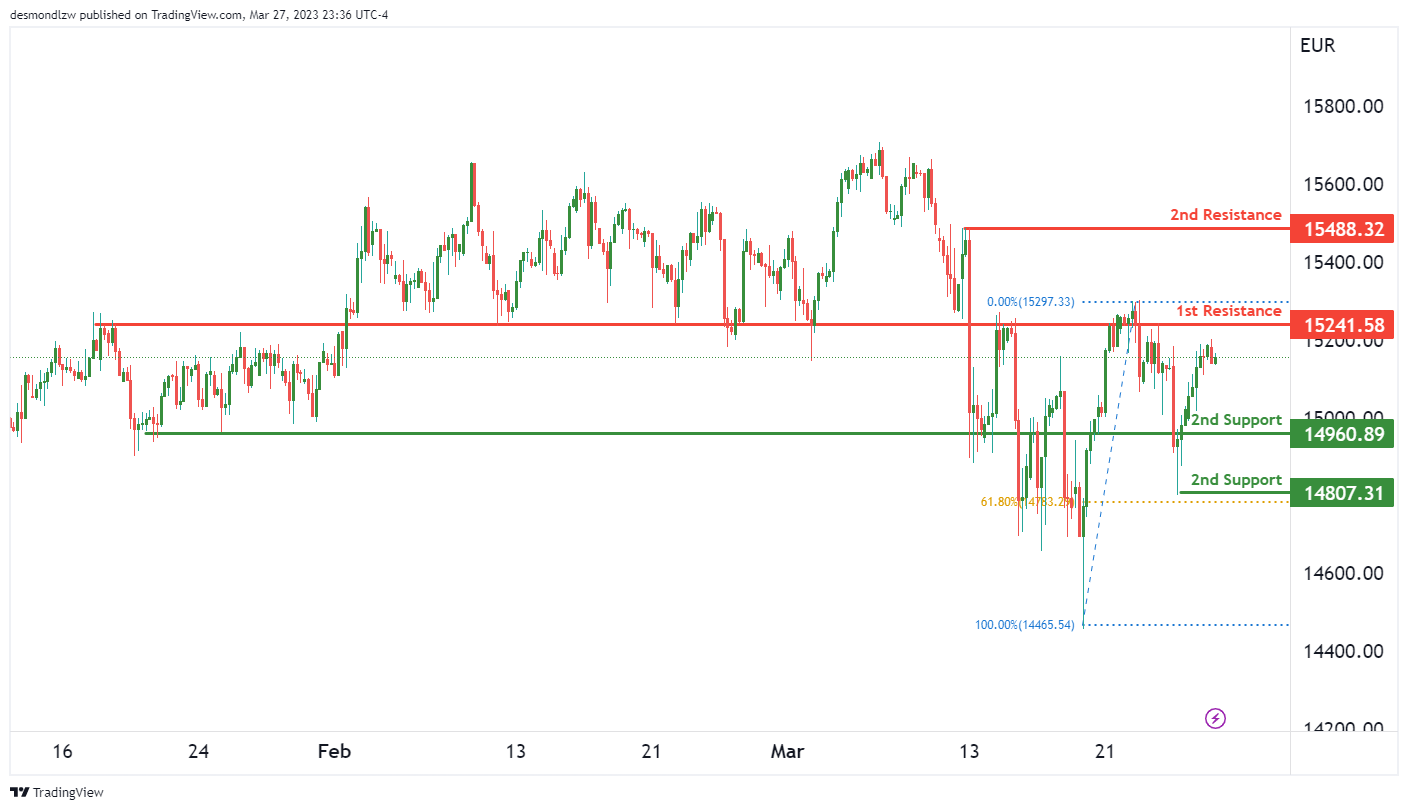
The GER30 chart is currently showing bullish momentum, with price potentially making a continuation towards the 1st resistance level. Price is currently above the Ichimoku cloud, which suggests further bullish momentum could be in store.
The 1st support level is at 14960, which is a strong overlap support. If price were to bounce from this level, it could rise to the 1st resistance level at 15241. This level is also an overlap resistance, which adds to its significance.
If price were to break the 1st resistance, it could potentially rise towards the 2nd resistance at 15488. This level is a multi-swing high resistance and could provide a significant challenge for bulls.
However, if price were to drop, the 2nd support level at 14807 could provide a potential rebound point. This level is a swing low support and also lines up with the 78.60% Fibonacci retracement, making it a strong support zone.
BTC/USD:
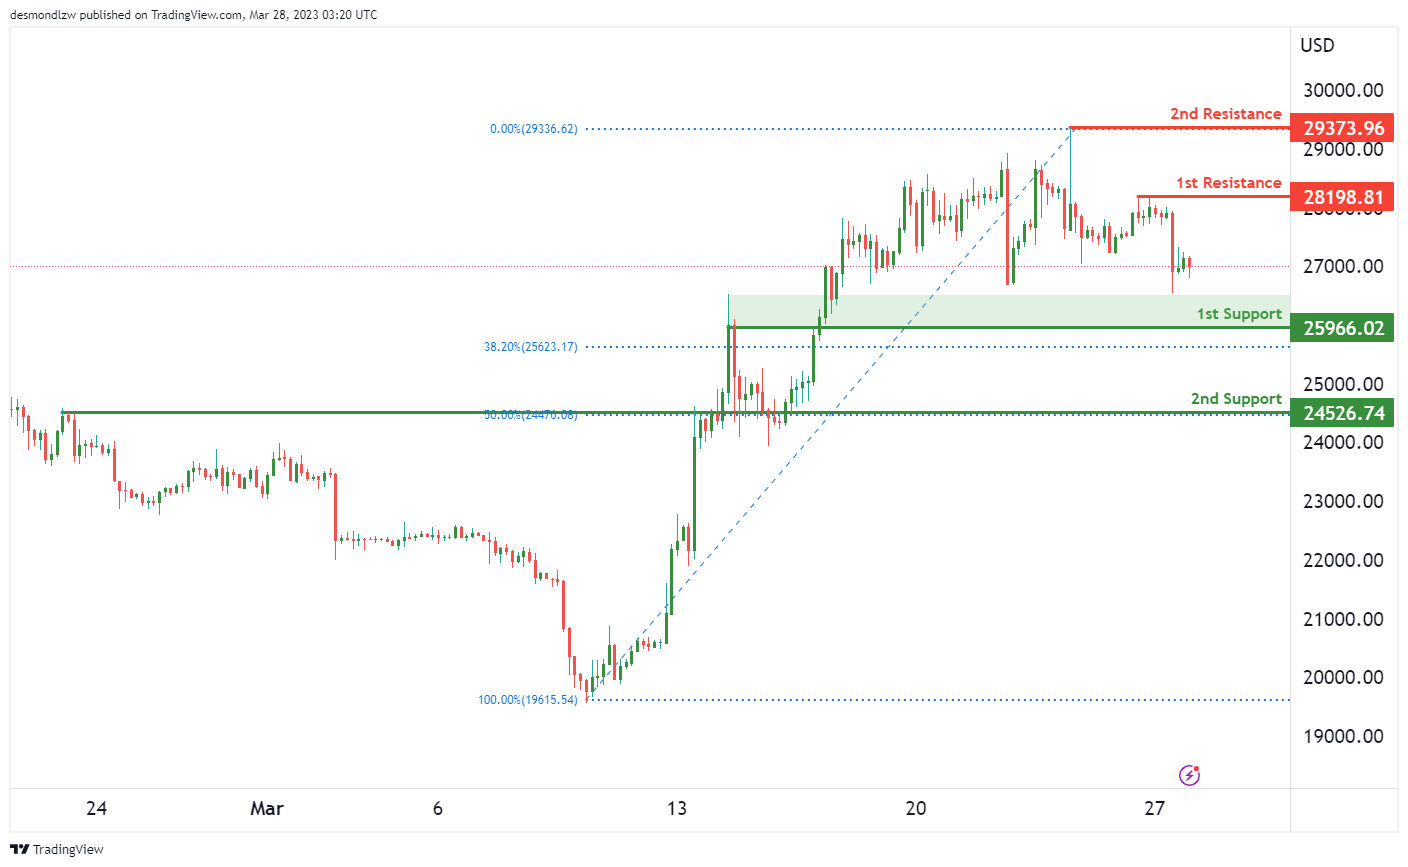
The overall momentum of the BTC/USD chart is currently bearish. Price has the potential to make a bearish continuation towards the 1st support level, which is at 25966. This level is an overlap support and coincides with a 38.20% Fibonacci retracement, making it a strong level of potential support. If price were to break below this level, the next support level it could drop to is the 2nd support at 24526. This level is also an overlap support and lines up with the 50% Fibonacci retracement, making it another strong level of potential support.
On the resistance side, the 1st resistance is at 28198. This level is a swing high resistance and could potentially act as a level where price might reverse its downward momentum. The 2nd resistance is at 29373, which is also a swing high resistance and could be another level where price may reverse its downward momentum.
Overall, it seems like the BTC/USD chart is exhibiting bearish momentum. The support and resistance levels discussed above suggest that price could potentially drop further towards the 1st and 2nd support levels. It’s important to keep an eye on these levels as a break of the 1st support could signal a potential move down towards the 2nd support. On the other hand, a break above the 1st resistance could indicate a potential reversal in the bearish momentum.
US500
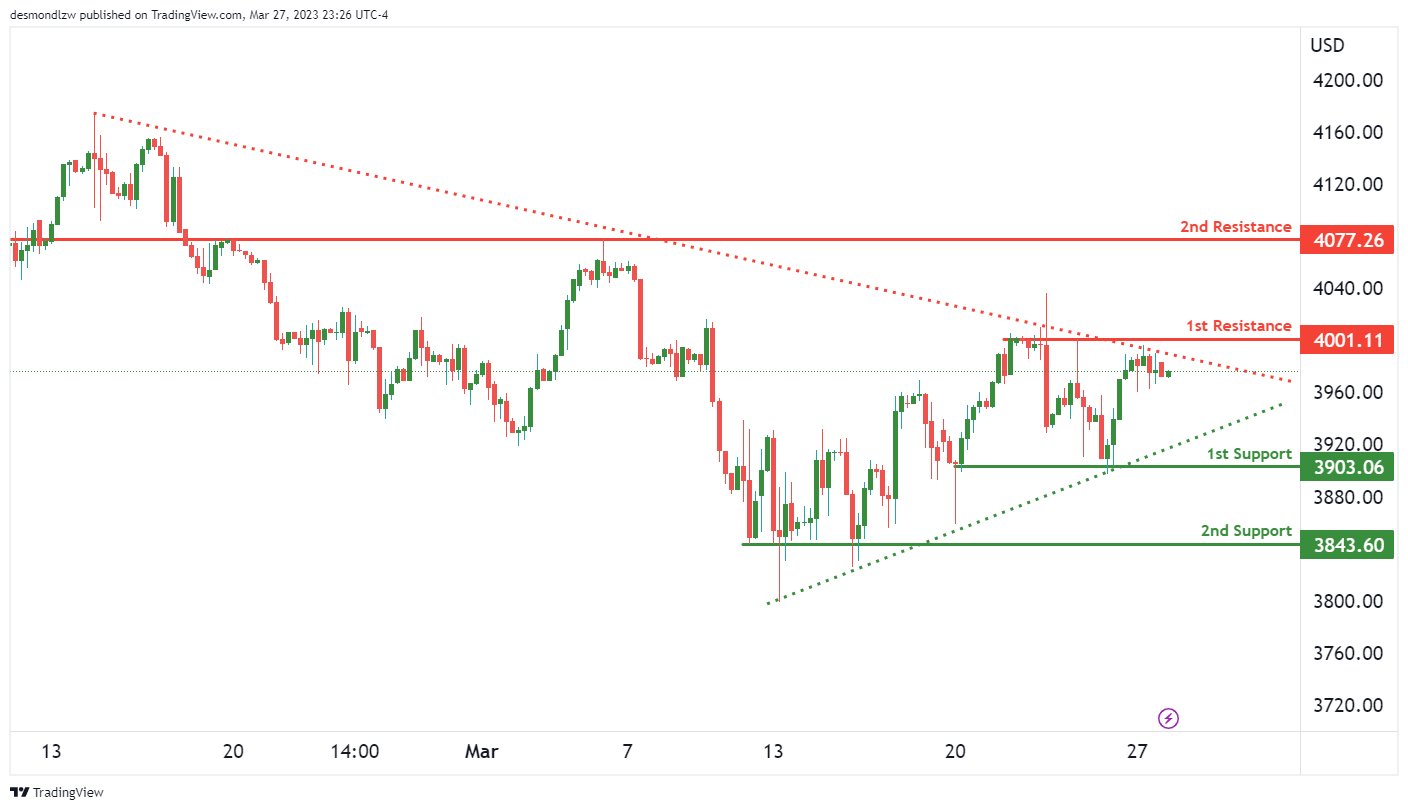
The US500 chart shows overall bullish momentum, with price above a major ascending trend line indicating further potential bullish momentum on the horizon. However, there is also a major descending trend line above price, suggesting that bearish momentum could also be on the cards.
In terms of potential price movement, the US500 could see a bearish continuation towards its 1st support at 3903.06, which is a multi-swing low support level. If this level were to break, the next support is at 3843.60, another multi-swing low support.
On the other hand, if bullish momentum continues, price could rise towards the 1st resistance level of 4001.11, which is a multi-swing high resistance level. The 2nd resistance level is at 4007.26, an overlap resistance level.
ETH/USD:
ETH/USD Continues Bearish Momentum, Potential for Drop to 1st Support
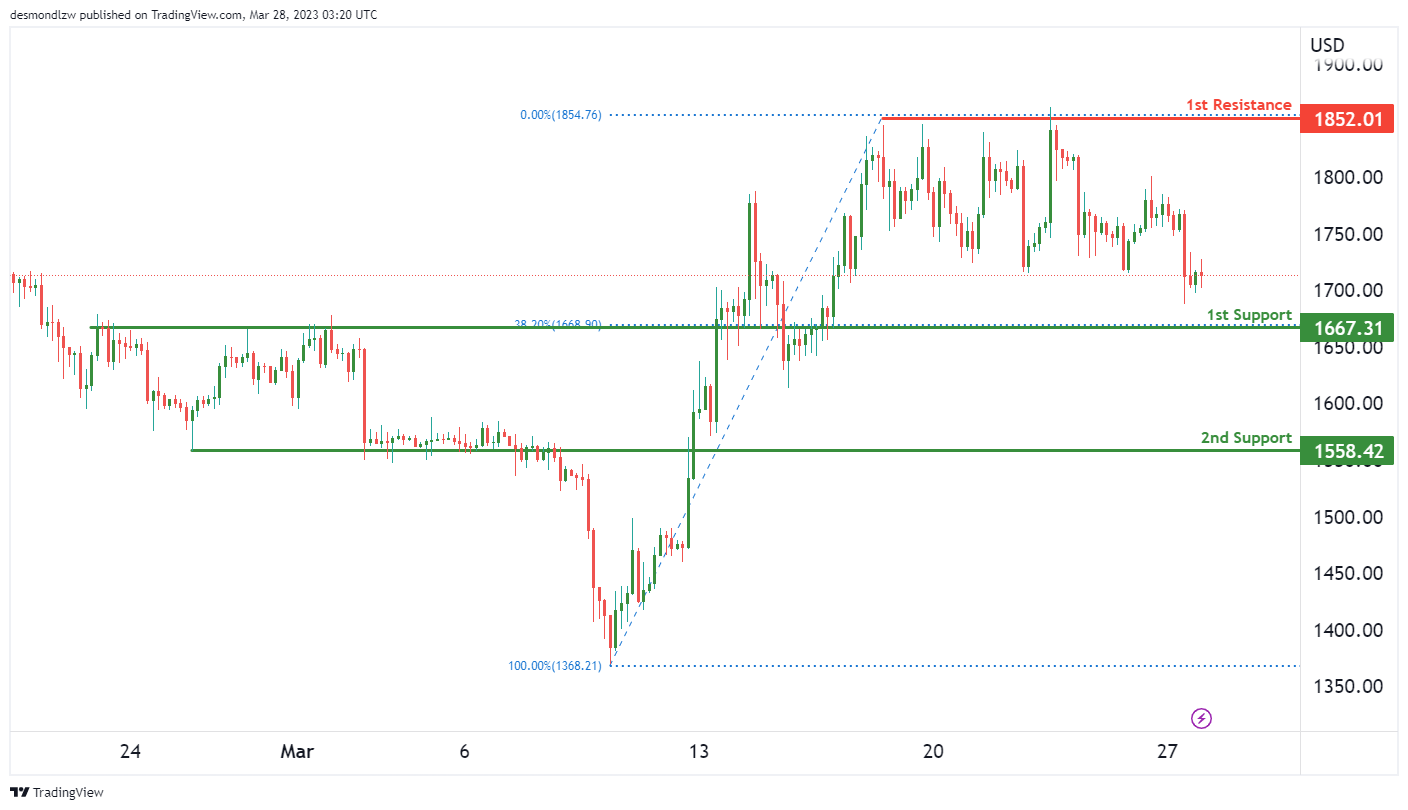
The overall momentum of the ETH/USD chart is currently bearish, with the price potentially making a bearish continuation towards the 1st support level. This is indicated by the price being below the bearish Ichimoku cloud.
The 1st support level for ETH/USD is at 1667.31. This level is a good support as it is an overlap support and also has a 38.20% Fibonacci retracement lining up with it. If the price were to break below this level, it could potentially drop towards the 2nd support level at 1558.42, which is another overlap support.
On the other hand, the 1st resistance level for ETH/USD is at 1852.01, which is a multi-swing high resistance. The price has struggled to break above this level in the past, indicating strong selling pressure from the bears.
WTI/USD:
WTI: Potential for Bearish Reaction off 1st Resistance and Drop to 1st Support
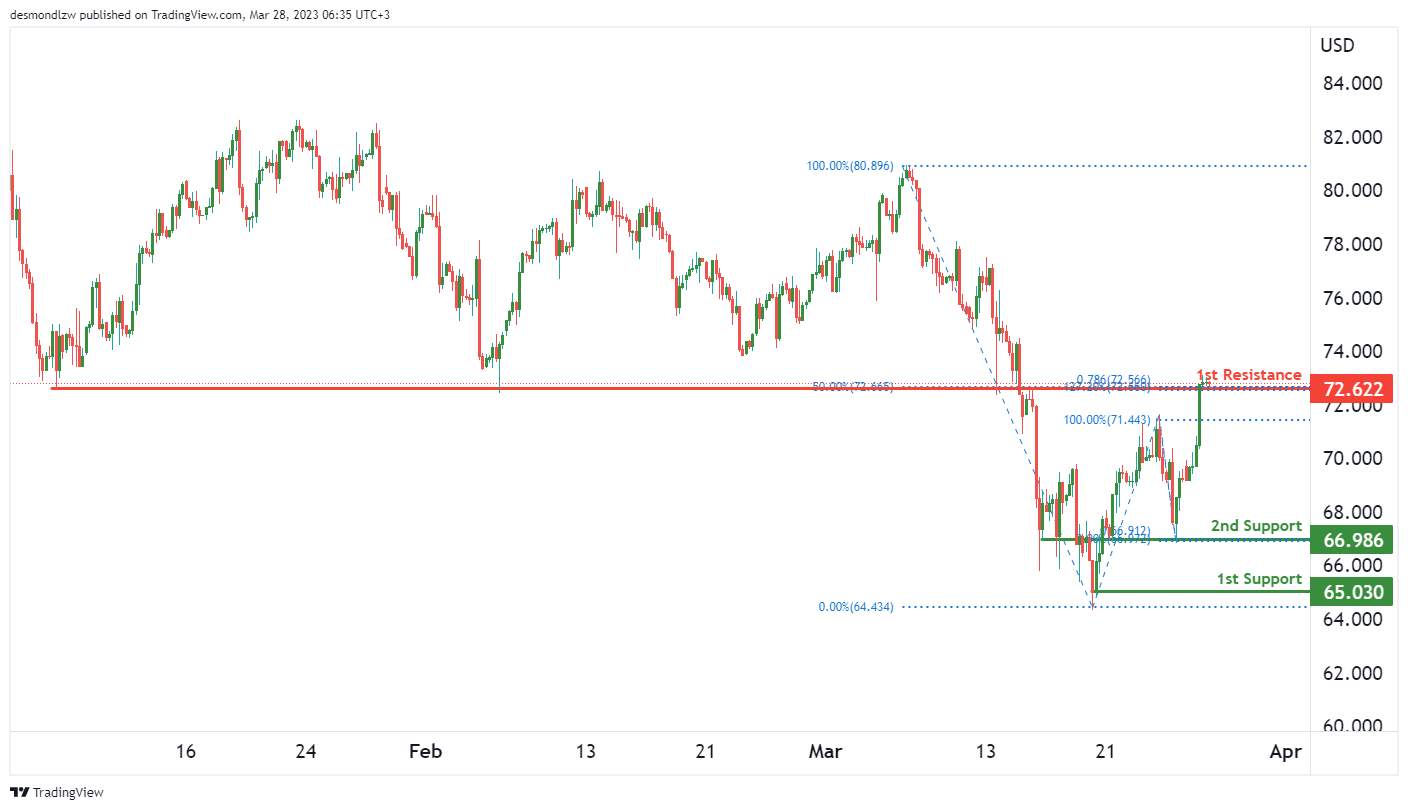
The overall momentum of the WTI chart is currently bearish, with price potentially making a bearish reaction off 1st resistance and dropping to 1st support.
The 1st support level to watch is at 66.98. This level is an overlap support and has held as support in the past. If price were to break below this level, it could drop towards the 2nd support at 65.03, which is a multi-swing low support.
On the other hand, the 1st resistance level to watch is at 72.62. This level is an overlap resistance and has acted as a ceiling to price in the past. It also coincides with the 127.20% Fibonacci retracement, adding more significance to the level.
If price were to react off the 1st resistance and drop towards the 1st support, it would confirm the bearish momentum of the chart. However, if price were to break above the 1st resistance, it could potentially rise towards higher resistance levels.
XAU/USD (GOLD):
Gold Maintains Bullish Momentum, Could See Continuation Towards Resistance Levels
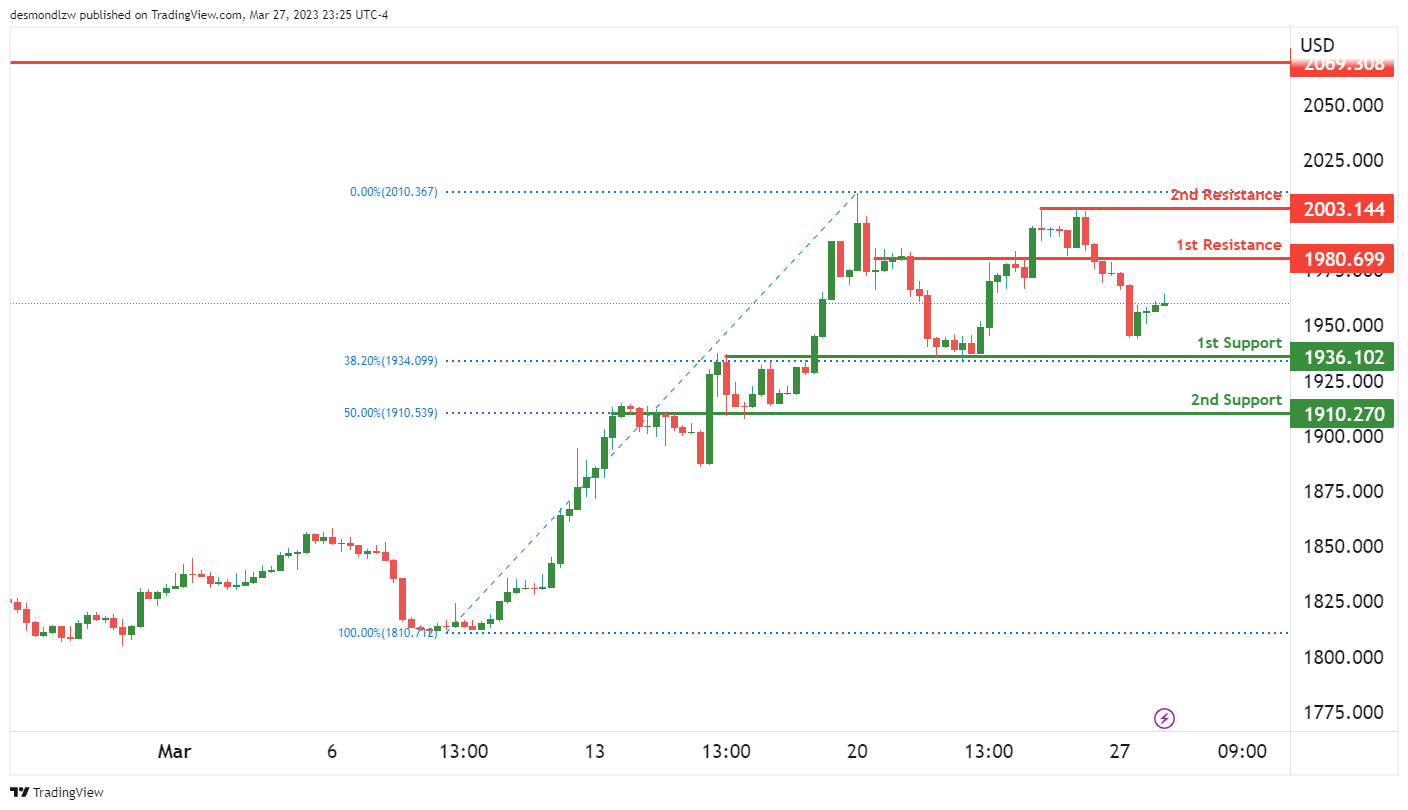
Gold’s overall momentum remains bullish, as the precious metal continues to trade above key support levels. Currently, gold is trading at around $1965.00 against the US dollar.
Price could potentially see a bullish continuation towards the 1st resistance level of $1980.00. However, it may encounter some resistance at this level, which coincides with a strong overlap resistance.
If price manages to break through the 1st resistance, it could potentially rise towards the 2nd resistance level of $2003.00, which is a multi-swing high resistance.
On the downside, there are two support levels to watch out for. The 1st support level is at $1963.00, which is a key overlap support level and a 38.20% Fibonacci retracement. The 2nd support level is at $1910.00, which is also an overlap support level and a 50% Fibonacci retracement.
Fed Jefferson on balancing inflation and economic stability
Fed Philip Jefferson stated yesterday that the current inflation rate is too high, emphasizing the FOMC's goal to reduce it to 2% as quickly as possible. Speaking at Washington and Lee University in Lexington, Virginia, he acknowledged that the process may take some time due to persistent inflation components such as services excluding housing.
Jefferson said, "I would like to say that inflation will return to 2% soon, but we have to do it in a way that does not damage the economy any more than is necessary. That's what we are trying to do." Fed is grappling with the challenge of ensuring price stability amid high inflation while also maintaining financial stability in the wake of the second-largest bank failure in US history.
In his speech, Jefferson also noted that although inflation has begun to decline, it remains unclear whether this decrease is due to higher interest rates, easing pandemic-induced supply strains, or falling energy prices.
He highlighted the uncertainty surrounding the full impact of the Fed's tightening measures, saying, "Monetary policy affects the economy and inflation with long, variable, and highly uncertain lags, and we are still learning about the full effect of our tightening thus far."
GBP/USD Eyes Sustained Increase Above 1.2350
Key Highlights
- GBP/USD is showing positive signs above the 1.2220 level.
- A connecting bullish trend line is forming with support at 1.2240 on the 4-hours chart.
- EUR/USD is well supported above the 1.0720 support zone.
- USD/JPY might attempt a recovery wave if it clears the 132.00 resistance.
GBP/USD Technical Analysis
The British Pound gained pace above the 1.2050 resistance against the US dollar. GBP/USD broke the 1.2150 level to settle in a positive zone.
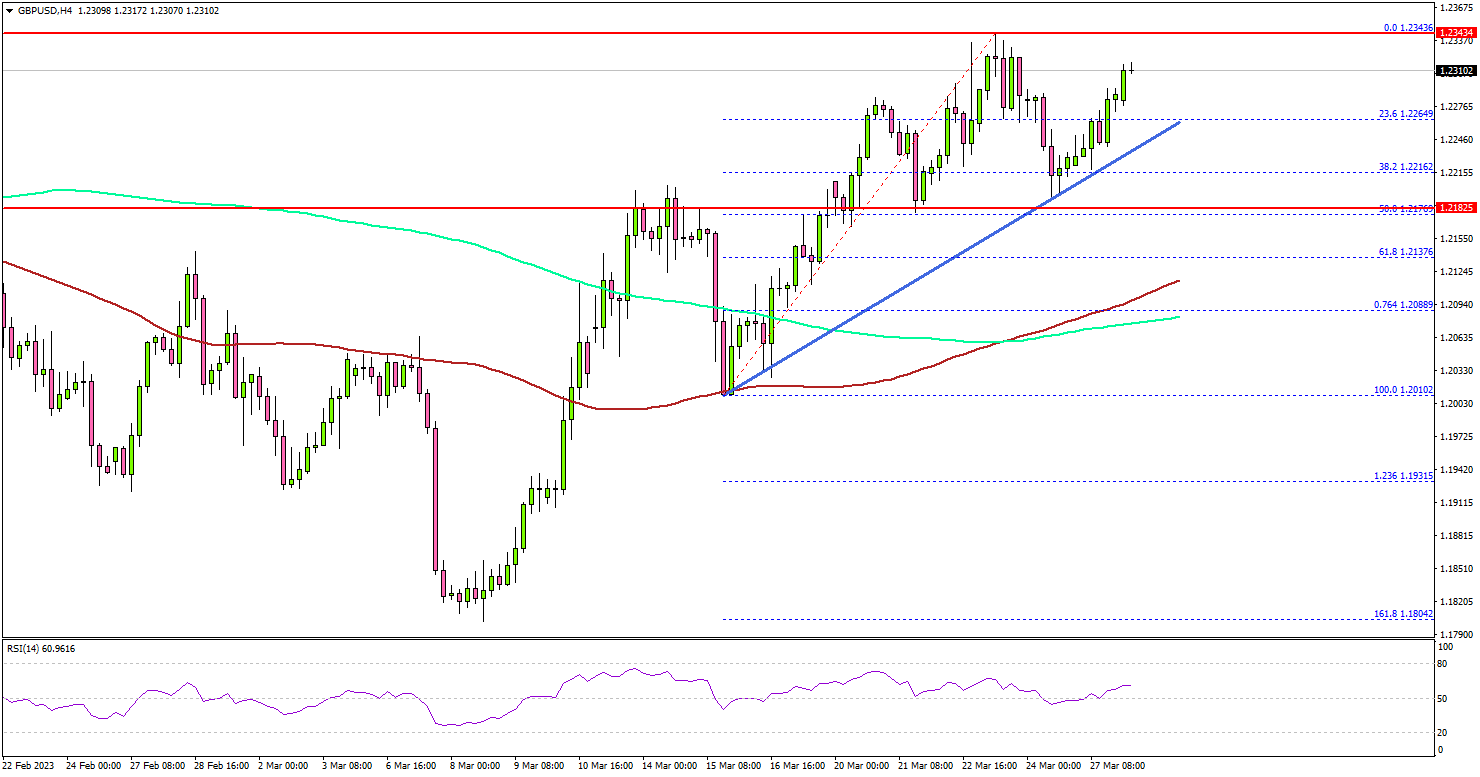
Looking at the 4-hours chart, the pair even settled above the 1.2200 level, the 100 simple moving average (red, 4-hours) and the 200 simple moving average (green, 4-hours). It traded towards 1.2350 before there was a downside correction.
The pair tested the 1.2200 support zone and remained in a positive zone. It is now rising, with an immediate resistance near the 1.2320 level.
The first major resistance is near the 1.2350 level. The next major resistance is near the 1.2400. A clear move above the 1.2400 resistance might send the pair towards the 1.2500 zone. Any more gains might send the pair towards 1.2580 or even 1.2700.
On the downside, an immediate support is near the 1.2220. The next major support is near the 1.2200 level, below which there is a risk of a move towards the 100 simple moving average (red, 4-hours). Any more losses might open the doors for a drop towards the 1.1920 level.
Looking at EUR/USD, the pair stayed above the 1.0720 support zone and might attempt a fresh increase if GBP/USD extends gains.
Economic Releases
- ECB's President Lagarde speech.