Sample Category Title
EUR/AUD Daily Outlook
Daily Pivots: (S1) 1.6172; (P) 1.6215; (R1) 1.6279; More...
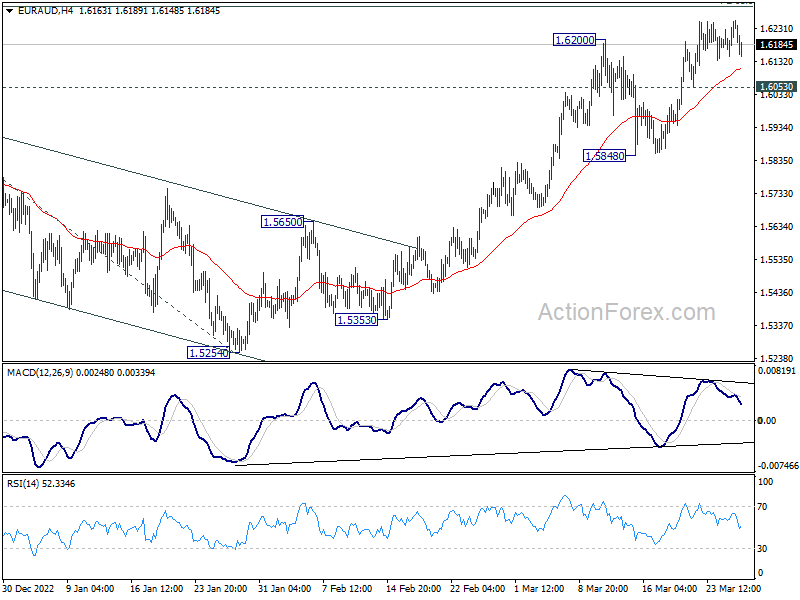
Intraday bias in EUR/AUD stays neutral as sideway consolidations continue. Further rally is expected as long as 1.6053 support holds. Decisive break there of 61.8% projection of 1.4281 to 1.5976 from 1.5254 at 1.6302 will resume larger rally from 1.4281 to 1.6389 fibonacci level and then 1.6434 resistance. However, firm break of 1.6053 will indicate rejection by 1.6302 and turn bias back to the downside for 1.5848 support.
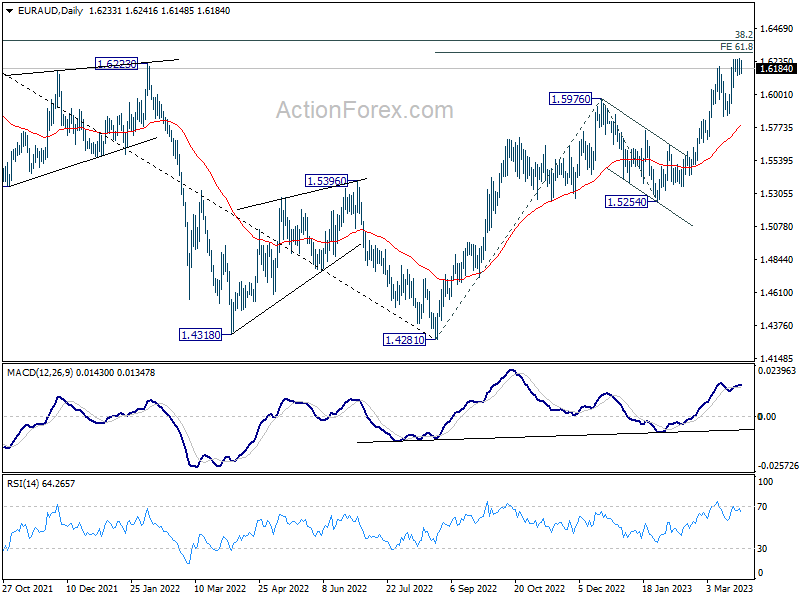
In the bigger picture, the strong support from 55 week EMA (now at 1.5404) is raising the chance of bullish trend reversal. Focus is now on 1.6434 cluster resistance (38.2% retracement of 1.9799 to 1.4281 at 1.6389). Sustained break there should confirm that whole down trend from 1.9799 (2020 high) has completed. Further rally should then be seen to 61.8% retracement at 1.7691. However, rejection by this cluster resistance will make medium term outlook neutral at best.
EUR/CHF Daily Outlook
Daily Pivots: (S1) 0.9862; (P) 0.9885; (R1) 0.9911; More...
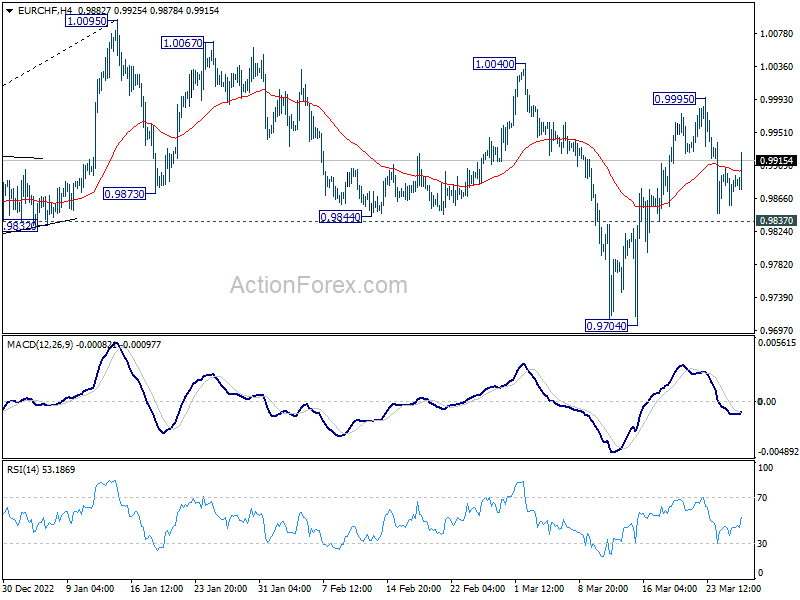
EUR/CHF is staying in consolidation below 0.9995 and intraday bias remains neutral. Another rise will remain mildly in favor as long as 0.9837 minor support holds. Break of 0.9995 will affirm the case that correction from 1.0095 has completed at 0.9704. Further rally should be seen through 1.0040 to retest 1.0095 high. However, firm break of 0.9837 will dampen this bullish view and turn bias back to the downside for 0.9704 support instead.
In the bigger picture, prior rejection by 55 week EMA (now at 1.1002) and 38.2% retracement of 1.1149 to 0.9407 at 1.0072 suggests that medium term outlook is staying bearish. That is, down trend from 1.2004 is not completed yet and is in favor to resume through 0.9407 at a later stage. However, decisive break of 1.0095 resistance will raise the chance of bullish trend reversal. Rise from 0.9407 should then target 1.0505 cluster resistance (2020 low at 1.0505, 61.8% retracement of 1.1149 to 0.9407 at 1.1484).
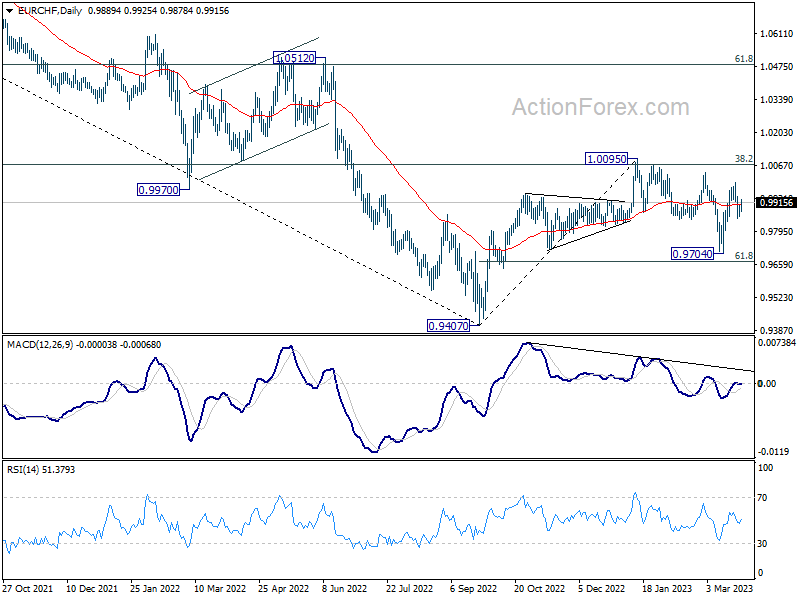
XAU/USD: We are Waiting for Completion of First Part of the Bullish Zigzag
In the medium term, gold is expected to form a double zigzag, which consists of three main sub-waves inside the cycle wave z.
Apparently, the first two sub-waves have already been formed, and the third sub-wave is currently under development.
Wave may take a standard zigzag structure. At the moment, its first part is being built the sub-wave (A), similar to the impulse 1-2-3-4-5. In the near future, market participants may observe the completion of the minor correction 4, after which the price may rise to the maximum of 2011.28 in minor wave 5.
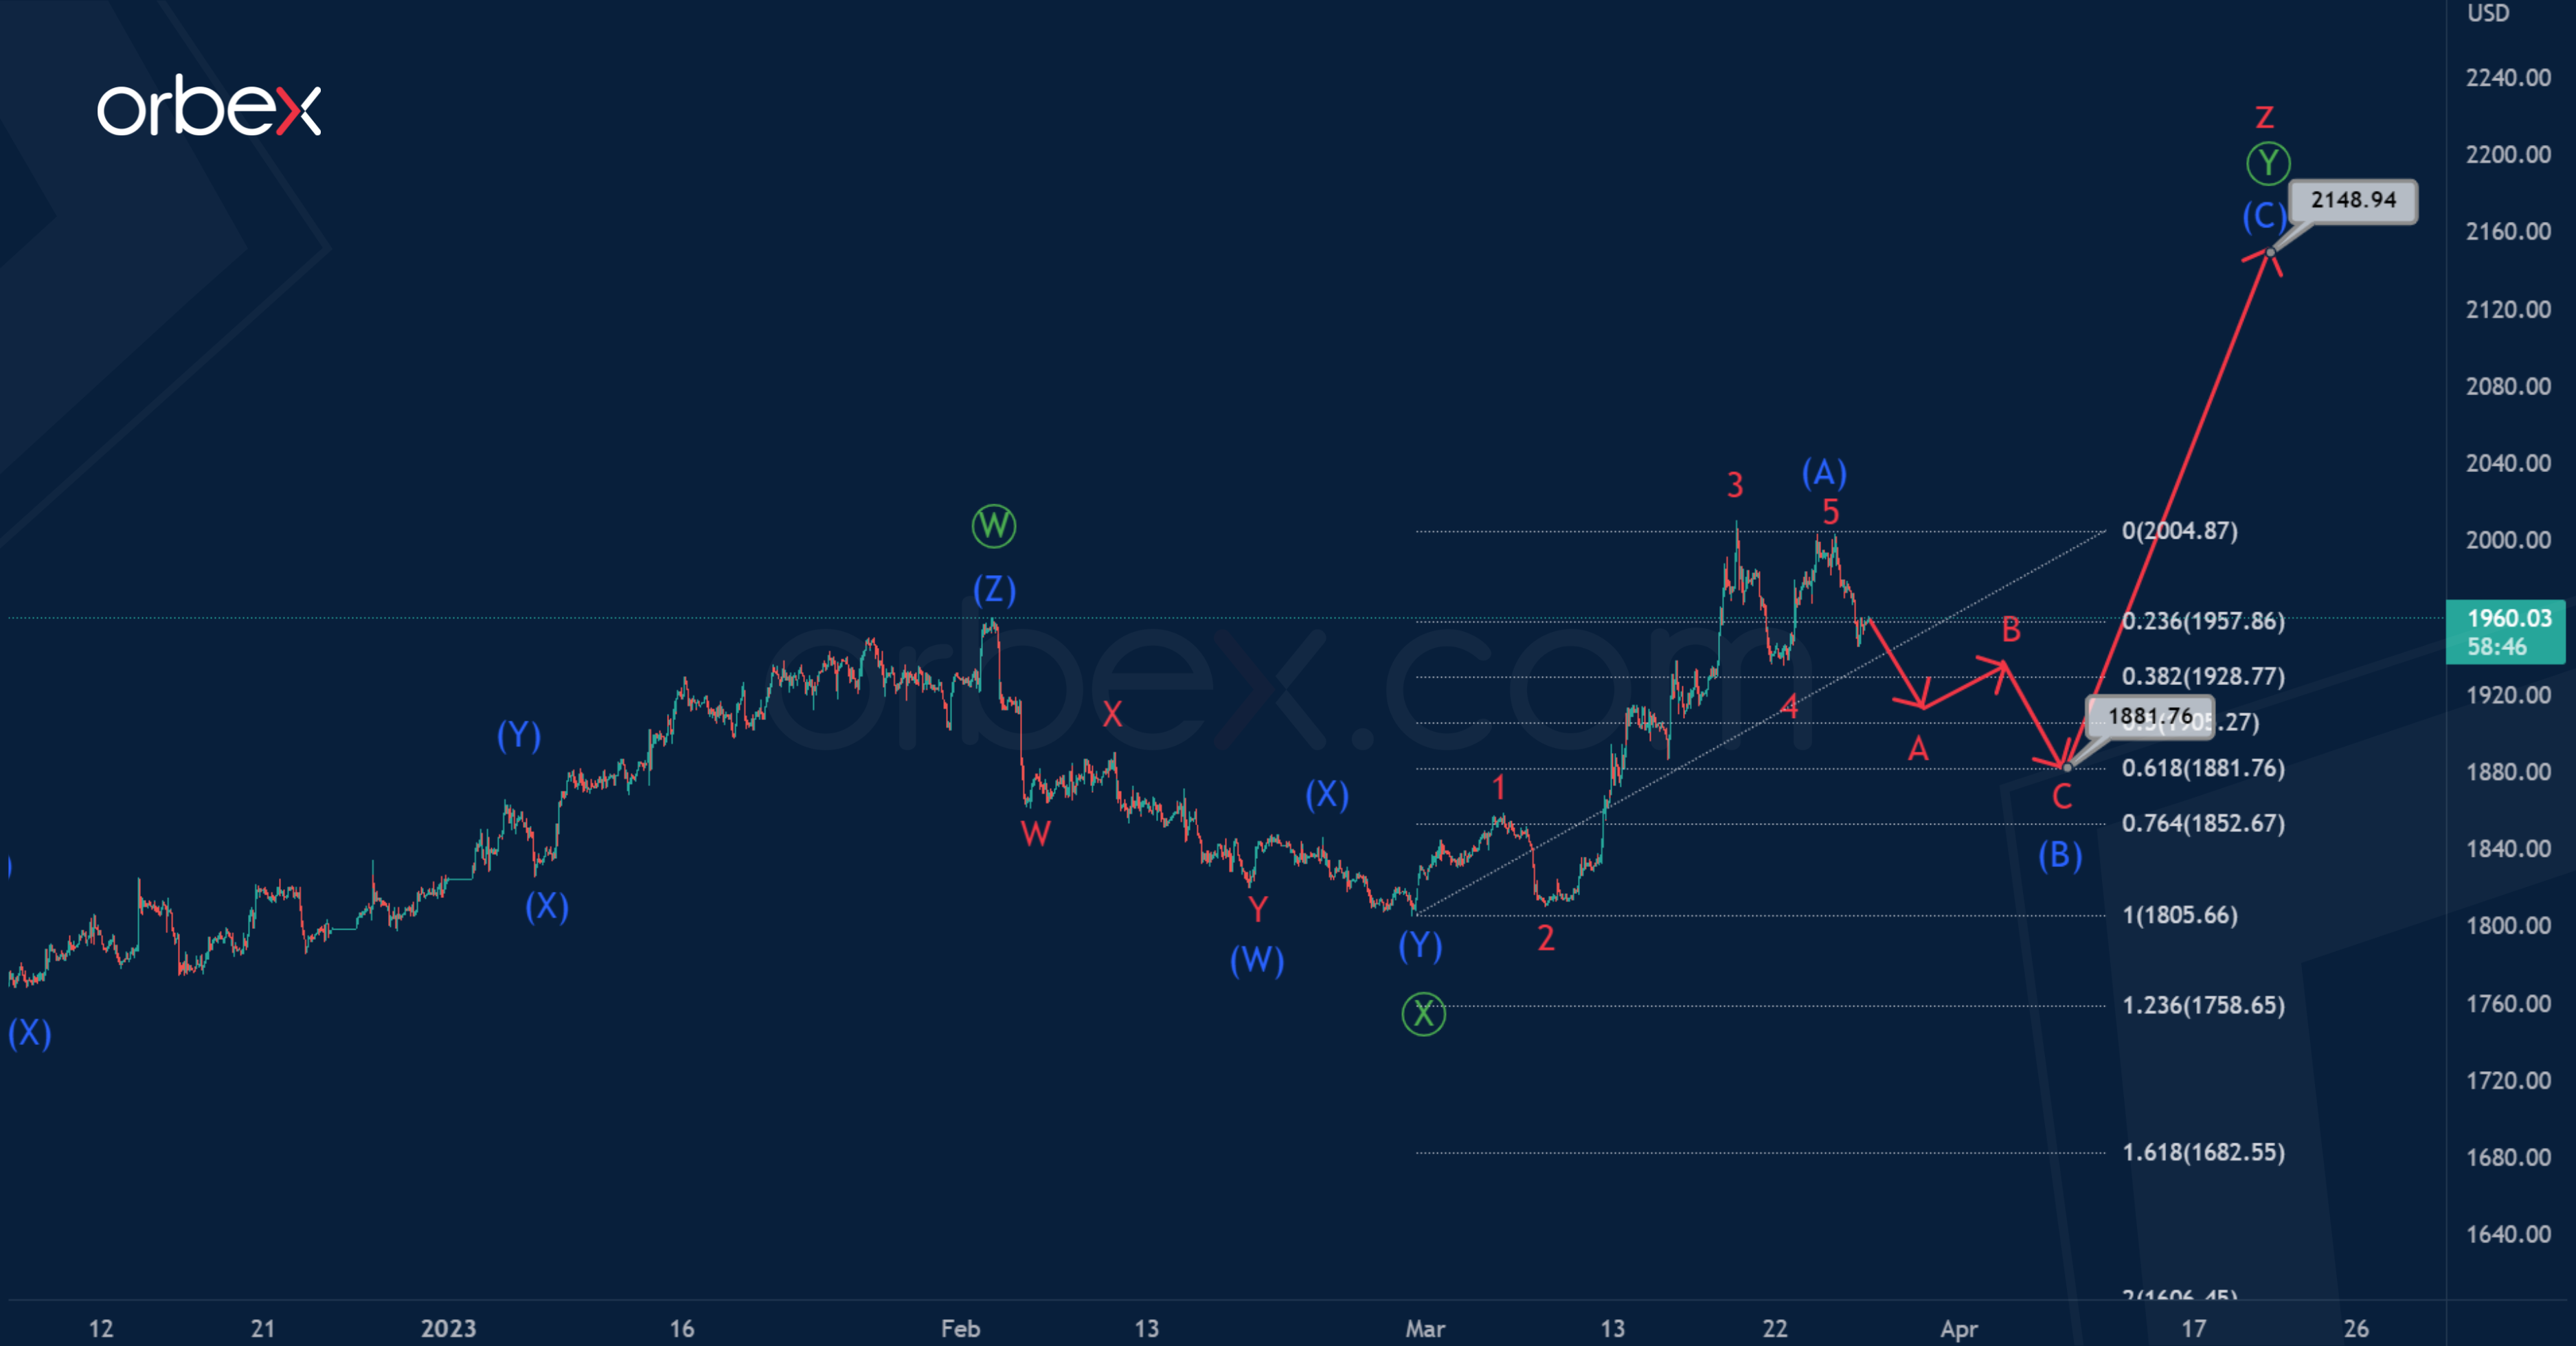
In the second variant, we consider a scenario where the intermediate impulse wave (A) is fully completed, its fifth wave is a truncated impulse.
Thus, in the next coming trading days, market participants may expect a price decline and the development of an intermediate correction (B). There is a high probability that this correction will take the form of a standard zigzag A-B-C, as shown on the chart.
The end of the wave (B) can be expected closer to 1881.76. At that level, it will be at 61.8% of impulse (A).
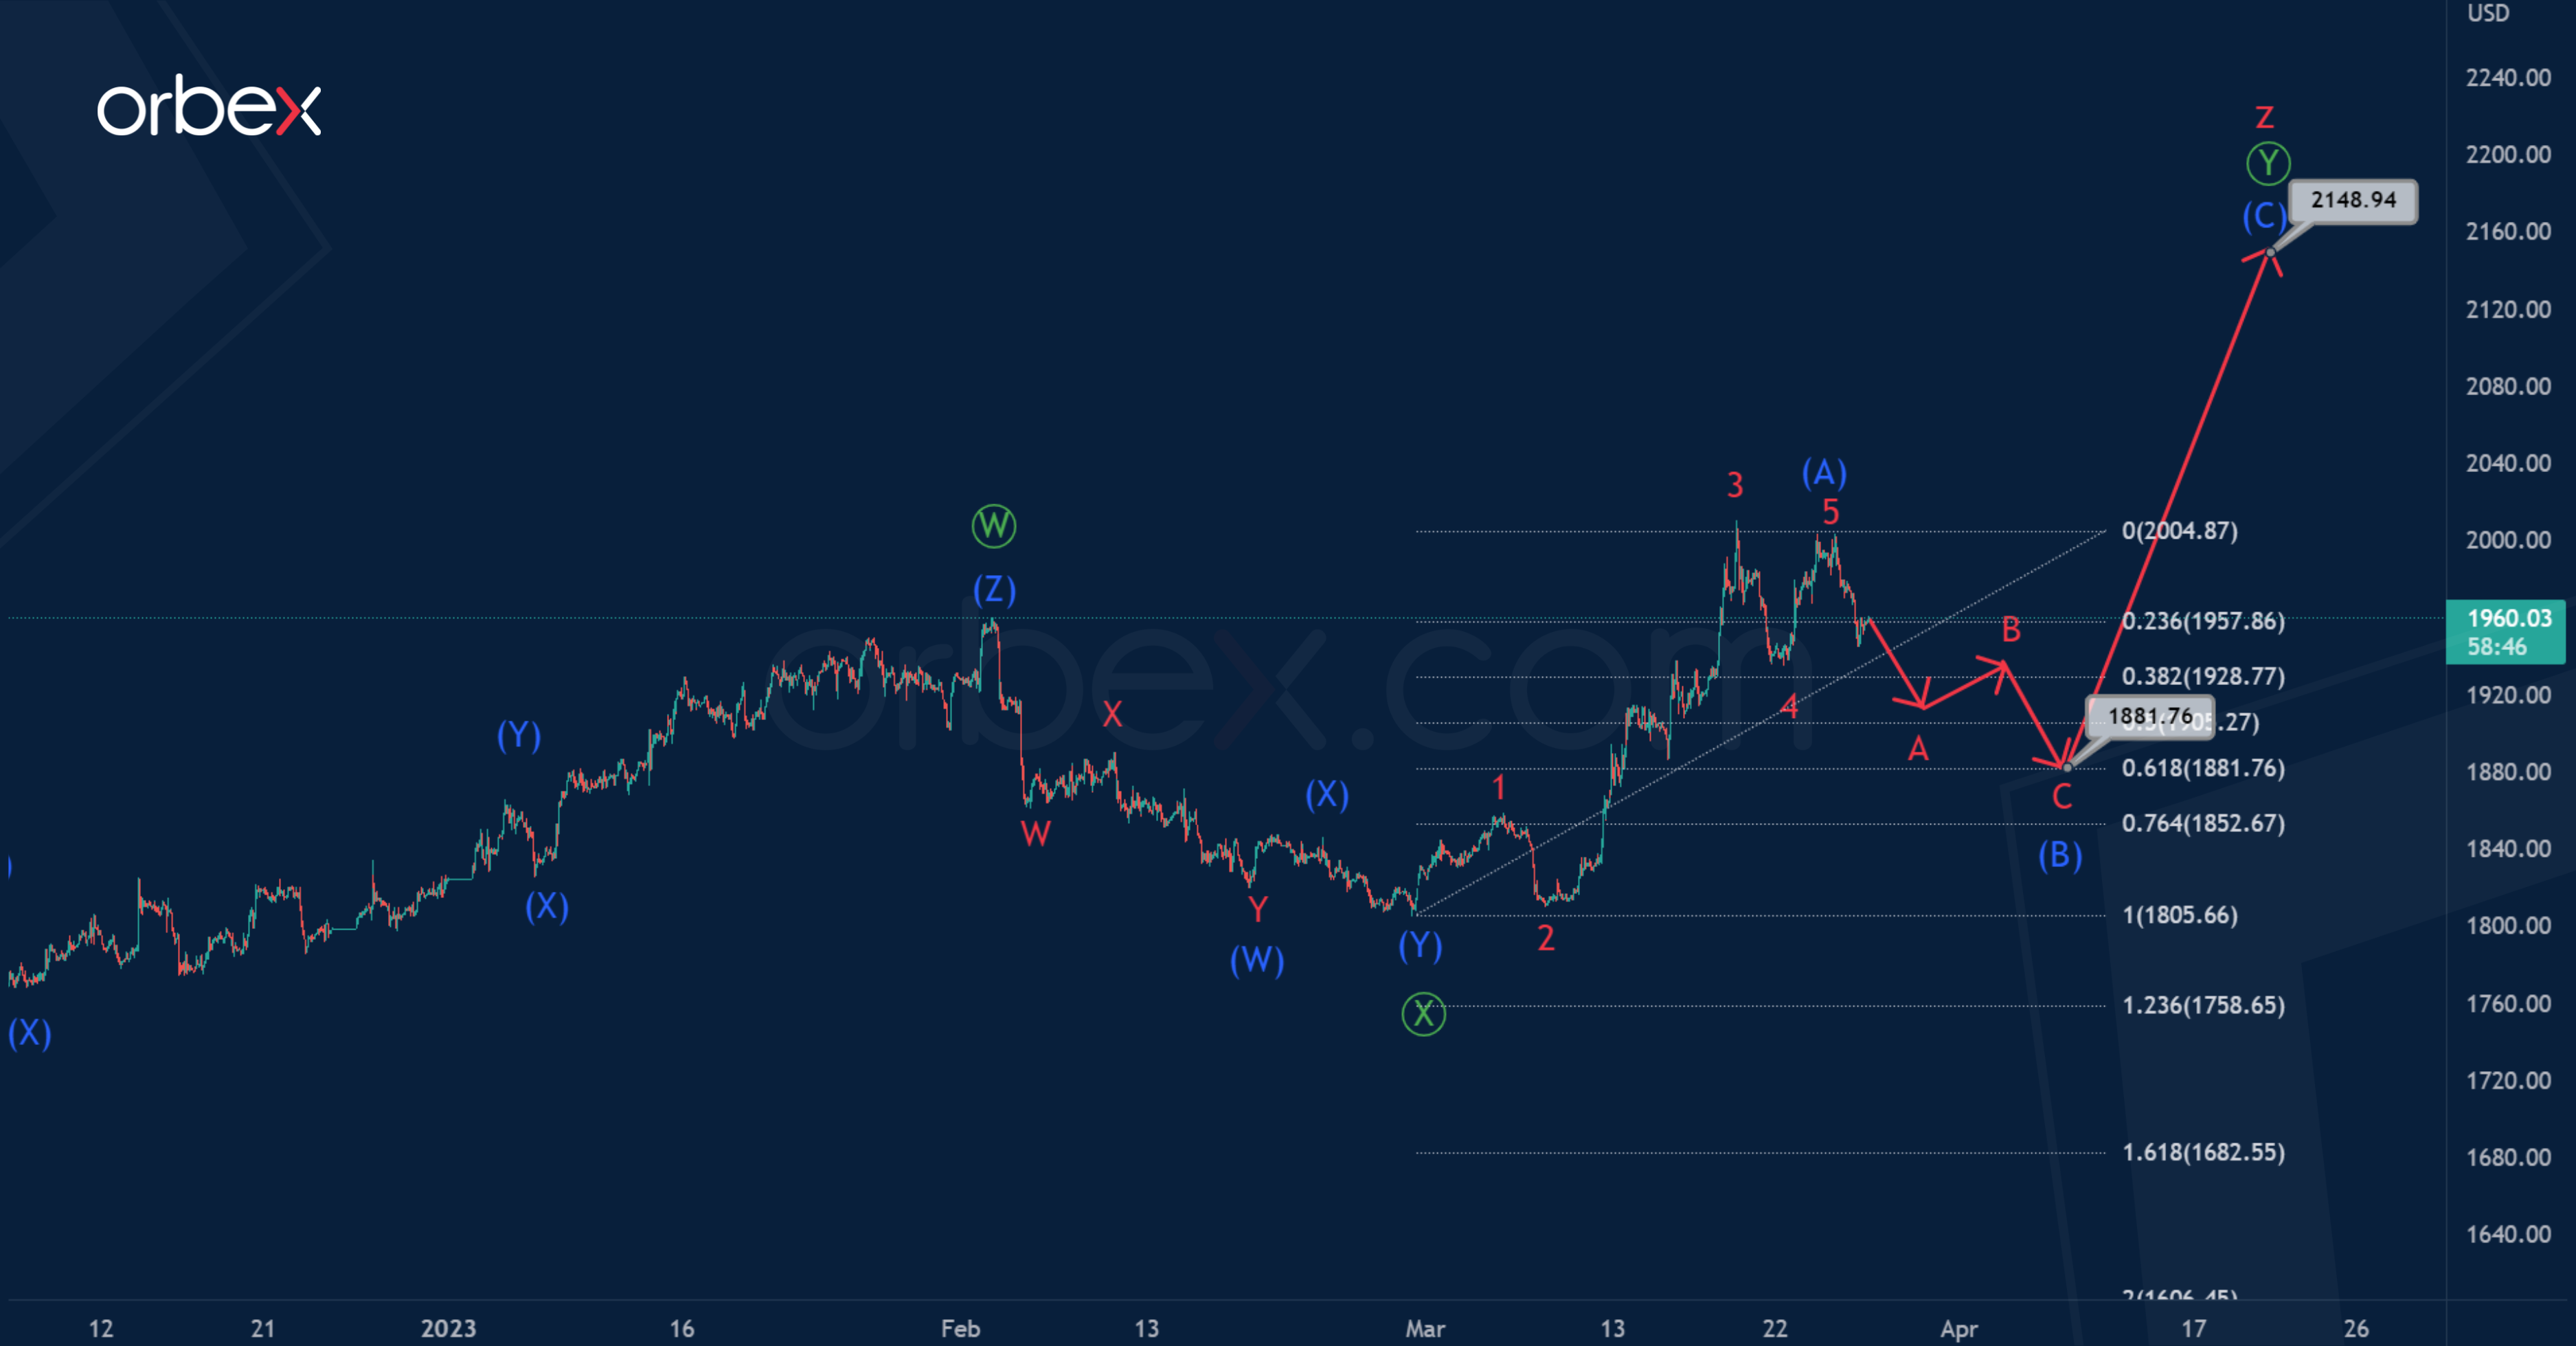
EURJPY Edges Sideways as Progress Remains Capped
EURJPY is moving back and forth from the 200-day simple moving average (SMA) and is consolidating between the 139.00 support and the 143.60 resistance. A paused state of directional momentum is reflected in the Ichimoku lines, while the price rests within the cloud.
The mixed signals in the short-term oscillators further mirror the stall in the price. The MACD has barely inched above its red trigger line in the negative region, while the RSI moves south from its neutral mark.
To the upside, emanating pressure over the last couple of weeks has denied upside moves. If buyers manage to jump above the SMAs around 142.50, a revisit of 143.60 could unfold. Overcoming these constrictions could see resistance develop at the eleven-week high of 145.55. Another leg up could tackle the 146.70 barrier.
Otherwise, if sellers drive the pair below the cloud, the 139.00 round number could interrupt the pair ahead of the 137.40-138.00 support region. Should it fail to do so, then the market could switch to strongly negative.
Summarizing, initially the confines of 139.00 or 143.60 would need to be breached to revive directional momentum.
EUR/USD Daily Outlook
Daily Pivots: (S1) 1.0762; (P) 1.0782; (R1) 1.0820; More...
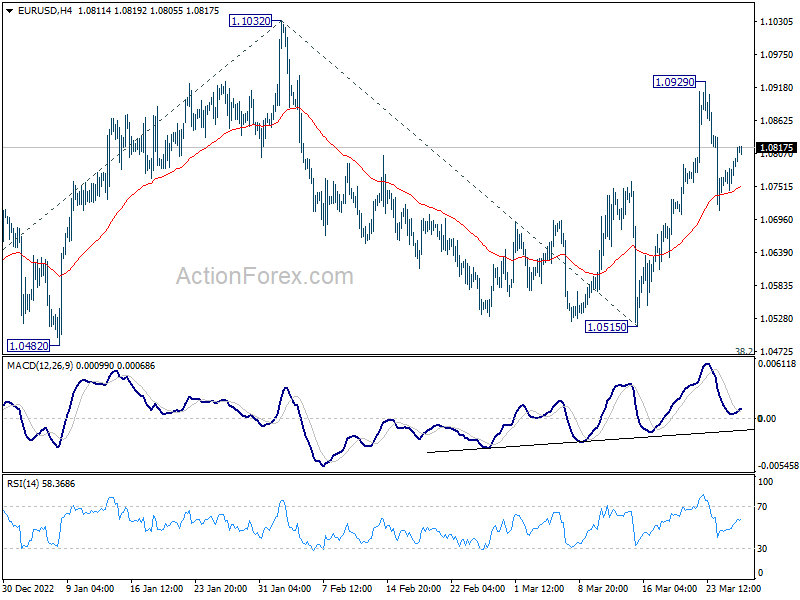
Intraday bias in EUR/USD remains neutral for the moment. Strong rebound from current level, followed by break of 1.0929 will reaffirm near term bullishness, and extend the rise from to retest 1.1032 high. Firm break there will resume larger up trend from 0.9534 to 1.1273 fibonacci level next. However, sustained trading below 4 hour 55 EMA (now at 1.0750) will likely extend the corrective pattern from 1.1032 and bring deeper decline back towards 1.0515.
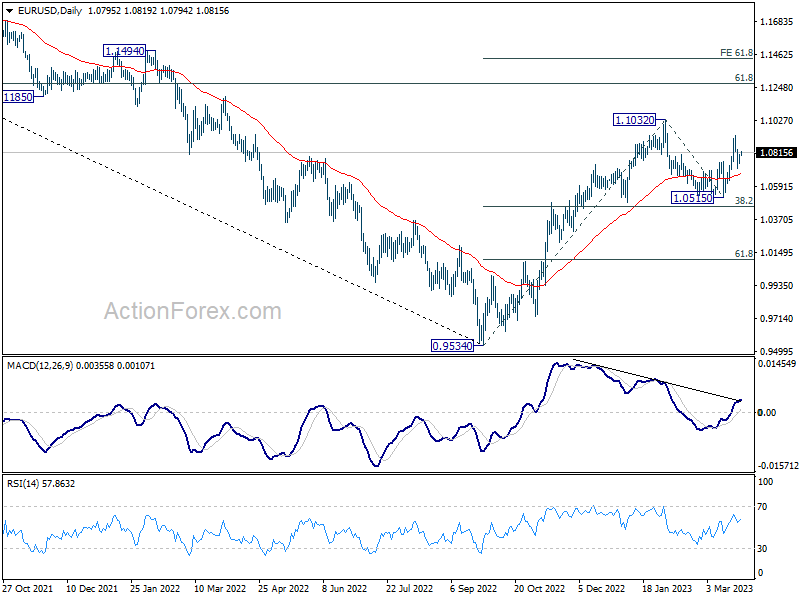
In the bigger picture, rise from 0.9534 (2022 low) is in progress with 38.2% retracement of 0.9534 to 1.1032 at 1.0460 intact. The strong support from 55 week EMA (now at 1.0623) was also a medium term bullish sign. Next target is 61.8% retracement of 1.2348 (2021 high) to 0.9534 at 1.1273. Sustained break there will solidity the case of bullish trend reversal and target 1.2348 resistance next (2021 high).
GBP/USD Daily Outlook
Daily Pivots: (S1) 1.2240; (P) 1.2267; (R1) 1.2314; More...
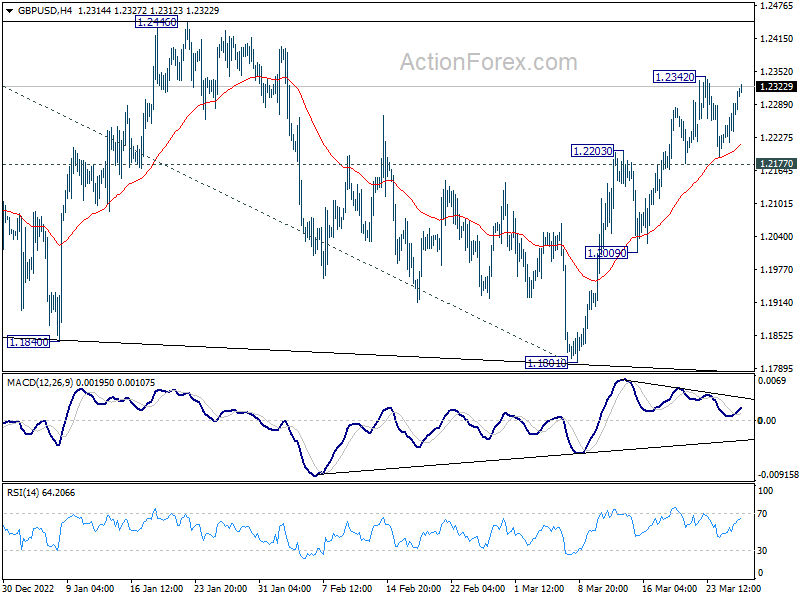
Intraday bias in GBP/USD remains neutral as range trading continues With 1.2177 minor support intact, further rally is expected. On the upside, break of 1.2342 will target 1.2445/6 resistance zone. Firm break there will resume larger rally from 1.0351, and target 1.2759 fibonacci level. On the downside, however, break of 1.2177 minor support will argue that corrective pattern from 1.2445 is extending with another falling leg, and turn bias to the downside for 1.2009 support instead.
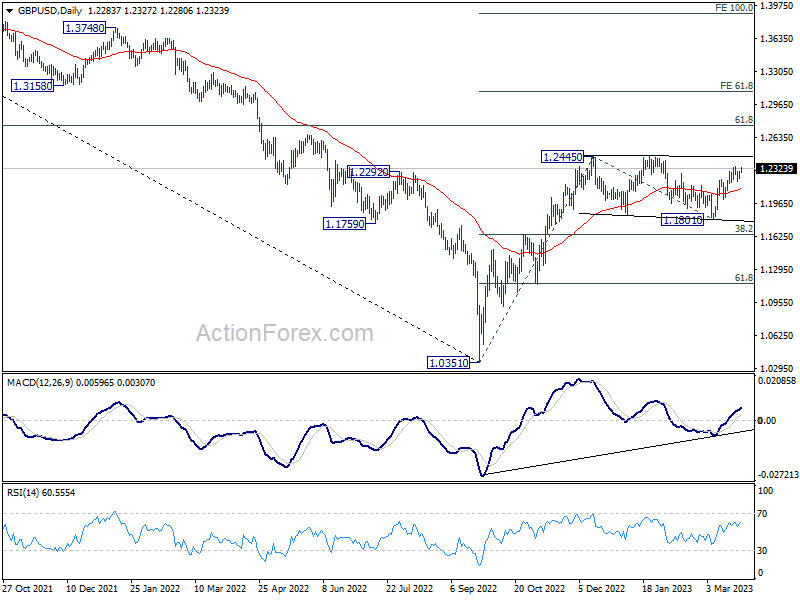
In the bigger picture, price action from 1.2445 are seen as a corrective pattern to rise from 1.0351 medium term bottom (2022 low). Resumption of the rally from 1.0351 is expected and break of 1.2446 will target 61.8% retracement of 1.4248 (2021 high) to 1.0351 at 1.2759. This will remain the favored case as long as 38.2% retracement of 1.0351 to 1.2445 at 1.1645 holds.
USD/CHF Daily Outlook
Daily Pivots: (S1) 0.9140; (P) 0.9170; (R1) 0.9186; More...
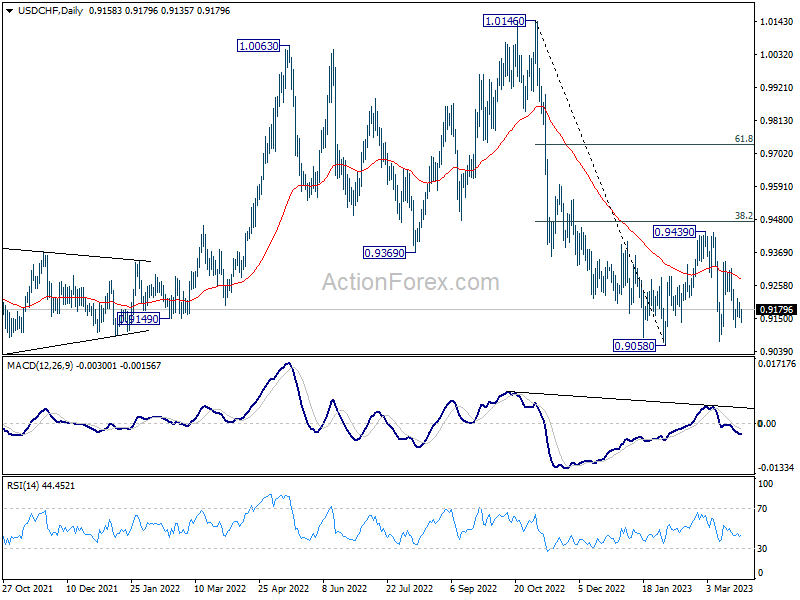
In tar ad ay bias in USD/CHF remains neutral first as range trading is in progress. Outlook is unchanged that corrective pattern from 0.9058 low is in extending. Another rise cannot be ruled out, but upside should be limited by 0.9474 fibonacci level. On the downside, firm break of 0.9058 will resume larger down trend from 1.1046.
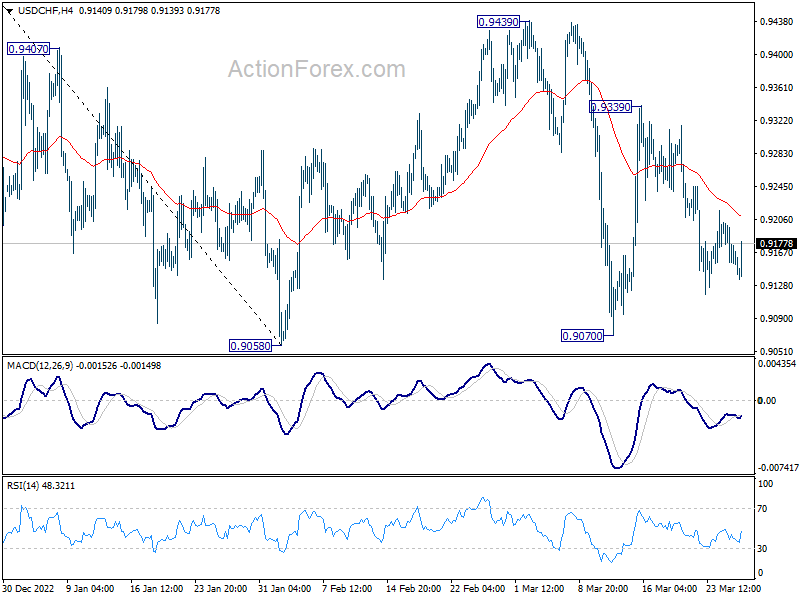
In the bigger picture, fall from 1.1046 (2022 high) should still be in progress with 38.2% retracement of 1.0146 to 0.9058 at 0.9474 intact. Prior rejection by 55 week EMA was a medium term bearish sign. Break of 0.9058 will resume such decline towards 0.8756 support (2021 low). But overall, this fall is still as a leg in the long term range pattern from 1.0342 (2016 high). So, downside should be contained by 0.8756 to bring reversal.
USD/JPY Daily Outlook
Daily Pivots: (S1) 130.79; (P) 131.27; (R1) 132.06; More...
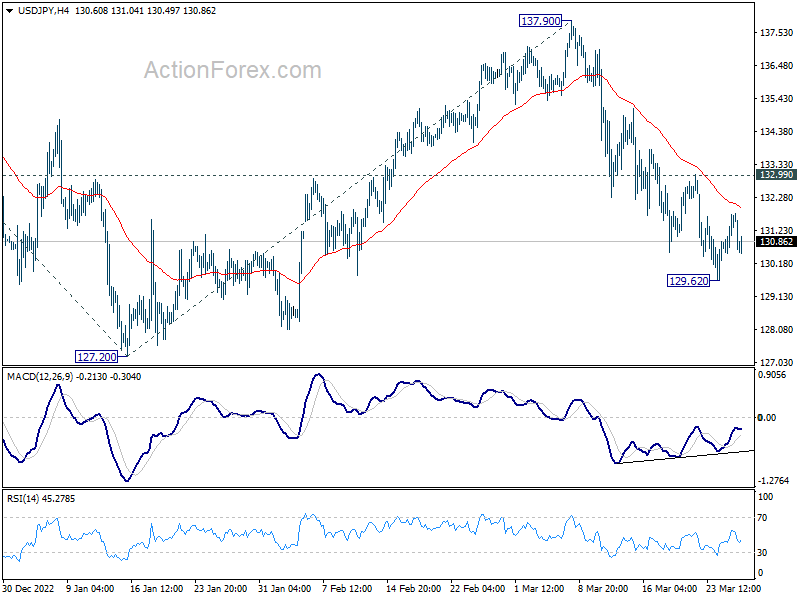
USD/JPY is staying in consolidation above 129.62 temporary low and intraday bias remains neutral. Outlook remains bearish as long as 132.99 resistance holds. Break of 129.62 will target a test on 127.20 low. Decisive break there will resume larger decline from 151.93 to 61.8% projection of 151.93 to 127.20 from 137.90 at 122.61.
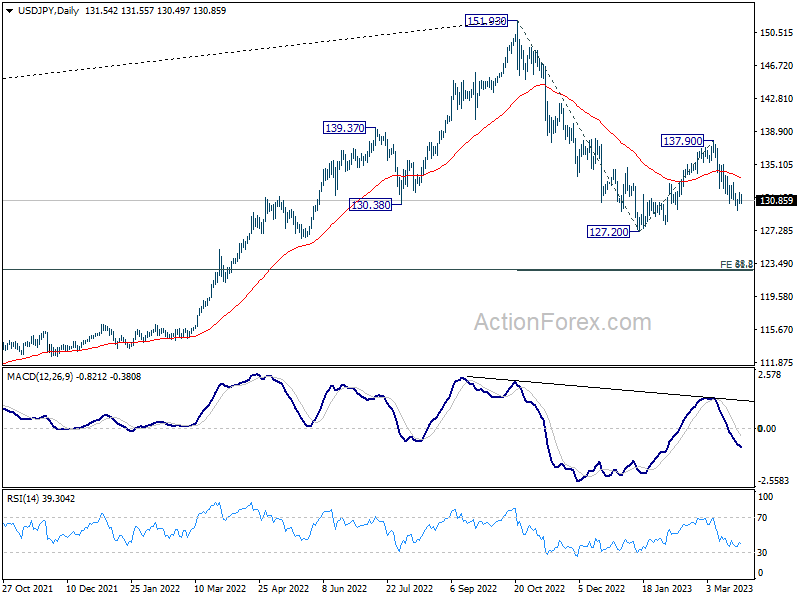
In the bigger picture, rebound from 127.20 should have completed at 137.90 as a corrective move. The down trend from 151.93 (2022 high) is still in progress. Break of 127.20 will resume this down trend and target 61.8% projection of 151.93 to 127.20 from 137.90 at 122.61. This will now be the favored case as long as 137.90 resistance holds.
AUD/USD Daily Report
Daily Pivots: (S1) 0.6635; (P) 0.6650; (R1) 0.6667; More...
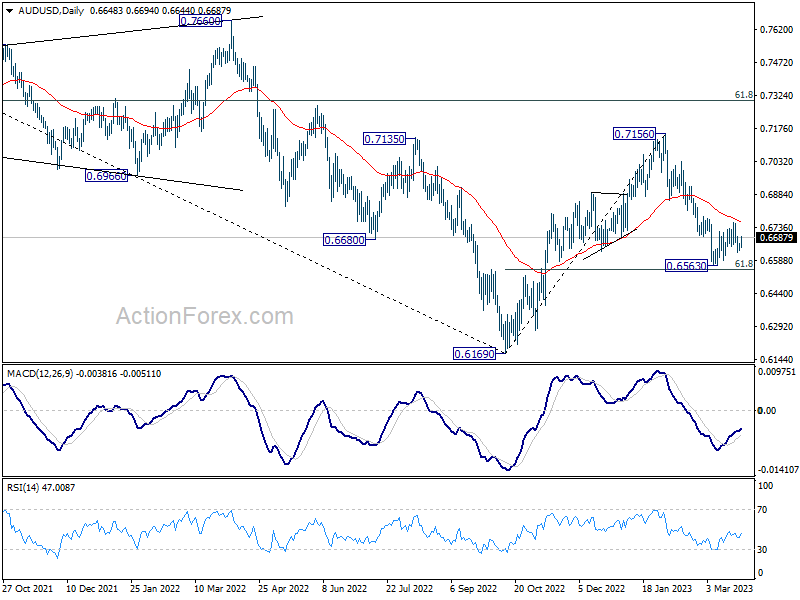
Intraday bias in AUD/USD turned neutral again with current recovery. Corrective pattern from 0.6563 could extend further. But deeper decline is in favor as long as 0.6758 resistance holds. Decisive break of 0.6546 fibonacci level will carry larger bearish implication. On the upside, however, break of 0.6758 resistance will now be a strong signal of bullish reversal and turn bias back to the upside.
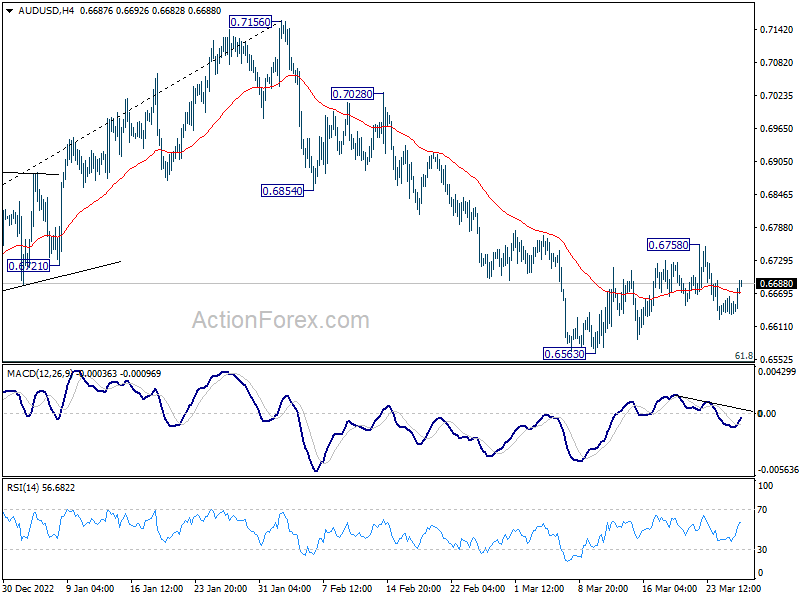
In the bigger picture, as long as 61.8% retracement of 0.6169 to 0.7156 at 0.6546 holds, the decline from 0.7156 is seen as a correction to rally from 0.6169 (2022 low) only. Another rise should still be seen through 0.7156 at a later stage. However, sustained break of 0.6546 will raise the chance of long term down trend resumption through 0.6169 low.
USD Consolidates Gains
EUR/USD finds support
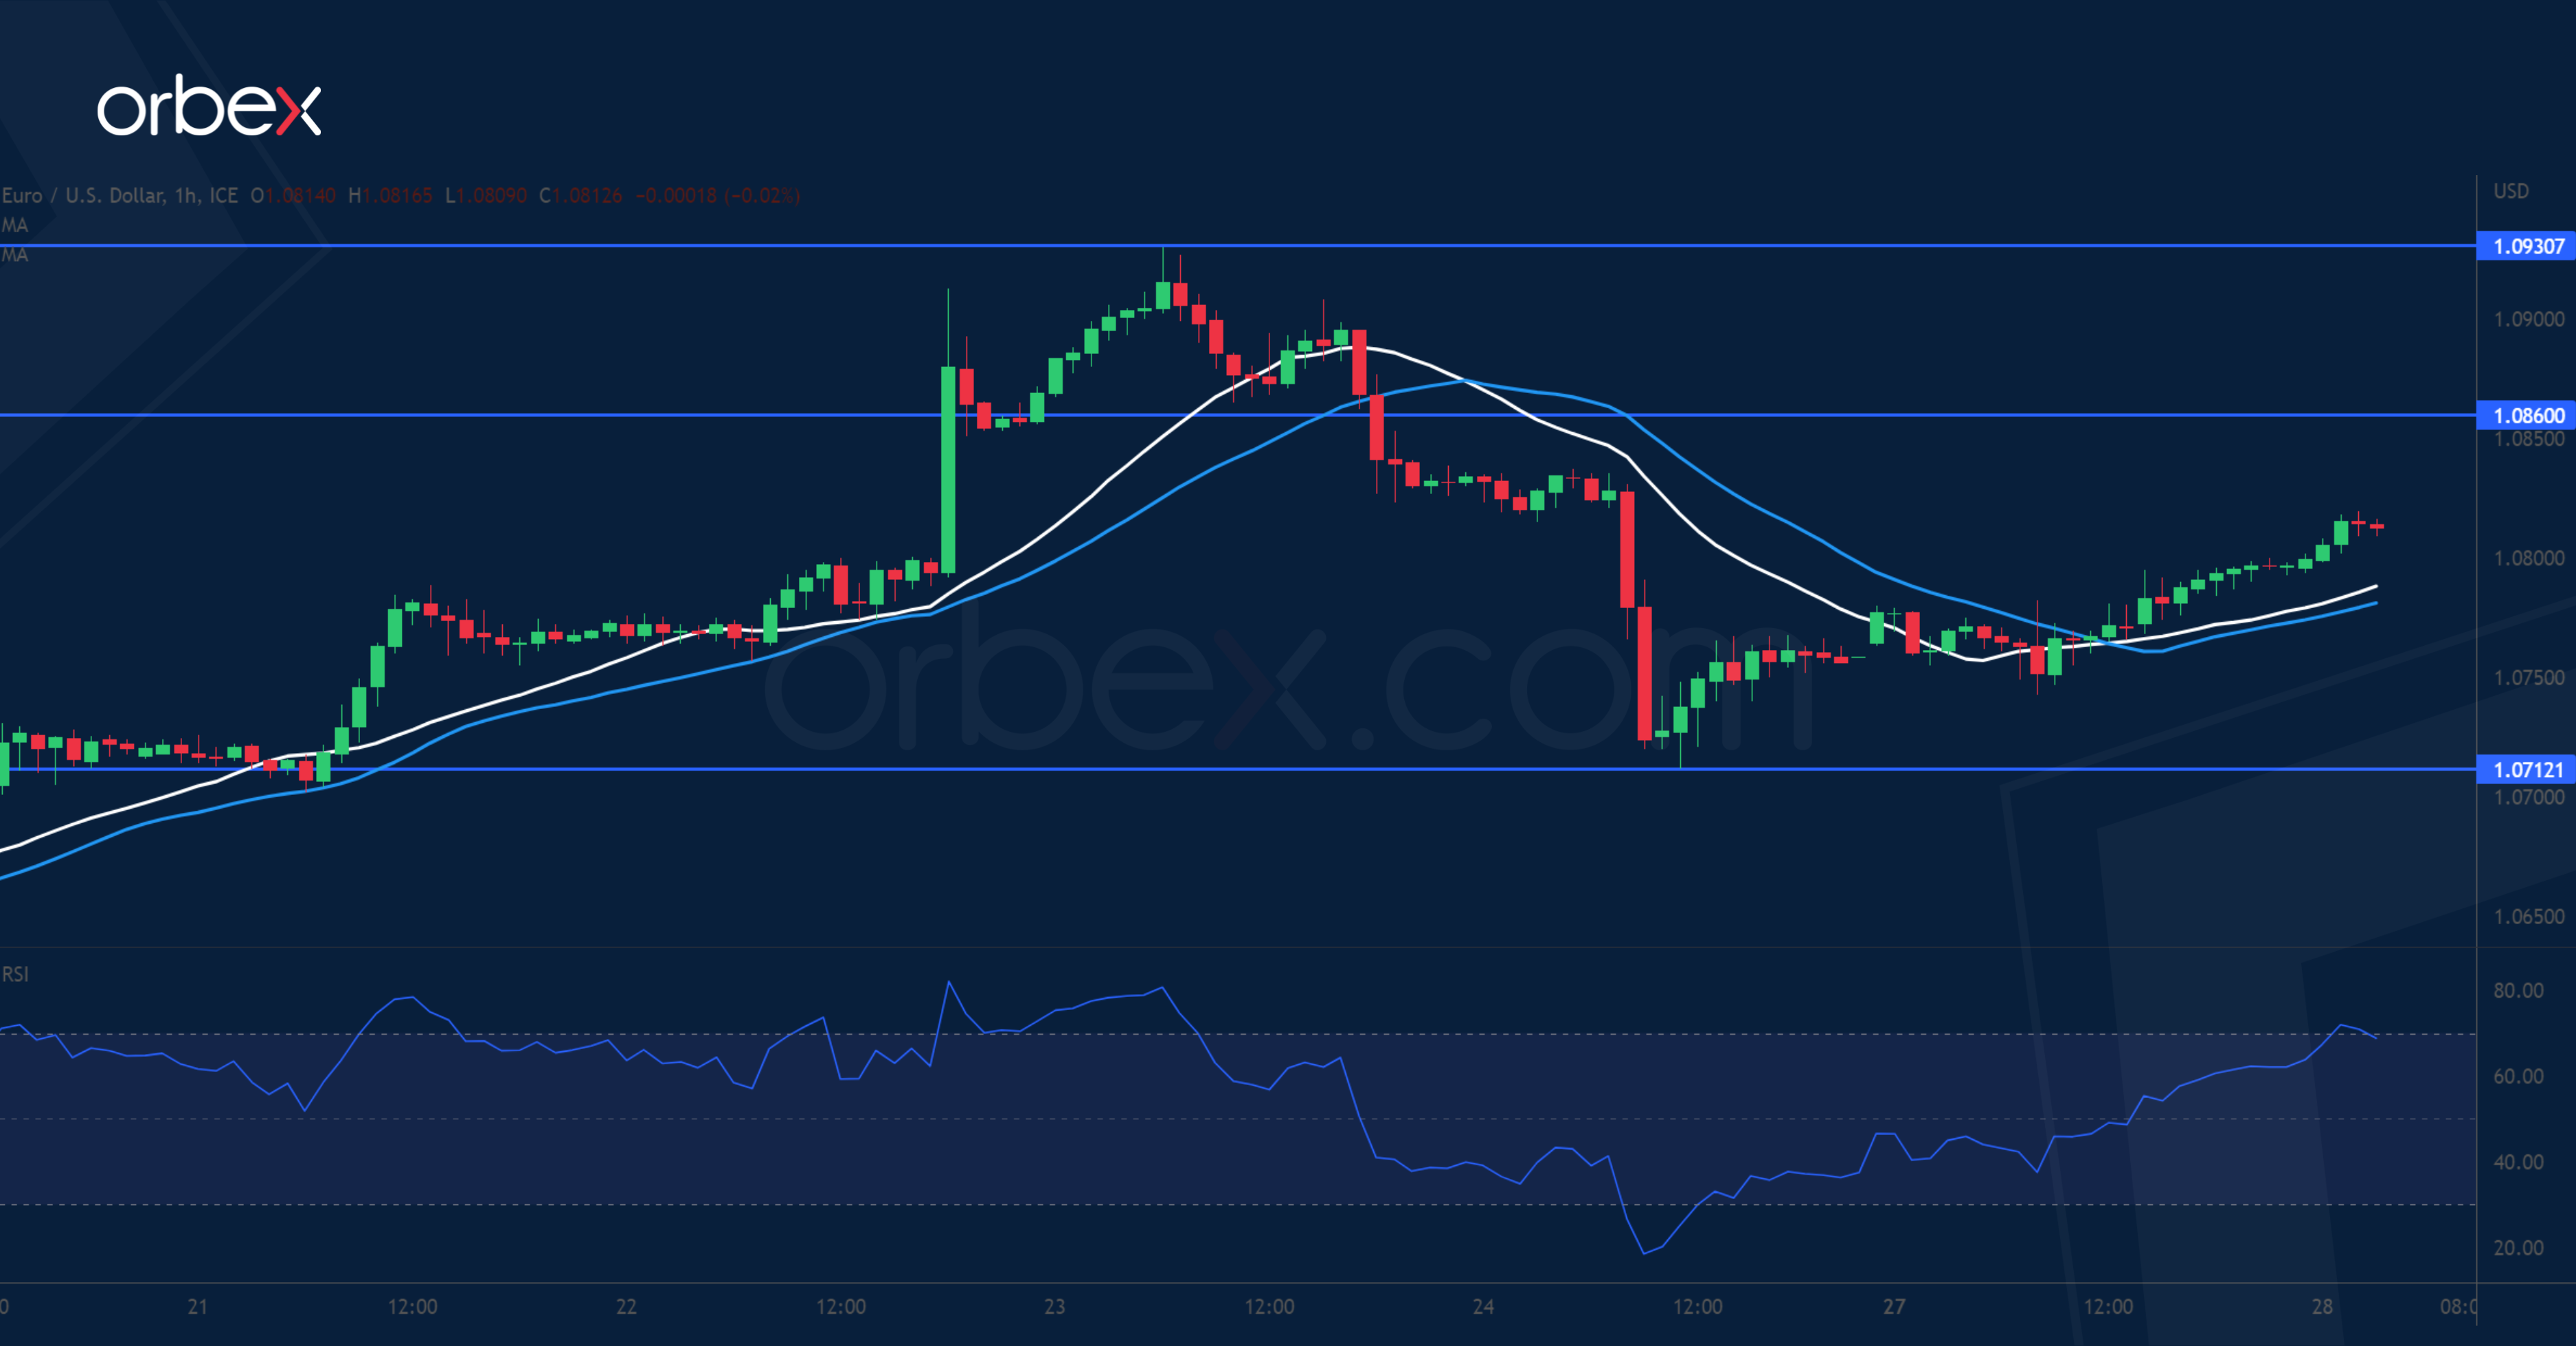
The US dollar pulls back as market sentiment stabilises. Coming off the start of the February sell-off at 1.0930, the pair is looking to keep the correction in check. The base of the bullish breakout at 1.0710 is an important level to retain the momentum. Its breach would dent the short-term optimism and trigger a deeper retracement towards 1.0600. The RSI’s oversold condition attracted some buying interests in the demand zone, but the bulls will need to reclaim 1.0860 before a higher high could materialise.
AUD/USD tests resistance
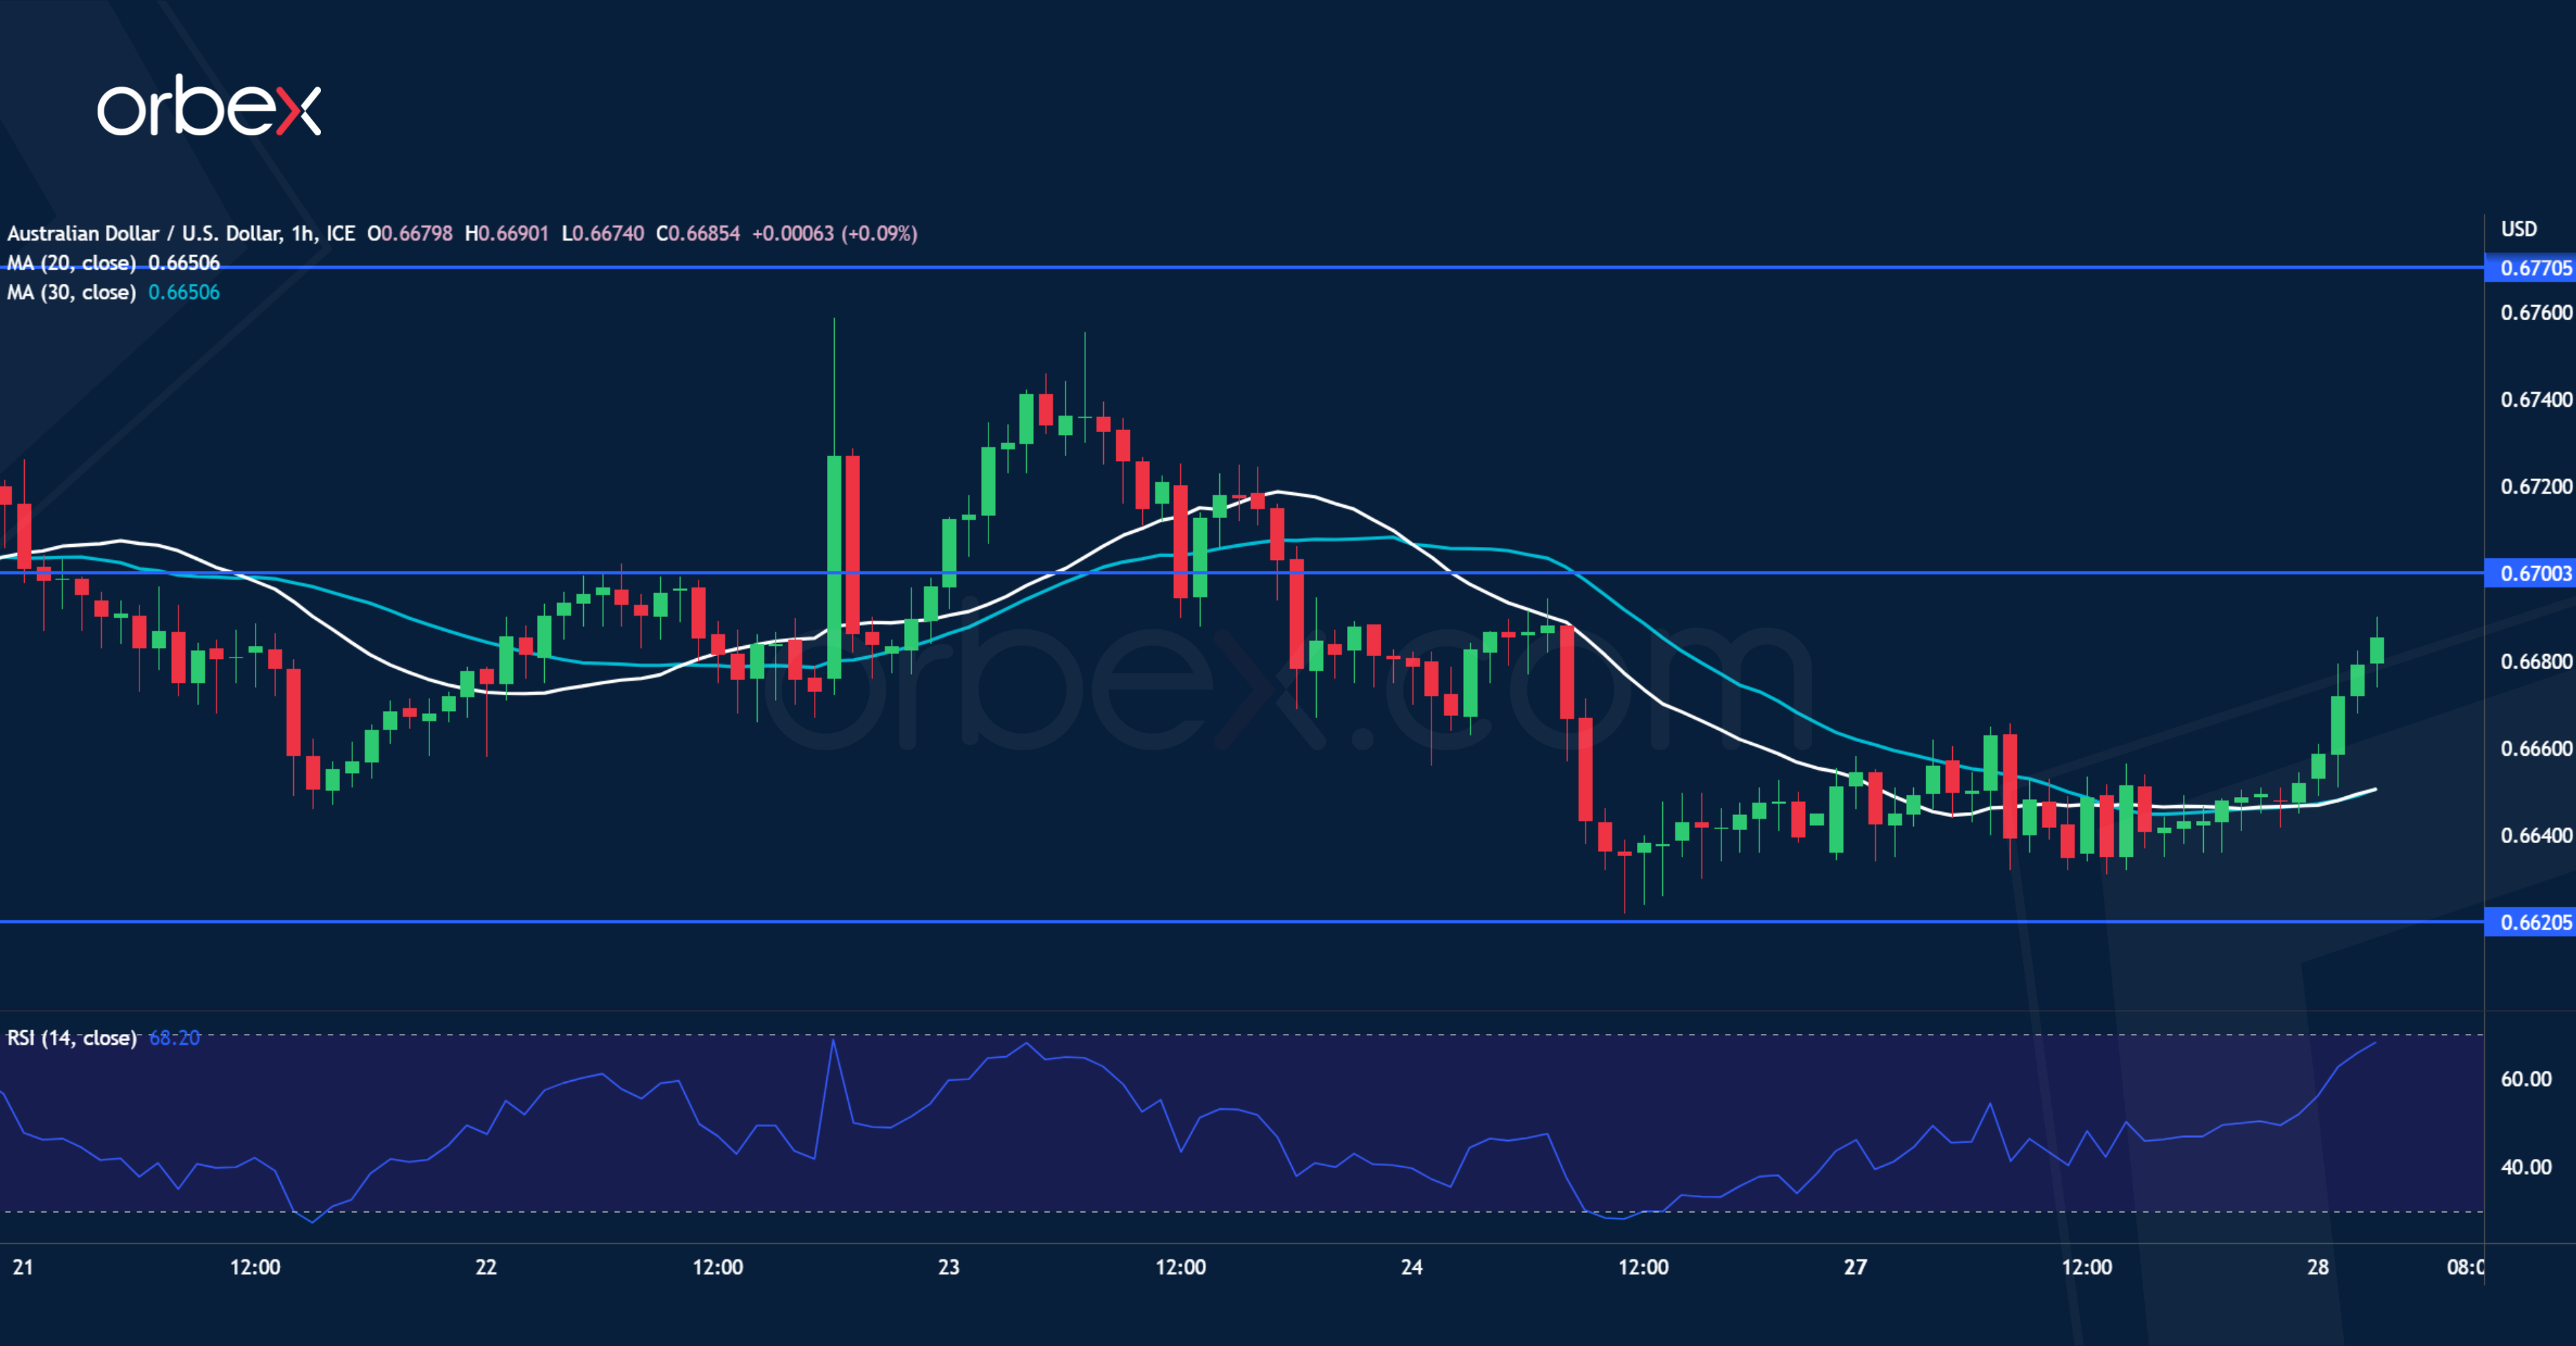
The Australian dollar may struggle over lacklustre retail figures in February. A drop below the swing low of 0.6650 has put the bulls on the defensive and proved that the supply zone around 0.6750 and on the 30- day SMA to be a tough level to crack for now. Sentiment remains cautious and 0.6620 might be buyers’ last chance to turn the tide with 0.6700 as the first hurdle to clear. A bearish breakout would cause a retest of this month’s low at 0.6570 where the aussie could be vulnerable to another leg of sell-off.
US 30 attempts to rebound
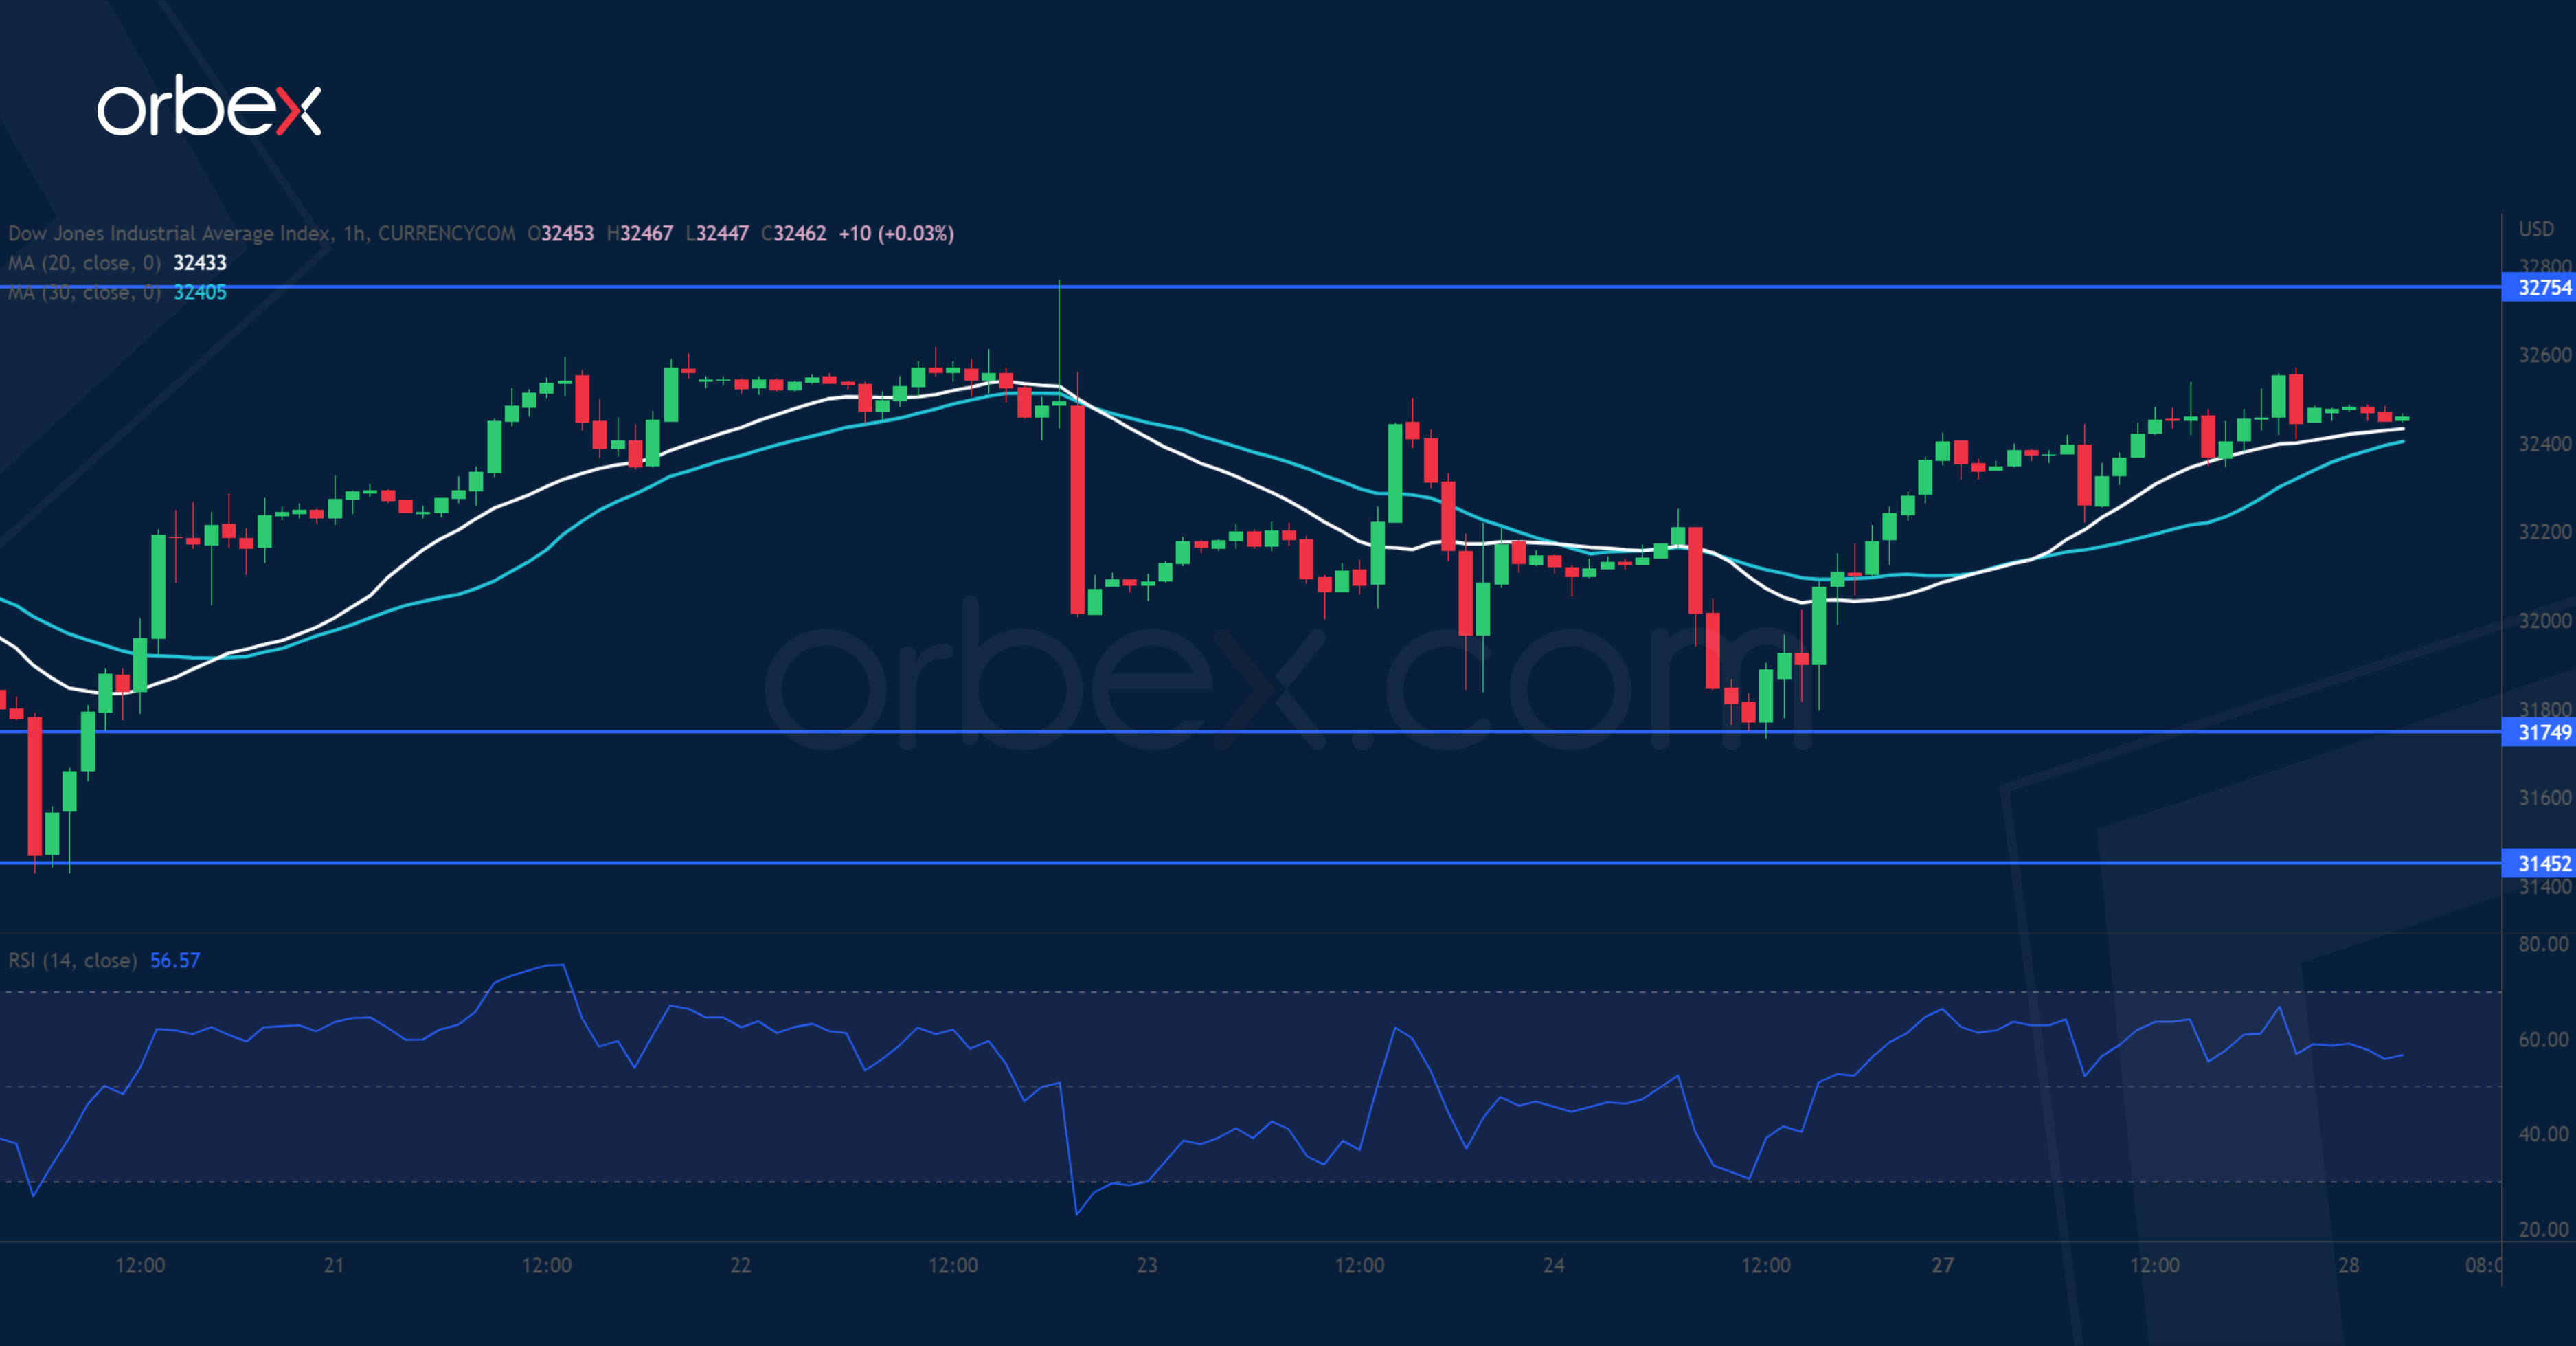
The Dow Jones 30 rallies as news of more emergency lending ease concerns about bank failures. A long spike at the support-turned-resistance of 32750 suggests strong resistance at last week’s breakout attempt. However, solid buying seems to have emerged in the demand zone 31450-31750. A convincing break above 32750 would prompt sellers to cover their positions and help buyers regain control of the direction in the short-term. Then 33500 would be the next target. Failing that, a fall below 31450 would expose 31000.