Sample Category Title
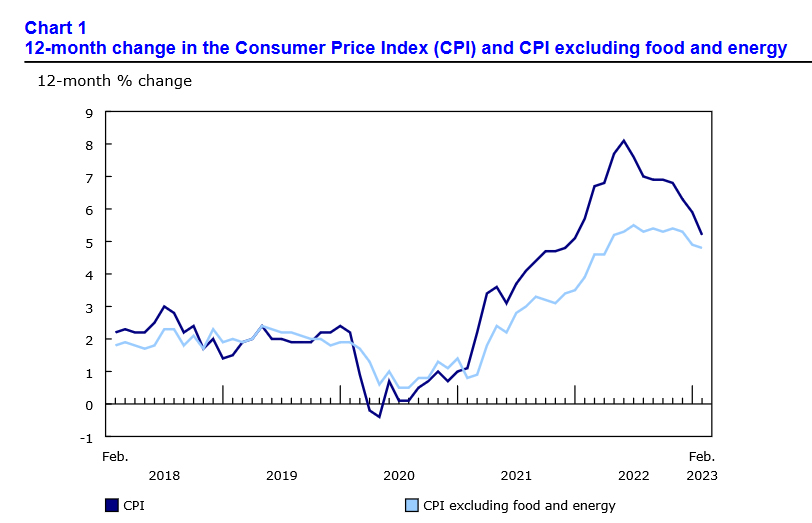
Canada CPI slowed to 5.2% yoy in Feb, below expectation of 5.4% yoy
Canada CPI slowed from 5.9% yoy to 5.2% yoy in February, below expectation of 5.4% yoy. Excluding food and energy, CPI slowed slightly from 4.9% yoy to 4.8% yoy. All-items CPI excluding mortgage interest costs slowed from 5.4% yoy to 4.7% yoy.
On a monthly basis, CPI rose 0.4% mom, slowed from January's 0.5% mom, and below expectation of 0.5% mom. Decline in energy prices were offset by rise in mortgage interest costs.
Meanwhile, CPI median decreased from 5.0% yoy to 4.9% yoy above expectation of 4.8% yoy. CPI trimmed fell from 5.1% yoy to 4.8% yoy, below expectation of 4.9% yoy. CPI common declined from 6.6% yoy to 6.4% yoy, below expectation of 6.5% yoy.
Euro Extends Rally, Market Turmoil Eases
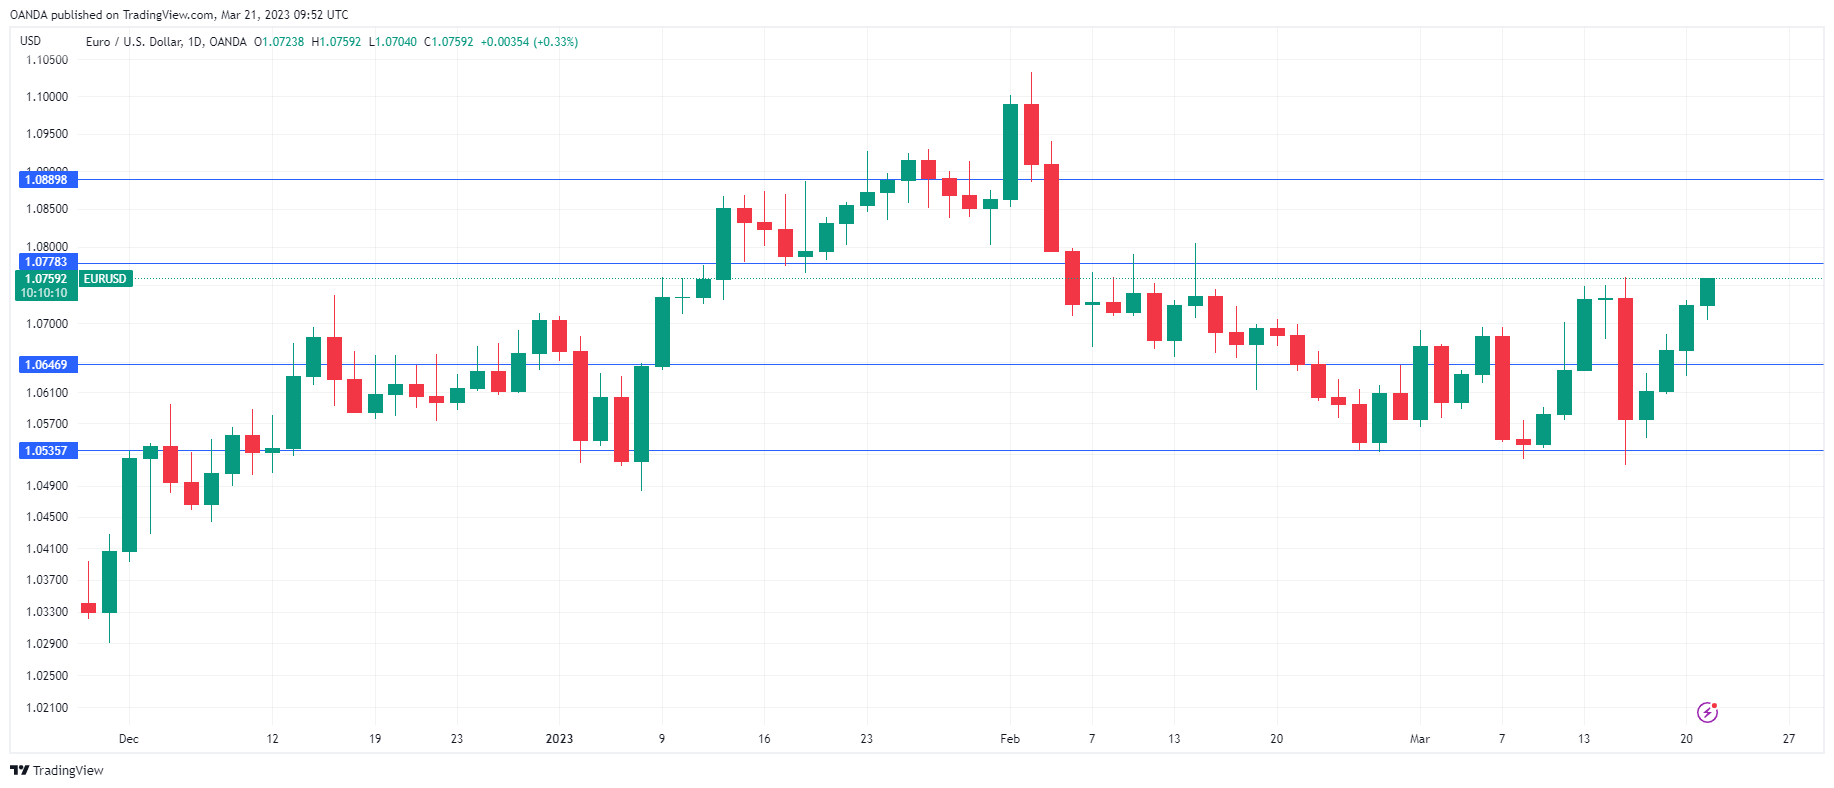
The euro has put together a 3-day rally and is up again on Tuesday. In the European session, EUR/USD is trading quietly at 1.0756, up 0.30%.
Financial markets settle down
Let’s start with some good news. European stock markets have settled down and are in positive territory. The euro took a bath last Wednesday and plunged 1.47% as Credit Suisse shares tumbled, but the currency has battled back and recovered these losses. The emergency takeover of Credit Suisse by UBS and the joint announcement by six major central banks to boost liquidity have provided some reassurance to the markets that the banking system is not in danger of collapse.
That’s not to say that this nasty bank crisis is behind us. Investors are still trying to come to terms with the lightning collapse of three US banks and Credit Suisse, the second-largest bank in Switzerland, all in just 11 days. Another US bank, First Republic, received an emergency injection of $30 billion from some major US banks, but this may not prove to be enough, as depositors are estimated to have removed $89 billion and the bank’s shares are in freefall.
In light of the bank crisis, central banks will have to weigh their moves carefully and re-evaluate rate policy. The ECB didn’t flinch and delivered a 50-basis point move as promised. Had the ECB decided not to go ahead with the 50-bp hike, it risked losing credibility. As well, the ECB’s primary focus remains containing inflation. With eurozone inflation running at an 8.5% clip, the ECB needed another oversize rate hike.
Could the financial crisis turn out to be a blessing in disguise? Perhaps, according to ECB President Lagarde. On Monday, Lagarde told European lawmakers that market turmoil could dampen demand and “might actually do part of the work that would otherwise be done by monetary policy and interest rate hikes”. Lagarde reiterated that more rate hikes were needed to curb inflation, but didn’t make any commitments as to the pace of rate hikes, which makes sense, given that the current crisis is not over.
EUR/USD Technical
- EUR/USD is putting pressure on resistance at 1.0778. Next is 1.0890
- There is support at 1.0647 and 1.0535
EUR/USD: Daily Cloud Twist Continues to Attract Bulls
The Euro is holding firm tone on Tuesday morning and extending advance into fourth straight day.
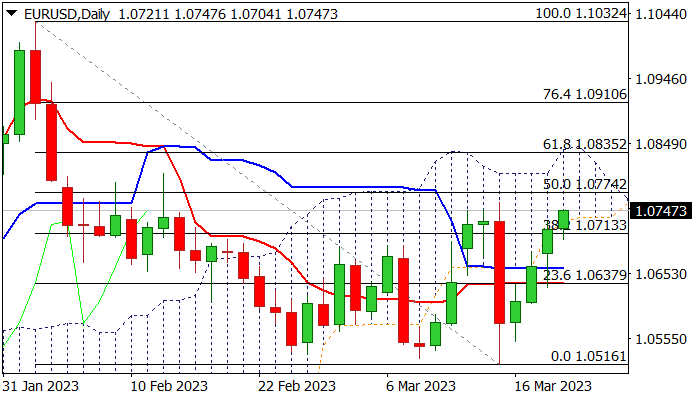
Near-term action continues to advance along with rising daily Ichimoku cloud base, as the cloud twists next week (1.0758) and attracts bulls.
Bullish daily studies contribute to positive near-term outlook, as bulls broke through pivotal Fibo barrier at 1.0718 (38.2% of 1.1032/1.0516 descend) and pressure next key resistance at 1.0759 (Mar 15 high / top of the recent range.
Firm break here is needed to signal an end of a month-long sideways trading and confirm a higher base at 1.0520 zone (lows of Mar 8,15), which would open way for further recovery of 1.1032/1.0516 pullback.
Converged and parallel-running daily Kijun-sen and Tenkan-sen (although still in bearish configuration) offer supports.
Kijun-sen (1.0660) should contain dips to keep bulls in play, while drop and close below Tenkan-sen (1.0637) would weaken near-term structure and shift immediate focus to the downside.
Markets await today’s key releases (German / EU ZEW Economic sentiment) for fresh signals, as both indicators are forecasted to show significantly lower values in March in comparison to February).
Res: 1.0759; 1.0778; 1.0838; 1.0874.
Sup: 1.0704; 1.0660; 1.0637; 1.0585.
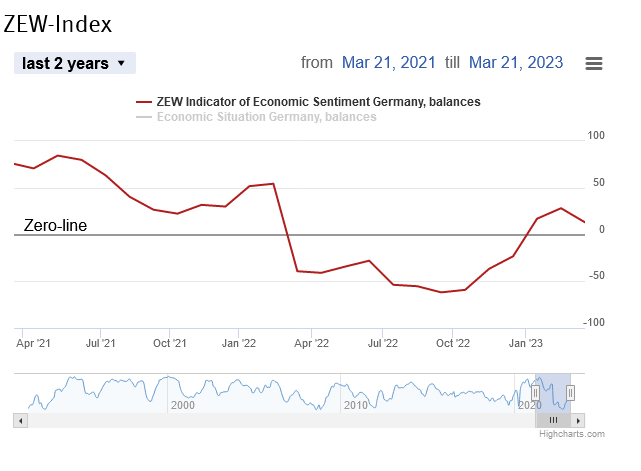
German ZEW fell sharply to 13 in Mar, reflecting financial markets pressure
German ZEW Economic Sentiment deteriorated sharply from 28.1 to 13.0 in March, below expectation of 14.9. Current Situation index also dropped from -45.1 to -46.5, below expectation of -44.3.
Eurozone ZEW Economic Sentiment dropped from 29.7 to 10.0, below expectation of 16.0. Eurozone Current Situation dropped -3 pts to -44.6.
ZEW President Professor Achim Wambach said: "The international financial markets are under strong pressure. This high level of uncertainty is also reflected in the ZEW Indicator of Economic Sentiment.
"The assessment of the earnings development of banks has deteriorated considerably, although it still remains slightly positive. The estimates for the insurance industry have also declined significantly."
Bitcoin Cools Down ahead of Fed
Market picture
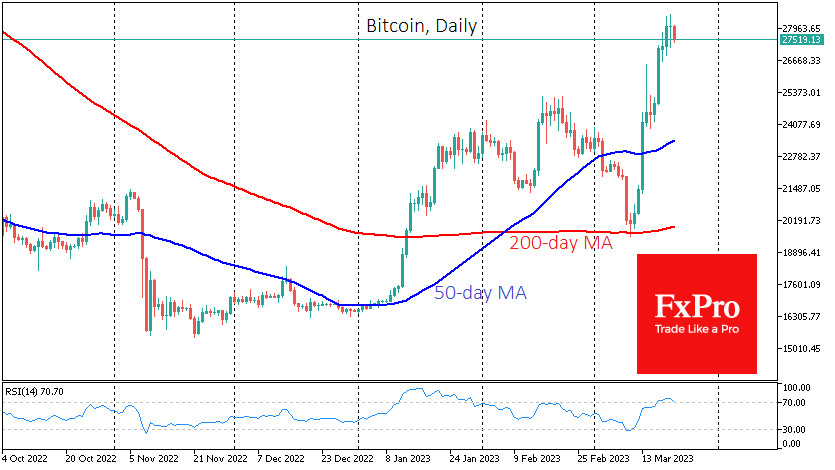
Bitcoin selling intensifies as it touches the $28K level. The leading cryptocurrency has lost 2.2% over the past 24 hours, but this is a minor pullback after a more than 40% gain since 10 March. This pause will allow Bitcoin to “cool down” and create opportunities for another leg up. Nevertheless, the risks of a deeper correction remain elevated, with the first significant line of defence likely to be the $26K (76.4% of the last rally) and the second at $25K (61.8% of the rally).
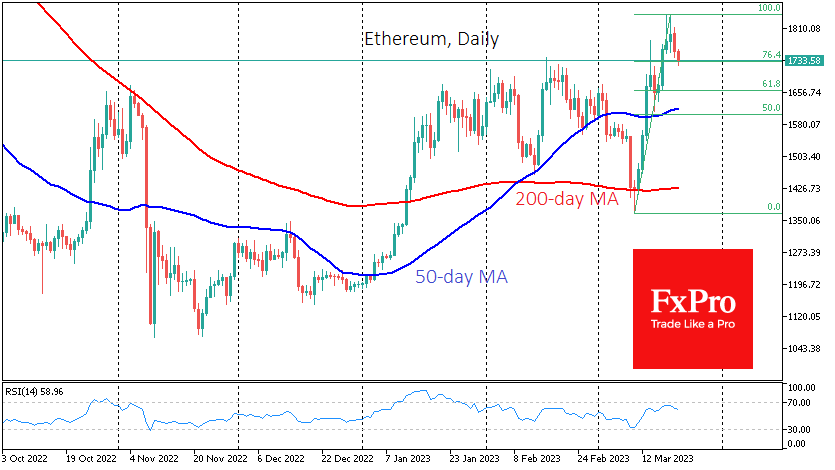
Interestingly, Ethereum has had a less impressive flight and remains heavier, pulling back to $1730 (76.4% of the original rally). Above $1700 is also the area of previous local highs for the second-largest cryptocurrency.
We should be prepared for increased market profit-taking before the Fed’s decision. The central bank must choose between fighting inflation (negative for crypto) and supporting the banking system (positive for markets).
According to CoinShares, investments in crypto funds fell by $95 million last week, marking the sixth consecutive week of outflows. Bitcoin investments decreased by $113 million and Ethereum by $13 million. Investment in funds that allow shorting of bitcoin increased by $35 million.
News background
“Bitcoin is volatile but has never needed a bailout like banks. It has no CEO. No one can print coins out of thin air,” said Changpeng Zhao, head of Binance.
Bitcoin has entered the bull market phase, according to CryptoQuant founder Ki Yun-Ju, who cited optimistic signals from on-chain indicators.
The US Federal Deposit Insurance Corporation (FDIC) has sold Signature Bank without its cryptocurrency division. As of 20 March, the 40 former Signature branches will be operated by Flagstar Bank.
EURJPY Fails to Rise Above 200-day SMA
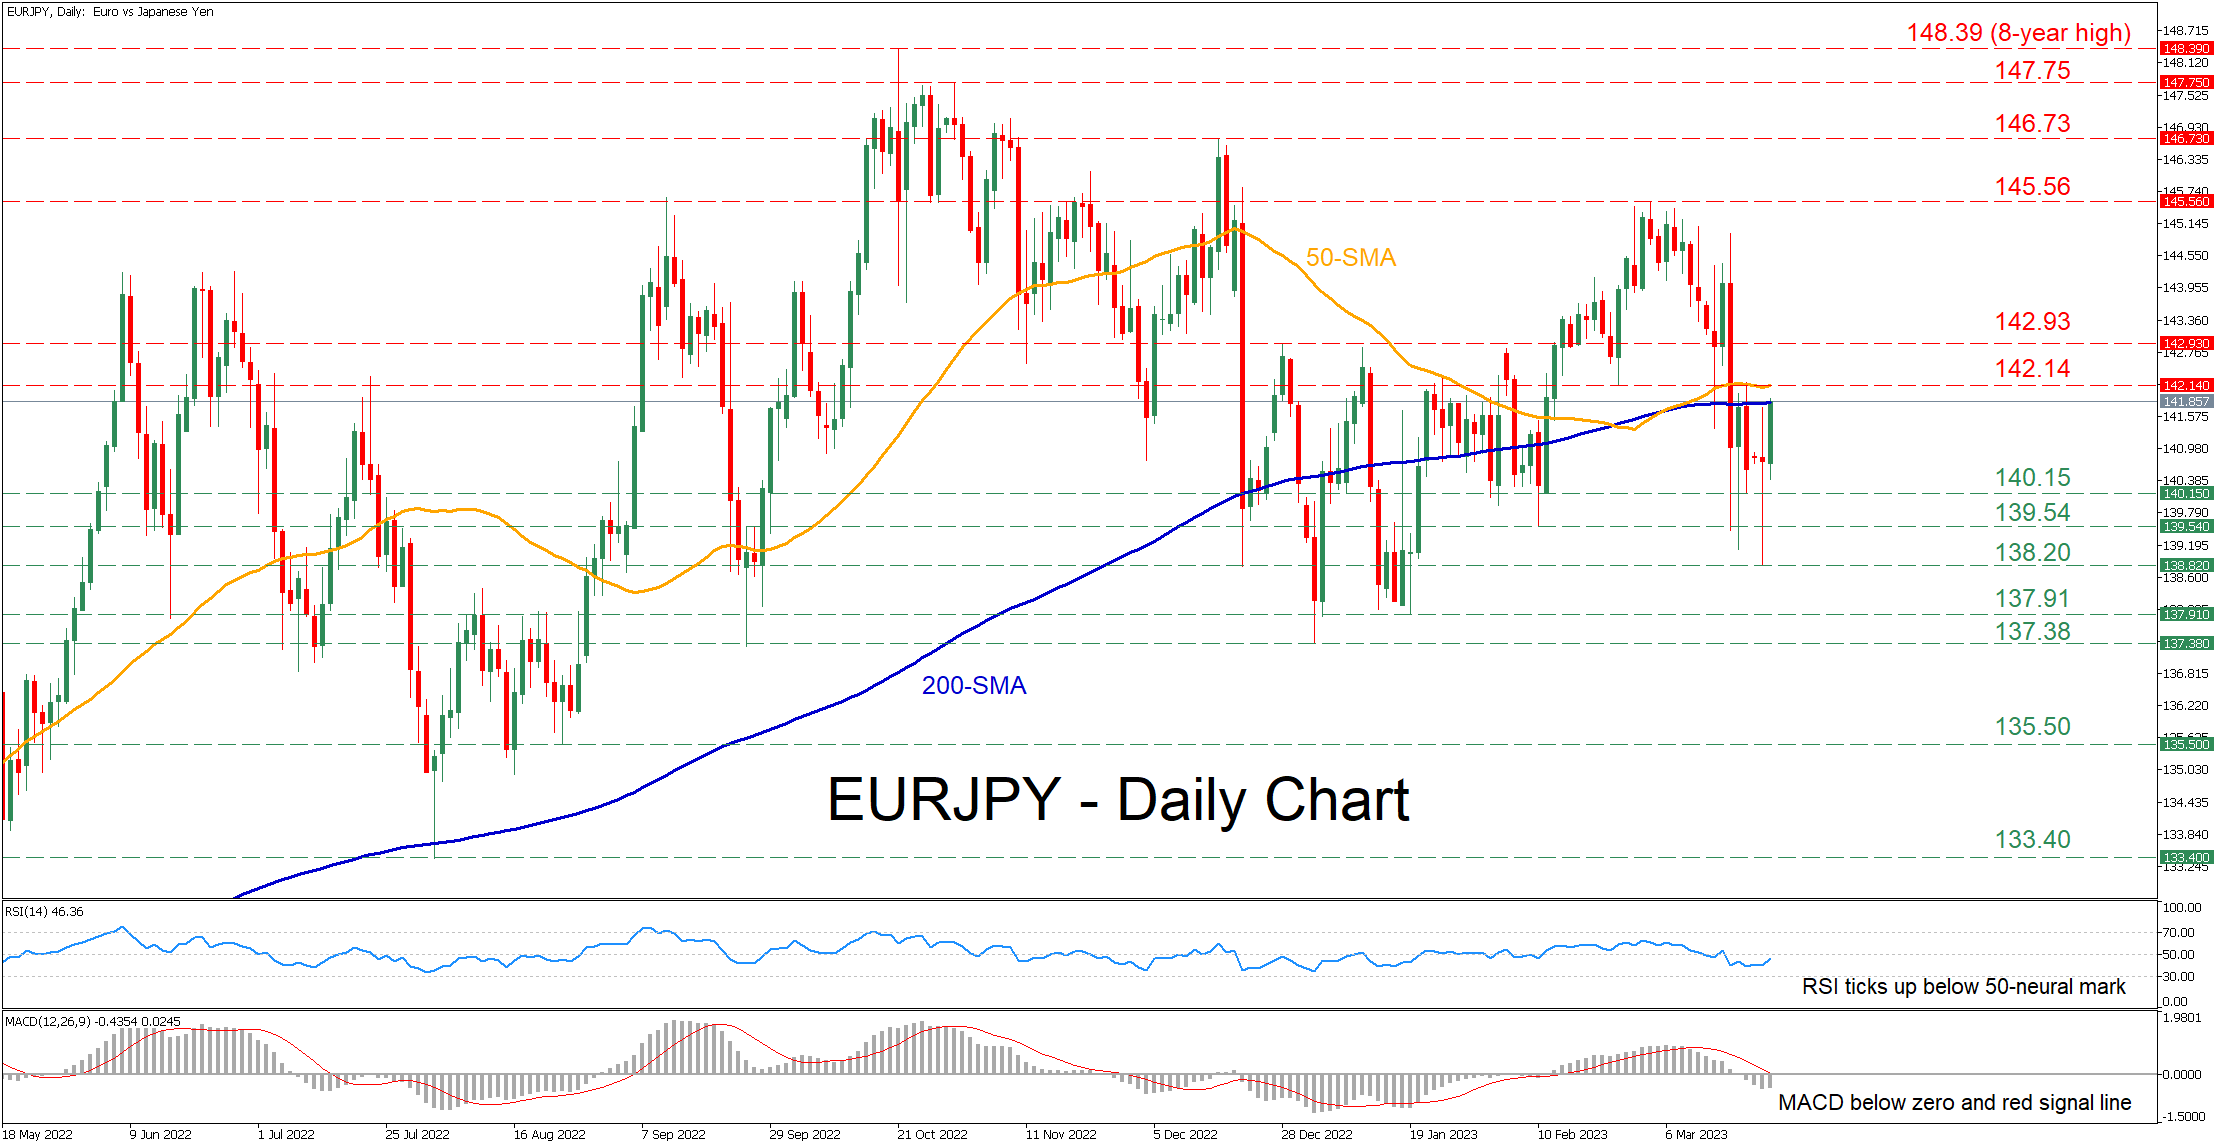
EURJPY has been under selling pressure after its latest advance got rejected at the 145.56 territory in early March. Even though the pair managed to halt its retreat and attempt a rebound, its 200-day simple moving average (SMA) has repeatedly curbed the upside.
The momentum indicators currently suggest that near-term risks are tilted to the downside. Specifically, the RSI is ticking upwards but remains below its 50-neutral mark, while the MACD histogram is below both zero and its red signal line.
If the pair extends its decline, the 140.15 support could act as the first line of defence. Sliding beneath that floor, the price could descend towards 139.54 before the March bottom of 138.20 appears on the radar. Even lower, further declines may cease at the 137.91 barrier.
Alternatively, should the bulls manage to propel the price above its 200-day SMA, initial resistance might be found at 142.14, which overlaps with the 50-day SMA. Violating that zone, the pair could challenge the 142.93 resistance territory. If that hurdle fails, the 2023 high of 145.56 may come under examination.
In brief, EURJPY seems unable to alter its short-term picture back to positive as the 200-day SMA continues to act as strong resistance. Therefore, the pair could experience more losses in case the price fails again to reclaim this barricade.
XAGUSD: Silver Reaction Higher from Equal Legs Area
Hello Traders, in this article we will analyze how XAGUSD (Silver), reacted higher from equal legs area. With the cycle from 02.02.2023 decline in Silver having a clear connector we were able to project the area in which we were expecting a reaction to take place. Here at Elliott Wave Forecast, we call these areas, equal legs or blue boxes. As you may seen within our charts. These are extreme areas in which buyers and sellers fight and agree into a reaction. One of the 2 sides should win and take control over the next move and cycle.
In the case of Silver it reached equal legs area between wave (A) and (B) of (C) to end 5 waves decline and the reaction higher took place. Let’s have a look on how we saw it during the 4 hour update from 03.08.2023
XAGUSD 4 Hour update 03.08.2023
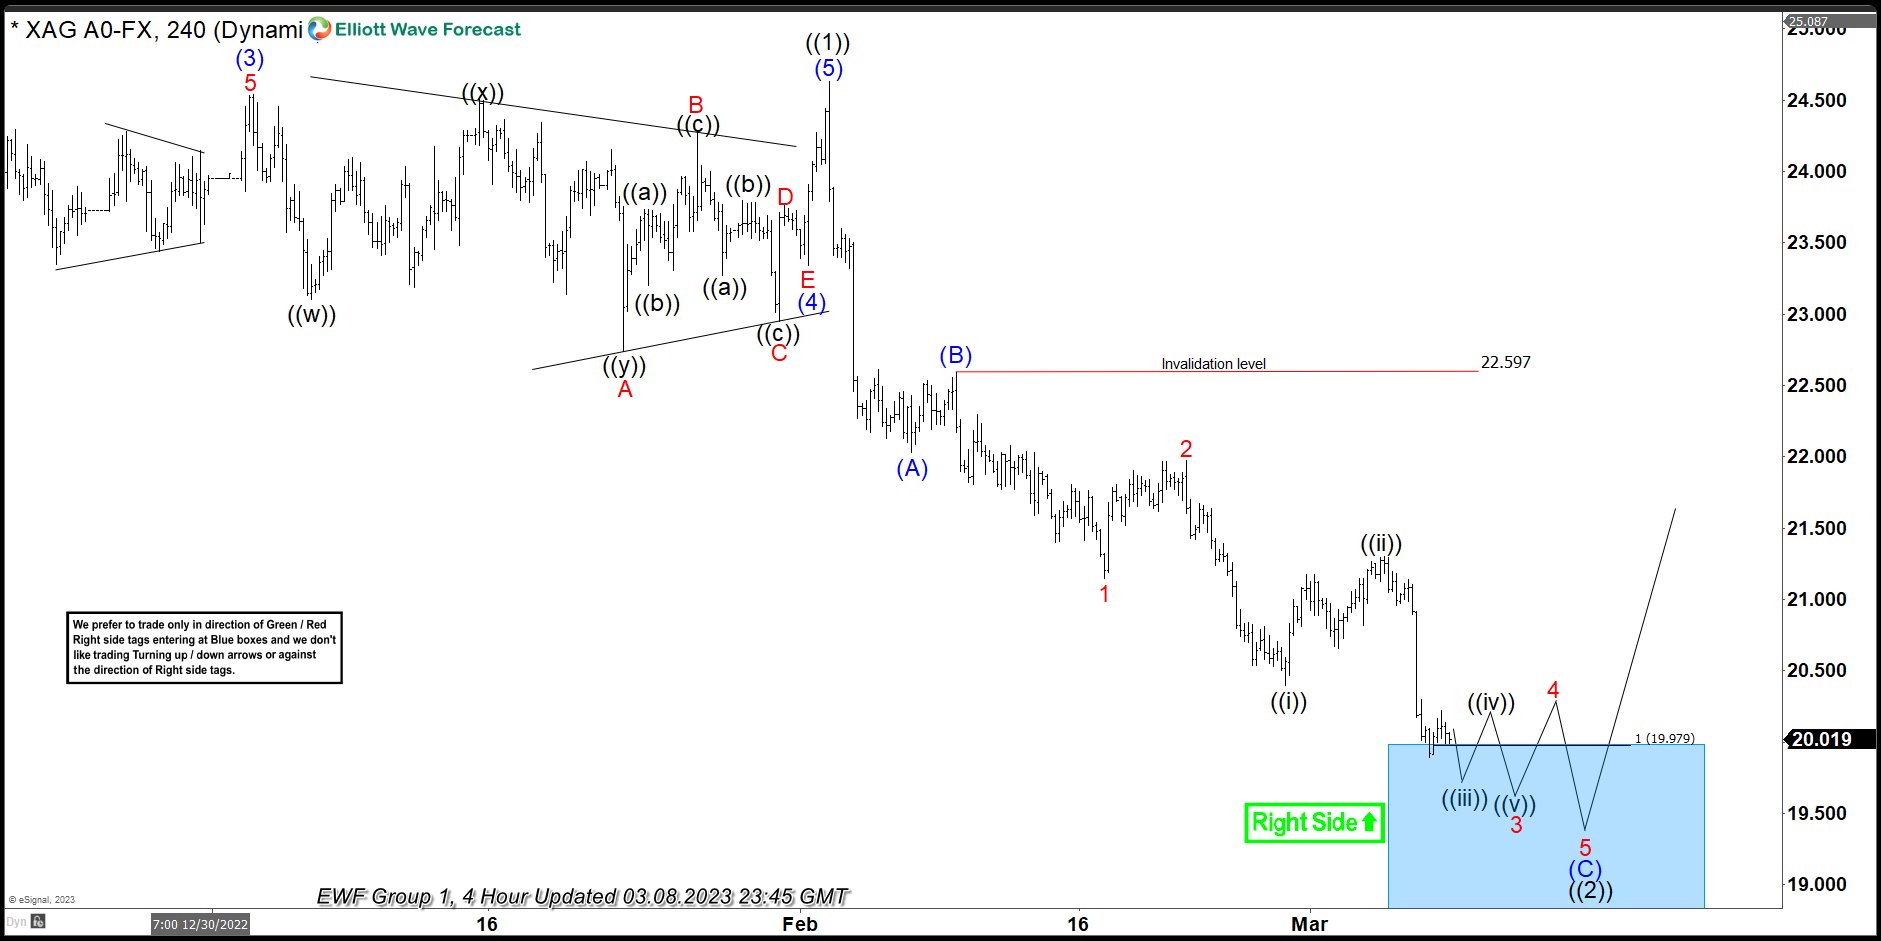
As seen it had reached blue box area between 19.979 – 18.392 area. We like to enter trades at blue boxes and equal legs areas as we get an 85% chance of a minimum 3 waves reaction higher at least. Then we create a risk free position even if the structure may change. From 19.883 it has reacted impulsively higher within wave 1 in which we were expecting to be ending soon higher. Followed then by a 3 waves pullback in wave 2.
Fast forward let’s see how it had developed from this weekend’s 4 hour update.
XAGUSD 4 Hour update 03.18.2023
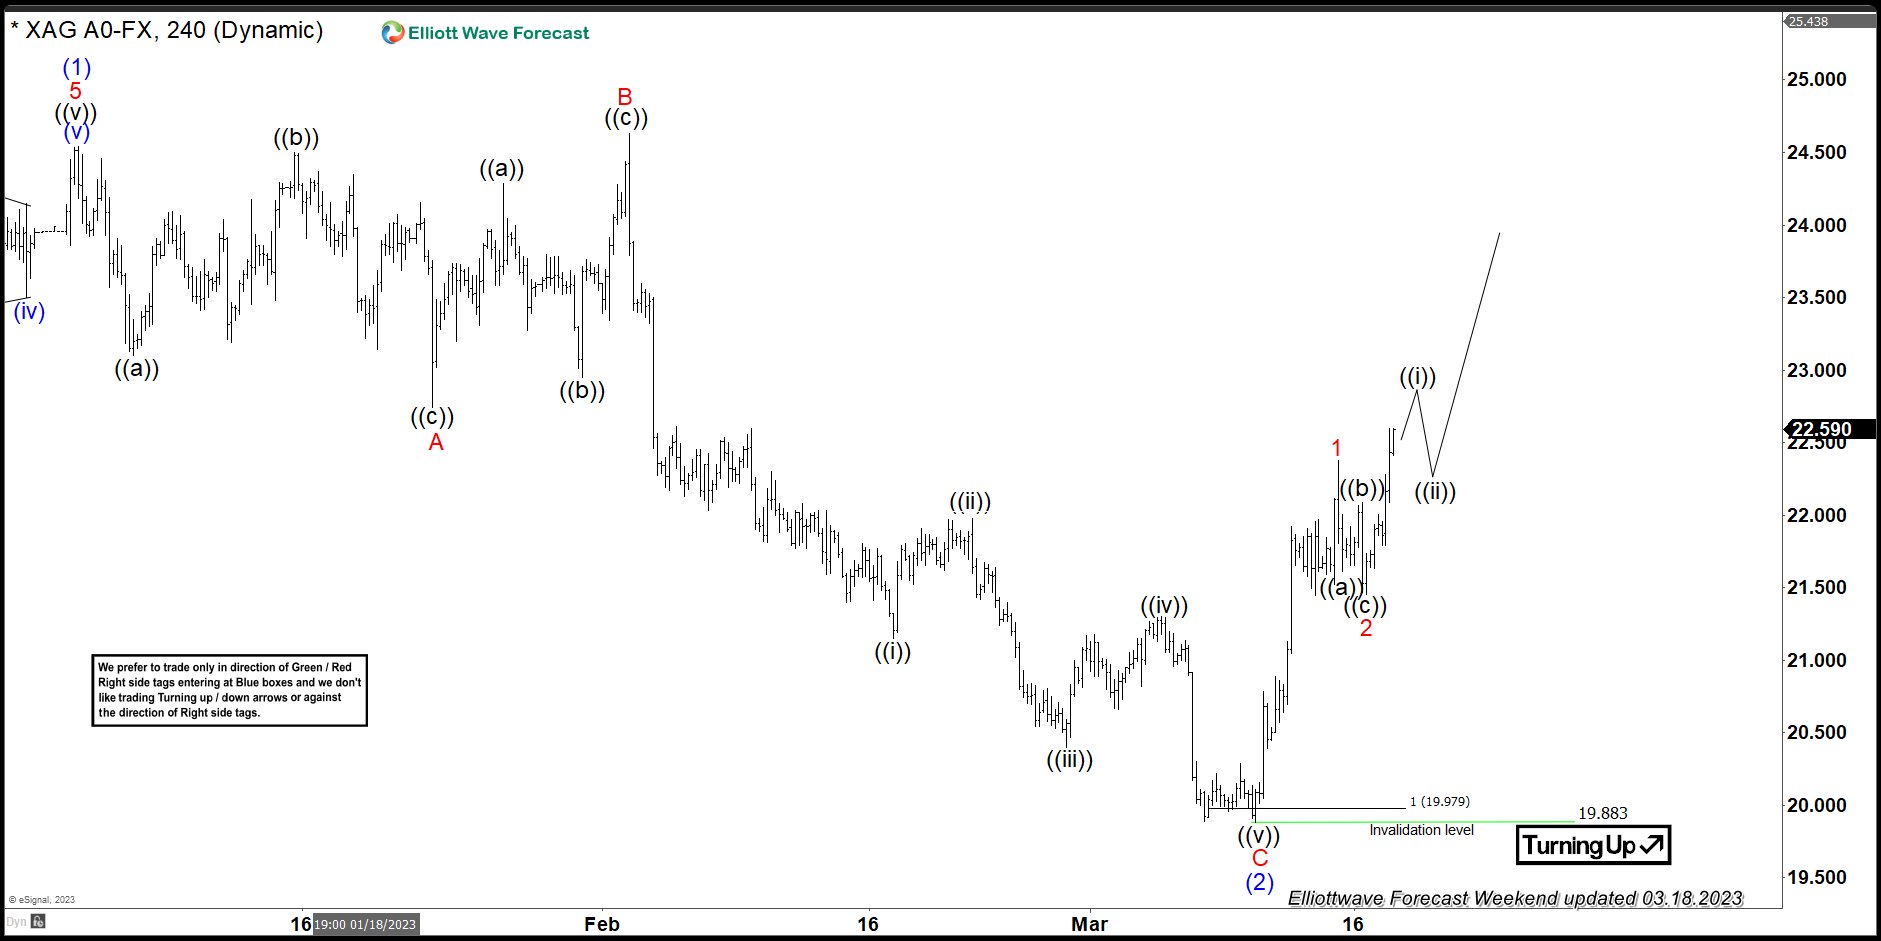
As we can see it had ended wave 1 and pulled back in wave 2 in 3 waves and already reacting higher within wave ((i)) of 3. The degree changed in this case as we are calling wave (2) ended, but overall is the same idea that ended wave 2 from the blue box/equal legs area. It will be very interesting to see the extend in which Silver can accelerate higher as usually wave 3s can be the most powerful wave within a cycle. You can learn what’s next for Silver and how we can see the bigger picture by joining us here at Elliott Wave Forecast. Consider to become a member and improve your trading/investing decisions.
JP225 Cash Index Could See a Sizeable Move Soon
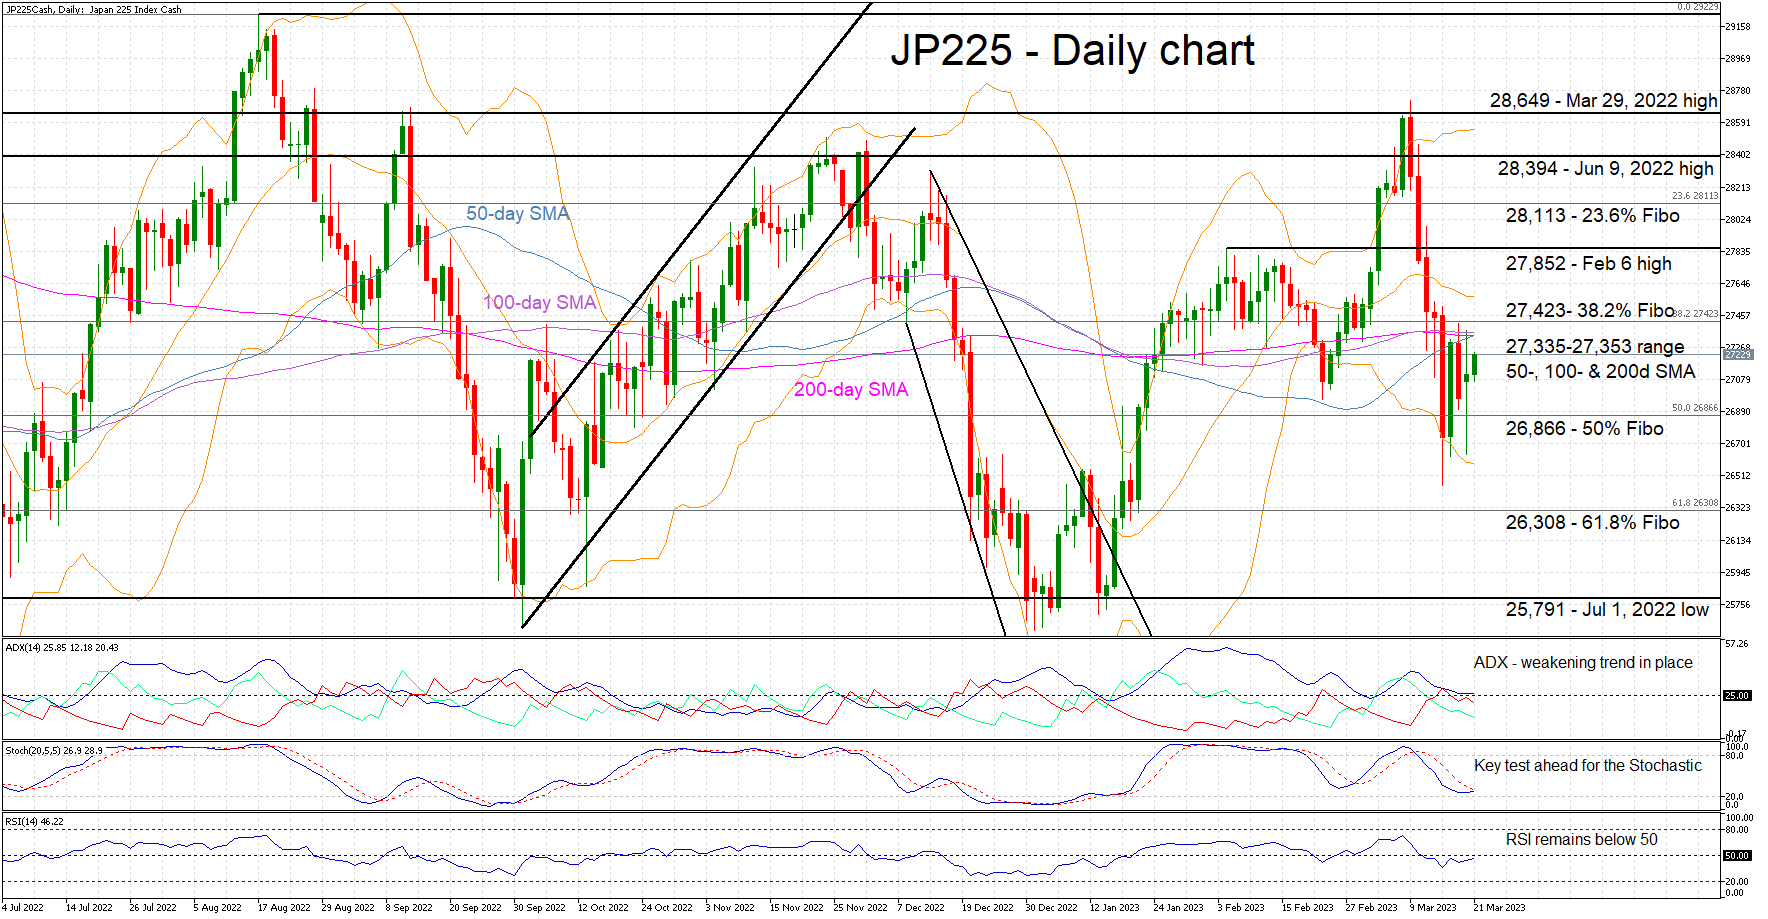
The JP225 cash index is trying to stay in the green as volatility today is lower following a short period of extreme market movements. The index remains below the 38.2% Fibonacci retracement level of the March 8, 2022 – August 17, 2022 uptrend of 27,423. More importantly, there is an impressive convergence of the 50-, 100- and 200-day simple moving averages (SMAs) taking place that, in our book, is a signal for a sizable move coming soon.
The Average Directional Movement Index (ADX) currently appears to follow the SMA convergence signal as it is indeed signaling a muted and weakening bearish move. This could be seen as the basis for a new trend developing soon. With the RSI near its midpoint, the burden falls again on the stochastic oscillator to guide the market. It is currently hovering above its oversold territory and preparing to test the resistance set by its moving average (MA). A failure to break above its MA could be seen as a bearish signal.
If the bulls maintain the market reins, their first target would be at the trifecta of the SMAs at the 27,335-27,353 area. Even higher, the 38.2% Fibonacci retracement at 27,423 could prove tougher to clear, just below the February 6 high of 27,852.
Should the bears regain market control, they would face the 50% Fibonacci retracement level of 26,866. Then, the path would be clear until at the 61.8% Fibonacci retracement at 26,308. Even lower, the busier 25,791 area of the July 1, 2022 low could be targeted next.
To sum up, the JP225 bulls are trying to stage a comeback, but all eyes are on the SMAs convergence.
GBP/USD: Bulls Take a Breather, Awaiting Fed/BOE and UK CPI Data
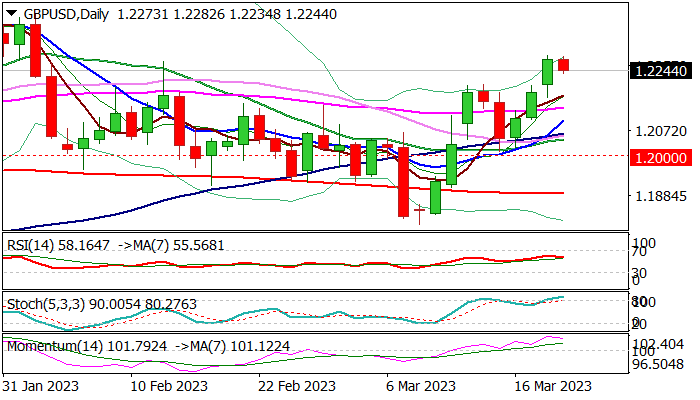
Cable is a tad lower in early Europe on Tuesday, as bulls are taking a breather after strong rally in past three days, which hit the highest since Feb 2.
Overall picture remains bullish, with easing of fears about crisis in banking sector, cautiously reviving risk appetite, however, concerns about the stability of US financial system persist.
Markets focus on UK inflation data on Wednesday and BOE rate decision on Thursday for fresh signals.
UK inflation is expected to ease to 9.9% in February from 10.1% in January, while the Bank of England is likely to raise interest rate by 25 basis points to 4.25%, new highest since 2008.
Fed policy decision on Wednesday will be also closely watched, with wide expectations for 25 basis points hike, though with speculations that the Fed may keep rates unchanged, due to developing crisis in banking sector.
Overbought conditions on daily chart support the notion of consolidation / shallow pullback, as bullish momentum remains strong and moving averages are in bullish setup.
Dips should find solid support at 1.2200 zone (broken Fibo 61.8% of 1.2447/1.1802 / former tops of Mar 13,14), guarding 1.2130 zone (broken 50% retracement / 55DMA).
Caution on break below 1.2100 (rising 10DMA / Fibo 38.2% of 1.0802/1.2284) which would weaken near-term structure and open way for deeper pullback.
Res: 1.2295; 1.2344; 1.2402; 1.2446.
Sup: 1.2200; 1.2130; 1.2100; 1.2045.
USD Struggles to Recover
AUD/USD recoups losses
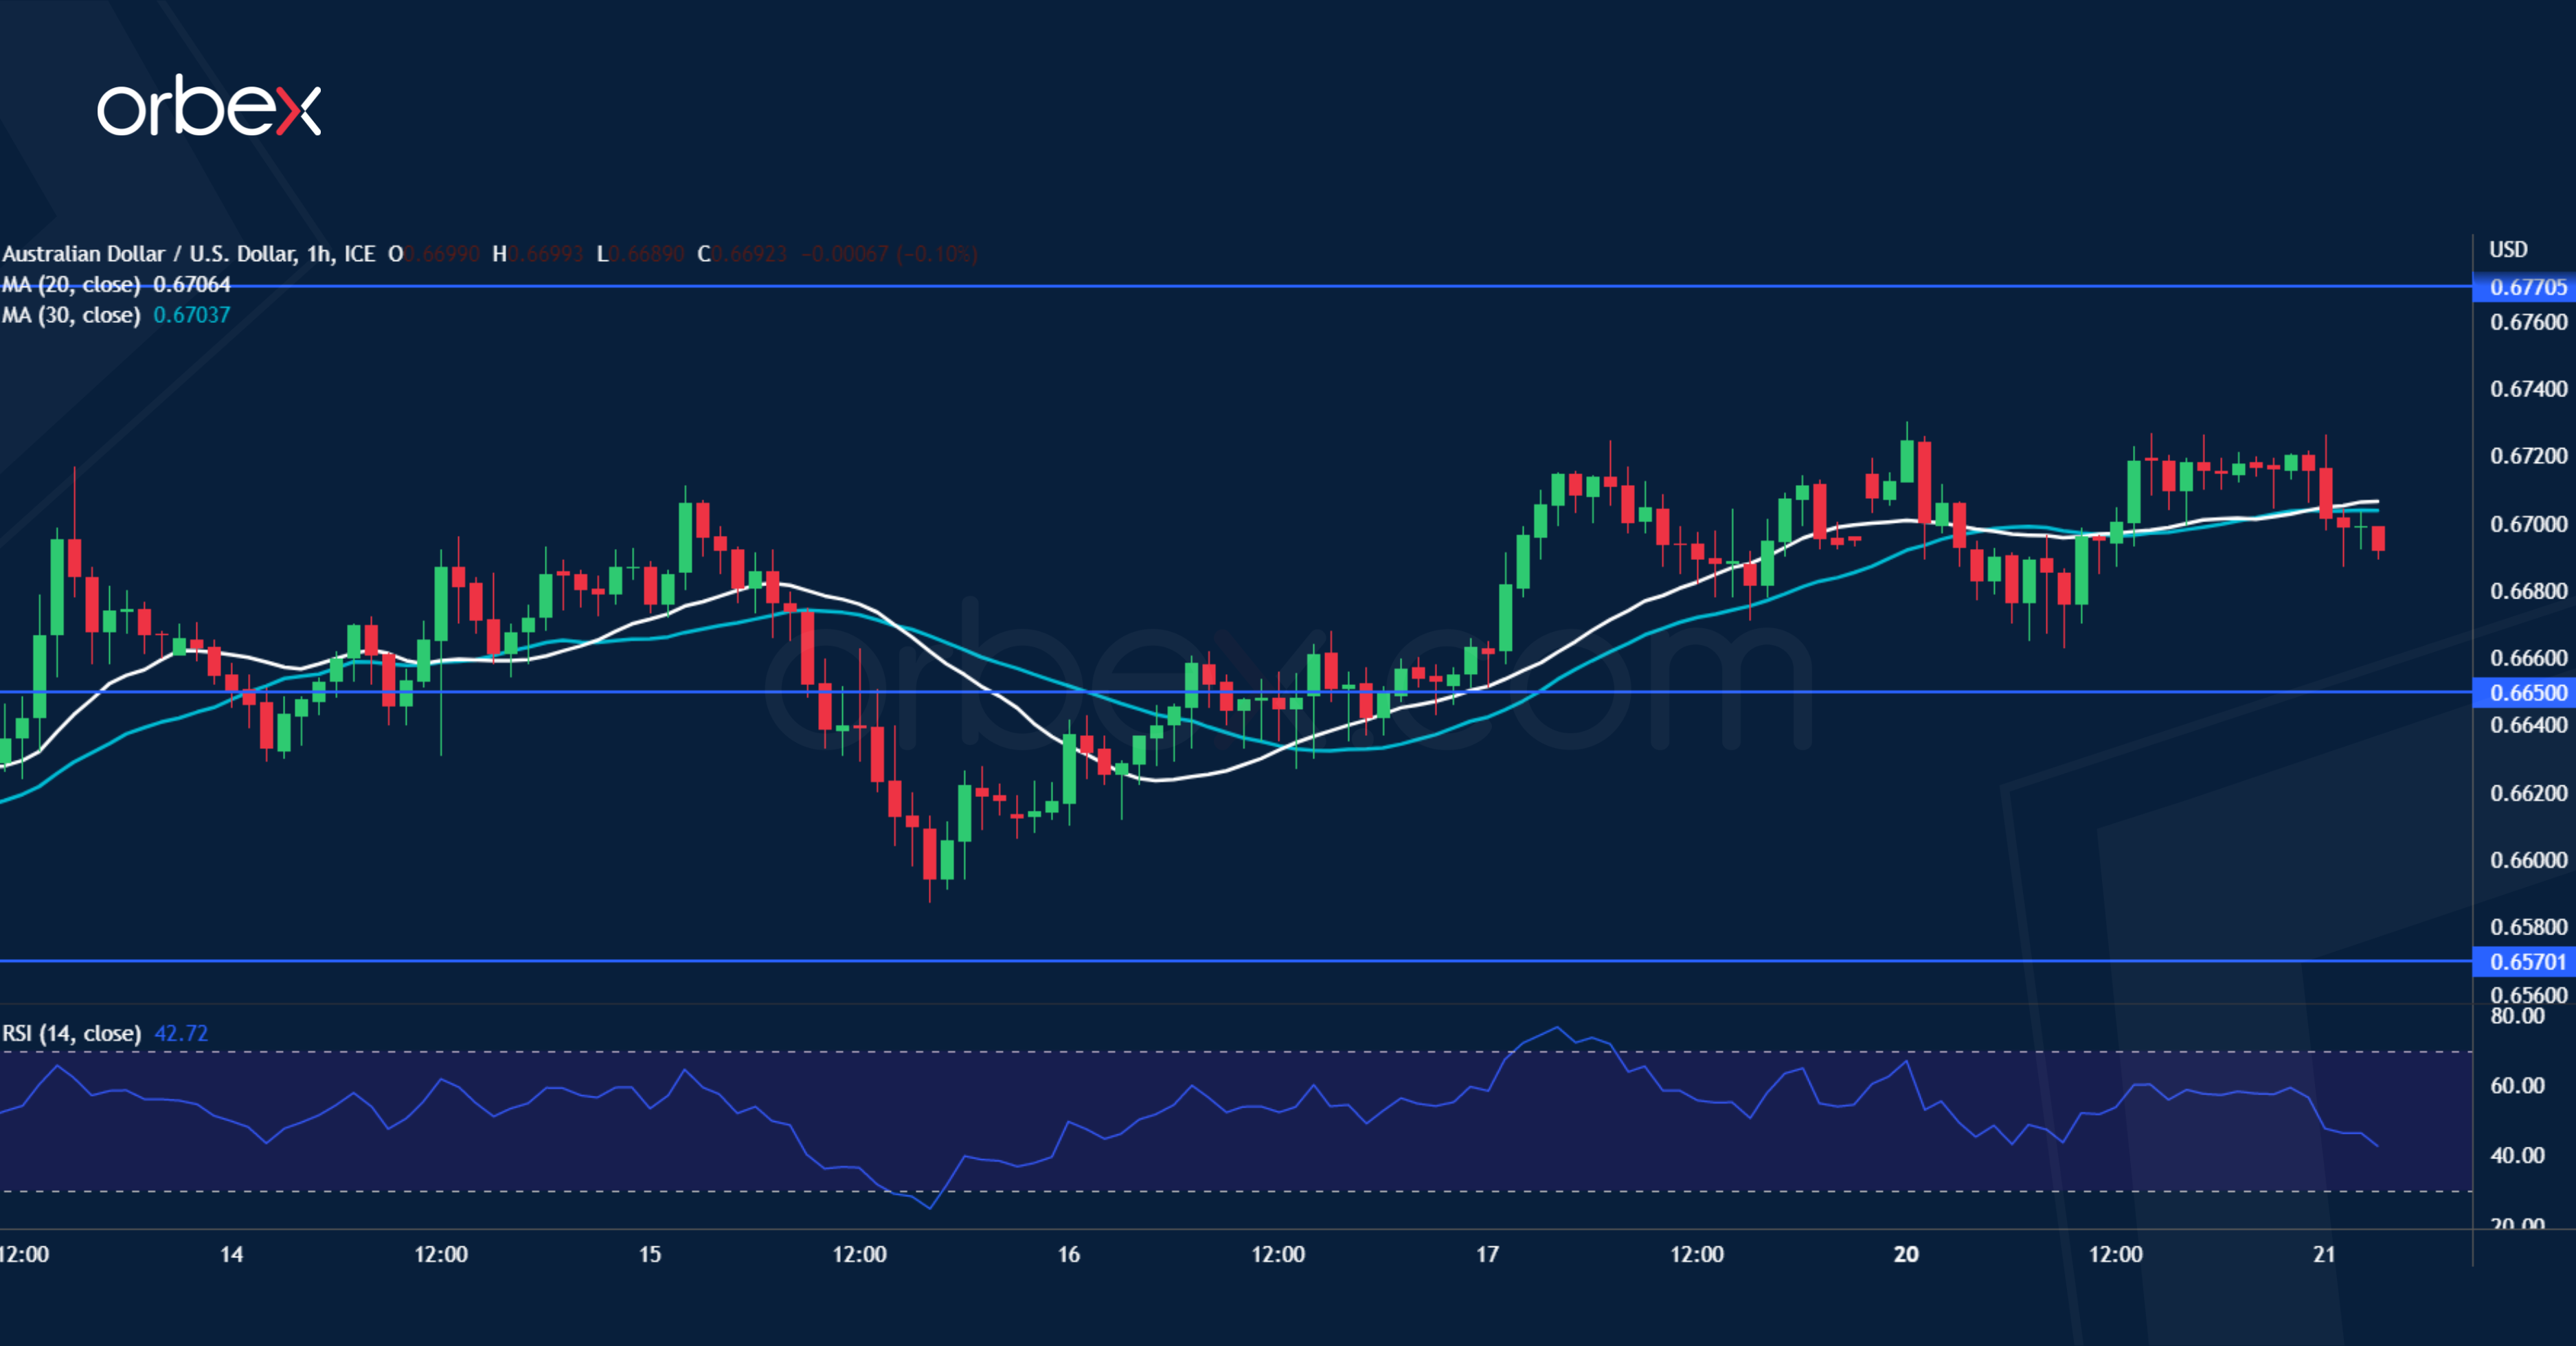
The Australian dollar slid as the RBA minutes showed policymakers may reconsider pausing rate hikes. The selling pressure eased after the pair gained a foothold over 0.6570. A close above last week’s high of 0.6710 reveals interest in keeping the price afloat. The top range of the previous consolidation around 0.6770 is a major resistance and coincides with the 30-day SMA. A bullish breakout could extend the rally towards 0.6900. Otherwise, a drop below 0.6650 would make the aussie resume its downward trajectory.
NZD/USD seeks support
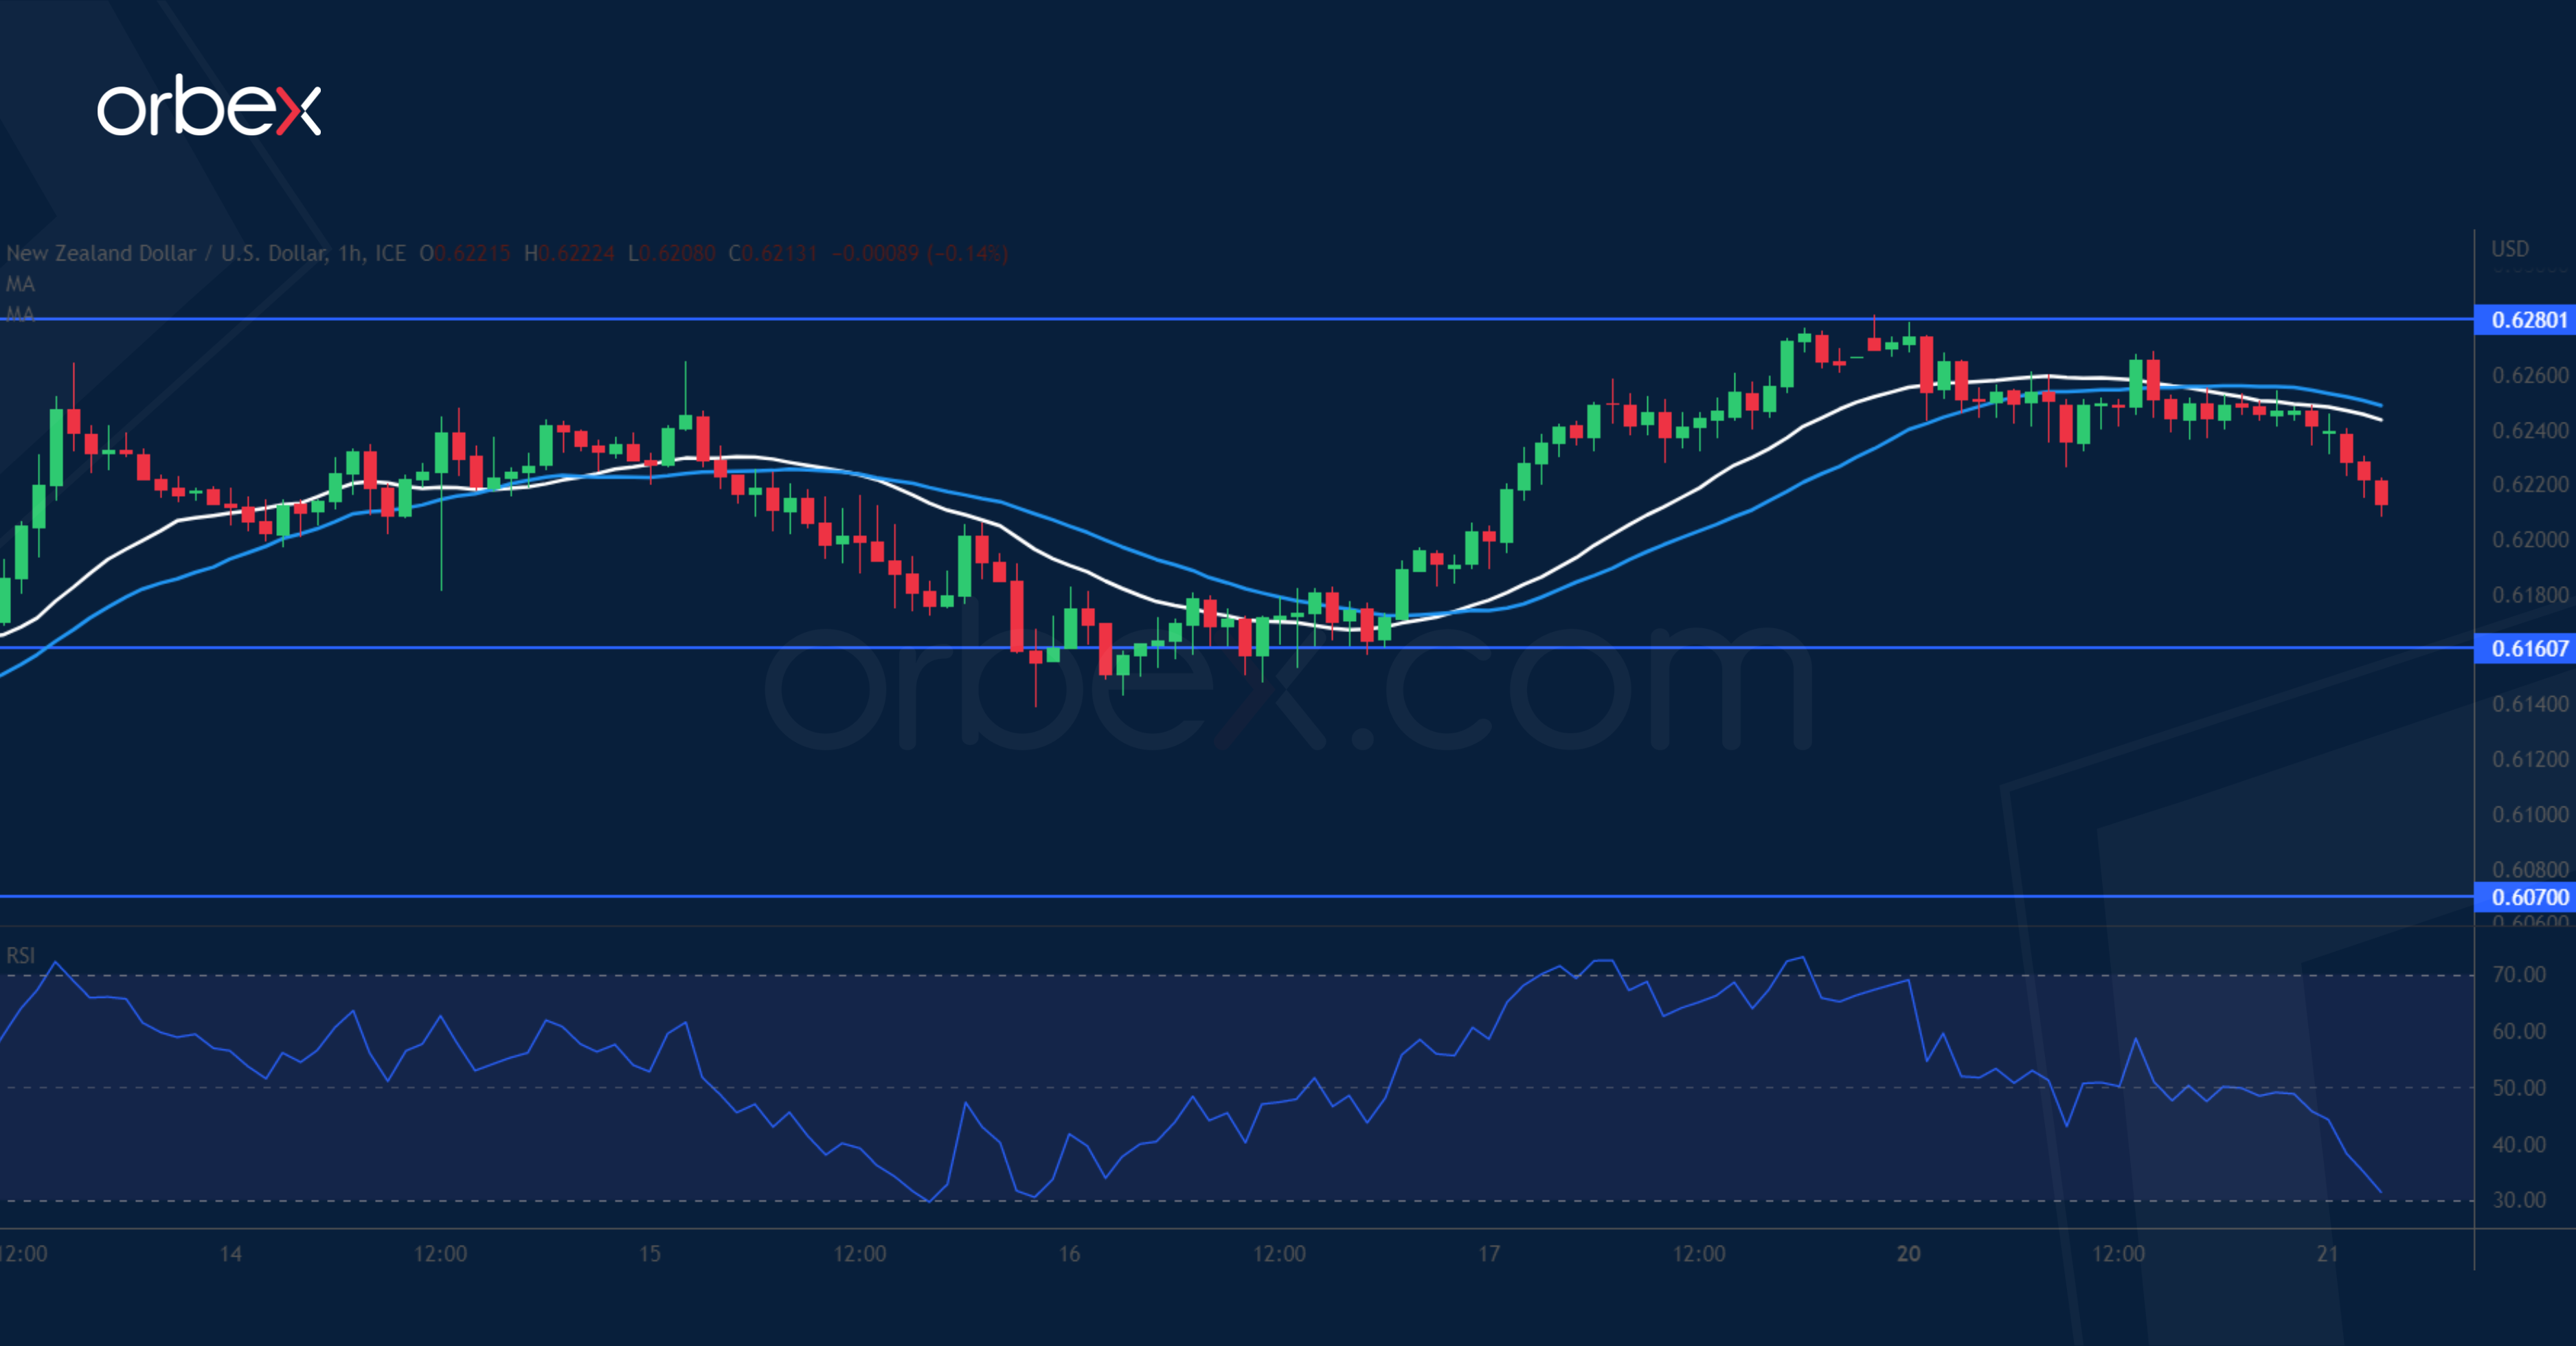
The US dollar retreats as markets stabilise amid the UBS-Credit Suisse rescue deal. A close above the double spike at 0.6260 has forced the remaining sellers to cover their positions, turning the short-term mood around. A temporary retracement may allow the bears to switch sides and offer stronger support. A bounce off the accumulation area above 0.6160 would pave the way for a sustained recovery above 0.6280. This would suggest that the correction from early February on the daily chart could be coming to an end.
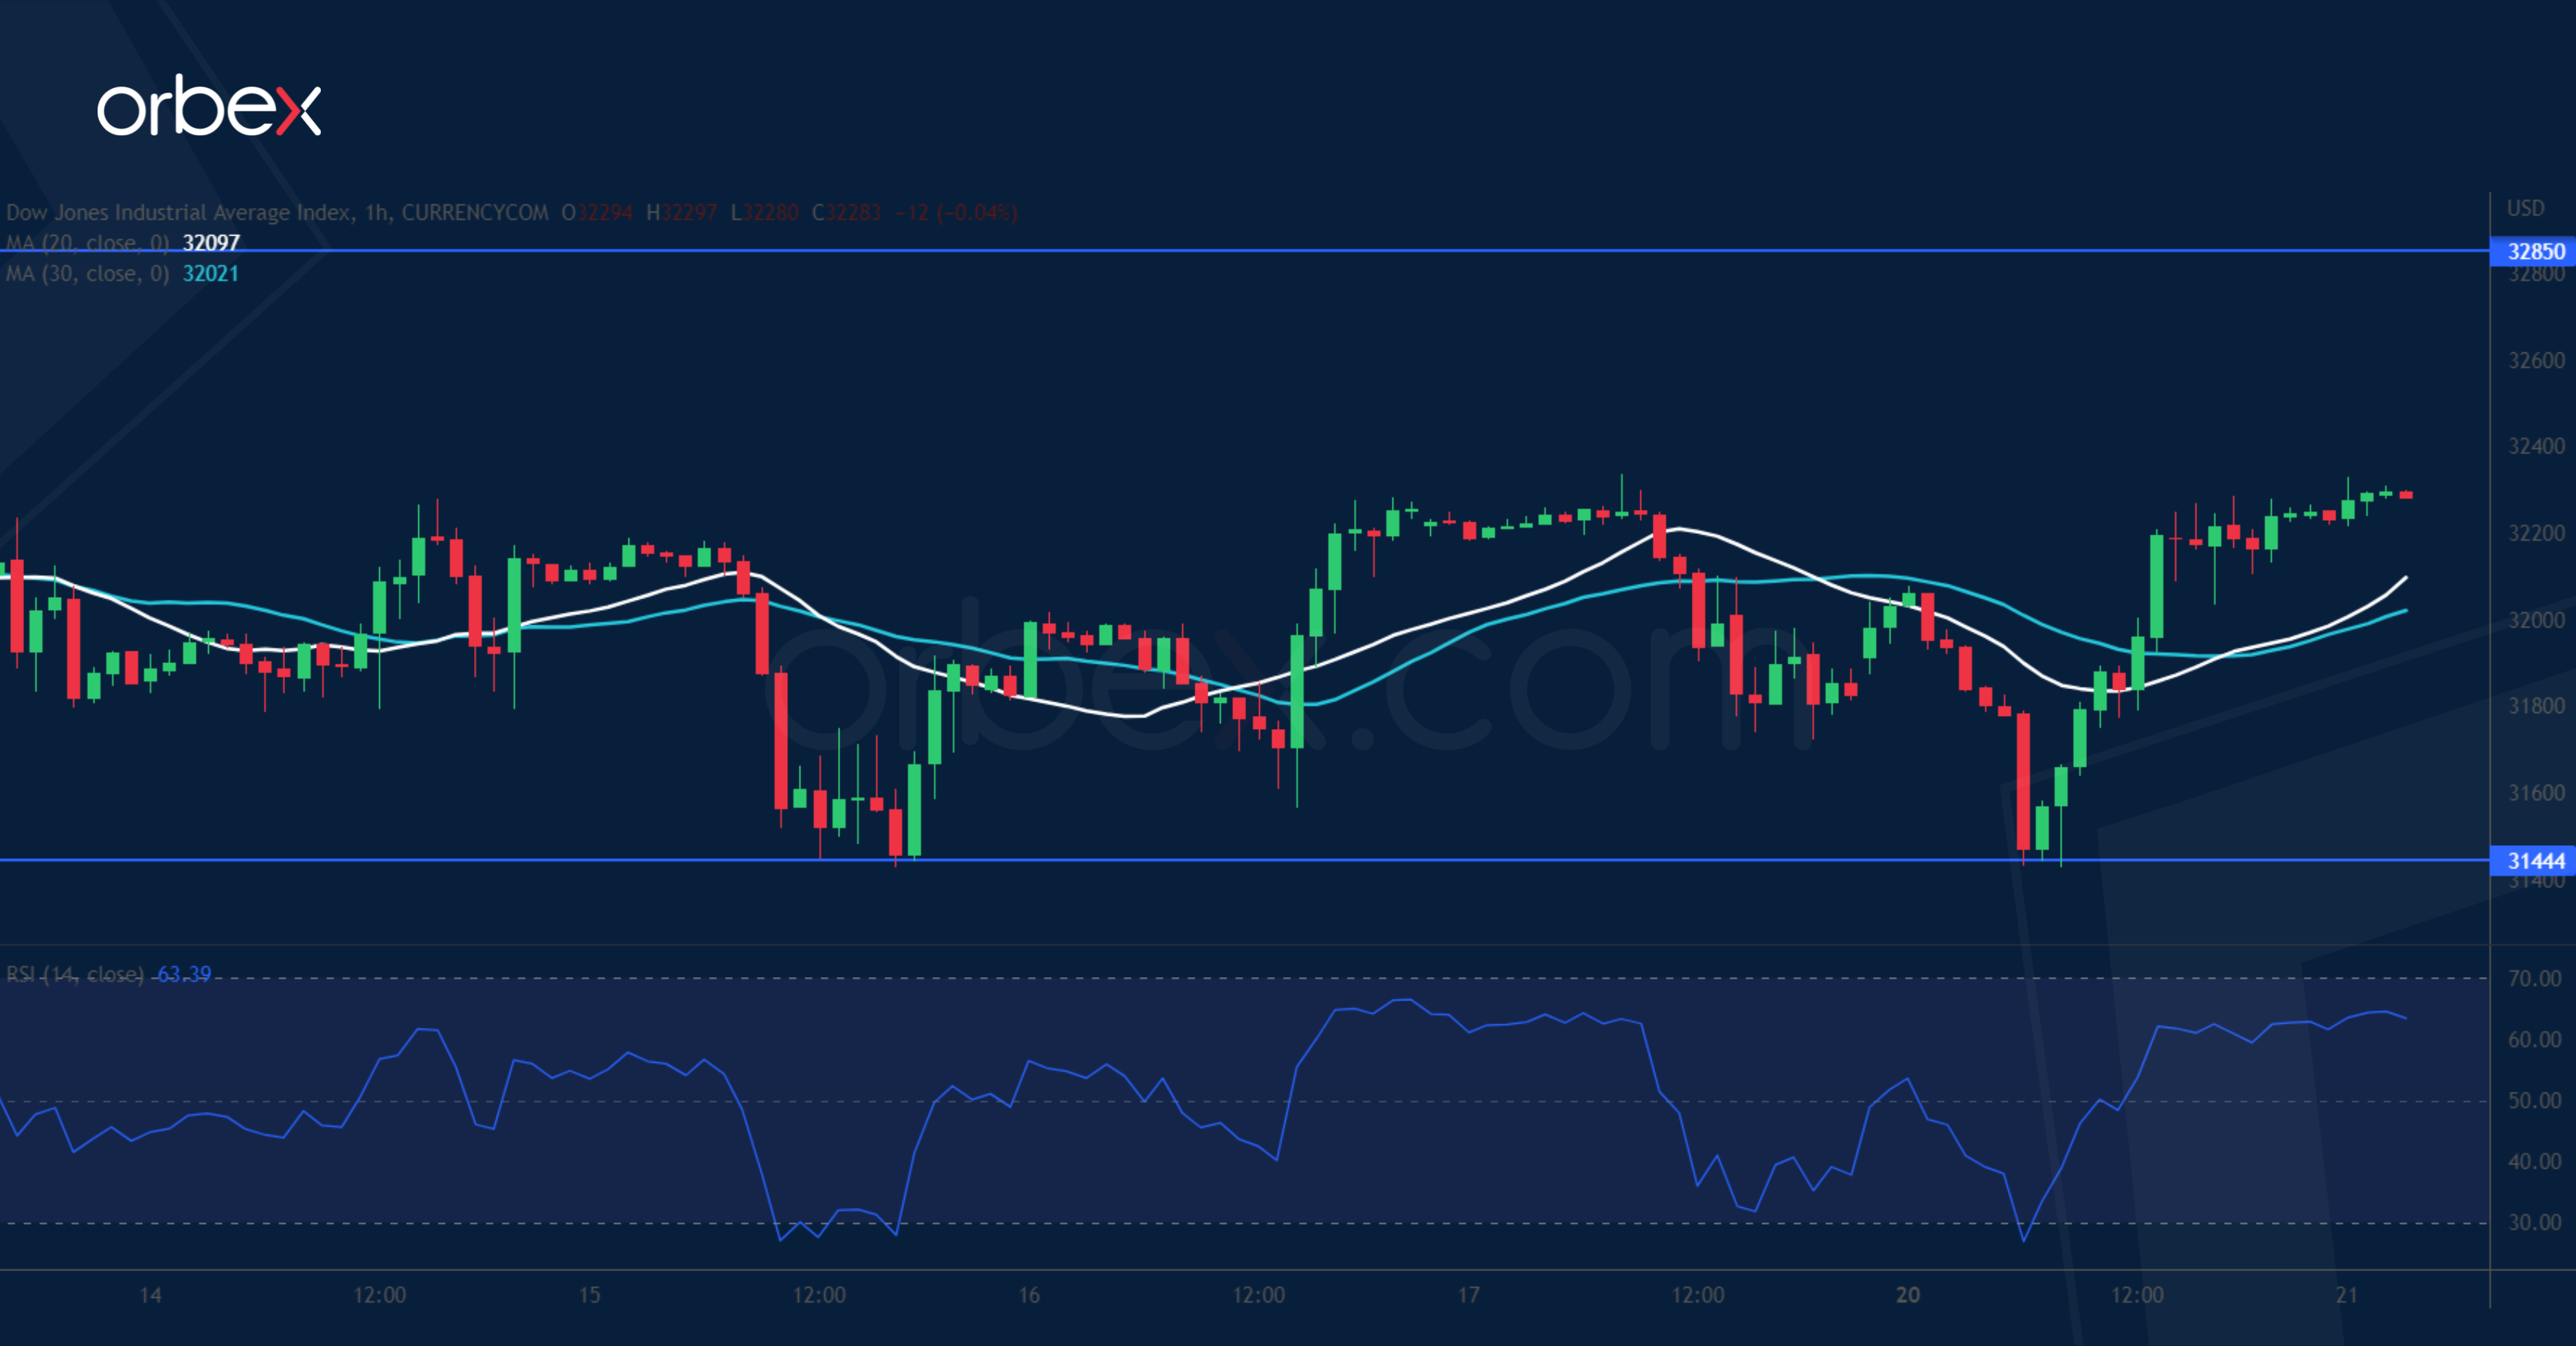
Dow Jones 30 tries to rebound
The Dow Jones 30 clawed back losses as traders raised their bets of a pause from the Fed on Wednesday. A tentative break above 32300 previously took some heat off the index but the bulls are not out of the woods yet. Sentiment would remain cautious unless they manage to lift offers in the supply zone around 32850. Then 33500 would be next if a rebound starts to gain traction. Failing that, the current brief consolidation would be followed by a drop below 31440, opening the door to a deeper correction towards 30200.